Novel Molecular Hallmarks of Group 3 Medulloblastoma by Single-Cell Transcriptomics
←
→
Page content transcription
If your browser does not render page correctly, please read the page content below
ORIGINAL RESEARCH
                                                                                                                                                published: 18 March 2021
                                                                                                                                          doi: 10.3389/fonc.2021.622430

                                              Novel Molecular Hallmarks of
                                              Group 3 Medulloblastoma by
                                              Single-Cell Transcriptomics
                                              Chaoying Qin †, Yimin Pan †, Yuzhe Li , Yue Li , Wenyong Long * and Qing Liu *

                                              Department of Neurosurgery in Xiangya Hospital, Central South University, Changsha, China

                                              Medulloblastoma (MB) is a highly heterogeneous and one of the most malignant pediatric
                                              brain tumors, comprising four subgroups: Sonic Hedgehog, Wingless, Group 3, and
                                              Group 4. Group 3 MB has the worst prognosis of all MBs. However, the molecular and
                                              cellular mechanisms driving the maintenance of malignancy are poorly understood. Here,
                                              we employed high-throughput single-cell and bulk RNA sequencing to identify novel
                          Edited by:          molecular features of Group 3 MB, and found that a specific cell cluster displayed a highly
                          Shouwei Li,
     Capital Medical University, China        malignant phenotype. Then, we identified the glutamate receptor metabotropic 8 (GRM8),
                      Reviewed by:            and AP-1 complex subunit sigma-2 (AP1S2) genes as two critical markers of Group 3 MB,
                     Manjari Pandey,          corresponding to its poor prognosis. Information on 33 clinical cases was further utilized
                 West Cancer Center,
                       United States
                                              for validation. Meanwhile, a global map of the molecular cascade downstream of the MYC
                             Yang Yi,         oncogene in Group 3 MB was also delineated using single-cell RNA sequencing. Our data
              Northwestern University,        yields new insights into Group 3 MB molecular characteristics and provides novel
                       United States
                                              therapeutic targets for this relentless disease.
                  *Correspondence:
                            Qing Liu          Keywords: group 3 medulloblastoma, single-cell sequencing, hallmark, prognosis, molecular cascades
                liuqingdr@csu.edu.cn
                       Wenyong Long
                wylongdr@csu.edu.cn
     †
      These authors have contributed          INTRODUCTION
                 equally to this work
                                              Medulloblastoma (MB) is one of the most prevalent malignant (WHO IV) brain tumors in children,
                    Specialty section:
                                              accounting for 15–20% of pediatric central nervous system tumors (1). Unfortunately, over 40% of
          This article was submitted to       patients with MB are diagnosed with metastases, with a grim median survival (2–4). Multimodal
                   Neuro-Oncology and         therapy, including combination of surgical resection, radiation, and adjuvant chemotherapy, has
              Neurosurgical Oncology,         become a standard for MB, even though approximately one-third of patients with MB die from the
                a section of the journal      disease (5). Thus, the identification of critical regulators that control MB malignance could facilitate
                  Frontiers in Oncology
                                              the development of more effective therapeutics.
         Received: 02 November 2020               Current consensus identifies the existence of four major MB subgroups (Sonic Hedgehog [SHH],
            Accepted: 01 March 2021           Wingless [WNT], Group 3, and Group 4) with different molecular characteristics. Group 3 MB is
           Published: 18 March 2021
                                              refractory to intensive multimodal therapy and displays the worst prognosis. However, the molecular
                             Citation:
     Qin C, Pan Y, Li Y, Li Y, Long W
    and Liu Q (2021) Novel Molecular          Abbreviations: MB, Medulloblastoma; WHO, World Health Organization; GRM8, Glutamate Receptor Metabotropic 8;
Hallmarks of Group 3 Medulloblastoma          MGLUR8, Metabotropic Glutamate Receptor 8; CNS, Central Nervous System; scRNA-seq, Single cell RNA sequencing; PDX,
        by Single-Cell Transcriptomics.       Patient-derived Xenograft; GSVA, Gene Set Variation Analysis; GO/KEGG, Gene ontology/Kyoto Encyclopedia of Genes and
             Front. Oncol. 11:622430.         Genomes; PCR, Polymerase Chain Reaction; RT-Qpcr, Real Time Quantitative Polymerase Chain Reaction; IOD, Integrated
      doi: 10.3389/fonc.2021.622430           option density; GSEA, Gene Set Enrichment Analysis; t-SNE, t-distributed Stochastic Neighbor Embedding.

Frontiers in Oncology | www.frontiersin.org                                         1                                        March 2021 | Volume 11 | Article 622430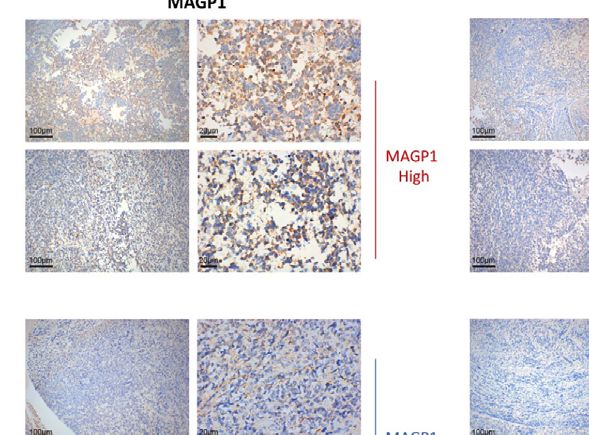
Qin et al.                                                                                          Single-Cell Sequencing in Group 3 Medulloblastoma

characterization of Group 3 MB remains largely unknown, even                analysis (27). According to its matching subtype information,
less than the cells of origin. In contrast to WNT and SHH MBs,              normalized scRNA-seq data of eight patients with Group 3 MB
Group 3 tumors contain fewer nucleotide variants and germline               (MUV11, SJ17, SJ917, SJ617, MUV29, BCH1205, MUV34, and
mutations (6–9). Previous studies demonstrated that a subset of             BCH825) were extracted from the original downloaded scRNA-
Group 3 tumors exhibits overexpression of transcription factors of          seq expression matrix. In total, after removing data with
Qin et al.                                                                                          Single-Cell Sequencing in Group 3 Medulloblastoma

Gene Set Variation Analysis (GSVA) and                                      Forward, CAGTCCCAGCAGCAAGTCCA and Reverse,
GO/KEGG Enrichment Analysis                                                 A A G C A G A C C T C G T T G A G A C A C ; G R M 8: F o r w a r d ,
To compare the enrichment degree of pathways and functions                  ACCTGCATCATTTGGTTAGCTT, and Reverse,
between each cluster, we used a GSVA algorithm, a gene set                  AAACCTTGGGCATATAGAGCA) using SYBR Green PCR
enrichment (GSE) method that estimates the variation of pathway             Master Mix (ThermoFisher Scientific).
activity for microarray and transcriptome data, to calculate the
GSVA score of each cluster on different gene sets (37). For the             Statistical Analysis
calculation of tumor characteristics and pathway enrichment degree,         The correlation coefficient between the IOD area and numerical
input gene sets were obtained from the molecular signature database         variables including age (year), tumor size (mm3), and Ki67 (%)
(MsigDB) (https://www.gsea-msigdb.org/gsea/msigdb). The gene                was separately calculated using the Spearman and Pearson
sets of the KEGG pathway come from the C2 collection (curated               correlation analysis. Random Grouping t-test was used to
gene sets) in MsigDB, and the tumor characteristic gene set comes           assess the relevance between the IOD area and binary clinical
from the H collection (hallmark gene sets) in MsigDB. By comparing          information including sex, cystic change, hydrocephalus, while
the GSVA scores of each cluster, we could compare the relative              one-way ANOVA was used to compare the differences among
enrichment levels of tumor-related pathways or features. In addition,       multi-grouped variables including tumor location. In addition,
the R package “ClusterProfiler” was used to conduct a                        we applied Kaplan-Meier survival analysis and log-ranked test to
hypergeometric distribution test on each cluster’s marker genes to          conduct a survival comparison, where the median value was
perform GO and KEGG annotation (38).                                        implemented to cut the relative genes expression level into high
                                                                            and low Groups. All the above-mentioned statistical analyses were
Protein-Protein Interaction (PPI)                                           conducted using R software (version 3.6.0). All p-values < 0.05
Network Development                                                         were considered statistically significant.
Using the STRING database, a PPI network was developed
according to the marker genes of each cell cluster. We then
utilized Cytoscape to rearrange the PPI network downloaded for              RESULTS
the STRING database according to its interaction characteristic
(39). In Cytoscape, the CytoHubba plug-in was used to calculate             Landscape of Cellular Heterogeneity at
and rank the interaction degree between downstream proteins of              Single-Cell Level Within Group 3 MB
marker genes. Additionally, according to the interaction degree,            Identification of critical cell clusters regulating cancer initiation
we adjusted the color and position of the protein node, turning             and progression may help develop novel and effective strategies
the highest degree node darker and placing it in the center.                to overcome the treatment resistance associated with Group 3
                                                                            MB. Thus, we initially selected the MB single-cell RNA
Immunohistochemistry                                                        sequencing (seq) datasets published in the GEO and finally
Tumor tissues from 33 patients with Group 3 MB were perfused                included one cohort (GSE119926) of 25 tumor samples and 11
with 4% paraformaldehyde and fixed in 10% neutral buffered                   patient-derived xenograft (PDF) models for downstream
formalin mixed with 70% ethanol. Immunohistochemistry                       analysis. According to its matching subtype information,
staining was performed according to protocols from Cell                     normalized scRNA-seq data of eight patients with Group 3 MB
Signaling Technology. The antibodies used for immunostaining                (MUV11, SJ17, SJ917, SJ617, MUV29, BCH1205, MUV34, and
were Anti-MAGP1 (encoded by MFAP2, ab231344, Abcam) and                     BCH825) were extracted from the original scRNA-seq
Anti-MGLUR8 (encoded by GRM8, ab176301, Abcam).                             expression matrix, including a total of six male patients (three
Quantification of mean fluorescence intensity was achieved                    adults and three children) and two female patients (one adult and
using Image-Pro-Plus software.                                              one child) (Figure 1A). A total of 2762 single-cell datasets of the
                                                                            above eight patients were organized into an expression matrix.
Real-Time Quantitative PCR                                                  Data preprocessing was initiated by normalizing the RNA
RT-qPCR was performed using total RNA from the central                      expression of each cell and then removing mitochondrial
tissues of eight (Numbered 1–8) patients with normal brain                  RNAs. All single cells were divided into individual clusters
tissues (1–2), WNT/SHH (3–5), and Group 3 (6–8) MB. Total                   according to their distance distribution after dimensionality
RNA was extracted using TRI Reagent (Molecular Research                     reduction through t-SNE, gene set enrichment analysis, and
Center, Inc.) according to the manufacturer’s protocol, and                 functional annotations such as GSEA and GSVA scores on
cDNA was synthesized using random hexamer and oligo (dT)                    specific cell clusters was performed (Figure 1A). The
primers using Thermo ScriptTM RT-PCR (Invitrogen). The                      normalization for the expression matrix was initiated by
gene-specific primers employed were purchased from the NDT                   calculating the standard deviation of the gene expression in
Corporation. PCR was performed for 40 cycles of 95 °C for 15 s              2762 cells. We selected 2000 sufficient genes with a high
and 60 °C for 30 s. H-actin was amplified as a control (Forward:             standard deviation (Figure 1B). The normalized gene type (n-
ACCCTGAAGTACCCCATCGAG; reverse: AGCACAGCC                                   Feature-RNA), gene counts (n-Count-RNA), and mitochondrial
TGGATAGCAAC). Specific expression of MFAP2 and GRM8                          gene numbers (MT-RNA) of each patient’s tumor cells
in cell lines was established using total RNA obtained from                 (mitochondrial genes were previously removed) were plotted,
tumor tissues and amplified with primers for each one (MAGP:                 revealing that RNA levels in each of the patient’s tumor cells were

Frontiers in Oncology | www.frontiersin.org                             3                                   March 2021 | Volume 11 | Article 622430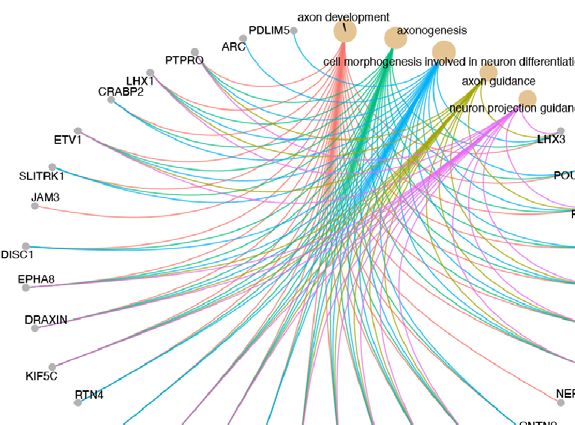
Qin et al.                                                                                                        Single-Cell Sequencing in Group 3 Medulloblastoma

                                    A

                                    B                                                    C

                                                                                          E
                             D

 FIGURE 1 | (A) Overall data analysis process of single-cell transcriptome expression landscape of Group 3 medulloblastoma (MB) (n=8). (B) Genes with top 2000
 standard variance selected for subsequent analysis. (C) Violin plot of RNA features, and RNA counts in patients with MB. (D) Scatter plot of expression level of
 mitochondrial RNA, RNA features and RNA counts. (E) T-distributed stochastic neighbor embedding (t-SNE) plot of Group 3 MB cells revealing 0–8 cell clusters.

expressed in a similar scope without apparent dispersion (Figure                     principle components analysis (PCA) and identification of
1C). Notably, the gene sequencing depth was found to be                              distinct principle components, the representative principle
consistent with the scatter diagram since the relationship                           components were chosen subsequently for unsupervised
between the number of gene types and the number of counts                            clustering process. Finally, we conducted a clustering using t-
was positively correlated (Figure 1D). To further explore the                        distributed stochastic neighbor embedding (t-SNE) and divided
expression feature of the scRNA data, we initially normalized the                    the cells into nine individual cell clusters (Numbered 0–8) with
gene expression matrix and selected characteristic genes with a                      various differentiation features. Finally, we divided the cells into
high standardized deviation for downstream analysis. After                           nine individual cell clusters (Numbered 0–8) with various

Frontiers in Oncology | www.frontiersin.org                                      4                                        March 2021 | Volume 11 | Article 622430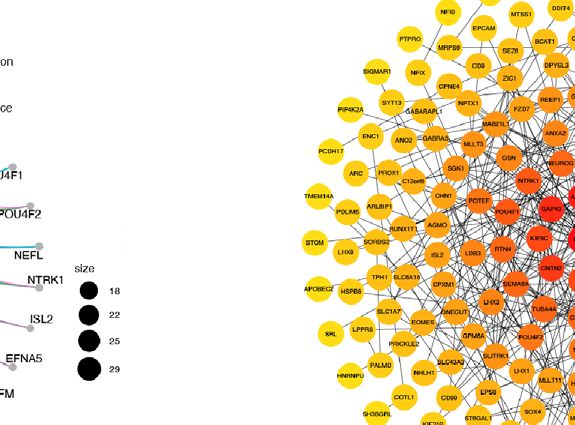
Qin et al.                                                                                                         Single-Cell Sequencing in Group 3 Medulloblastoma

differentiation features (Figure 1E). These data suggest that                         heatmap that showed distinguishable differences in gene expression
Group 3 MB is highly heterogeneous with different cell                                preferences in each cluster. Except for cluster 0, we identified
subgroups and genetic characteristics.                                                significantly upregulated genes in clusters different from each
                                                                                      other, indicating the transcriptional heterogeneity of the nine
Cell Clusters Reflect Transcriptional                                                  clusters (Figure 2A). Then, we performed scatter plots by t-SNE
Heterogeneity and Trajectory                                                          colored by the expression of a single gene in all nine cell clusters.
We next sought to investigate the transcriptional heterogeneity of                    The genes showing the highest expression level in each individual
cells in each cluster by depicting the gene expression profile using a                 cluster were selected for mapping. Consistently, these genes were

                                      A

                            B

                            C                                                                    D

 FIGURE 2 | (A) Heatmap showing the genes differentially expressed in each cluster. (B) t-SNE plots of marker gene expression levels in each cluster. (C) Bubble
 plot depicting the expression level of selected genes in each cluster. Color depth represents average expression level and bubble size the percentage of expression.
 (D) Cell trajectory analysis showing five main cell branches.

Frontiers in Oncology | www.frontiersin.org                                       5                                         March 2021 | Volume 11 | Article 622430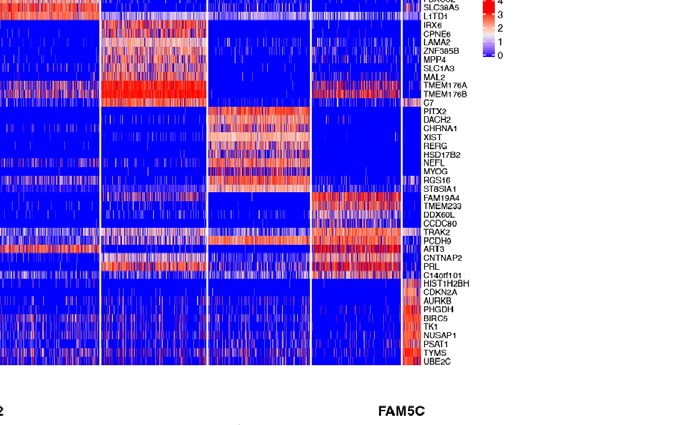
Qin et al.                                                                                            Single-Cell Sequencing in Group 3 Medulloblastoma

only specifically expressed in their own cluster (Figure 2B).                     To depict the detailed annotation of the signaling pathways
Moreover, the bubble graph was also plotted to further identify              involved in cluster 6, we then performed GO enrichment analysis
the genes that were most upregulated. Notably, the bubble color              for the marker genes of the six clusters, and suggested that the
refers to the average gene expression in all cells of each cluster,          most active pathways were neuron- and axon-related, such as
whereas bubble size represented the gene expression percentage in            axon development, axonogenesis, cell morphogenesis involved in
the cluster. The top genes containing the highest level of the above         neuron differentiation, axon guidance, neuron projection
two criteria in each cluster were emphasized with a large size and           guidance, and regulation of neuron projection development.
darker color (Figure 2C). Due to transcriptional heterogeneity               Meanwhile, genes associated directly or indirectly to these
among the nine cell clusters, we speculated that single-cell RNA-            signaling pathways were shown (Figures 4A, B). The main
seq may uncover the heterogeneity of biological features correlated          pathways for KEGG enrichment in cluster 6 were also
with MB formation. To test our hypothesis, the R package Monocle             analyzed. Interestingly, the top pathways obtaining the highest
was adopted to conduct a time-series analysis of the single-cell             scores were tumor- or cancer-related, corresponding to previous
expression data to address this point. We ordered every cell in              observations. For example, transcriptional misregulation in
pseudo-time and arranged them along a trajectory corresponding to            cancer, hepatocellular carcinoma, gastric cancer, and the WNT
a biological process such as cell differentiation, without knowing in        signaling pathway. We also plotted a heatmap of the genes
advance which gene determines that progress (36). Each cell of the           related to these pathways (Figures 4C, D). These findings
nine clusters was arranged into a branching line according to the            supported our hypothesis that cluster 6 cells were responsible
sequence of the biological process (Figure 2D). We observed that             for the tumorigenic character of Group 3 MB. To gain insight
cluster 6 (colored blue) was relatively isolated at the beginning of a       into downstream protein interaction and cascades, we
differentiation tree at point “A,” indicating that cell cluster 6 may        constructed a PPI network according to cluster 6 marker genes
play a key role in cancer initiation and progression.                        by using the STRING database. We then utilized Cytoscape to
                                                                             rearrange the PPI network downloaded for the STRING database
Annotation of the Tumorigenesis Featured                                     according to its interaction characteristic (39). In addition,
Cluster and Its Downstream Cascades                                          according to the interaction degree, we adjusted the color and
With regards to the aforementioned feature of cluster 6, we next             position of the protein by turning the highest degree node darker
sought to verify its exclusive tumorigenesis feature among the               and placing it in the center of the map. Importantly, our data
nine cell clusters. To compare the enrichment degree of                      showed that MYC had the highest degree of interaction among
pathways and functions among each cluster, we used the                       all marker genes in cluster 6, consistent with the previous
GSVA and GSE methods to estimate the variation in pathway                    findings that amplification of the MYC oncogene is the most
activity from microarray and transcriptome data, to calculate the            common genetic alteration in patients with Group 3 MB (Figure
GSVA score of each cluster on different gene sets (37). For the              4E). Together, our findings indicated that cluster 6 drives
calculation of tumor characteristics and pathway enrichment                  malignancy in Group 3 MB with MYC positivity.
degree, the input gene sets were obtained from the molecular
signature database (MsigDB). Among them, the KEGG pathway                    Identification of Novel Hallmarks
gene sets derived from the C2 collection (curated gene sets)                 in Group 3 MB
(Figure 3A). Further, we performed a violin plot by selecting the            Given the stepwise dissection of cluster 6 in Group 3 MB, the
pathways demonstrating specific up- or down-regulation in                     malignance signature of this cluster became relatively clear. We
cluster 6 compared to the others, quantified by the GSVA                      selected a set of microarray data from a cohort consisting of
score. The degree of enrichment of cluster 6 in some tumor-                  common pediatric malignant brain tumors containing 15 pilocytic
related pathways was significantly higher than that of the other              astrocytomas, 46 ependymomas, 20 glioblastomas, 22 MBs, and 13
clusters, such as cell adhesion molecules cams, and arginine and             non-tumor brain control samples obtained from epilepsy surgery to
proline metabolism for metastasis of tumors (40). Nevertheless,              generate the bulk transcriptional dataset for differential expression
in immune-related pathways such as antigen procession and                    analysis (34) (Figure 5A). We performed a variation analysis with
presentation, and natural killer cell mediated cytotoxicity which            normalized microarray data of this mixed pediatric tumor cohort to
have been correlated to antitumor cytotoxicity, the enrichment               compare the expression level of cluster 6 marker genes in variant
was significantly lower (Figure 3B). Consistently, tumor                      tumor types and normal brain, and found that 54 genes in total
characteristic genes set from H collection (hallmark gene sets)              showed specific upregulation either in one tumor type or in the
in MsigDB (Figure 3C) revealed that the degree of enrichment of              normal brain (Figure 5A, Supplementary Materials). Notably,
cluster 6 in MYC targets V1/V2 was remarkably higher than that               some genes were specifically upregulated in MB, consistent with
of other clusters identified as critical for Group 3 MB. The                  their high expression in Group 3 MB in our previous analysis.
enrichment of antitumor cytotoxicity in cluster 6, such as                   Meanwhile, another cohort of 763 patients with MB was included to
interferon alpha response and interferon gamma response,                     conduct a Kaplan-Meier survival analysis on the marker genes of
were much lower than those of other clusters (Figure 3D).                    cluster 6. In total, 20 genes correlated with the survival of patients
Collectively, these results demonstrated the pivotal role of                 with MB. By combining these results, 10 genes showed significant
cluster 6 in the malignant behavior of Group 3 MB and were                   differences of either expression levels or survival analysis, including
marked for further validation.                                               TUBB4A, TSHZ1, SLITRK1, POU4F1, MPHOSPH6, MFAP2,

Frontiers in Oncology | www.frontiersin.org                              6                                    March 2021 | Volume 11 | Article 622430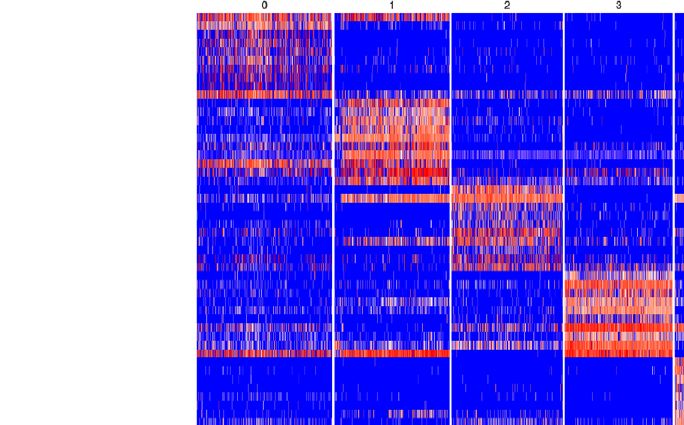
Qin et al.                                                                                                      Single-Cell Sequencing in Group 3 Medulloblastoma

                          A                                               B

                                                                                                       C

                                                                                                           D

 FIGURE 3 | (A) Heatmap showing the gene set variation analysis (GSVA) scores of each cell cluster in the KEGG pathway. (B) Violin plot depicting the GSVA score
 of specific KEGG pathways in each cell cluster. (C) Same as A in H collection in molecular signature database (MsigDB). (D) Same as B in H collection in MsigDB.

KIF5C, GRM8, CCND2, and AP1S2 (Figure 5A). Among them,                              prognosis; hence, these five genes were initially identified as
TSHZ1, MFAP2, GRM8, CCND2, and AP1S2 showed dramatically                            potential hallmarks of Group 3 MB.
higher expression levels in MB than other tumors and the normal
brain (Figure 5B). Of note, the prognosis of the patients highly                    GRM8 and AP1S2 Are Hallmarks
expressing TSHZ1, GRM8, CCND2, AP1S2 was poorer than low                            Indicating Poor Prognosis of Patients
expressing patients, while only MFAP2 showed an adverse                             With Group 3 MB
correlation between its gene expression and prognosis (Figure                       Based upon the stepwise bioinformatic analysis with single-cell
5C). Taken together, these data indicate that some marker genes                     and bulk datasets, we narrowed down the pool of Group 3 MB’s
in cluster 6 were truly upregulated in Group 3 MB and affected its                  potential hallmarks. However, for further validation a biochemical

Frontiers in Oncology | www.frontiersin.org                                     7                                        March 2021 | Volume 11 | Article 622430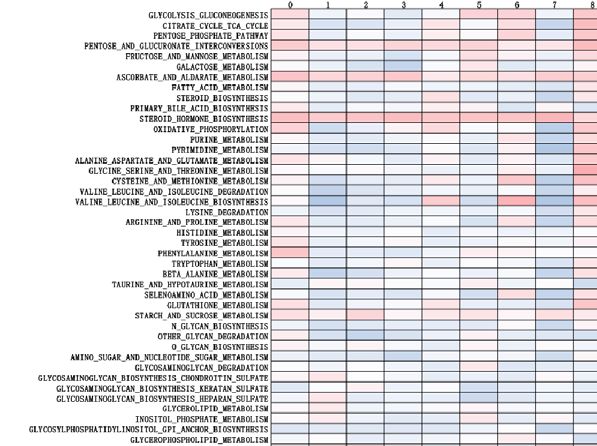
Qin et al. Single-Cell Sequencing in Group 3 Medulloblastoma
A
B
C
D E
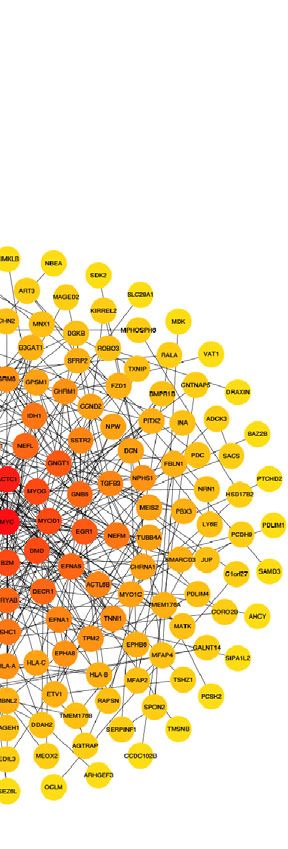
FIGURE 4 | (A) GO annotation of cluster 6. (B) Gene net plot showing the common genes in multiple GO entries. (C) Heatmap showing the genes involved in each
pathway. 6. (D) KEGG annotation of cluster 6. (E) Protein-Protein Interaction network of marker genes in cluster 6, where the node with the highest degree of
interaction is darker and located in the center.
verification was needed; therefore, we performed quantitative PCR MFAP2, GRM8, and AP1S2. Then, with samples of 33 patients
with samples from two normal brain tissues obtained from pathologically diagnosed with Group 3 MB, we performed
epilepsy surgery (Numbered 1 and 2), three WNT/SHH MBv immunohistochemistry (IHC) staining to test the expression
(Numbered 3–5), and three Group 3 MB (Numbered 6–8) to test level of MAGP1 encoded by MFAP2, MGLUR8 encoded by
the gene expression levels of TSHZ1, MFAP2, GRM8, CCND2, GRM8, and AP1S2 encoded by AP1S2 in each patient, aiming
and AP1S2. Among them, MFAP2, GRM8, and AP1S2 were to combine clinical data with gene regulation for analysis. The
highly expressed in patients 6, 7, and 8, diagnosed with Group 3 heatmap of the “IOD/Area” of each gene was plotted (Figure 6B).
MB through pathological tests (Figure 6A), while TSHZ1 and By implementing the median value of “IOD/Area,” 33 patients
CCND2 did not exhibit the same expression trends were divided into high and low groups, respectively. Consistently,
(Supplementary Materials). This result supported the Kaplan-Meier survival analysis indicated that GRM8 and AP1S2
provisional exclusion of these two genes and to focus on expression was negatively correlated with prognosis (Figure 6C),
Frontiers in Oncology | www.frontiersin.org 8 March 2021 | Volume 11 | Article 622430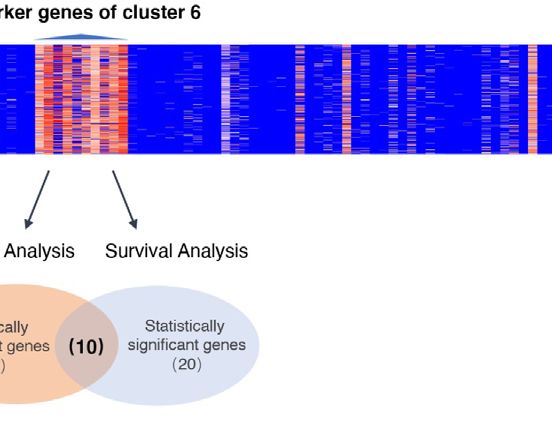
Qin et al.                                                                                                     Single-Cell Sequencing in Group 3 Medulloblastoma

                                              A

                       B                                                            C

 FIGURE 5 | (A) Diagram of the screen process of Kaplan-Meier survival and variation analyses for the marker genes of cluster 6 with two cohorts of microarray
 data. Fifty-four genes showed specific upregulation in one tumor type or normal brain. Twenty genes exhibited correlation with the survival of patients with
 medulloblastoma (MB). Ten genes contained significant differences of either expression or survival analysis, including TUBB4A, TSHZ1, SLITRK1, POU4F1,
 MPHOSPH6, MFAP2, KIF5C, GRM8, CCND2, and AP1S2. (B) Box plot of variant analysis of microarray data of the MB patient cohort grouped showing expression
 levels of TUBB4A, TSHZ1, SLITRK1, POU4F1, MPHOSPH6, MFAP2, KIF5C, GRM8, CCND2, and AP1S2 in various brain tumors and normal brain. NT, normal
 tissue; MB, medulloblastoma; EM, ependymoma; Pa, pilocytic astrocytoma; GBM, glioblastoma. (C) Kaplan-Meier survival curve of microarray data of the MB patient
 cohort grouped by TUBB4A, TSHZ1, SLITRK1, POU4F1, MPHOSPH6, MFAP2, KIF5C, GRM8, CCND2, and AP1S2 expression level. Data are mean ± s.e.m.
 *P ≤ 0.05; **P ≤ 0.01; ***P ≤ 0.001; ****P < 0.0001; NS, not significant (P > 0.05).

Frontiers in Oncology | www.frontiersin.org                                     9                                       March 2021 | Volume 11 | Article 622430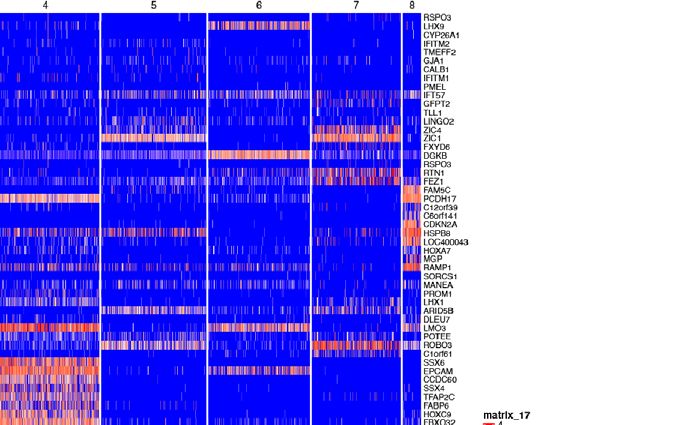
Qin et al. Single-Cell Sequencing in Group 3 Medulloblastoma
A
B
C
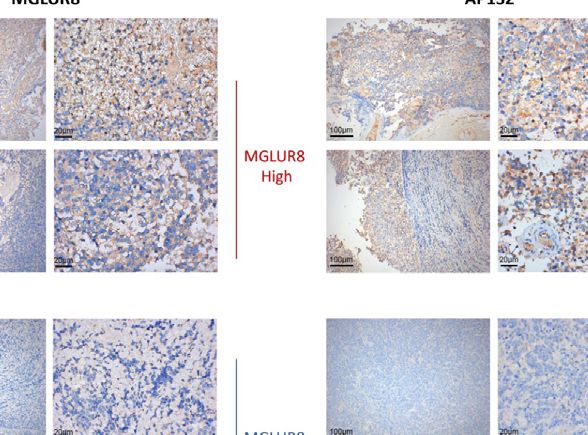
FIGURE 6 | (A) GRM8, AP1S2, and MFAP2 mRNA levels of two normal brain tissue obtained from epilepsy surgery (Numbered 1 and 2), three Wingless/Sonic
Hedgehog medulloblastoma (MB) (Numbered 3–5), and three Group 3 MB (Numbered 6–8). H-actin was used as the endogenous reference gene. The expression
level is presented with graphs. (B) Heatmap of Immunohistochemistry staining with (GRM8 encoding), (AP1S2 encoding), and (MFAP2 encoding) antibodies for the
33 Group 3 MB. Protein IOD/Are is represented by the indicated color. (C) Images of immunohistochemistry staining showing high and low expression of MGLUR8
(GRM8 encoding), AP1S2 (AP1S2 encoding), and MAGP1 (MFAP2 encoding) in the series of Group 3 MB patients (10X and 40X magnification). Kaplan-Meier
survival curve of the 33 patients with Group 3 MB grouped by expression level of GRM8, AP1S2, and MFAP2 encoding. Data are mean ± s.e.m. ****P < 0.0001;
NS, not significant (P > 0.05).
which demonstrated that these two genes were specific indicators deeper association of tumor phenotypes with the genetic
of poor diagnosis of Group 3 MB. However, with respect to hallmarks. However, most correlation coefficients were not
MFAP2, the protein level was not significantly correlated with statistically significant for GRM8, MFAP2, and AP1S2
prognosis in our 33-patient series. Next, we collected detailed (Supplementary Tables 1–3). Therefore, our study identified
clinical data of the 33 patients in addition to postoperative survival GRM8 and AP1S2 as two key regulators of Group 3 MB
time, such as sex, age, tumor cystic change, hydrocephalus, malignancy, which could serve as important biomarkers for
location of tumor body, tumor size, and Ki67 (%), to explore the Group 3 MB diagnosis and therapeutics.
Frontiers in Oncology | www.frontiersin.org 10 March 2021 | Volume 11 | Article 622430Qin et al. Single-Cell Sequencing in Group 3 Medulloblastoma
DISCUSSION cysteine and de novo cysteine generation (45). Moreover,
RNA polymerase (pol) III transcription contributes to the
Despite intensive conventional post-surgery treatments, half of regulation of the cell’s biosynthetic capacity, and a direct link
the patients with Group 3 MB die from recurrent disease. MYC exists between cancer cell proliferation and deregulation
amplification and overexpression is known to play a vital role in of RNA pol III transcription (46). Further studies on the
maintaining the malignancy of Group 3 MB; however, an metabolism in Group 3 MB are warranted.
incomplete understanding of how MYC drives tumorigenesis A pivotal role of cluster 6 has been identified and verified
in a subset of Group 3 tumor cells has hampered the from several perspectives. Naturally, marker genes of this cell
development of novel therapeutic approaches for this lethal cluster are candidates for future therapeutic targets. From over
disease. The elucidation of novel critical factors regulating the thousands of genes, microarray data screening for survival and
malignant phenotype of MB cells is of great significance to expression differences excluded most of them, only those
increase our knowledge of this type of cancer, and prolonging or shortening survival while specifically expressed
subsequently bring more selective and efficient therapeutic in MBs were selected. Therapy de-escalation of these genes
options for patients with Group 3 MB. requires prospective testing using clinical samples. Only
Single-cell RNA sequencing allows us to understand how GRM8, MFAP2, and AP1S2 were specifically upregulated in
cellular heterogeneity contributes to the origination, progression, Group 3 MB; however, GRM8 and MFAP2 both interact with
and invasion of Group 3 MB. MB single-cell RNA-seq datasets MYC as its downstream factors. The 33 cases of Group 3 MB
from the Gene Expression Database were analyzed in eight patients provide us with valuable data showing that higher expression
with Group 3 MB. Nine individual cell clusters were identified levels of GRM8 and AP1S2 are associated with poorer patient
according to their distance distribution after dimensionality outcomes. All 33 patients pathologically diagnosed with Group 3
reduction through t-SNE. The genetic expression features of the MB underwent craniotomy and achieved gross resection;
cell clusters showed specific transcription preferences. Based on the adjuvant radiation therapy and chemotherapy were also
cells’ pseudo-time, a trajectory analysis was performed showing performed. Thus, the correlation of the expression with
the potent tumorigenesis characteristic of cluster 6 since survival is convincing to propose GRM8 and AP1S2 as novel
cells congregated at the beginning of a differentiation tree. A hallmarks of Group 3 MB. Nevertheless, MFAP2 remains a
differentiation trajectory might represent the degree of potential tumor suppression feature based on previous results.
differentiation from a pluripotent cell to a terminal state (41). However, the scale of the 33 clinical samples may be too small to
Therefore, cluster 6 is a potential tumorigenesis signature of uncover all associations.
Group 3 MB, and could be a foundation for further studies. GRM8 encodes MGLUR8, a G-protein coupled glutamate
It has been shown that MYC amplifications are the most receptor reported to significantly influence the risk of diseases
frequently observed driver events in Group 3 (42). In this study, affecting the CNS including behavior, mental disorder, cognition
PPI analysis showed that MYC is at the center of the network and as well as tumorigenesis of the CNS and other systems (28–30). Of
crosstalks with critical downstream factors/targets pathways. Several note, GRM8 expression has been shown to characterize Group 4
immune system-related anti-tumor pathways such as antigen MB (47) which overlaps in molecular features with Group 3 tumors.
procession and presentation, and natural killer cell mediated AP1S2 is a component of adaptor protein complex 1, and AP1S2
cytotoxicity were specifically downregulated in cluster 6. mutation could cause various brain diseases, including
Therefore, one potential therapeutic option for Group 3 would be hydrocephalus and Dandy-Walker malformation, among others
to develop immunotherapy targeting the immune-related pathways (31). To the best of our knowledge, this is the first study to reveal the
and their correlated genes in cluster 6 cells, besides, to upregulate the functional significance of AP1S2 in Group 3 MB.
immune response to tumor. This observation further clarifies the Clinical features such as cystic change, location, and tumor
vital and specific role of cluster 6 cells in Group 3 MB. size have not been clearly related to molecular MB markers, or
Increasing evidence suggests that metabolic dysfunction is a prognosis. Its large volume and cystic tumors can easily occlude
key cause of cancer development, including MB. Interestingly, the fourth ventricle causing hydrocephalus, while the location of
some amino acid synthesis pathways were enriched in cluster 6. the main tumor body is also important. Substantial Group 3 MBs
Notably, previous studies have proven the important role originate and extend to the fourth ventricle, and obstructive
of amino acids in cancer metabolism in both a tumorigenic hydrocephalus and cerebral fluid metastasis more often occur. In
and tumor-suppressive manner (43). These amino acid-related contrast, most SHH MBs are laterally located in the cerebral
pathways specifically enriched in cluster 6 may be attributed to hemisphere; and therefore, hydrocephalus is not as common as
cancer formation and metastasis. Aminoacyl-tRNAs are Group 3 MB (48, 49). The Ki-67 index has been considered a
substrates for translation, capable also of interacting with valuable independent prognostic biomarker for adult MB (50), so
various proteins to regulate tumorigenesis (44). Consistently, we also included this index in the study. However, on comparing
proline and (or) arginine metabolism supports metastasis the above tumor features including age, sex, and hydrocephalus
formation (40). In addition, cysteine is necessary to promote with the expression of GRM8 and AP1S2 within these 33 patients
cancer cell proliferation and survival. The metabolic demands of with Group 3 MB, no remarkable correlation between GRM8
a cell from the stresses associated with proliferation by oncogenic and AP1S2 gene levels was found; therefore, a larger scale clinical
transformation must be met through extracellular sources of sample is needed for further investigation.
Frontiers in Oncology | www.frontiersin.org 11 March 2021 | Volume 11 | Article 622430Qin et al. Single-Cell Sequencing in Group 3 Medulloblastoma
CONCLUSION AUTHOR CONTRIBUTIONS
To summarize, using single-cell transcriptomics, this study YP performed the experiments and interpreted the data. CQ
identified GRM8 and AP1S2 as two novel hallmarks of Group wrote the manuscript. YuzL and YueL performed the
3 MB indicating poor prognosis, while simultaneously experiments. WL and QL designed the experiments,
delineating a global picture of the molecular cascade of Group interpreted the data, wrote the manuscript, and provided
3 MB downstream of the MYC oncogene. With the development supervision. All authors contributed to the article and
of novel single-cell techniques combined with clinical cases, new approved the submitted version.
insights into Group 3 MB molecular characteristics may promote
clinical treatment and offer more selective and efficient
therapeutic targets for this disease.
FUNDING
This work was supported by the National Natural Science
DATA AVAILABILITY STATEMENT Foundation of China (grant number 81802974).
The datasets presented in this study can be found in online
repositories. The names of the repository/repositories and accession
number(s) can be found in the article/Supplementary Material.
SUPPLEMENTARY MATERIAL
The Supplementary Material for this article can be found online at:
https://www.frontiersin.org/articles/10.3389/fonc.2021.622430/
ETHICS STATEMENT full#supplementary-material
Supplementary Figure 1 | CCND2, MPHOSPH6, TUBB4A, POU4F1, SLITRK1,
The studies involving human participants were reviewed and
KIF5C, and TSHZ1 mRNA levels of two normal brain tissues obtained from epilepsy
approved by Xiangya Hospital ethics committee. The patients/ surgery (Numbered 1 and 2), three Wingless/Sonic Hedgehog medulloblastoma
participants provided their written informed consent to (MB) (Numbered 3–5), and three Group 3 MB (Numbered 6–8). H-actin was used as
participate in this study. endogenous reference gene. The expression level is presented with graphs.
REFERENCES 11. Kool M, Jones DT, Jager N, Northcott PA, Pugh TJ, Hovestadt V, et al.
Genome sequencing of SHH medulloblastoma predicts genotype-related
1. Kumar V, Kumar V, McGuire T, Coulter DW, Sharp JG, Mahato RI. response to smoothened inhibition. Cancer Cell (2014) 25(3):393–405.
Challenges and Recent Advances in Medulloblastoma Therapy. Trends doi: 10.1016/j.ccr.2014.02.004.
Pharmacol Sci (2017) 38(12):1061–84. doi: 10.1016/j.tips.2017.09.002 12. Laks E, McPherson A, Zahn H, Lai D, Steif A, Brimhall J, et al. Clonal
2. Ward E, DeSantis C, Robbins A, Kohler B, Jemal A. Childhood and adolescent Decomposition and DNA Replication States Defined by Scaled Single-Cell
cancer statistics, 2014. CA Cancer J Clin (2014) 64(2):83–103. doi: 10.3322/ Genome Sequencing. Cell (2019) 179(5):1207–21.e22. doi: 10.1016/
caac.21219 j.cell.2019.10.026.
3. Ellison DW, Kocak M, Dalton J, Megahed H, Lusher ME, Ryan SL, et al. 13. Casasent AK, Schalck A, Gao R, Sei E, Long A, Pangburn W, et al. Multiclonal
Definition of disease-risk stratification groups in childhood medulloblastoma Invasion in Breast Tumors Identified by Topographic Single Cell Sequencing.
using combined clinical, pathologic, and molecular variables. J Clin Oncol Cell (2018) 172(1-2):205–17.e12. doi: 10.1016/j.cell.2017.12.007.
(2011) 29(11):1400–7. doi: 10.1200/JCO.2010.30.2810 14. Gao R, Kim C, Sei E, Foukakis T, Crosetto N, Chan LK, et al. Nanogrid single-
4. Wen PY, Chang SM, Van den Bent MJ, Vogelbaum MA, Macdonald DR, Lee nucleus RNA sequencing reveals phenotypic diversity in breast cancer. Nat
EQ. Response Assessment in Neuro-Oncology Clinical Trials. J Clin Oncol Commun (2017) 8(1):228. doi: 10.1038/s41467-017-00244-w
(2017) 35(21):2439–49. doi: 10.1200/JCO.2017.72.7511 15. Islam S, Zeisel A, Joost S, La Manno G, Zajac P, Kasper M, et al, et al.
5. Ramaswamy V, Taylor MD. Medulloblastoma: From Myth to Molecular. Quantitative single-cell RNA-seq with unique molecular identifiers. Nat
J Clin Oncol (2017) 35(21):2355–63. doi: 10.1200/JCO.2017.72.7842 Methods (2014) 11(2):163–6. doi: 10.1038/nmeth.2772
6. Waszak SM, Northcott PA, Buchhalter I, Robinson GW, Sutter C, Groebner S, 16. Tirosh I, Izar B, Prakadan SM, Wadsworth MH 2nd, Treacy D, Trombetta
et al. Spectrum and prevalence of genetic predisposition in medulloblastoma: a JJ, et al. Dissecting the multicellular ecosystem of metastatic melanoma by
retrospective genetic study and prospective validation in a clinical trial cohort. single-cell RNA-seq. Science (2016) 352(6282):189–96. doi: 10.1126/
Lancet Oncol (2018) 19(6):785–98. doi: 10.1016/s1470-2045(18)30242-0. science.aad0501.
7. Northcott PA, Korshunov A, Witt H, Hielscher T, Eberhart CG, Mack S, et al. 17. Grun D, Lyubimova A, Kester L, Wiebrands K, Basak O, Sasaki N, et al.
Medulloblastoma comprises four distinct molecular variants. J Clin Oncol Single-cell messenger RNA sequencing reveals rare intestinal cell types.
(2011) 29(11):1408–14. doi: 10.1200/JCO.2009.27.4324 Nature (2015) 525(7568):251–5. doi: 10.1038/nature14966
8. Sharma T, Schwalbe EC, Williamson D, Sill M, Hovestadt V, Mynarek M, 18. Habib N, Li Y, Heidenreich M, Swiech L, Avraham-Davidi I, Trombetta JJ,
et al. Second-generation molecular subgrouping of medulloblastoma: an et al. Div-Seq: Single-nucleus RNA-Seq reveals dynamics of rare adult
international meta-analysis of Group 3 and Group 4 subtypes. Acta newborn neurons. Science (2016) 353(6302):925–8. doi: 10.1126/
Neuropathol (2019) 138(2):309–26. doi: 10.1007/s00401-019-02020-0 science.aad7038
9. Robinson G, Parker M, Kranenburg TA, Lu C, Chen X, Ding L, et al. Novel 19. Navin N, Kendall J, Troge J, Andrews P, Rodgers L, McIndoo J, et al. Tumour
mutations target distinct subgroups of medulloblastoma. Nature (2012) 488 evolution inferred by single-cell sequencing. Nature (2011) 472(7341):90–4.
(7409):43–8. doi: 10.1038/nature11213. doi: 10.1038/nature09807
10. Northcott PA, Lee C, Zichner T, Stutz AM, Erkek S, Kawauchi D, et al. 20. Wang Y, Waters J, Leung ML, Unruh A, Roh W, Shi X, et al. Clonal evolution
Enhancer hijacking activates GFI1 family oncogenes in medulloblastoma. in breast cancer revealed by single nucleus genome sequencing. Nature (2014)
Nature (2014) 511(7510):428–34. doi: 10.1038/nature13379. 512(7513):155–60. doi: 10.1038/nature13600
Frontiers in Oncology | www.frontiersin.org 12 March 2021 | Volume 11 | Article 622430Qin et al. Single-Cell Sequencing in Group 3 Medulloblastoma
21. Kim C, Gao R, Sei E, Brandt R, Hartman J, Hatschek T, et al. Chemoresistance 37. Hanzelmann S, Castelo R, Guinney J. GSVA: gene set variation analysis for
Evolution in Triple-Negative Breast Cancer Delineated by Single-Cell microarray and RNA-seq data. BMC Bioinf (2013) 14:7. doi: 10.1186/1471-
Sequencing. Cell (2018) 173(4):879–93.e13. doi: 10.1016/j.cell.2018.03.041. 2105-14-7
22. Lohr JG, Adalsteinsson VA, Cibulskis K, Choudhury AD, Rosenberg M, Cruz- 38. Senabouth A, Lukowski SW, Hernandez JA, Andersen SB, Mei X, Nguyen
Gordillo P, et al. Whole-exome sequencing of circulating tumor cells provides QH, et al. ascend: R package for analysis of single-cell RNA-seq data.
a window into metastatic prostate cancer. Nat Biotechnol (2014) 32(5):479–84. Gigascience (2019) 8(8):giz087. doi: 10.1093/gigascience/giz087
doi: 10.1038/nbt.2892. 39. Shannon P, Markiel A, Ozier O, Baliga NS, Wang JT, Ramage D, et al.
23. Martelotto LG, Baslan T, Kendall J, Geyer FC, Burke KA, Spraggon L, et al. Cytoscape: a software environment for integrated models of biomolecular
Whole-genome single-cell copy number profiling from formalin-fixed interaction networks. Genome Res (2003) 13(11):2498–504. doi: 10.1101/
paraffin-embedded samples. Nat Med (2017) 23(3):376–85. doi: 10.1038/ gr.1239303
nm.4279 40. Elia I, Broekaert D, Christen S, Boon R, Radaelli E, Orth MF, et al. Proline
24. Goodwin S, McPherson JD, McCombie WR. Coming of age: ten years of next- metabolism supports metastasis formation and could be inhibited to
generation sequencing technologies. Nat Rev Genet (2016) 17(6):333–51. doi: selectively target metastasizing cancer cells. Nat Commun (2017) 8:15267.
10.1038/nrg.2016.49 doi: 10.1038/ncomms15267
25. Meyer M, Reimand J, Lan X, Head R, Zhu X, Kushida M, et al. Single cell- 41. Nestorowa S, Hamey FK, Pijuan Sala B, Diamanti E, Shepherd M, Laurenti E,
derived clonal analysis of human glioblastoma links functional and genomic et al. A single-cell resolution map of mouse hematopoietic stem and
heterogeneity. Proc Natl Acad Sci U.S.A. (2015) 112(3):851–6. doi: 10.1073/ progenitor cell differentiation. Blood (2016) 128(8):e20–31. doi: 10.1182/
pnas.1320611111 blood-2016-05-716480
26. Patel AP, Tirosh I, Trombetta JJ, Shalek AK, Gillespie SM, Wakimoto H, et al. 42. Northcott PA, Shih DJ, Remke M, Cho YJ, Kool M, Hawkins C, et al. Rapid,
Single-cell RNA-seq highlights intratumoral heterogeneity in primary reliable, and reproducible molecular sub-grouping of clinical
glioblastoma. Science (2014) 344(6190):1396–401. doi: 10.1126/science.1254257 medulloblastoma samples. Acta Neuropathol (2012) 123(4):615–26. doi:
27. Hovestadt V, Smith KS, Bihannic L, Filbin MG, Shaw ML, Baumgartner A, 10.1007/s00401-011-0899-7
et al. Resolving medulloblastoma cellular architecture by single-cell genomics. 43. Lieu EL, Nguyen T, Rhyne S, Kim J. Amino acids in cancer. Exp Mol Med
Nature (2019) 572(7767):74–9. doi: 10.1038/s41586-019-1434-6. (2020) 52(1):15–30. doi: 10.1038/s12276-020-0375-3
28. Jantas D, Grygier B, Gołda S, Chwastek J, Zatorska J, Tertil M. An endogenous 44. Ibba M, Soll D. Aminoacyl-tRNA synthesis. Annu Rev Biochem (2000)
and ectopic expression of metabotropic glutamate receptor 8 (mGluR8) 69:617–50. doi: 10.1146/annurev.biochem.69.1.617
inhibits proliferation and increases chemosensitivity of human 45. Combs JA, DeNicola GM. The Non-Essential Amino Acid Cysteine Becomes
neuroblastoma and glioma cells. Cancer Lett (2018) 432:1–16. doi: 10.1016/ Essential for Tumor Proliferation and Survival. Cancers (Basel) (2019) 11
j.canlet.2018.06.004 (5):678. doi: 10.3390/cancers11050678
29. Zhang P, Kang B, Xie G, Li S, Gu Y, Shen Y, et al. Genomic sequencing and 46. Cabarcas S, Schramm L. RNA polymerase III transcription in cancer: the
editing revealed the GRM8 signaling pathway as potential therapeutic targets BRF2 connection. Mol Cancer (2011) 10:47. doi: 10.1186/1476-4598-10-47
of squamous cell lung cancer. Cancer Lett (2019) 442:53–67. doi: 10.1016/ 47. Northcott PA, Dubuc AM, Pfister S, Taylor MD. Molecular subgroups of
j.canlet.2018.10.035 medulloblastoma. Expert Rev Neurother (2012) 12(7):871–84. doi: 10.1586/
30. Boccella S, Marabese I, Guida F, Luongo L, Maione S, Palazzo E. The ern.12.66
Modulation of Pain by Metabotropic Glutamate Receptors 7 and 8 in the 48. Gibson P, Tong Y, Robinson G, Thompson MC, Currle DS, Eden C, et al.
Dorsal Striatum. Curr Neuropharmacol (2020) 18(1):34–50. doi: 10.2174/ Subtypes of medulloblastoma have distinct developmental origins. Nature
1570159X17666190618121859 (2010) 468(7327):1095–9 doi: 10.1038/nature09587.
31. Huo L, Teng Z, Wang H, Liu X. A novel splice site mutation in AP1S2 gene for 49. Wang J, Garancher A, Ramaswamy V, Wechsler-Reya RJ. Medulloblastoma:
X-linked mental retardation in a Chinese pedigree and literature review. Brain From Molecular Subgroups to Molecular Targeted Therapies. Annu Rev
Behav (2019) 9(3):e01221. doi: 10.1002/brb3.1221 Neurosci (2018) 41:207–32. doi: 10.1146/annurev-neuro-070815-013838
32. Bowman RL, Wang Q, Carro A, Verhaak RG, Squatrito M. GlioVis data portal 50. Zhao F, Zhang J, Li P, Zhou Q, Zhang S, Zhao C, et al. Prognostic value of Ki-
for visualization and analysis of brain tumor expression datasets. Neuro Oncol 67 index in adult medulloblastoma after accounting for molecular subgroup: a
(2017) 19(1):139–41. doi: 10.1093/neuonc/now247 retrospective clinical and molecular analysis. J Neurooncol (2018) 139(2):333–
33. Cavalli FMG, Remke M, Rampasek L, Peacock J, Shih DJH, Luu B, et al. 40. doi: 10.1007/s11060-018-2865-x
Intertumoral Heterogeneity within Medulloblastoma Subgroups. Cancer Cell
(2017) 31(6):737–54.e6. doi: 10.1016/j.ccell.2017.05.005 Conflict of Interest: The authors declare that the research was conducted in the
34. Griesinger AM, Birks DK, Donson AM, Amani V, Hoffman LM, Waziri A, et al. absence of any commercial or financial relationships that could be construed as a
Characterization of distinct immunophenotypes across pediatric brain tumor potential conflict of interest.
types. J Immunol (2013) 191(9):4880–8. doi: 10.4049/jimmunol.1301966
35. Stuart T, Butler A, Hoffman P, Hafemeister C, Papalexi E, Mauck WM 3rd, Copyright © 2021 Qin, Pan, Li, Li, Long and Liu. This is an open-access article
et al. Comprehensive Integration of Single-Cell Data. Cell (2019) 177(7):1888– distributed under the terms of the Creative Commons Attribution License (CC BY).
902.e21 doi: 10.1016/j.cell.2019.05.031. The use, distribution or reproduction in other forums is permitted, provided the
36. Qiu X, Hill A, Packer J, Lin D, Ma YA, Trapnell C. Single-cell mRNA original author(s) and the copyright owner(s) are credited and that the original
quantification and differential analysis with Census. Nat Methods (2017) 14 publication in this journal is cited, in accordance with accepted academic practice. No
(3):309–15. doi: 10.1038/nmeth.4150 use, distribution or reproduction is permitted which does not comply with these terms.
Frontiers in Oncology | www.frontiersin.org 13 March 2021 | Volume 11 | Article 622430You can also read