Biomaterials Science - RSC Publishing
←
→
Page content transcription
If your browser does not render page correctly, please read the page content below

Volume 4 Number 11 November 2016 Pages 1527–1706

Biomaterials
Science
www.rsc.org/biomaterialsscience

                                  ISSN 2047-4830

                                  PAPER
                                  K. Maniura-Weber et al.
                                  Convex and concave micro-structured silicone controls the shape, but not
                                  the polarization state of human macrophages
Biomaterials
Science
View Article Online
PAPER View Journal | View Issue
Convex and concave micro-structured silicone
This article is licensed under a Creative Commons Attribution 3.0 Unported Licence.
Open Access Article. Published on 21 September 2016. Downloaded on 10/21/2021 9:08:43 AM.
Cite this: Biomater. Sci., 2016, 4,
controls the shape, but not the polarization state
1562 of human macrophages†
V. Malheiro,‡a F. Lehner,‡a V. Dinca,b,c P. Hoffmannb and K. Maniura-Weber*a
The typical foreign body response (FBR) to synthetic implants is characterized by local inflammation
and tissue fibrosis. Silicone implants have been associated with the development of adverse capsular
contraction (ACC); a form of excessive FBR to the material that often requires the replacement of
the implant. It has been shown that surface roughening of silicone can reduce the prevalence of ACC,
but the mechanisms remain poorly understood. Macrophages are key cells in FBR. They exert
their control mainly by polarizing into pro-inflammatory (M1) or pro-healing (M2) cells. It is postulated
that surface topography can reduce M1 polarization by limiting cell spreading and cytoskeleton
organization. To test this hypothesis, we used KrF Excimer laser ablation with half-tone masks
to produce convex and concave topographies with controlled surface dimensional parameters. Cells
in convex and concave topographies were compared to cells in planar surfaces, with or without
chemical polarization. We show that chemical polarization induced specific changes in the cell shape
on planar substrates. Macrophage shape and size was different in concave and convex surfaces, but no
correlation was found with the cell polarization state. The results highlight that chemical polarization of
Received 22nd June 2016, macrophages is associated with changes in the cell shape; however, topography-induced changes in
Accepted 13th September 2016
macrophage shape could not be linked with a shift in macrophage polarization. Thus, the sole manipu-
DOI: 10.1039/c6bm00425c lation of cell shape does not seem to be the mechanism by which macrophage function could be
www.rsc.org/biomaterialsscience controlled.
1. Introduction Macrophages are one of the predominant cell types at the
implant site after 48–72 hours of implantation,1 and have an
A major challenge in biomaterials research is the design of important role in both eliciting inflammatory responses and
implantable systems for which the cell and tissue response orchestrating tissue repair. Their ability to coordinate tissue
can be predicted and tailored, guaranteeing the long term repair results from their capacity to switch between a pro-
success of an implant. An attractive way for achieving this goal inflammatory (M1) and pro-healing (M2) state in a process
is to create instructive surfaces with a combination of mechan- known as polarization.2 Macrophage polarization in the body
ical, chemical or topographical properties capable of directing occurs mainly due to exposure to chemical signals, such as
cell behavior. However, the attainment of surfaces for which exposure to bacterial fragments (e.g. lipopolysaccharides (LPS))
the specific response at the cellular level can be fully predicted or cytokines produced by macrophages themselves or other
has not been accomplished yet. immune cells (e.g. IL-4 or INF-γ). Indeed, the in vitro develop-
ment of M1 macrophages is achieved by exposure to IFN-γ (the
main Th1 cytokine) and LPS, whereas M2 macrophages can be
a
formed upon exposure to IL-4 (typical Th2-type cytokine). It
Biointerfaces, Empa, Swiss Federal Laboratories for Materials Science and
has also been suggested that implant properties can affect
Technology, Lerchenfeldstrasse, St. Gallen, CH-9014, Switzerland.
E-mail: katharina.maniura@empa.ch macrophage polarization, and that this may be in fact a major
b
Advanced Materials Processing, Empa, Swiss Federal Laboratories for Materials driving force dictating the way the tissue heals at the implant
Science and Technology, Feuerwerkerstrasse, Thun, CH-3602, Switzerland interface.3,4
c
National Institute for Lasers, Plasma and Radiation Physics, Magurele-Bucharest, Out of all implant properties that can be manipulated, the
RO-077125, Romania
surface topography is particularly interesting, for it has proven
† Electronic supplementary information (ESI) available. See DOI: 10.1039/
c6bm00425c to affect tissue formation in vivo and cell function in vitro, and
‡ These authors contributed equally to this work. can be readily modified using currently available technology.
1562 | Biomater. Sci., 2016, 4, 1562–1573 This journal is © The Royal Society of Chemistry 2016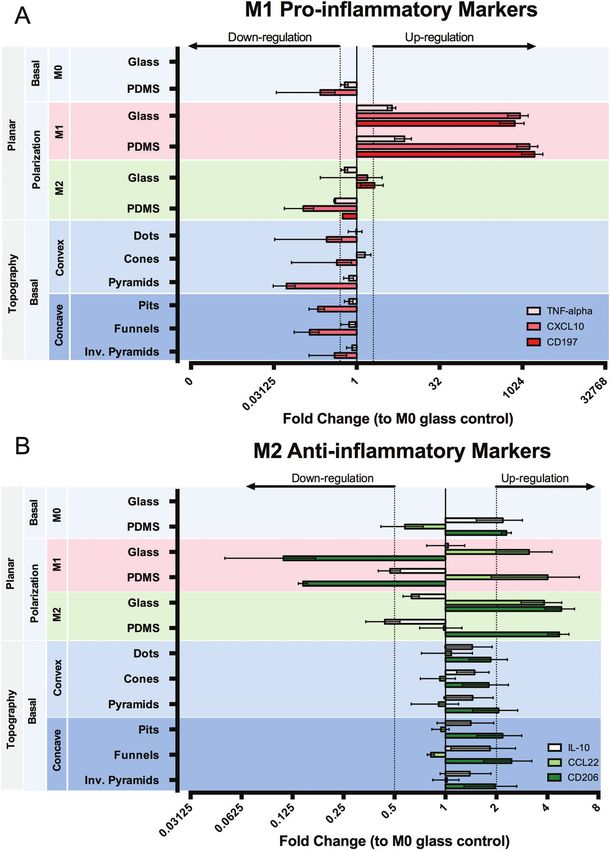
View Article Online
Biomaterials Science Paper
The mechanistic basis for topography-induced regulation of 2. Materials and methods
cellular genome expression and, with this cell function, is
attributed to its interference with cell adhesion,5 cytoskeleton 2.1 Substrate fabrication and characterization
formation6 and nuclear shape and orientation.7–9 Excimer laser micromachining by mask projection with half-
Consequently, topographies that induce changes in the macro- tone masks has been used to obtain various structures with
phages cytoskeletal organization and adhesion to a substrate simple and complex surface profiles. Details of the laser
can potentially alter their polarization state, steering their system are described elsewhere.32 Shortly, the experimental
response at the implant–tissue interface. Modification of setup contains a KrF excimer laser (Exitech, PPM-601E Gen 6
surface topography has already been used as a way to promote Tool), with the following characteristics: 20 ns pulse, 248 nm
This article is licensed under a Creative Commons Attribution 3.0 Unported Licence.
Open Access Article. Published on 21 September 2016. Downloaded on 10/21/2021 9:08:43 AM.
changes in macrophage behavior in in vitro studies,10–27 wavelength, and 50 Hz repetition rate. The average fluence at
however the number of publications addressing this issue is the polycarbonate substrate level was 400 mJ cm−2 per pulse.
rather limited compared to those found for other cell types, The laser was collimated to illuminate a mask and then
such as fibroblasts and osteoblasts. Whilst correlations between focused on the sample with the de-magnification factor of 5.
micro-topography, macrophage morphology and secretory By scanning the mask under the beam and the PC sample,
activity have been established,12–14,19,20,22,24 only few studies micro-patterns of different shapes (dots, cones, pyramids, pits,
used well-defined surface topographies for the evaluation of the funnels, inverted pyramids) with a depth/height of 10 µm and
specific effect of surface parameters (e.g. space between fea- a width of 25 µm were generated on a polycarbonate (PC) sub-
tures) in macrophage polarization.12,15,25 Moreover, the type of strate. The polycarbonate samples were cleaned ultrasonically
topography conformation analyzed by others is mostly limited for 10 min, sequentially, in isopropyl alcohol (IPA) and
to random topographies or grooves, dots and posts structures. Millipore ultrapure water (R = 18 MΩ), followed by drying with
Notably, the possible effects of convex and concave topo- an air gun. The final surfaces were obtained by molding the
graphies have not been investigated so far, despite their ability PC master with PDMS (Sylgard 184 Silicone Elastomer Kit;
to impose distinct geometric and mechanical restrictions to the Dow Corning) (1 : 10) cured for 48 h at room temperature (RT),
cell cytoskeleton.28 It has however been shown29–31 that other followed by heating to 80 °C for 1 h to ensure completing
types of cells respond differently to concave and convex micro- curing.
structures. The development of successful topography-based The final PDMS samples were demolded, cleaned ultra-
immune-modulatory surfaces dictates the need for the identifi- sonically twice for 10 min in IPA and finally in ultrapure water,
cation of the specific surface parameters that govern macro- before sterilization in 70% ethanol for 1 h. For cell culture
phage-responsiveness to topography. In the present study, we experiments, samples were transferred to a new culture plate
set out to investigate whether convex and concave poly- and washed twice with sterile warm phosphate buffered solu-
dimethylsiloxane (PDMS) structures differently affected macro- tion (PBS) prior to cell seeding. The absence of endotoxin con-
phages in vitro. We have produced the different topographies in tamination in sterilized samples was confirmed by a cell-based
PDMS due to its relevance as an implantable material, for assay. The assay and results obtained are detailed in ESI
which the control of foreign body reactions would be beneficial (Fig. S1†).
in various clinical contexts. The micro-topographies were A confocal laser scanning microscope (LSM780; Carl Zeiss,
created by KrF Excimer laser ablation with half-tone masks. Germany) was used to image the PDMS topographies in order
This technique provides a unique tool for patterning and struc- to assess the pattern transfer fidelity from the PC mold to the
turing a wide variety of materials, including polymers, due to PDMS replica. Samples were immersed in fluorescein isothio-
the short pulse of 20 ns which allows a non-thermal ablative cyanate dye to increase contrast and imaged at 488 nm.
material removal. As a result, structures with a depth resolution
in the order of 0.1 μm and spatial resolution in the order of
1 μm or smaller can be obtained. Moreover, by carefully control- 2.2 Cell culture and seeding
ling the laser parameters and by using a grey level mask, All cell culture reagents were obtained from Invitrogen, and all
surfaces can be multi-level processed to obtain 2 and 3 dimen- other chemicals from Sigma, except where indicated.
sional microstructures. In the present work, we used this tech- Human monocytic leukemia cell line THP-1, obtained from
nique to create a polycarbonate (PC) master mold from which the European Collection of Cell Cultures (ECACC, https://www.
we then produced different convex (pyramids, cones, dots) and phe-culturecollections.org.uk), was selected for the cell culture
concave (inverted pyramids, funnels, pits) structures in PDMS studies. Cells were maintained in complete medium prepared
by replica molding. The depth/height, width, pattern and from RPMI-1640 medium supplemented with 10% (v/v) fetal
spacing between the features were kept constant to allow for a calf serum (FCS), 1% (v/v) penicillin–streptomycin–neomycin
direct comparison between, and within the two groups. The (50 µg mL−1 penicillin, 50 µg mL−1 streptomycin and 100
effect of topography was investigated with respect to cell µg mL−1 neomycin), and 0.2 mg mL−1 of L-glutamine. Cells were
number, morphology and polarization using human macro- incubated at 37 °C in a humidified atmosphere containing 5%
phages (THP-1 monocytic leukemia cell line). Chemically- CO2 and sub-cultured when reaching a concentration between
induced polarized M1 or M2 macrophages on planar substrates 8 × 10⁵ and 1 × 10⁶ cells per mL. Cells from passage 10 to
(PDMS and glass) were included as controls. 17 (after thawing) were used for all experiments. Cell counting
This journal is © The Royal Society of Chemistry 2016 Biomater. Sci., 2016, 4, 1562–1573 | 1563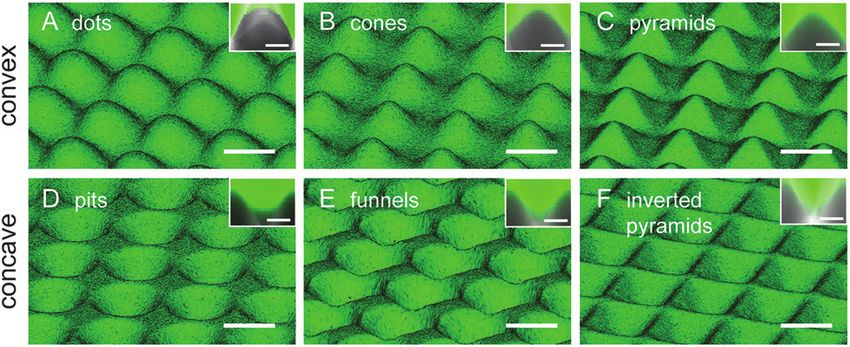
View Article Online
Paper Biomaterials Science
for passaging and seeding was performed using an electronic imaging was carried out using an S-4800 Hitachi with an
cell counting device (Casy® model TT, Roche Innovatis AG). accelerating voltage of 10 kV.
PDMS and glass discs (15 mm diameter) were each trans- 2.4.2 Confocal laser scanning microscopy. Confocal laser
ferred to a well of a 24-well plate and cells (7.5 × 10⁴ cells per scanning microscopy was used for the qualitative evaluation of
cm2) were plated onto the substrates in 500 μL RPMI-1640 the actin cell cytoskeleton arrangement, and quantitative
complete medium supplemented with 100 nM phorbol-12- evaluation of the cell body morphometric parameters. Cells
myristate-13-acetate (PMA) in order to induce macrophage were fixed with 4% (w/v) paraformaldehyde in PBS for 15 min
differentiation of the monocytic THP-1 cells.33 Cells were left at room temperature (RT), washed three times with PBS and
to differentiate for 3 days in PMA-containing medium, after permeabilized at RT for 15 min using 0.1% (v/v) Triton X-100
This article is licensed under a Creative Commons Attribution 3.0 Unported Licence.
Open Access Article. Published on 21 September 2016. Downloaded on 10/21/2021 9:08:43 AM.
which the medium was replaced by PMA-free medium. On in PBS. For cell cytoskeleton imaging, cells were subsequently
day 4, medium was changed to either PMA-free medium, incubated with AlexaFluor 488-conjugated phalloidin (1 : 40 in
M1 medium supplemented with 100 ng mL−1 lipopolysacchar- 0.05% (v/v) Tween-20 in PBS (PBST)) to stain actin fibers and
ide (LPS) and 20 ng mL−1 interferon gamma (IFN-γ) or incubated at 37 °C for 40 min. Samples were rinsed five times
M2 medium supplemented with 20 ng mL−1 interleukin 4 with PBST, mounted with Vectashield antifade mountant con-
(IL-4) for chemical induction of macrophage polarization on taining DAPI (Vector Laboratories), to stain nuclei, and imaged
planar PDMS and glass surfaces. Cells were cultivated in using a LSM780 confocal laser scanning microscope. For cell
contact with the surface for further 24 h and were then body evaluation, samples were washed three times with PBS
analyzed. and incubated in the dark with 2 µg mL−1 HCS CellMask™
green stain (Invitrogen) in PBS for 30 min at room tempera-
2.3 Quantification of macrophage cell number & metabolic ture. The specimens were washed three times with PBS and
activity imaged using a LSM780 confocal laser scanning microscope.
The alamarBlue® assay (Invitrogen) measures the metabolic 2.4.3 Morphometric analysis. Morphometric descriptors
state of a cell population by quantifying the ability to reduce were determined and quantified using maximum intensity
resazurin, the blue (non-fluorescent) cell permeable dye, to projections of the confocal images obtained from CellMask™
resorufin, a red compound that is highly fluorescent.34 At day green stained cells employing ImageJ software. Raw images
5, each cell-seeded substrate was incubated for 4 h with fresh were exported to the software and manually thresholded. An
culture medium supplemented with 10% (v/v) alamarBlue image optimization step was performed, which included noise
reagent. Following incubation, 100 µL medium from each well reduction with despeckle function and cell-boundary recog-
was transferred in triplicate to a black 96-well microplate. nition improvement by application of a watershed function.
Fluorescence (excitation 530 nm, emission 590 nm) was Morphometric analysis was conducted using the particle-
measured on a Mithras2 LB 943 monochromator multimode analysis plugin in order to quantify the different cell morpho-
reader (Berthold Technologies GmbH & Co., Germany). Cell metric parameters (Table S1†). Quantification was performed
metabolic activity was reported as % reduction of alamarBlue for a minimum of 300 individual cells per surface type, with
and calculated as described in the ESI.† images obtained from 3 different samples, from each of the
Total number of cells per area was determined by counting three independent experiments.
DAPI stained cells in confocal microscopy images (obtained as
described below) with ImageJ software (National Institutes of
Health, Bethesda, MD). 2.5 Gene expression analysis
RNA from adherent cells was isolated by the spin column
2.4 Macrophage morphology method using a commercially available RNeasy Micro Kit
2.4.1 Scanning electron microscopy. Scanning electron (Qiagen), according to the manufacturer’s instructions. To
microscopy (SEM) was selected for the qualitative evaluation, prevent DNA contamination in the eluted RNA solution,
with high resolution, of the effect of the different patterned genomic DNA was removed by a DNase treatment (Qiagen).
samples on macrophage attachment and morphology. At day The RNA concentration and quality were determined using a
5, each sample was rinsed twice with warm PBS and trans- Nanodrop ND-1000 Spectrophotometer (ThermoScientific).
ferred to a fresh 24-well culture plate with 500 µL of Karnovsky Complementary DNA (cDNA) was synthesized from 100–300 ng
fixative (4 g paraformaldehyde, 5 mL 50% (v/v) glutaraldehyde, of total RNA using iScriptTM cDNA Synthesis Kit.
50 mL Millipore water, 45 mL PBS ( pH 7.4)). After 1 h, the A temperature program of 5 min priming at 25 °C, followed
fixative was removed and the sample washed twice in PBS. The by the reverse transcription at 42 °C for 30 min and the reverse
cells were then dehydrated by soaking in a series of ethanol transcription inactivation at 85 °C for 5 min was run. After a
solutions, increasing in concentration from 30% to 100%. final cool down to 4 °C, the cDNA was diluted 1 : 5 in RNase-
Finally, the samples were soaked in hexamethyldisilazane free water and stored at −80 °C for subsequent use. Primer
(HMDS) for 30 min, before allowing air drying overnight. Once pairs – designed over exon–exon junctions using PrimerBlast
dried, samples were attached to mounting stubs with double online software (http://ncbi.nlm.nih.gov/tools/primer-blast/)
sided carbon tape and then sputter-coated with 10 nm gold– and manufactured by Microsynth AG (Balgach, Switzerland) –
palladium in a sputter machine (EM ACE600, Leica). SEM are displayed in Table S2.† Only primer pairs which resulted in
1564 | Biomater. Sci., 2016, 4, 1562–1573 This journal is © The Royal Society of Chemistry 2016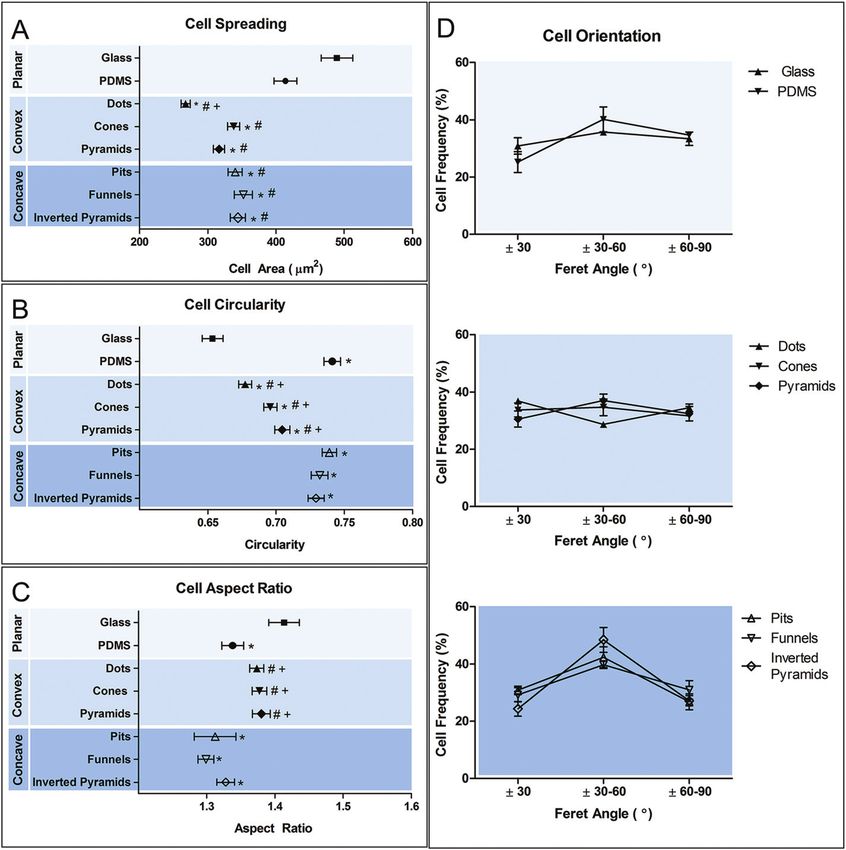
View Article Online

                                                                                                   Biomaterials Science                                                                                                                   Paper

                                                                                                   a PCR efficiency between 90% and 110% using the below
                                                                                                   described program were used in this study.
                                                                                                      Real-time PCR was performed using 5 μL of cDNA sample
                                                                                                   and 7 µL of 0.2 μM (final concentration) forward and reverse
                                                                                                   primer and iQTM SYBR® Green Supermix (Biorad
                                                                                                   Laboratories) in a CFX96™ Real-Time PCR (Biorad
                                                                                                   Laboratories). The cycling conditions were as follows: an
                                                                                                   initial 95 °C for 3 min, followed by 40 cycles of 95 °C for 10 s
                                                                                                   and 57 °C for 30 s. Then, a melting curve was constructed by
             This article is licensed under a Creative Commons Attribution 3.0 Unported Licence.
Open Access Article. Published on 21 September 2016. Downloaded on 10/21/2021 9:08:43 AM.

                                                                                                   heating from 65 °C to 95 °C in temperature steps of 0.5 °C. A      Fig. 1 3D views of convex (A–C) and concave (D–F) PDMS topo-
                                                                                                                                                                      graphies reconstructed from images obtained by confocal microscopy
                                                                                                   multivariable, nonlinear regression method was used by
                                                                                                                                                                      of fluorescein-immersed samples. The cross-sectional shape of each
                                                                                                   CFX™ Manager Software (Version 2.0, Biorad Laboratories) to        topographic feature is shown in the inset of the corresponding figure.
                                                                                                   determine the quantification cycle values. Fold changes in         Scale bar = 25 µm, and 10 µm in insets.
                                                                                                   gene expression were then quantified using the 2(−ΔΔCq)
                                                                                                   method35 normalized against GAPDH. Cells on M0 glass were
                                                                                                   designated as the calibrator for each experiment.                  3.2   Macrophage adaptation to topography
                                                                                                                                                                      THP-1 cells were cultured on the different substrates for 5 days
                                                                                                                                                                      when the development of a mature macrophage phenotype
                                                                                                   2.6   Statistical analysis
                                                                                                                                                                      was anticipated. Fig. 2 shows the number (a) and metabolic
                                                                                                   Quantitative evaluations were performed from data obtained         state (b) of macrophages cultured on different surfaces. No
                                                                                                   from a minimum of three independent experiments, using two         significant differences were observed between the numbers of
                                                                                                   replicate samples per condition. Data are expressed as the         macrophages attached to different topographies. The meta-
                                                                                                   arithmetic mean ± standard error of the mean (SEM).
                                                                                                   Statistical significance of differences in mean values was evalu-
                                                                                                   ated by ANOVA or Kruskal–Wallis nonparametric ANOVA
                                                                                                   (morphometric data). When values were found to be signi-
                                                                                                   ficant the t-test or Mann–Whitney U test was subsequently
                                                                                                   employed to detect differences at the multiple comparisons
                                                                                                   levels. Statistical analysis and plotting was performed with
                                                                                                   GraphPad® Prism software (GraphPad Software Inc., USA).
                                                                                                   Differences were considered statistically significant at p values
                                                                                                   of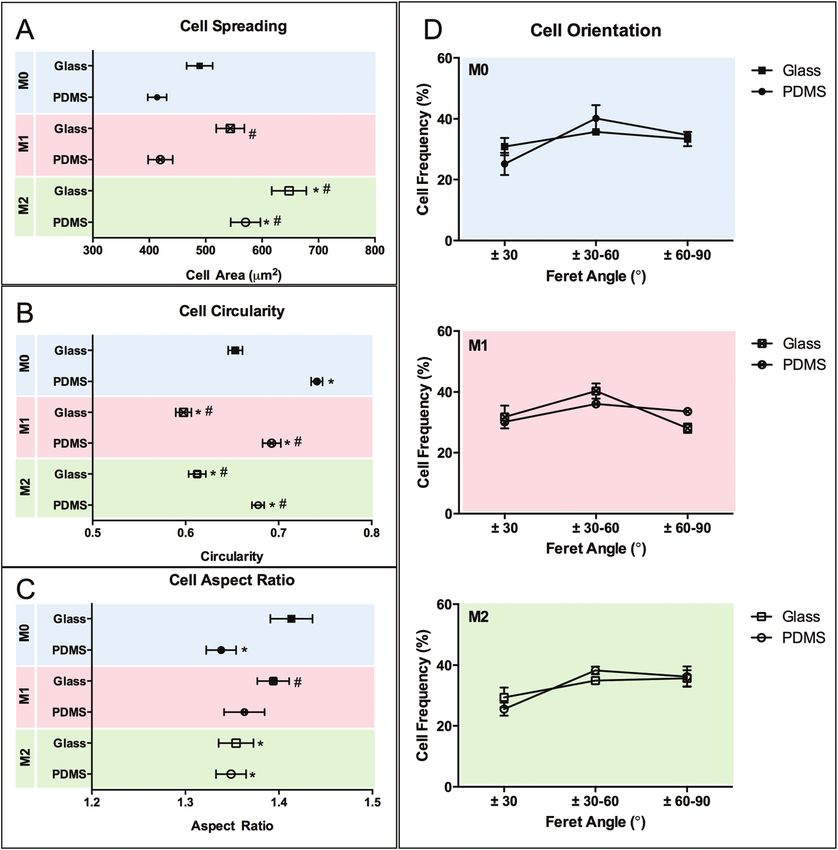
View Article Online
Paper Biomaterials Science
bolic activity of the cells was decreased when cultured on Particularly, it is shown that cells acquire an angular crescent
PDMS, regardless of the presence or absence of topographic cross-sectional morphology in convex topographies (Fig. 4G–I),
features. and a more circular or oval cross-sectional morphology in
Cell adhesion and morphology were also analyzed after concave surfaces (Fig. 4J–L). Interestingly, the intra-cellular
5 days in culture. Macrophages could adhere and spread to all location of the nucleus was mostly at the places were no cell
different surface topographies. Cells constituted a hetero- deformation was present, so that no major trends were detected
geneous population exhibiting varied morphological adap- in terms of nuclear adaptations to the topography.
tations to the underlying topographic features. Nevertheless, Cell morphological adaptation to a substrate, particularly in
some trends towards specific shape adaptations could be the case of a heterogeneous population, can be better distin-
This article is licensed under a Creative Commons Attribution 3.0 Unported Licence.
Open Access Article. Published on 21 September 2016. Downloaded on 10/21/2021 9:08:43 AM.
identified for specific surface topographies and are presented guished by quantitative analysis of the cell shape descriptors.
in the SEM images in Fig. 3. Fig. 3(G)–(I) shows the mor- Cell morphology was analyzed in respect to changes in cell
phology of cells in contact with different types of convex size (Fig. 5A), shape (Fig. 5B and C) and orientation (Fig. 5D).
surfaces. In general, cells on this type of topographies have a Results show that all the topographies used in this study
tendency to spread between the topographic features, adjust- promoted a statistically significant decreased ( p < 0.05) in cell
ing the cell body margin to contour the sidewalls of the fea- spreading in comparison to planar PDMS and glass. Convex
tures. The development of star-shaped morphology was often surfaces appear to promote a further decrease in cell area com-
observed, and more rarely cells bridging between topo- pared to the concave counterpart, but only in dots such differ-
graphical features. In contrast, cells in concave topographies ence reached a statistical significance. Calculation of the
(Fig. 3J–L) mainly attached and spread inside the concavities, circularity and aspect ratio (AR) allows the quantification of
typically acquiring a round morphology in pits and funnels macrophage shape. AR is high when cell shape is elongated
(Fig. 3J and K) and a squarer morphology in inverted pyramids and decreases when cells become more polygonal. Further dis-
(Fig. 3L). crimination between polygonal and circular shapes can be
Confocal microscopy images (Fig. 4) are in agreement with achieved using the circularity parameter, where 1 represents a
SEM observations of the cell shape adaptation to the different perfect circle. Macrophages on planar glass have the lowest
topographies. In addition, the images show the absence of a degree of circularity compared to cells in PDMS. However,
well-defined actin cytoskeleton and the lack of actin stress fiber elongation is increased only in comparison to cells on planar
formation. Side views reveal further differences between cell glass and concave surfaces. Cell shape on concave surfaces is
morphological adaptation to concave and convex topographies. similar to that on planar PDMS, showing a high degree of
circularity and decreased elongation. In contrast, culture of
macrophages in convex PDMS surfaces decreased their circu-
larity and increased AR. The topographies do not seem to
induce any particular effect on cell orientation, except for
inverted pyramids, where an increased number of cells appear
to be aligned in the direction of ±30–60°. This may be a con-
sequence not of cell alignment, but of the acquisition of a
squared cell shape. A squared cell will have its longest axis
(Feret’s diameter) between opposing vertices and this axis will
be at 45° to the x-axis of the image, within the ±30–60° range.
3.3 Macrophage adaptation to chemical stimuli
The effect of M1 and M2 chemical polarizers on macrophage
response to planar surfaces was analyzed in control experi-
ments using two different substrate materials (glass and
PDMS). On day 5, no differences were observed in the number
of cells attached to planar PDMS and glass, irrespectively of
the presence or absence of chemical polarizers (Fig. 6). The
metabolic activity of the cells cultured on PDMS was decreased
when compared to cells on glass.
The effect of chemical polarization on macrophage mor-
phology is shown in Fig. 7. Macrophage spreading and AR is
increased when cultured on glass compared to PDMS surfaces
( p < 0.05), whereas the circularity is decreased. Chemical polar-
Fig. 3 Representative SEM images of macrophages in glass (A–C) and
ization also influences cell shape. M2 polarization increases
planar PDMS (D–F), convex (G–I) or concave (J–L) PDMS topographies.
Cells in planar surfaces were cultured with basal M0 (A, D), M1 (B, E) or
cell spreading and decreases circularity ( p < 0.05) on both sub-
M2 (C, F) polarization medium. Images reveal differences in cell mor- strates, while M1 polarization has no effect on cell spreading
phology in response to topography and cultivation medium. but promotes likewise a decrease ( p < 0.05) in circularity. The
1566 | Biomater. Sci., 2016, 4, 1562–1573 This journal is © The Royal Society of Chemistry 2016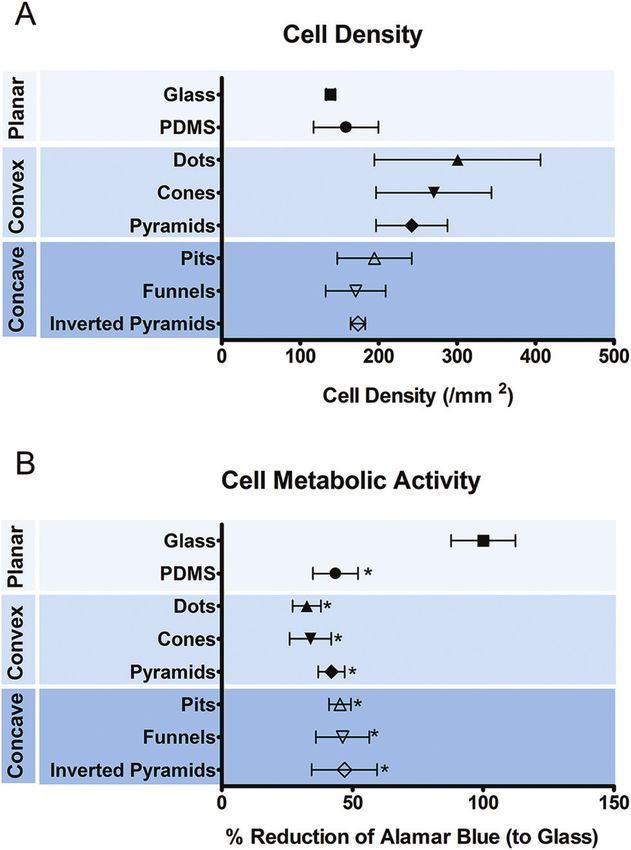
View Article Online

                                                                                                   Biomaterials Science                                                                                                                         Paper
             This article is licensed under a Creative Commons Attribution 3.0 Unported Licence.
Open Access Article. Published on 21 September 2016. Downloaded on 10/21/2021 9:08:43 AM.

                                                                                                   Fig. 4 Confocal microscopy images of top and side views (yellow and red rectangles and arrows) of macrophages in glass (A–C) and planar PDMS
                                                                                                   (D–F), convex (G–I) or concave (J–L) PDMS topographies. Side views reveal differences in the cross-sectional shape of cells on convex and concave
                                                                                                   topographies. AlexaFluor488-phalloidin and DAPI stained the actin cytoskeleton green and nucleus blue, respectively.

                                                                                                   effect of polarization in cell AR is not as clear, and it appears         (CD197, CD206), effector cytokines (TNF-alpha, IL-10) and
                                                                                                   to be substrate dependent as it was only influenced by M2                chemokines (CCL22, CXCL10) expressed by particular M1 or
                                                                                                   polarization on glass. No effect on cell orientation was                  M2 macrophage populations (Fig. 8). When subjected to M1
                                                                                                   observed in response to chemical stimulation.                            chemical polarization, we observed an up-regulation in all
                                                                                                                                                                            three inflammatory markers and of CCL22 anti-inflammatory
                                                                                                   3.4 Macrophage polarization in response to topographic and               markers, together with a down-regulation of CD206 both on
                                                                                                   chemical stimulation                                                     planar PDMS and glass. M2 chemical polarization resulted in
                                                                                                   Macrophage polarization in response to topographic and                   an up-regulation of CD206 on both planar surfaces, whereas
                                                                                                   chemical stimulation was evaluated by using surface markers              IL-10 expression was slightly down-regulated, and CCL22

                                                                                                   This journal is © The Royal Society of Chemistry 2016                                                      Biomater. Sci., 2016, 4, 1562–1573 | 1567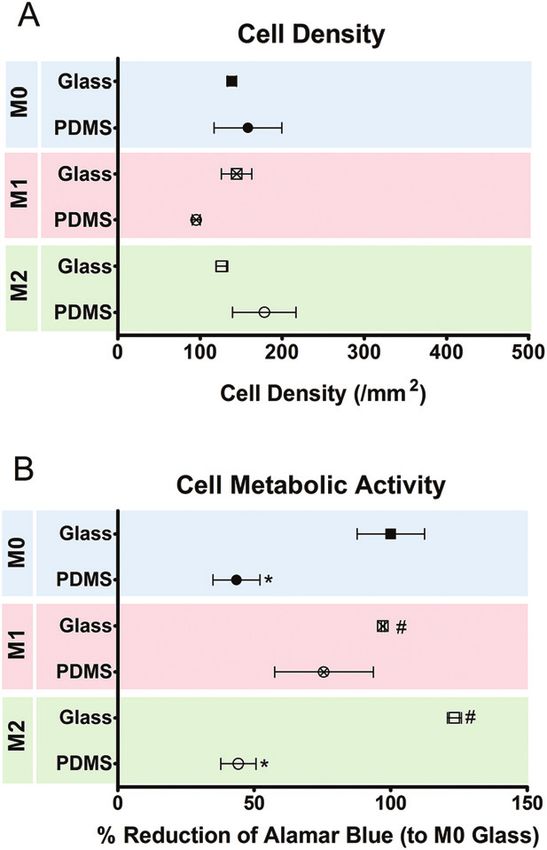
View Article Online

                                                                                                   Paper                                                                                                                             Biomaterials Science
             This article is licensed under a Creative Commons Attribution 3.0 Unported Licence.
Open Access Article. Published on 21 September 2016. Downloaded on 10/21/2021 9:08:43 AM.

                                                                                                   Fig. 5 Morphometric evaluation of macrophage adaptation to different surfaces. Cell shape was quantified in terms of individual cell area (A), circu-
                                                                                                   larity (B), aspect ratio (C) and orientation (D). Data are shown as mean ± standard error of the mean. *p < 0.05, vs. glass control; #p < 0.05, vs. PDMS
                                                                                                   control; +P < 0.05, vs. concave counterpart.

                                                                                                   expression was up-regulated in cells on glass, but not on                    In this study, we hypothesized that micro-sized convex and
                                                                                                   PDMS. Macrophages cultured on PDMS in M0 medium pre-                         concave surface topographies would induce distinct morpho-
                                                                                                   sented a distinct state to those cultured on glass, characterized            logical deformations to macrophages, and that those would
                                                                                                   by a down-regulation of CXCL10 and CD197 (n/d) and a slight                  dictate a change in the way the cell responds to the surface.
                                                                                                   up-regulation of anti-inflammatory markers CD206 and IL-10.                  We have extended the subject of our study by including
                                                                                                   Surface topography does not seem to exert a relevant effect on                different types of convex and concave topographies, so that the
                                                                                                   the expression of the selected genes, compared to planar                     impact of factors such as the base geometry and the curvature
                                                                                                   PDMS.                                                                        of the lateral walls could be simultaneously investigated. We
                                                                                                                                                                                have produced different surfaces topographies by KrF Excimer
                                                                                                                                                                                laser micromachining with half-tone masks. While we used
                                                                                                   4.      Discussion                                                           the technique for the production of the master topographies,
                                                                                                                                                                                it is also suitable for direct creation of the topographies in a
                                                                                                   The control of cell function through substrate/implant topo-                 wide variety of materials (i.e. from ceramics, glasses to poly-
                                                                                                   graphy is an attractive method for the improvement of the                    mers) making it an appealing method for future systematic
                                                                                                   overall biological response to implants. Albeit extensive                    investigations on the role of topography versus chemistry in
                                                                                                   research on the topic, there is still a lack of definition on                macrophage function. In the current study, the selection of
                                                                                                   which are the geometrical parameters that can truly influence                this production method permitted the creation of the desired
                                                                                                   cell response to a material. Furthermore, the influence of topo-             topographies with a strict control over the shape, distribution
                                                                                                   graphy on immune cells has only been seldom addressed,                       and dimension of the topographic features.
                                                                                                   which is surprising as these cells play a determinant role in                    The quantitative and qualitative analysis of the cell shape
                                                                                                   how, and whether at all, the implant is accepted by the body.                adaptation to the different topographies showed an evident

                                                                                                   1568 | Biomater. Sci., 2016, 4, 1562–1573                                                             This journal is © The Royal Society of Chemistry 2016
View Article Online
Biomaterials Science Paper
also induced, as predicted, the development of characteristic
cell shapes, but no significant differences were observed in
response to the individual topographic features within each
group. Changes in morphology were not reflected by signifi-
cant changes in the number of cells attached to the substrate
and neither in their metabolic state, when compared to planar
PDMS.
On the other hand, the substrate material set as control,
played a significant role both in the shape and metabolic
This article is licensed under a Creative Commons Attribution 3.0 Unported Licence.
Open Access Article. Published on 21 September 2016. Downloaded on 10/21/2021 9:08:43 AM.
activity of cells. Cells cultured on glass showed a higher degree
of spreading, decreased circularity and increased metabolic
activity compared to PDMS. The increased spreading on glass
– interestingly correlating with an increased TNF-alpha pro-
duction – compared to other materials (chitosan, polyurethane
and hyaluronic acid) has been shown previously.40 The
authors in this study explained the differences based on the
chemical nature of the surfaces; i.e. that was the difference
between the negatively charged nature of the glass, relatively
inert polyurethane, positively and negatively charged polymer
brushed that induced differences in the adhesiveness of the
Fig. 6 Density and metabolic state of macrophages after 5 days of cells. We used PDMS in this study, which also differs greatly
culture on planar glass and PDMS surfaces with or without chemical from glass in its electrochemical properties, and this may be
polarization, as determined by cell counting (A) and alamar blue activity
the reason for the differences in cell morphology observed in
(B), respectively. Data are shown as mean ± standard error of the mean;
*p < 0.05 vs. M0 glass, \p < 0.05 vs. M0 PDMS. the present study.
It can further not be excluded that the differentiation of
monocytes to macrophages on TCP in our study resulted in
macrophages with a different phenotypical plasticity when
decrease in cell spreading, independently of the shape of topo- compared to cells differentiated on PDMS. Such different
graphy investigated in the present work. The effect of topo- approach might theoretically result in macrophages with
graphy on macrophage size and shape seems to be largely different sensitivity to chemical stimulation or topography.
dependent on the scale of topography, geometric parameters, However, macrophages cultivated on glass as well as smooth
material and cell type. Poly(methyl methacrylate)36 grooves or structured PDMS substrates in our study were of the same
(0.5 µm depth, 10 µm width) promoted an increase in murine origin and differentiation state and show the discrepancy
macrophages mean area compared to flat surface from 380 to between the morphological adaptations as well as response to
650 µm2. On the other hand, similar structures (0.8–1.33 µm chemical induction of polarization.
depth, 10 µm width) in Ti had no significant impact in macro- Chemical polarization induced changes in cell morphology
phage spreading.37 These examples provide evidence that not independently of the substrate material. The relationship
only topography can have a significant impact in the size of between chemical polarization and changes in the morphology
macrophages, but also that this capability depends on factors of macrophages has been shown previously.11,12,41 McWhorter
other than the geometric parameters of the topographic fea- et al.12 reported that M2 polarization induced murine macro-
tures. The decrease in spreading that has been observed in phage elongation, but no changes in cell size. Nishio et al.42
response to the topographies in the present work and those reported a similar observation with human cells for IL-4 polar-
reported elsewhere38,39 may indicate that there is possibly a ized cells, but showed in addition that tumor-associated
specific combination of material and topography that converts macrophages expressed M2 markers, increased area but not
the discontinuities into energy barriers which hinder cell elongation. Others11,43 have also shown that primary human
spreading.28 Other systems11,17,22 may facilitate cell spreading monocyte-derived macrophages expressing M2 markers
by a combination of properties that lead to increase in the display a more irregular, but not elongated morphology. In our
density of contact points, protein adsorption and/or due to system, we observed an increase in cell spreading ( particularly
contact guidance mechanisms. The role of the topographic fea- for M2) and a slight decrease in AR, which signifies an
tures as energy barriers is supported by the observation that increase in cell irregularity but not elongation.
cells preferentially adhered and spread either within or It is possible that the discrepancy between the morpho-
between the features depending on whether the topography logical adaptations in our study and those reported by
was concave or convex, respectively. Bartneck et al.25 showed McWhorter et al.12 result from substrate chemistry or inter-
similar behavior of human peripheral blood-derived macro- species differences; i.e. between human and murine macro-
phages in response to perfluoropolyether posts (20 µm height, phages. The intracellular mechanisms that govern changes in
20 µm diameter). Convex versus concave surface topography macrophage shape in response to chemical polarization are
This journal is © The Royal Society of Chemistry 2016 Biomater. Sci., 2016, 4, 1562–1573 | 1569View Article Online
Paper Biomaterials Science
This article is licensed under a Creative Commons Attribution 3.0 Unported Licence.
Open Access Article. Published on 21 September 2016. Downloaded on 10/21/2021 9:08:43 AM.
Fig. 7 Morphometric evaluation of macrophage adaptation in response to chemical polarization on two different planar surface materials (glass
and PDMS). Cell shape was quantified in terms of individual cell area (A), circularity (B), aspect ratio (C) and orientation (D). Data are shown as mean
± standard error of the mean. *p < 0.05, vs. M0 glass control; #p < 0.05, vs. M0 PDMS control.
not well understood, and it is therefore possible that other showed a clear distinguishable response to M2 polarization.
reasons contribute to the disparity of behaviors between the IL-10 gene expression was instead slightly down-regulated, and
different studies. One of the most obvious reasons why macro- CCL22 expression was up-regulated on glass, not on PDMS,
phages would adapt different shapes is to facilitate their and also appeared up-regulated upon M1 polarization. CCL22
ability to migrate, phagocyte and degrade matrix degradation. is a chemokine that attracts Th2 cells and is expressed in
All of these functions depend on the intracellular organization M2 macrophages. Nonetheless, as shown by El Chartouni and
of actin. Thus, the importance of actin modulators such as Rac Rehli,48 the exposure of macrophages to the strong innate acti-
is under investigation and has already proved to be important vation signals (LPS) can alter the typical cytokine expression in
modulators of macrophage function.44 However, other both phenotypes. They showed that up-regulation of CCL22
mechanisms, such as the inhibition of histone deacetylases can occur even in M1 macrophages when polarization is
explored by Cabanel et al.45 can also lead to a change in macro- primed by both INF-γ and LPS, but not with INF-γ alone. In
phage shape and polarization, suggesting the existence of the same study, the authors also failed to detect an increased
nuclear epigenetic mechanisms in the regulation of cell shape. production of IL-10 in response to exposure to IL-4 alone. The
In the last stage of our study, we tried to establish whether clear observation of an up-regulation of CD206, an important
differences in cell morphology affected the gene expression of M2 associated receptor, indicates that nonetheless an alterna-
selected genes, known to be constitutively expressed in M1 or tive state of polarization was induced in spite of the lack of
M2 macrophages (reviewed in ref. 46 and 47). We showed a change in the expression of IL-10 and CCL22. Differences
clear polarization towards an M1 phenotype in response to M1 between the macrophage phenotype in basal medium were
chemical polarization, as detected by an up-regulation of all detected between glass and PDMS. Under this culture con-
inflammatory markers selected. Interestingly, of the anti- dition, cells on PDMS showed a decrease in the inflammatory
inflammatory markers selected for this study, only CD206 state compared to glass, since CXCL10 was down-regulated
1570 | Biomater. Sci., 2016, 4, 1562–1573 This journal is © The Royal Society of Chemistry 2016View Article Online
Biomaterials Science Paper
This article is licensed under a Creative Commons Attribution 3.0 Unported Licence.
Open Access Article. Published on 21 September 2016. Downloaded on 10/21/2021 9:08:43 AM.
Fig. 8 Quantitative reverse transcription-PCR analysis of mRNA expression of (A) pro- and (B) anti-inflammatory genes in macrophages cultured on
different surfaces, with or without chemical polarization. Data normalized to GAPDH mRNA. Values represent fold change relative to M0 glass
control. Data are shown as mean ± standard error of the mean in a logarithmic scale. Genes considered up-regulated for fold changes ≥2 and
down-regulated for fold changes ≤0.5. The dotted lines represent the regulation thresholds set at 2-fold change. When no bar is shown it means
the gene was not detected (n/d).
and CD206 and IL-10 slightly up-regulated. The indication that been associated with an increase in the reductive environment
cells on glass are more inflammatory than on PDMS, correlates (discussed in ref. 49).
with the observed increase in metabolic activity and cell size. The differences in topography-induced morphology did not
As discussed earlier, the increased spreading on glass has promote any significant changes in the gene expression of the
been previously associated with an increase in the production selected pro- and anti-inflammatory genes. It is postulated that
of the inflammatory TNF-alpha cytokine.40 We have used resa- cell sensitivity to surface topography is promoted by changes
zurin reduction to resorufin as a way to estimate the metabolic in cell adhesion, cytoskeleton formation or nuclear shape and
activity of macrophages, which means we effectively measured orientation. In the present study we did not observe topo-
cellular redox metabolism. Increased inflammation has also graphy-induced nucleus deformation. In addition, and unlike
This journal is © The Royal Society of Chemistry 2016 Biomater. Sci., 2016, 4, 1562–1573 | 1571View Article Online
Paper Biomaterials Science
other studies,12,25 our topographies did not promote dramatic for the laser micromachining experiments, and Ursina Tobler
changes in cell elongation. Thus, only changes in cell cyto- with RT-PCR.
skeleton and/or degree of adhesion might lead to the results
presented here. However, macrophages have a distinct cyto-
skeleton arrangement compared to that of mesenchymal cells, References
such as fibroblasts. The development of actin stress fibers and
focal adhesions is less frequent in macrophages than in fibro- 1 J. M. Anderson, Cardiovasc. Pathol., 1993, 2, 33–41.
blasts50 whereas podosomes, distinct circular adhesion struc- 2 T. Kruis, A. Batra and B. Siegmund, Front. Immunol., 2013,
tures, are only formed in the earlier.51 Podosomes found in 4, 510.
This article is licensed under a Creative Commons Attribution 3.0 Unported Licence.
Open Access Article. Published on 21 September 2016. Downloaded on 10/21/2021 9:08:43 AM.
the basal face of the cell exert perpendicular forces to the sub- 3 B. N. Brown, R. Londono, S. Tottey, L. Zhang, K. A. Kukla,
strate, sense the substrate stiffness and increase their force in M. T. Wolf, K. A. Daly, J. E. Reing and S. F. Badylak, Acta
response, which is a hallmark of mechanosensing activity.51 Biomater., 2012, 8, 978–987.
The differences in stiffness between glass and PDMS may 4 E. M. Sussman, M. C. Halpin, J. Muster, R. T. Moon and
result in different activation of mechanosensing pathways, B. D. Ratner, Ann. Biomed. Eng., 2013, 1–9.
constituting another possible mechanism leading to the 5 B. K. K. Teo, S. T. Wong, C. K. Lim, T. Y. S. Kung, C. H. Yap,
diverse macrophage responses to glass and PDMS. However, Y. Ramagopal, L. H. Romer and E. K. F. Yim, ACS Nano,
this different mechanotransduction process may also mean 2013, 7, 4785–4798.
that macrophages differ in sensitivity to substrate topographic 6 R. J. McMurray, A. K. T. Wann, C. L. Thompson,
characteristics compared to mesenchymal cells, and that in an J. T. Connelly and M. M. Knight, Sci. Rep., 2013, 3.
already low state of adhesion to the soft PDMS substrate, fail 7 C. T. McKee, V. K. Raghunathan, P. F. Nealey, P. Russell
to respond to the distinct cell body deformations promoted by and C. J. Murphy, Biophys. J., 2011, 101, 2139–2146.
concave and convex topographies. In support of this notion is 8 S. Pagliara, K. Franze, C. R. McClain, G. W. Wylde,
the observation that M2 macrophages reach an average spread- C. L. Fisher, R. J. M. Franklin, A. J. Kabla, U. F. Keyser and
ing area of approx. 600 µm2 (Fig. 7A) whereas macrophages in K. J. Chalut, Nat. Mater., 2014, 13, 638–644.
all PDMS topographies haveView Article Online
Biomaterials Science Paper
21 B. Wójciak-Stothard, A. Curtis, W. Monaghan, 37 T. U. Luu, S. C. Gott, B. W. K. Woo, M. P. Rao and W. F. Liu,
K. MacDonald and C. Wilkinson, Exp. Cell Res., 1996, 223, ACS Appl. Mater. Interfaces, 2015, 7, 28665–28672.
426–435. 38 A. M. B. Collie, P. C. S. Bota, R. E. Johns, R. V. Maier and
22 B. Wójciak-Stothard, Z. Madeja, W. Korohoda, A. Curtis P. S. Stayton, J. Biomed. Mater. Res., Part A, 2011, 96, 162–
and C. Wilkinson, Cell Biol. Int., 1995, 19, 485–490. 169.
23 T. D. Zaveri, N. V. Dolgova, B. H. Chu, J. Lee, J. Wong, 39 S. Ghrebi, D. W. Hamilton, J. D. Waterfield and
T. P. Lele, F. Ren and B. G. Keselowsky, Biomaterials, 2010, D. M. Brunette, J. Biomed. Mater. Res., Part A, 2013, 101,
31, 2999–3007. 2118–2128.
24 K. A. Barth, J. D. Waterfield and D. M. Brunette, J. Biomed. 40 H.-S. Lee, S. J. Stachelek, N. Tomczyk, M. J. Finley,
This article is licensed under a Creative Commons Attribution 3.0 Unported Licence.
Open Access Article. Published on 21 September 2016. Downloaded on 10/21/2021 9:08:43 AM.
Mater. Res., Part A, 2013, 101, 2679–2688. R. J. Composto and D. M. Eckmann, J. Biomed. Mater. Res.,
25 M. Bartneck, V. A. Schulte, N. E. Paul, M. Diez, Part A, 2013, 101, 203–212.
M. C. Lensen and G. Zwadlo-Klarwasser, Acta Biomater., 41 V. Ballotta, A. Driessen-Mol, C. V. C. Bouten and
2010, 6, 3864–3872. F. P. T. Baaijens, Biomaterials, 2014, 35, 4919–4928.
26 M. Mohiuddin, H.-A. Pan, Y.-C. Hung and G. S. Huang, 42 M. Nishio, N. Urakawa, M. Shigeoka, N. Takase,
Nanoscale Res. Lett., 2012, 7, 1–9. Y. Ichihara, N. Arai, Y. Koma and H. Yokozaki, Pathol. Int.,
27 S. Lee, J. Choi, S. Shin, Y.-M. Im, J. Song, S. S. Kang, 2016, 66, 83–93.
T.-H. Nam, T. J. Webster, S.-H. Kim, D. Khang, S. Lee, 43 V. Ballotta, A. Driessen-Mol, C. V. C. Bouten and
J. Choi, S. Shin, Y.-M. Im, J. Song, S. S. Kang, T.-H. Nam, F. P. T. Baaijens, Biomaterials, 2014, 35, 4919–4928.
S.-H. Kim and D. Khang, Acta Biomater., 2011, 7, 2337–2344. 44 S. Joshi, A. R. Singh, M. Zulcic, L. Bao, K. Messer,
28 K. Anselme, L. Ploux and A. Ponche, in Surface and T. Ideker, J. Dutkowski and D. L. Durden, PLoS One, 2014,
Interfacial Aspects of Cell Adhesion, CRC Press, 2011, pp. 9, e95893.
43–64. 45 M. Cabanel, C. Brand, M. C. Oliveira-Nunes, M. P. Cabral-
29 J. Y. Park, D. H. Lee, E. J. Lee and S.-H. Lee, Lab Chip, 2009, Piccin, M. F. Lopes, J. M. Brito, F. L. de Oliveira, M. C. El-
9, 2043–2049. Cheikh and K. Carneiro, PLoS One, 2015, 10, e0132984.
30 M.-H. Kim, Y. Sawada, M. Taya and M. Kino-oka, J. Biol. 46 A. Mantovani, A. Sica, S. Sozzani, P. Allavena, A. Vecchi and
Eng., 2014, 8, 1–9. M. Locati, Trends Immunol., 2004, 25, 677–686.
31 A. M. Green, J. A. Jansen, J. Van der Waerden and A. F. Von 47 F. O. Martinez, L. Helming and S. Gordon, Annu. Rev.
Recum, J. Biomed. Mater. Res., 1994, 28, 647–653. Immunol., 2009, 27, 451–483.
32 A. M. Schmidt, S. R. Fagerer, K. Jefimovs, F. Buettner, 48 C. El Chartouni and M. Rehli, Immunobiology, 2010, 215,
C. Marro, E. C. Siringil, K. L. Boehlen, M. Pabst and 780–787.
A. J. Ibanez, Analyst, 2014, 139, 5709–5717. 49 S. K. Biswas and A. Mantovani, Cell Metab., 2012, 15, 432–
33 S. Tsuchiya, Y. Kobayashi, Y. Goto, H. Okumura, S. Nakae, 437.
T. Konno and K. Tada, Cancer Res., 1982, 42, 1530–1536. 50 W. E. Allen, G. E. Jones, J. W. Pollard and A. J. Ridley, J. Cell
34 M. V. Lancaster and R. D. Fields, US 5501959, 1996. Sci., 1997, 110, 707–720.
35 K. J. Livak and T. D. Schmittgen, Methods, 2001, 25, 402– 51 A. Labernadie, A. Bouissou, P. Delobelle, S. Balor,
408. R. Voituriez, A. Proag, I. Fourquaux, C. Thibault, C. Vieu,
36 B. Wójciak-Stothard, Z. Madeja, W. Korohoda, A. Curtis R. Poincloux, G. M. Charrière and I. Maridonneau-Parini,
and C. Wilkinson, Cell Biol. Int., 1995, 19, 485–490. Nat. Commun., 2014, 5.
This journal is © The Royal Society of Chemistry 2016 Biomater. Sci., 2016, 4, 1562–1573 | 1573You can also read