Nonrigid Bookshelf Kinematics of Northeastern Tibet: Constrains from Fault Slip Rates around the Qinghai Lake and Chaka-Gonghe Basins
←
→
Page content transcription
If your browser does not render page correctly, please read the page content below
GeoScienceWorld
                Lithosphere
                Volume 2021, Article ID 4115729, 22 pages
                https://doi.org/10.2113/2021/4115729

                Research Article
                Nonrigid Bookshelf Kinematics of Northeastern Tibet:
                Constrains from Fault Slip Rates around the Qinghai Lake and
                Chaka-Gonghe Basins

                             Chen Gan,1,2,3 Ai Ming,3 Zheng Wenjun ,1,2,3 Bi Haiyun,3 Liu Jinrui,3 Zhang Yipeng,1,2,3
                             Ge Weipeng,4 Zhang Dongli,1,2,3 and Huang Rong1,2,3
                             1
                               Guangdong Provincial Key Laboratory of Geodynamics and Geohazards, School of Earth Sciences and Engineering, Sun Yat-
                               Sen University, Guangzhou 510275, China
                             2
                               Southern Marine Science and Engineering Guangdong Laboratory (Zhuhai), Zhuhai 519082, China
                             3
                               State Key Laboratory of Earthquake Dynamics, Institute of Geology, China Earthquake Administration, Beijing 100029, China
                             4
                               Gansu Lanzhou Geophysics National Observation and Research Station, Lanzhou 730000, China

                             Correspondence should be addressed to Zheng Wenjun; zhengwenjun@mail.sysu.edu.cn

                             Received 20 May 2021; Accepted 24 August 2021; Published 23 September 2021

                             Academic Editor: Songjian Ao

                             Copyright © 2021 Chen Gan et al. Exclusive Licensee GeoScienceWorld. Distributed under a Creative Commons Attribution
                             License (CC BY 4.0).

                             The Elashan fault (ELSF) and Qinghainanshan fault (QHNF), two major faults developed around the Qinghai Lake and
                             Chaka-Gonghe basins, are of great importance for investigating the deformation model of the internal northeastern Tibetan
                             Plateau. However, their late Pleistocene slip rates remain poorly constrained. In this study, we combine high-resolution
                             topography acquired from unmanned aerial vehicles (UAV) and geomorphological dating to calculate the slip rates of the
                             two faults. We visited the central ELSF and western QHNF and measured displaced terraces and stream channels. We
                             collected 10Be samples on the surface of terraces to constrain the abandonment ages. The dextral slip rate of the central
                             segment of the Elashan fault is estimated to be 2:6 ± 1:2 mm/yr. The uplift rates since the late Pleistocene of the Elashan and
                             Qinghainanshan faults are 0:4 ± 0:04 mm/yr and 0:2 ± 0:03 mm/yr, respectively. Comparing the geological rates with the newly
                             published global positioning system (GPS) rates, we find that the slip rates of the major strike-slip faults around the Qinghai
                             Lake and Chaka-Gonghe basins are approximately consistent from the late Pleistocene to the present day. The overall NE
                             shortening rates by summing up the geological slip rates on major faults between the East Kunlun and Haiyuan faults are
                             ~3.4 mm/yr, smaller than the geodetic shortening rates (~4.9 to 6.4 mm/yr), indicating that distributed deformation plays an
                             important role in accommodating the regional deformation. By analyzing the geometrical and kinematic characteristics of the
                             major faults surrounding the basins, we suggest that the kinematic deformation of the internal northeastern Tibet is a nonrigid
                             bookshelf model that consists of counterclockwise rotation (~0.8° Myr-1) and distributed thrusting.

                1. Introduction                                                                              the Altyn Tagh fault (ATF), Haiyuan fault (HYF), and East
                                                                                                             Kunlun fault (EKLF), states that northeastern Tibet moves
                The northeastern Tibetan Plateau experienced intensive                                       eastward as a rigid block with no internal deformation and
                deformation during the late Cenozoic in response to the                                      rotation [8–14]. The left-lateral simple shear model suggests
                northward motion of the Indian plate with respect to Eurasia                                 that the kinematics of northeastern Tibet can be explained
                [1–7]. Two different end-member kinematic models have                                         by a combination of rotation and shortening within the
                been proposed to explain the regional deformation: the                                       blocks with little crust materials moving eastward [15–25].
                model of lateral crustal extrusion and left-lateral simple                                   England and Molnar [21] suggest that the crustal blocks
                shear. Lateral crustal extrusion, deduced from the high slip                                 within the large left-lateral faults are a manifestation of
                rates (10-30 mm/yr) on the major left-lateral faults including                               north-striking right-lateral simple shear zone and may rotate

Downloaded from http://pubs.geoscienceworld.org/gsa/lithosphere/article-pdf/doi/10.2113/2021/4115729/5415115/4115729.pdf
by guest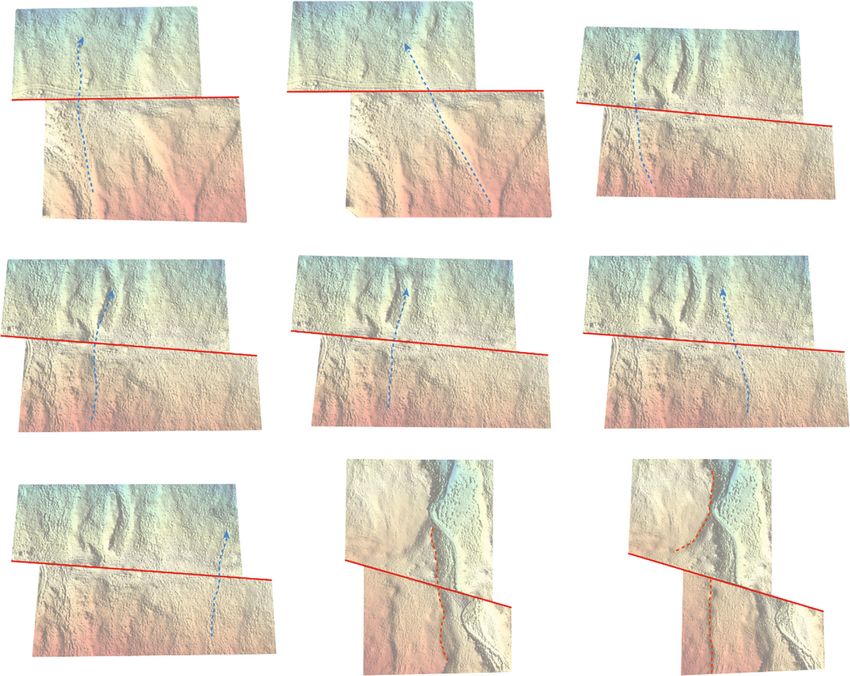
2                                                                                                                                              Lithosphere

                clockwise at 1-2 deg/Myr. Based on England and Molnar                                        measure the horizontal and vertical offsets recorded on the
                [21], Zuza and Yin [24] proposed nonrigid bookshelf rota-                                    faults using two self-developed MATLAB-based graphical
                tion to explain how the major left-slip faults and thrust                                    user interfaces (GUIs)—“PointFit” and “FaultRecovery”
                belts accommodate the deformation in northeastern Tibet.                                     tools. Combined with cosmogenic nuclide 10Be dating
                Similar bookshelf rotation has also been applied to                                          results, we recalculated the lateral and vertical slip rates
                explain the deformation kinematics of Iran [26]. How-                                        of the ELSF, and the vertical slip rates of the QHNF.
                ever, the style and magnitude of the deformation in                                          Based on previous studies of fault slip rates and newly
                northeastern Tibet vary considerably along major strike-                                     published GPS velocities around the basins, we further
                slip faults. A simple, uniform nonrigid bookshelf model                                      discuss the kinematic deformation of the internal north-
                cannot adequately explain them all. The secondary tec-                                       eastern Tibet.
                tonic structures between the major strike-slip faults are
                key to understand the kinematic model of the internal                                        2. Active Tectonics around the Qinghai Lake
                northeastern Tibet.                                                                             and Chaka-Gonghe Basin
                    The Qinghai Lake and Chaka-Gonghe basins are small
                blocks developed between the HYF and the EKLF. The                                           The Qinghai Lake and Chaka-Gonghe basins are located in
                Elashan fault (ELSF), Riyueshan fault (RYSF), Qinghannan-                                    the center of northeastern Tibet. They are bounded by a
                shan fault (QHNF), and Gonghenanshan fault (GHNF)                                            series of faults (Figure 1), many of which are seismically
                around the basins are secondary tectonic structures devel-                                   active during the late Pleistocene to the Holocene [52]. The
                oped under NE compression and dextral shear [22, 27]. If                                     region is characterized by simple shear as a result of left-
                the nonrigid bookshelf model is correct, we would expect                                     lateral motion on the Haiyuan and East Kunlun faults
                counterclockwise rotation and consistent right-lateral strike                                [21, 22, 27]. The HYF, the northern boundary of the Qinghai
                slip along the major strike-slip faults. There are two com-                                  Lake basin, striking towards 100° to 105°, is ~1000 km long.
                mon ways to quantify tectonic rotation, paleomagnetism                                       The late Pleistocene slip rates of the central segment of the
                and global positioning system (GPS). Due to the difficulty                                     HYF is 5-8 mm/yr [49, 50, 53–55] (Figures 1 and 2), and
                of collecting paleomagnetic samples and the short-time                                       the rates gradually decrease to 1-2 mm/yr towards the NW,
                GPS observations relative to the presumably low rotation                                     where the fault ends in the east of the Hala Lake [56]. The
                rate, the rotation rate has not been determined [28–35].                                     southern boundary of Chaka-Gonghe basin is the East
                Obtaining the slip rates of the major strike-slip faults can                                 Kunlun fault (EKLF), nearly parallel to the HYF, with a total
                be used as an indirect method to constrain the rate of rota-                                 length of ~1200 km. Since the late Quaternary, the EKLF has
                tion. Displaced alluvial landforms show right-lateral slip of                                also been characterized by strong sinistral motion, and the
                the ELSF and RYSF, and the rates were constrained to be                                      rates decreased from ≥10 mm/yr to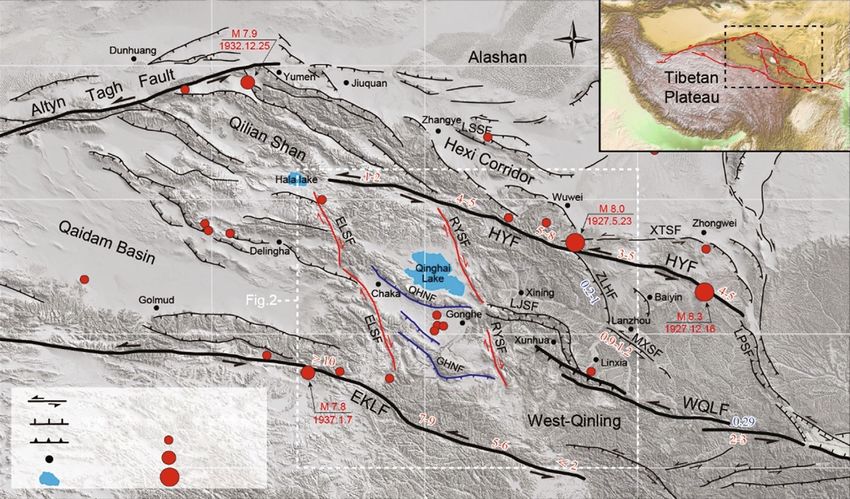
Lithosphere                                                                                                                                                   3

                           92°                                  96°                                     100°                           104°                           108°E

                             (b)                                                                                               N                                     (a)
                                                                                                                                                               (b)
                    40°N
                    38°
                    36°

                                       Strike-slip fault 1-2 Strike-slip rate
                                       Normal fault 1-2 Vertical-slip rate
                                       Thrust fault          7 > Ms ≥ 6
                                       City                  8 > Ms ≥ 7
                    34°

                                       Lake                  8.9 > Ms ≥ 8

                Figure 1: Topographic map around the research area. (a) The major strike-slip fault developed in the northeastern Tibet. (b) The active
                faults in the northeastern Tibetan Plateau (the Shuttle Radar Topography Mission digital elevation model is downloaded from https://lta
                .cr.usgs.gov/SRTM, and earthquake data is downloaded from https://earthquake.usgs.gov/earthquakes). HYF: Haiyuan fault; EKLF: East
                Kunlun fault; WQLF: West Qingling fault; QHNF: Qinghainanshan fault; GHNF: Gonghenanshan fault; LJSF: Lajishan fault; ZLHF:
                Zhuanglanghe fault; MXSF: Maxianshan fault; XTSF: Xiangshan-Tianjingshan fault; LSSF: Longshoushan fault. The fault slip rates are
                compiled from previous studies [25, 27, 36, 39, 49, 50, 53–61].

                Qinling faults were also considered to remain active since                                   3. Geomorphic Analysis Based on
                the late Pleistocene [62–64] (Figure 2).                                                        High-Resolution Topographic Data
                    There are also a group of thrust faults developed around
                the Qinghai Lake and Chaka-Gonghe basins. The Qinghai-                                       3.1. Acquisition of High-Resolution DEMs Using UAV. High-
                nanshan fault (QHNF) and Gonghenanshan fault (GHNF)                                          resolution topographic data are important for geomorphic
                are the major components. Both faults, trending approxi-                                     analysis, such as identification of alluvial landforms and
                mately NWW, terminated at the ELSF (west) and RYSF                                           measurements of offset features [66]. To obtain high-
                (east) [39]. A series of fault scarps have been found on the                                 quality DEMs, we use a quadcopter Motoar-Sky MS670
                late Quaternary alluvium fans and terraces along the western                                 unmanned aerial vehicle (UVA) at three field sites, ELS1,
                segment of the QHNF [65]. Combined with cosmogenic                                           ELS2, and QHNS (see Figure 2 for locations). The UVA is
                nuclide 10Be abandonment ages of a displaced alluvial fan,                                   equipped with a SONY ILCE-QX1 lens camera (20 MPix)
                the shortening rate of the QHNF was calculated to be                                         with a focal length of 16 mm. Previous research has sug-
                ~0.1 mm/yr since the late Pleistocene [39]. The vertical slip                                gested that the overlap of adjacent images should be no less
                rate of the GHNF during the late Pleistocene is unknown.                                     than 60% [67]. The forward overlap should be 60%–80%,
                Restoration of shortening along balanced cross-sections                                      and the side overlap should be within 15%–60% [68]. In
                and growth strata suggests that the late Cenozoic shortening                                 our study, the viewing angle is approximately normal to
                rates of the QHNF and GHNF are ~0.2 mm/yr and                                                the ground, with a flying height of ~100 m. The forward
                0.7 mm/yr, respectively [39]. The similar rates during differ-                                and side overlaps are 80% and 60%, respectively. The pixel
                ent periods indicate that the Chaka-Gonghe basin has gone                                    size of the CCD is 4.4 μm, corresponding to a spatial resolu-
                through stable NE shortening since the late Cenozoic. The                                    tion of ~2.7 cm for the UAV photographs (Figure 3(a)).
                low slip rates of the QHNF and GHNF are also supported                                       Although many UAV systems are equipped with GPS, the
                by their low seismicity. Historical earthquake catalogue                                     measurements are subject to shifting and tilting due to
                shows that there are no earthquakes with M ≥ 7, and only                                     weather conditions., e.g., strong wind. To accurately obtain
                6 earthquakes with M ≥ 6 around the region in the past                                       for the orientation parameters, i.e., the location and rotation
                100 years (Figure 1).                                                                        of the camera, we collected ground control points (GCPs)

Downloaded from http://pubs.geoscienceworld.org/gsa/lithosphere/article-pdf/doi/10.2113/2021/4115729/5415115/4115729.pdf
by guest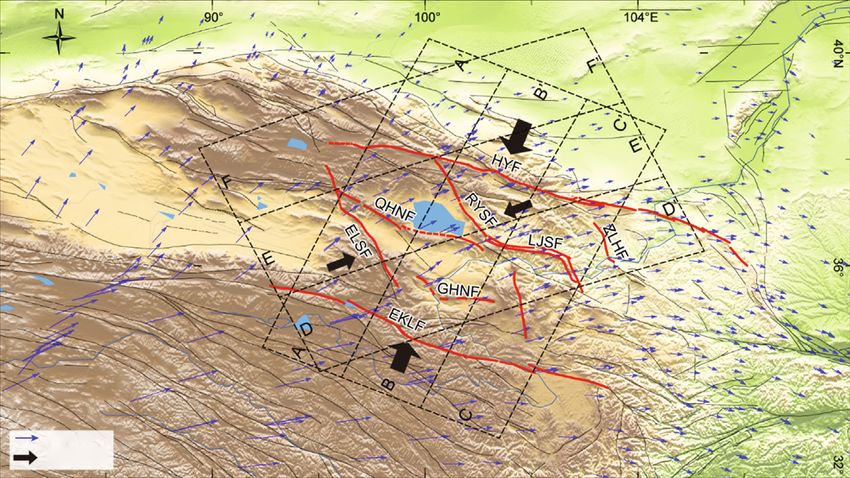
4                                                                                                                                                                     Lithosphere

                                 98°                              99°               100°                      101°               102°                            103°E
                                                                                                                                                Late Pleistocene slip rate
                                                                                                                                        1   Yuan et al., 2008    10   Yuan et al., 2011
                     38°N

                                                                                                                                        2   He et al., 2000      11   Zheng et al., 2016
                                                                                                                                        3   Jiang et al., 2017   12   Cheng et al., 2021
                                                                                                                                        4   Guo et al., 2017     13   Cradd ock et al., 2014
                                                                                                                                        5   Yuan et al., 1998    14   Van der Woerd et al., 2002
                                                                                                                                        6   Shao et al., 2020    15   Harkins et al., 2010
                                                                                                                                        7   Yao et al., 2019     16   Li et al., 2011
                                                                                                                                        8   He et al., 1994      17   Kirby et al., 2007
                                                                                                                                        9   Liu et al., 2018          Strike-slip rate
                                                                                                                                                                      Vertical-slip rate
                     37°
                     36°
                     35°

                                                           Research sites
                                       Strike-slip fault
                                                           City
                                       Normal fault
                                                           Lake
                                       Thrust fault        Quaternary basin
                     34°

                Figure 2: Regional topographic map and major active faults in the study area (the location is shown in Figure 1). Fault traces are modified
                from [36, 39]. Late Pleistocene slip rates are labeled along the faults.

                using a Trimble R8 differential global positioning system                                     ping. The derived DOM and DEM are shown in
                (dGPS). Each GCP is a red checkerboard with a side length                                    Figures 3(c) and 3(e). From the high-resolution DEM and
                of 50 cm, which can be identified easily in the photographs                                   DOM, we identify a linear fault trace and three terraces,
                (example in Figure 3(a)). The nominal accuracy of the dGPS                                   i.e., T1 (lowest stratigraphic position and youngest) to T3
                measurements is 1-5 cm [69]. We process the aerial photo-                                    (highest position and oldest) (Figure 3(f)). T2 can be subdi-
                graphs using the Structure-from-Motion (SfM) technique                                       vided into two secondary terrace surfaces: T2a and T2b
                built in Agisoft PhotoScan Professional Edition (version                                     (Figure 3(f)). The fault, striking ~330°, is characterized by
                1.2.4). The procedure includes sparse reconstruction, dense                                  evident dextral offset. The risers of T1 to T3 and small chan-
                matching, and orthorectification (see [70, 71] for a detailed                                 nels (marked as L1-L6) developed on the surface of T2b and
                description of the processing steps). The resulting DEM                                      T3 were all displaced by the fault (Figure 3(f)). We also
                and Digital Orthophoto Map (DOM) are used in our geo-                                        observed fault scarps on T2b and T3 with clear vertical dis-
                morphic analysis.                                                                            placements, and but not on T1.
                                                                                                                  At site ELF2 (36°40 ′ 8.82″ N, 98°53 ′ 11.26″ E), the dex-
                3.2. Characterizing Alluvial Landforms. At site ELS1 (36°37 ′                                tral displacement is well preserved on small channel, but
                38.27″ N, 98°54 ′ 47.74″ E), southeast of Xianquan, the dis-                                 the vertical displacement is less clear (Figures 4(a) and
                placed terrace riser and vertical fault scarp can be clearly                                 4(b)). We surveyed the topography with 151 UVA photo-
                observed in the field (Figures 3(a) and 3(b)). We acquired                                    graphs and 12 GCPs (Figure 4(c)). The high-resolution
                517 UAV photographs and 19 GCPs for topographic map-                                         DEM and DOM reveal four alluvial terraces, T1 to T4

Downloaded from http://pubs.geoscienceworld.org/gsa/lithosphere/article-pdf/doi/10.2113/2021/4115729/5415115/4115729.pdf
by guest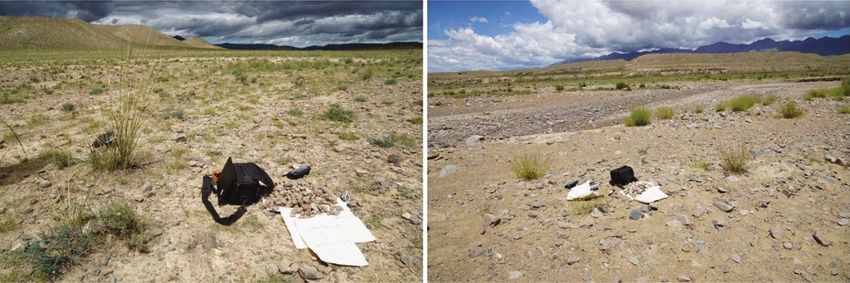
Lithosphere 5
View to SE
GCP
Fault scarp
Displaced terrace riser of T2a
(a) (b)
GCP13
N N
GCP14
GCP12
GCP11
GCP09
GCP15
GCP10
GCP16 GCP18 Fig.3b GCP08
GCP07
GCP17
GCP06 GCP01
GCP05
GCP19 GCP02
GCP03
GCP04
200 m
(c) (d)
Number of overlapping
GCPs 1 6
Image position 2 7
3 8
4 9
5 >9
Altitude (m)
3366
N N
Fig.7a
T1
L1
,2,
3,4
T4 Fig.6c,7b
,5
T2b
L6
T2b
Fig.7c
T0
T3
T3
100 m
3278
(e) (f)
10
Be sample T0 T2b
Fault T1 T3
T2a T4
Figure 3: Geomorphic features at site ESL1. (a) Aerial photograph, acquired from UAV, shows the GCP, fault trace, and displaced terrace
riser. (b) Photograph of fault scarp preserved on terrace T2 (location shown in Figure 3(c)). (c) Orthophoto of site ELS1. The locations of 19
GCPs are marked. (d) Image positions and overlaps at site ELS1. (e) High-resolution DEM of site ELS1. Dotted black boxes show the area of
extracted vertical topography profiles. (f) Interpretation of the DEM. Displaced channels and terrace risers are marked by blue and red
dotted line. The red star marks the 10Be sample position.
Downloaded from http://pubs.geoscienceworld.org/gsa/lithosphere/article-pdf/doi/10.2113/2021/4115729/5415115/4115729.pdf
by guest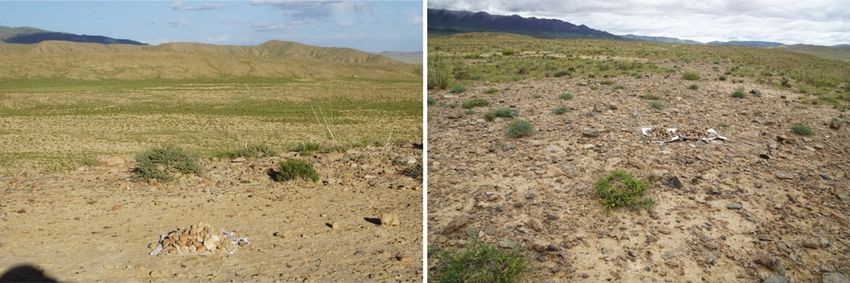
6 Lithosphere
View to NW View to SE
L4
Fault scarp
(a) (b)
GCP08
N N
GCP09
Fig.4a
GCP07
GCP10
GCP12
GCP11 GCP06
GCP01
GCP05
GCP02 Fig.4b
GCP04
GCP03
200 m
(c) (d)
Number of overlapping
GCPs 1 6
Image position 2 7
3 8
4 9
5 >9
Altitude (m)
3269
N N
Fig.8a
L1
L2
T4
Fig.8b
L3
L4
Fig.8c
L5
L6 L
7
T3
T2
T1
100 m
3220
(e) (f)
Fault T0 T3
T1 T4
T2
Figure 4: Geomorphic features at site ESL2. (a) Field photo shows a displaced channel on the surface of T3. (b) Photograph shows that the
fault scarp is less clear at site ELS2. (c) Orthophoto of ELS2. (d) Image positions and overlaps at site ELS2. (e) High-resolution DEM of site
ELS2. (f) Interpretation of DEM.
Downloaded from http://pubs.geoscienceworld.org/gsa/lithosphere/article-pdf/doi/10.2113/2021/4115729/5415115/4115729.pdf
by guest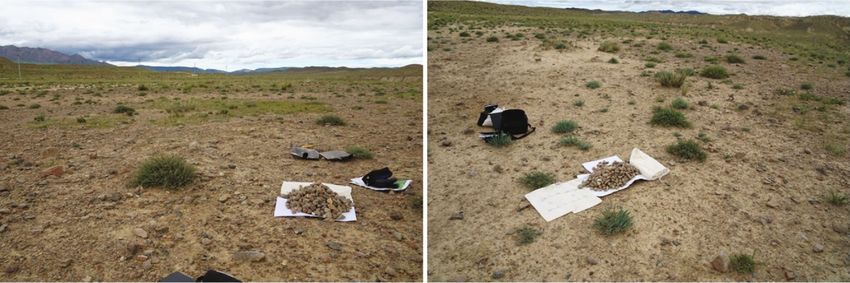
Lithosphere 7
View to N View to N
T6
T5
Fault scarp T4
T3 T2 45°
Riverbed
(a) (b)
gcp25
gcp28
gcp29
Number of
gcp32
overlapping
gcp33
gcp39
1 6
gcp27
gcp26
gcp30
2 7
gcp37 gcp38
gcp31
N 3 8
gcp36 34
gcp
GCPs 4 9
5 >9
gcp22
gcp35
Fig.5a
gcp16
gcp11
gcp17
gcp44
gcp12
gcp40
gcp21
gcp15
gcp43
8
gcp19 gcp1
gcp13
gcp45
gcp14
gcp20
gcp41
gcp42
100 m
(c) (d)
T5
T4 T2
T6 T1
T3
T6 T2 Road
T6 T5 T1 Channel
T4 T0 Reverse fault
T5 T5 T4 T3 T3 Terrace riser 10
Be sample
T0
(e) (f)
Figure 5: Geomorphic features at site QHNS. (a) North looking field photo of fault scarps at site QHNS. (b) Fault dip of the QHNF shown
by displaced conglomerate strata. (c) Orthophoto of site QHNS. The locations of 33 GCPs are marked. (d) Image positions and
overlaps at site QHNS. (e) High-resolution DEM of site QHNS. Dotted white boxes show the area of extracted vertical topography
profiles. (f) Interpretation of the DEM showed terrace staircases and fault trace. The red stars mark the 10Be sample positions.
from young to old (Figures 4(e) and 4(f)). The Elashan maps, and surface roughness, Ai et al. [69] analyzed surface
fault, striking ~332°, has displaced the terrace risers and geomorphology in detail and identified six displaced terraces
several small channels developed on the surface of T3 dex- at this location (Figure 5(f)). We found that the geomorphic
trally (Figure 4(f)). surfaces of T4 and T5 below the fault scarp are not preserved
At site QHNS (36°41 ′ 1″ N, 99°21 ′ 6″ E), vertical fault but are buried beneath T3. Therefore, the vertical offsets of
scarps are clearly preserved on different terraces and the T4 and T5 represent the minimum displacement. Due to
fault dip can be observed as 45° (Figures 5(a) and 5(c)). sustained erosion by active streams, fault scarps developed
The high-resolution DEM shows vertical fault scarps evi- on the surface of T1 and T2 are not well preserved
dently (Figure 5(e)). Based on the contour, slope, aspect (Figure 5(e)).
Downloaded from http://pubs.geoscienceworld.org/gsa/lithosphere/article-pdf/doi/10.2113/2021/4115729/5415115/4115729.pdf
by guest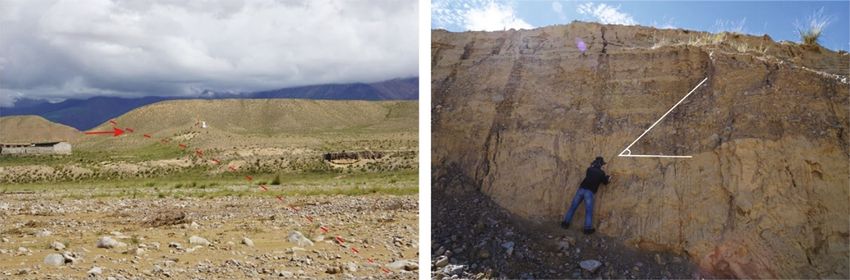
8 Lithosphere
3.3. Measuring Horizontal Displacements. Since we obtained 21:0 ± 0:6 m for L1, 37:2 ± 0:8 m for L2, 20:9 ± 0:4 m for
high-resolution topography, we can interpret the fault trace, L3, 20:2 ± 0:4 m for L4, 20:5 ± 2:5 m for L5, 21:6 ± 1:0 m
terrace staircases, and lateral displacements preserved on for L6, and 20:2 ± 1:2 m for L7 (Table 1).
different landforms in great detail. To simplify the measur-
ing process of previous studies [72–74], we provide a 3.4. Measuring Vertical Displacements. In order to measure
MATLAB-based graphical user interface (GUI), FaultRecov- the height of the fault scarps and the associated error, we
ery, a tool for horizontal displacement calculation from fit lines to the upper and lower terrace surfaces separated
point clouds in XYZ format. FaultRecovery has two mod- by the ramp of fault scarps [45, 76, 77]. Topographic profiles
ules: “Recovery by Feature” and “Recovery by Distance.” across fault scarps were extracted from the high-resolution
“Recovery by Feature” measures displacements by DEMs (Figure 9(a)). We developed MATLAB-based graph-
restoring offset surface features such as terrace edge, chan- ical user interfaces (GUIs)—PointFit—to semiautomatically
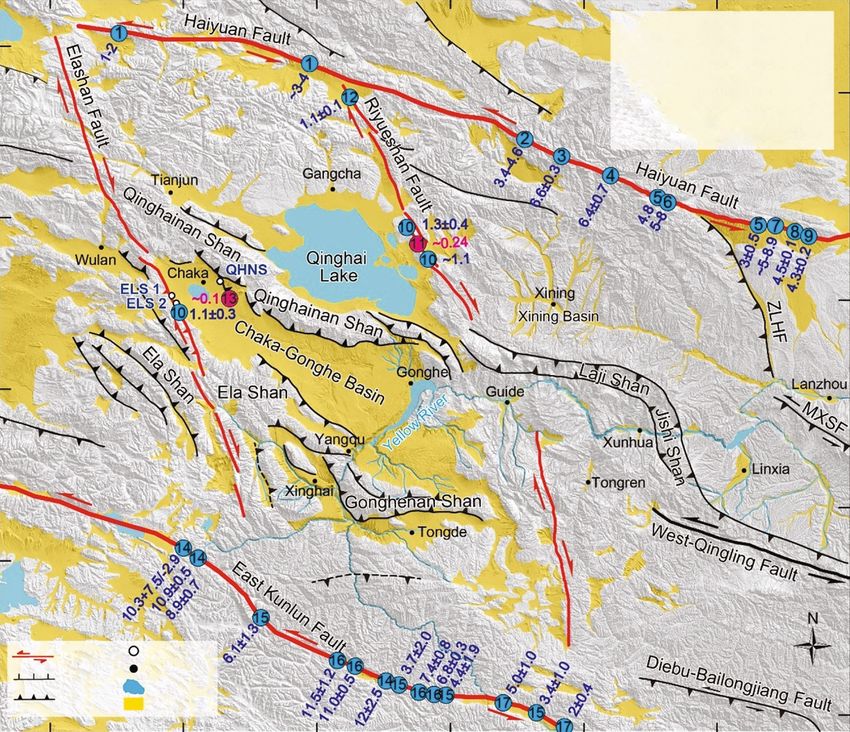
nel, and mountain ranges. We take a channel in Figure 6 calculate fault vertical displacements based on the selected
for example to illustrate how the “Recovery by Feature” topographic profiles. As shown in Figure 9(b), users can
module works. Assume the channel has been displaced by select part of the lines for fitting. Considering the actual
fault motion (left-lateral strike slip in the example). The topographic variation, we add the line fitting error of L1
length of the vector P7P8 is the amount of fault offset and L2 into the calculation. The tool can also calculate the
(Figure 6(a)). Users need to manually select two key points gradient of the elevation across the scarp, which is helpful
(P1 and P2) on the topography to locate the fault trace, for the determination of the upper and lower turning points
and 4 key points to locate the channel (P3-P6, two on either of the fault scarp.
side of the channel) (Figure 6(a)). From the coordinates of At site ELS1, we extracted 10 topographic profiles
the six key points, the software automatically calculates the perpendicular to fault scarps on the surface of T2 and T3
offset and restores the point cloud to the preearthquake con- from the DEM (marked in Figure 3(c)). Figures 9(c) and
dition. We suggest repeating the measurements three times 9(d) show two examples of the measurements. Using the
based on the left, central, and right margins of the channel, GAUSSIAN-PEAK model, we obtained a vertical displace-
respectively, to reveal the uncertainties [75] (Figure 6(b)). ment of 1:7 ± 0:3 m for T2b and 7:9 ± 0:5 for T3. At ELS2,
The “Recovery by Distance” module allows users to as we mentioned previously, we did not find evident vertical
define the offset manually in order to verify the restoration. displacements along the fault.
Only two key points (P1 and P2) are needed to constrain At site QHNS, fault scarps on the surface of T1 and T2
the fault trace (Figure 6(a)). Users need to input the offset have been severely eroded by active streams, so we did not
(in meters), and the recovered point cloud can be obtained. measure them. For each of T3, T4, and T5, we extracted 10
At site ELS1, L3 was chosen as an example to show the topographic profiles perpendicular to the fault trace (marked
process of horizontal displacement measurement and recov- in Figure 5(c)). Figures 9(e)–9(g) show three examples of
ery. Two red key points are located to constrain the position the measurements. Similarly, using the GAUSSIAN-PEAK
of the fault (Figure 6(c)). Three groups of colored key points model, the vertical displacements are estimated to be 3:8 ±
were taken to determine the left, central, and right margins, 0:4 m for T3, 4:5 ± 0:3 m for T4, and 7:3 ± 0:7 m for T5,
labeled as L3-1, 2, and 3 (Figure 6(c)). Based on “FaultRe- respectively (Table 1). As shown in Figure 5(e), most of the
covery,” we estimated the displacements of L3-1, L3-2, and topographic data of the northern part of T6 were missing.
L3-3 to be 19.6 m, 21.3 m, and 22.9 m, respectively, resulting We speculate that the high elevation of T6 surface had made
in an average displacement of 21:3 ± 1:6 m. Figures 6(d)–6(f) the camera lens too close to the ground. The close distance
show the recovered topography provided by “Recovery by would reduce image overlaps, creating difficulties in image
Feature,” and Figure 6(g) shows the recovered topography processing. We use the acquired topographic data to extrap-
by “Recovery by Distance” based on the average displacement olate the T6 scarp profile. Assuming that the slope of the T6
of L3. The two modules yielded self-consistent restoration surface is similar to T5, we extracted the coordinates of three
results. points on the preserved T6 surface (marked in Figure 5(c))
To improve the efficiency of measuring horizontal offsets above the fault scarp to simulate the topographic profile of
made by “FaultRecovery,” we cropped the DEM into small T6. Combining the upper and lower segments of the scarp
segments. The high-resolution topographic data of site profile on T6, the minimum vertical displacement of T6 is
ELS1 was cropped into three small segments (Figures 7(a)– estimated to be 16:5 ± 0:2 m (Figure 9(h)).
7(c)). We measured the offsets of six channels, and three ter-
race risers at site ELS1. Figure 7(d) shows some of the mea- 4. Dating Alluvial Landforms
surements. The horizontal displacements are 1:9 ± 1:03 m
for terrace T1/T0, 17:5 ± 0:3 m for T2a/T1, 20:8 ± 0:5 m for To constrain the ages of the alluvial terraces developed at the
T2b/T2a, 20:5 ± 1:2 m for L1, 18:4 ± 0:3 m for L2, 21:3 ± ELSF and QHNF, we collected quartz-rich pebbles for in situ
1:1 m for L3, 20:9 ± 0:5 m for L4, 19:4 ± 0:8 m for L5, and cosmogenic nuclide 10Be dating. The 10Be dating method
37:3 ± 0:1 m for L6 (Table 1). hypotheses that quartz-rich pebbles on terrace surfaces are
At site ELS2, the DEM was also cut into three segments exposed to cosmic rays and continue accumulating nuclide
(Figures 8(a)–8(c)). Some of the offset measurements are concentration since the terraces have been abandoned [78].
shown in Figure 8(d). The average offsets were calculated If we know the inherited nuclide concentration preserved
to be 14:5 ± 1:6 m for T2/T1, 39:8 ± 0:6 m for T3/T2, in the pebbles before terrace abandonment, we can subtract
Downloaded from http://pubs.geoscienceworld.org/gsa/lithosphere/article-pdf/doi/10.2113/2021/4115729/5415115/4115729.pdf
by guest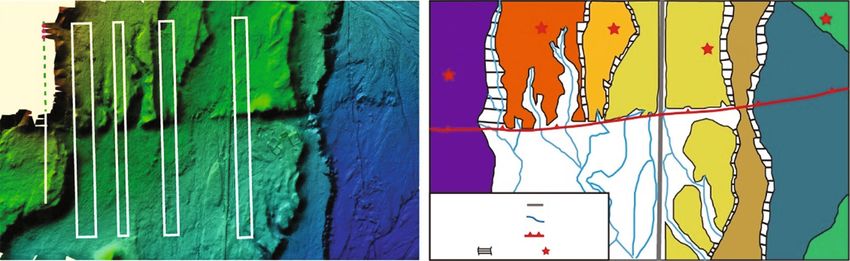
Lithosphere 9
P2
L1
Channel L2 L4 L5
L3
L6 L1
P3 P8
P4 P5
P6 P3 L2
P7
P4 L3
3000
5400
2995 P1
2990
Channel
5300 P7 P8 P2
2985 P1
2980 P5 L4
5200
4500
4450
4400 P6
4350 5100 L5
4300
4250
4200 5000 L6
4150
4100
4050 4900
4000
(a) (b)
Fault trace Key point Centre displacement
Channel centre Left margin displacement
Channel margin Right margin displacement
Channel margin
ELS3-L3 L3-1 L3-2
N N N
19.6 m 21.3 m
(d) (e)
L3-3
L3-1,2,3 L3-2′
N N
22.9 m
21.3 m N
50 m
(c) (f) (g)
Key point
Strike slip fault
Channel trace
Figure 6: Schematic diagram of the horizontal offset measurement. (a) Fault sinistral motion displaced the channel shown in a 3D model.
Fault traces are marked as blue line. (b) Morphology of channel profiles (black line, positions are shown in Figure 3(a)) and displacement
measurements (yellow, green, and purple line). Three groups of key points represent the measuring processes are repeated for three times.
(c) One segment of the DEM around channel L3 at site ELS1 (position shown in Figure 3(d)) (up). Fault trace and three groups of key points
are identified (bottom). (d–f) Back-slipped topography of channel L3 for three times. (g) Oblique view of the back-slipped topography based
on the average displacement.
Downloaded from http://pubs.geoscienceworld.org/gsa/lithosphere/article-pdf/doi/10.2113/2021/4115729/5415115/4115729.pdf
by guest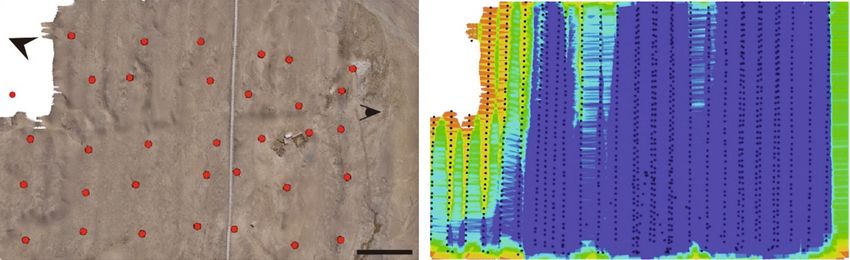
10                                                                                                                                       Lithosphere

                                                         T2b                                       L1 L2 L3 L4 L5                                L6
                                           T2a                     N                                                          N                           N
                                  T1

                                                                                                                                       T3

                                                50 m                                                       50 m                                  100 m

                                                   (a)                                                      (b)                                   (c)

                                                                                                   T2a                                     T2b
                                 T1
                                                                  1.9 m                                                                                  21.2 m
                                                                                                                             17.4 m

                                                                                                L2
                                 L1                                                                                                   L3

                                                               21.6 m                                                      18.1 m
                                                                                                                                                         21.3 m
                                              deg/Myr

                                           L4                                                         L5                              L6

                                                               21.4 m                                                      19.4 m
                                                                                                                                                         37.4 m

                                                                                                            (d)

                               Channel trace
                               Terrace edge
                               Strike slip fault

                Figure 7: Horizontal offset at site ELS1. (a–c) Three cropped topography data at site ELS1 (marked in Figure 3(f)). (d) Some of the
                back-slipped topography of channels and terrace risers at site ELS1. The solid red line indicates the fault trace. The red and blue
                dotted lines represent the trace of channels and terrace risers. The amount of fault offsets is marked on the right.

Downloaded from http://pubs.geoscienceworld.org/gsa/lithosphere/article-pdf/doi/10.2113/2021/4115729/5415115/4115729.pdf
by guest
Lithosphere 11
Table 1: Fault displacements at different sites.
ELS1 ELS2 ELS1
Label Horizontal offset Label Horizontal offset Label Vertical offset
T1 1:9 ± 1:0 T2 14:5 ± 1:6 T2 1:7 ± 0:3
T2a 17:5 ± 0:3 T3 39:8 ± 0:6 T3 7:9 ± 0:5
T2b 20:8 ± 0:5 L1 21:0 ± 0:6
L1 20:5 ± 1:2 L2 37:2 ± 0:8 QHNS
L2 18:4 ± 0:3 L3 20:9 ± 0:4 Label Vertical offset
L3 21:3 ± 1:1 L4 20:2 ± 0:4 T3 3:8 ± 0:4
L4 20:9 ± 0:5 L5 20:5 ± 2:5 T4 4:5 ± 0:3
L5 19:4 ± 0:8 L6 21:6 ± 1:0 T5 7:3 ± 0:7
L6 37:3 ± 0:1 L7 20:2 ± 1:2 T6 16:5 ± 0:2
it from the total nuclide concentration to derive the expo- we used the CRONUS-Earth online calculator (http://hess
sure ages. Generally, there are two ways to obtain the inher- .ess.washington.edu) and the time-independent scaling
ited nuclide concentration [78]. One is to assume that the model of Lal [80] and Stone [81] to calculate the abandon-
nuclide concentration in pebbles in the modern riverbed ment age of each terrace.
represents the predepositional exposure nuclide concentra- At site ELS1, Yuan et al. [36] determined the age of
tion. The other way is to consider that the nuclide concen- terrace T2a as 8:7 ± 0:7 ka via OSL dating. In our study,
tration in samples decreases with depths beneath terrace the abandonment age of terrace T3 is determined to be
surfaces. The second method needs to collect 5 or more 13:3 ± 1:2 ka after eliminating the inherited 10Be concentra-
samples along a 2 to 3 m depth profile which means the tion of the riverbed. At site QHNS, the abandonment ages
thickness of gravel deposition must be larger than 3 m. Thus, of T3, T4, T5, and T6 are 12:8 ± 1:2 ka, 21:3 ± 1:9 ka,
the method is suitable for relatively long-term stable deposi- 54:2 ± 4:6 ka, and 109:2 ± 9:5 ka, respectively. The dating
tional alluvial landforms with large height differences results are summarized in Table 2.
(>3 m). As the height differences of the alluvial terraces
developed along the ELSF and QHNF in our study are 5. Discussion
mostly lower than three meters, we use the first method to
correct the inherited nuclide concentration. 5.1. Determining the Late Pleistocene Slip Rates of the ELSF
At site ELS1, there are many pebbles, with diameters of and QHNF. With accurate measurements of the displace-
~1-10 cm, sedimented on terrace surfaces (Figure 10(a)). ment and ages of terraces, we can calculate the slip rates of
The pebbles, composed of Silurian and Ordovician grey- the ELSF and QHNF. In many cases, the displaced terrace
white gneiss and quartzite, were transported from the risers may be eroded by rivers, leading to underestimation
Elashan at the end of the period of terrace deposition. The of fault displacements and hence the slip rates [20]. As river
gravels have been stable in place since the terraces have been flows can incise the terrace surfaces, forming small channels
abandoned, which are, therefore, suitable for cosmogenic within the terrace risers which may be less eroded, they
nuclide 10Be dating. At QHNS, many quartz-rich and sub- can be used as additional constraints on fault displace-
round gravel clasts are deposited on the surface of each allu- ments. To obtain more reliable and reasonable displace-
vial terrace (Figure 5(a)). These pebbles, with diameters of ment, we combine the displacements of terrace risers and
~1-4 cm, are also suitable for cosmogenic nuclide 10Be dating channels in the analysis.
to constrain the abandonment ages of the terraces. We col-
lected two superficial 10Be samples at site ESL1, one from 5.1.1. The Elashan Fault. At site ELS1, the measured hori-
the surface of T3 (Figure 10(a)) and the other from the mod- zontal displacement, 17:5 ± 0:3 m, represents the minimum
ern riverbed. At site QHNS, a total of five 10Be samples were offset after T2a was formed. The upstream riser of T2a/T1
collected, one from the riverbed and four from each tread of was staggered into the path of the stream. It was eroded by
terraces T3 to T6 (Figures 10(b)–10(f)). All samples con- active river flow, and an evident curved groove was observed
tained at least 100 gravels of ~2-3 cm in diameter. (Figure 7(a)). On the contrary, the downstream riser is pre-
We preprocess the samples at the Key Laboratory of served and complete due to the protection of the upstream
the Institute of Crustal Dynamics, China Earthquake riser (Figure 7(c)). For T1, because of the arbitrary swing
Administration [79]. The CEREGE (Le Centre Européen de of the modern river flow, a displacement of about two
Recherche et d’Enseignement des Géosciences de l’Environ- meters from a single earthquake is difficult to be preserved,
nement, Laboratoire de Tectonique) tested the 10Be/9Be so we believe that the measurement induced by terrace
ratio using accelerator mass spectrometry. After subtract- T1/T0 riser may be unreliable. At site ELS2 (Figure 8),
ing the inherited nuclide concentration from the riverbed, the measurements, 39:8 ± 0:6 m (T3/T2) and 14:5 ± 1:6 m
Downloaded from http://pubs.geoscienceworld.org/gsa/lithosphere/article-pdf/doi/10.2113/2021/4115729/5415115/4115729.pdf
by guest12 Lithosphere
L1 L2 N
N T3 N
L3
L4 L5 L6
L7
T2
50 m 50 m 50 m
(a) (b) (c)
L1
L2
L3
41.1 m
20.7 m
20.9 m
L4 L5 L6
19.7 m 20.5 m 21.4 m
T3
L7
20.3 m
14.2 m 42.3 m
T2
(d)
Terrace edge
Channel trace
Strike slip fault
Figure 8: Horizontal offset at site ELS2. (a–c) Three sets of cropped topography data at site ELS2 (shown in Figure 4(f)). (d) Some of the
back-slipped topography of channels and terrace risers at site ELS2.
(T2/T1), also represent the minimum lateral offset since seriously eroded. Thirty-three offset measurements at sites
their abandonment. Similar to ELS1, it is clear that the ELS1 and ELS2 are clustered in two groups. Gaussian prob-
upstream risers of terraces T3/T2 and T2/T1 have been ability density function (PDF) of the offset measurements
Downloaded from http://pubs.geoscienceworld.org/gsa/lithosphere/article-pdf/doi/10.2113/2021/4115729/5415115/4115729.pdf
by guestLithosphere 13
3000
2998
2996
2994
2992
3000 5500 2990
5450
2990 2988
5400
5350
2980 2986
5300
4500 Fault
4450 5250
4400 2984
5200
4350
4300 5150
4250 2982
4200 5100
4150
4100 5050
4050 2980
5000
4000
(a)
Topographic profile
Height of scarp : h = (h1 + h2) / 2
L1: y1 = k1x + b1
Fit_error1 Fit line:
L1 L2: y2 = y2x + b2
h⁎ = y1 – y2
= (k1–k2)x + (b1–b2)
h1 h2
h
Fit_error2
L2
(b)
3312 3325
Altitude (m)
3310
3320
3308
3315
3306
3304 3310
ELSI-T2-P6: 1.9 ± 0.2 m ELS1-T3-P4: 7.9 ± 0.6 m
3302 3305
0 50 100 150 0 50 100 150 200 250
(c) (d)
3164
3163 3170
Altitude (m)
3162 3168
3161 3166
3160
3164
3159
3158 3162
3157 QHNS-T3-P5: 3.6 ± 0.5 m 3160 QHNS-T4-P1: 4.2 ± 0.2 m
3156 3158
0 50 100 150 200 250 300 0 50 100 150 200 250 300
(e) (f)
3174
3190
3172
Altitude (m)
3170 3185
3168
3180
3166
3164 3175
3162 QHNS-T5-P3: 7.2 ± 0.1 m QHNS-T6: 16.5 ± 0.2 m
0 50 100 150 200 250 300 0 50 100 150 200 250 300 350 400
Distance (m) Distance (m)
(g) (h)
Figure 9: Schematic diagram of vertical fault scarp measurement. (a) Fault vertical displacement shown in a 3D model. Orange line shows
the location of the extracted fault scarp profile. Red line indicates the fault trace. (b) Schematic graph showing the method used to define
the vertical scarp displacement, modified from Yu et al., 2013. (c–h) Examples of vertical fault scarp measurement results at sites ELS1
and QHNS.
Downloaded from http://pubs.geoscienceworld.org/gsa/lithosphere/article-pdf/doi/10.2113/2021/4115729/5415115/4115729.pdf
by guest14 Lithosphere
View to W View to E
ELS1-T3 QHNS-T6
(a) (b)
View to N View to E
QHNS-T5 QHNS-T4
(c) (d)
View to E View to E
QHNS-T3 QHNS-riverbed
(e) (f)
Figure 10: Field photograph show sample collection. (a) 10Be samples collected on the surface of T3 at site ELS1. (b–f) 10
Be samples
collected on the surface of different terrace surfaces at site QHNS, respectively.
shows that the mean values of the two offset clusters are a displacement of 20:8 ± 3:2 m. Likewise, using the aban-
20:8 ± 3:2 m and 37:5 ± 3:0 m (95% confidence level), respec- donment age of T3, 13:3 ± 1:2 ka, we calculated a horizon-
tively (Figure 11(a)). tal slip rate of 2:82 ± 0:34 mm/yr given a displacement of
Cosmogenic nuclide 10Be dating gives the abandonment 37:5 ± 3:0 m. These two values are consistent, indicating
age of river terraces, which is the lower bound of the occur- that the average strike-slip rate of the ELSF is approximately
rence time of earthquakes. At site ELS1, using the abandon- 2:6 ± 1:2 mm/yr since ~13.3 ka (Figure 11(a)). Similarly, the
ment age of T2a, 8:7 ± 0:7 ka [36], we obtained an upper vertical slip rates are calculated to be 0:2 ± 0:04 mm/yr from
bound on the horizontal slip rate of 2:39 ± 0:42 mm/yr given T2 and 0:59 ± 0:07 mm/yr from T3, yielding an average
Downloaded from http://pubs.geoscienceworld.org/gsa/lithosphere/article-pdf/doi/10.2113/2021/4115729/5415115/4115729.pdf
by guestby guest
Lithosphere
Table 2: Determination of the 10Be exposure ages.
10 Inheritance 10Be
Sample Elev Depth Dissolved Carrier mass Corrected Be concentration Error Age Error
Terrace Latitude Longitude 10 concentration
ID (m) (m) mass (g) (mg) Be/9Be (atoms g−1) (atoms g−1) (ka) (ka)
(atoms g−1)
ELF1-21 T3 36.627008 98.913312 3338 0 30.6763 0.23 1:6746E − 12 8:36E + 05 2:28E + 04 13.3 1.2
3:27E + 05
ELF1-22 Riverbed 36.630617 98.911454 1442 0 23.49 0.21 5:5364E − 13 3:27E + 05 1:10E + 04 NA NA
QHNF-01 T6 36.683479 99.351619 3222 0 7.8728 0.2200 2:3537E − 12 3:83E + 06 1:12E + 05 109.2 9.5
QHNF-02 T5 36.681331 99.352411 3169 0 30.8159 0.4324 2:5977E − 12 1:87E + 06 4:78E + 04 54.2 4.6
Downloaded from http://pubs.geoscienceworld.org/gsa/lithosphere/article-pdf/doi/10.2113/2021/4115729/5415115/4115729.pdf
QHNF-03 T4 36.680492 99.352422 3162 0 30.9057 0.2103 2:8677E − 12 7.36E+05 3:05E + 04 5:68E + 05 21.3 1.9
QHNF-04 T3 36.678894 99.352736 3158 0 30.4684 0.2662 1:7307E − 12 4:42E + 05 2:36E + 04 12.8 1.2
QHNF-05 Riverbed 36.675289 99.352747 3142 0 30.848 0.2084 1:2587E − 12 5:68E + 05 1:56E + 04 NA NA
1516 Lithosphere
2
Mean: 37.5 m
Std: 3.0 m
Confidence interval: 95%
40
Horizontal displacement (m)
/a
mm
0 0.27
35 42 1 ±
30 Displacement (m) /a = 2.6
m rate
.34m e slip
±0 rag
2.8
2 Ave
20 9
Mean: 20.8 m
a
m/
Std: 3.2 m
m Confidence interval: 95%
0.42
9±
10 2.3
0
14 26
Displacement (m)
0
0 2 4 6 8 10 12 14 16
Age (ka)
(a)
10 9
Mean: 1.7 m Mean: 7.8 m
Std: 0.3 m Std: 0.5 m
8 Confidence Confidence interval: 95%
Vertical displacement (m)
interval: 95%
7 T2 T3
0
0
6 0 3.5
5 11
Displacement (m) a
Displacement (m)
mm/
5
4 ± 0.04
4 m m/a rate
=0.
± 0.07 age uplift
3 0.59 Aver
2
1 4 mm/a
0.20 + 0.0
0
0 2 4 6 8 10 12 14 16
Age (ka)
(b)
T6
/a
16
m
/a
3m
m
1m
0.0
14 0.0
±
±
0.2
5
0.1
=
Vertical displacement (m)
te
12
/a
ra
)
14
mm
ift
20
a
pl
l.,
m/
ta
eu
.04
10
ke
2m
ag
oc
±0
er
d d10
0.0
cra
Av
0.3
Mean: 3.8 m
8 a(
1±
/ Std: 0.4 m
mm Confidence
0.2
T5
/a .04 interval: 95%
6 m ±0 T3
m 0.1 0
T3
T4
0.02 2 Displacement (m) 6
4 3 ± 10
Mean: 4.5 m
10 Mean: 7.25 m
0.1 Std: 0.3 m
Std: 0.7 m
Confidence
Confidence interval: 95%
interval: 95%
2 T2 T4 T5
0 0
3 Displacement (m) 6 2 Displacement (m) 14
0
0 20 40 60 80 100 120 140 160
Age (ka)
(c)
Figure 11: Estimates of the late Pleistocene fault slip rates. (a) Lateral slip rate of the ELSF; (b) vertical slip rate of the ELSF; (c) vertical
slip rate of the QHNF. The displacement value modeled by the Gaussian probability density function (PDF) is marked in the corner of
each graph.
Downloaded from http://pubs.geoscienceworld.org/gsa/lithosphere/article-pdf/doi/10.2113/2021/4115729/5415115/4115729.pdf
by guestLithosphere 17
vertical slip rate of 0:4 ± 0:04 mm/yr since the late Pleisto- the nonrigid bookshelf model using new constraints on the
cene (Figure 11(b)). slip rates of the major faults around the Qinghai Lake and
Chaka-Gonghe basins. The GPS velocity profiles AA ′ and
5.1.2. The Qinghainanshan Fault. At site QHNS, the vertical BB ′ , perpendicular to the EKLF and HYF, show that the
displacement of 16:5 ± 0:2 m on T6 indicates the cumulative overall shortening rate ranges from ~6.4 to ~4.9 mm/yr
displacement since the abandonment of T6. Using the age across a zone of ~300 km wide (Figures 12(h) and 12(i)).
of T6 (109:2 ± 9:5 ka) as the upper bound, the minimum In the eastern segment of the area, profile CC ′ shows a lower
vertical slip rate is calculated to be 0:15 ± 0:01 mm/yr. shortening rate of 2:5 ± 0:7 mm/yr, which is mainly concen-
Similarly, measurements of vertical displacements and trated between the LJSF and HYF (Figure 12(j)). The
abandonment ages on T5, T4, and T3 yield a vertical slip eastward decrease of shortening rates may indicate counter-
rate of 0:13 ± 0:02 mm/yr, 0:21 ± 0:02 mm/yr, and 0:3 ± clockwise rotation across the EKLF and HYF. Given a dip
0:04 mm/yr, respectively. Therefore, the vertical slip rate angle of 45°, the shortening rate of the QHNS can be con-
of the QHNS fault since the late Pleistocene is constrained strained to be ~0.2 mm/yr. The shortening rate of the GHNF
to be 0:2 ± 0:03 mm/yr (Figure 11(c)). Based on the average has been estimated to be ~0.7 mm/yr [39]. The central ELSF
slip rate, we speculate that the abandonment age of T2 is with a right-lateral slip rate of ~2.6 mm/yr will compensate
approximately 7:0 ± 1:5 ka. for ~1.7 mm/yr shortening to the 24°-directed shortening,
and the RYSF with an average slip rate of ~1.2 mm/yr will
5.2. Comparing Geological and Geodetic Rates. Wang and absorb ~0.8 mm/a shortening. The sum of shortening com-
Shen [34] published a new set of GPS data collected during pensated by the four major faults is ~3.4 mm/a since the late
1991 and 2016 from continental China. In this study, we also Pleistocene. In addition, profiles DD ′ and EE ′ yield a 66°-
use this newly published GPS data to investigate fault directed shortening rate of ~2.0 to ~2.3 mm/yr between the
motion around the Qinghai Lake and Chaka-Gonghe basins, ELSF and RYSF (Figures 12(k) and 12(l)). The shortening
in order to make a comparison between the long-term geo- rate increases sharply to ~5.3 mm/yr after entering the inte-
logical and short-term geodetic rates. We drew three swath rior of the Qilian Shan (Figure 12(m)). As the ELSF and
profiles (150 km wide and 700 km long, Figure 12(a)) RYSF are primarily strike-slip faults, we assume that the
approximately orthogonal to the EKLF, QHNF, and HYF dip is higher than 70°, so the shortening absorbed on them
with an azimuth angle of 24°, and three profiles (170 km wide is less than 0.3 mm/yr (Figure 13). In brief summary, the
and 700 km long) approximately orthogonal to the ELSF and sum of the geological shortening rates on the major faults
RYSF with an azimuth angle of 66° (Figure 12(a)). The GPS is lower than the overall geodetic convergence rate across
velocities [34] were projected along the central line of each the Qinghai Lake and Gonghe basins. We suggest some of
swath and then decomposed into fault-parallel and fault- the deformations may be distributed in HYF, EKLF, and
perpendicular velocities [19, 32, 34, 82, 83]. active folds developed in the Qinghai Lake and Chaka-
Velocities parallel to the EKLF from profiles AA ′ , BB ′ , Gonghe basins (Figure 13).
and CC ′ show a decreasing strike-slip rate of the EKLF Based on the slip rates and geometry of the major
from 8 ± 1:3 mm/yr in the west to 4:4 ± 0:7 mm/yr in the faults mentioned above, we argue that the Qinghai Lake
east (Figures 12(b)–12(d)). The strike-slip rate of the and Chaka-Gonghe basins may not rotate as a whole
HYF decreases from 4:2 ± 0:7 mm/yr in the east to 2:3 ± block. In the north, the overall left-lateral shear from
1:0 mm/yr to its western end (Figures 12(b)–12(d)). These GPS is equivalent to the strike-slip motion of the ELSF
rates agree well with previous geological estimates along and RYSF, on the order of ~1 mm/yr, so this region could
the EKLF and HYF [49, 50, 53–61]. rotate as a block. The rotation would promote the crust
Velocity profiles parallel to the ELSF, DD ′ , EE ′ , and material moving southwards to form thrust faults and
FF ′ show that the central ELSF has a higher slip rate folds in the SW direction of the basin [38, 39, 65]. The
(2:2 ± 0:8 mm/yr) than its northern (0:8 ± 0:8 mm/yr) and normal faults developed in the Qinghai Lake [84] may also
southern segments (1:2 ± 1:2 mm/yr) (Figures 12(e)–12(g)). be related to the block rotation. Assuming the center of
This indicates that some of the deformations are accommo- the block as the rotation center, we calculated the counter-
dated by shortening on the thrust faults developed at both clockwise rotation rate of the Qinghai Lake basin to be
ends [36]. Our estimate of the strike-slip rate at the central ~0.8 deg/Myr, using a strike-slip rate of ~1.2 mm/yr and
ELSF, 2:6 ± 1:2 mm/yr since ~13 ka, is similar to the geo- a radius of ~85 km.
detically inferred slip rate of 2:2 ± 0:8 mm/yr, implying a In the south, there is a wide distribution of thrust faults,
constant slip rate since the late Pleistocene. Similarly, we so the southern region is unlikely to behave as a block. Inter-
also found that the long-term geological slip rate (1:2 ± estingly, the latest GPS block modeling [35] reveals that the
0:4 mm/yr) and geodetic rate (~1.3 mm/yr) of the RYSF are Qinghai Lake basin shows consistent counterclockwise rota-
consistent [25, 36]. The results suggest that the present-day tion regardless of the number of divided subblocks whereas
kinematic deformation around the Qinghai Lake and the Chaka-Gonghe basin may rotate clockwise or counter-
Chaka-Gonghe basins may have been inherited from the late clockwise depending on the division of subblocks. This sug-
Pleistocene. gests that the Qinghai Lake and Chaka-Gonghe basins
behave in a different way. Given the fact that many thrust
5.3. Kinematic Model of Internal Deformation in the Qinghai faults formed within the Chaka-Gonghe basin and block
Lake and Chaka-Gonghe Basin. In this study, we reanalyze modeling show inconsistent rotation directions, we suggest
Downloaded from http://pubs.geoscienceworld.org/gsa/lithosphere/article-pdf/doi/10.2113/2021/4115729/5415115/4115729.pdf
by guest18 Lithosphere
10 mm/yr
Convergency
direction
(a)
20 20 15
NQLF
6.7 ± 0.9
to the EKLF (mm/yr)
15 15 4.4 ± 0.7 4.2 ± 0.7
Velocity parallel
10
2.3 ± 1.0 3.6 ± 1.0
10 A A′ 10 B B′ C C′
NQLF
8.0 ± 1.3
5
5 5
QHNF
QHNF
GHNF
RYSF
EKLF
EKLF
EKLF
HYF
RYSF
ELSF
HYF
LJSF
HYF
0 0 0
0 100 200 300 400 500 600 700 0 100 200 300 400 500 600 700 0 100 200 300 400 500 600 700
(b) (c)
(d)
6 4 3
GHNF
ZLHF
1.3 ± 0.9
ELSF
EKLF
HYF
HYF
RYSF
NQLF
ELSF
LJSF
2.2 ± 0.8 2
to the ELSF (mm/yr)
4 2 0.8 ± 0.8
Velocity parallel
1.3 ± 0.7 1
1.2 ± 1.2
2 D D′ 0 E E′ 0 F F′
–1
0 –2
QHNF
RYSF
HYF
ELSF
–2
–2 –4 –3
0 100 200 300 400 500 600 700 0 100 200 300 400 500 600 700 0 100 200 300 400 500 600 700
(e) (f) (g)
15 15 10
LSSF
LSSF
Velocity orthogonal
to EKLF (mm/yr)
10 10
NQLF
NQLF
2.5 ± 0.7
A 6.4 ± 1.1 A′ B B′ 5 C C′
4.9 ± 0.9
5 5
QHNF
QHNF
GHNF
EKLF
EKLF
EKLF
ELSF
RYSF
RYSF
HYF
HYF
HYF
LJSF
0 0 0
0 100 200 300 400 500 600 700 0 100 200 300 400 500 600 700 0 100 200 300 400 500 600 700
(h) (i) (j)
25 14 14
GHNF
NQLF
ZLHF
EKLF
RYSF
ELSF
ELSF
HYF
LJSF
HYF
12
Velocity orthogonal
20
to ELSF (mm/yr)
10
2.0 ± 1.4
9 5.3 ± 1.0
15 D D′ E E′ F F′
6
10 6
QHNF
RYSF
ELSF
HYF
2.3 ± 0.9
0 3 2
0 100 200 300 400 500 600 700 0 100 200 300 400 500 600 700 0 100 200 300 400 500 600 700
Distance along the GPS profile (km)
(k) (l) (m)
Figure 12: (a) Map of active faults and GPS velocities. Red lines show major active faults within the research area. Blue arrows show GPS
velocities for motion relative to Eurasia. Rectangles show the locations of velocity profiles discussed in Section 5.2. Active faults are modified
from “Map of active faults in China” and “Map of active faults in northern Tibet” by [47]. Black arrows denote the shortening direction. (b),
(c), and (d) show strike-slip rates of the EKLF and HYF along profiles AA ′ , BB ′ , and CC ′ . (e), (f), and (g) show strike-slip rates of the ELSF
and RYSF along profiles DD ′ , EE ′ , and FF ′ . (h), (i), and (j) show shortening rates between the EKLF and HYF along profiles AA ′ , BB ′ , and
CC ′ . (k), (l), and (m) show shortening rates between the ELSF and RYSF along profiles DD ′ , EE ′ , and FF ′ .
Downloaded from http://pubs.geoscienceworld.org/gsa/lithosphere/article-pdf/doi/10.2113/2021/4115729/5415115/4115729.pdf
by guestLithosphere 19
3 - 4 mm/yr
/yr HYF
1 - 2 mm
RY
~0 N
SF
.8
Ma
mm
~
8 °/ ~1 0.1
~0.
/yr
.2 mm
m /
m yr 2.6 Strike slip rate
/y
r 0.1 Shortening rate
EL
SF
QHNF
~
~2 0.15 0.2 mm
.6 m /yr
m m
m /y
/y r
r
RY
SF
?
GHNF
Distributed thrusting 0.7 mm/yr
≥10 mm/yr
EKL
F
~6.8 mm/y
r
7 - 9 mm/yr ≤ 5 mm/yr
~4.9 m
m/yr
Figure 13: Fault geometry and kinematics showing kinematic deformation around the Qinghai Lake and Chaka-Gonghe basins. Black solid
arrow shows the E-W shear direction, and the blue arrow represents the NE-SW directed shortening.
that the basin may be mainly characterized by distributed of rotation and distributed thrusting. The Qinghai
thrusting (Figure 13). Lake basin is characterized by counterclockwise rota-
tion with a rate of ~0.8 deg/Myr in response to the
left-lateral shear of the Haiyuan and East Kunlun
6. Conclusions faults. The Chaka-Gonghe basin is mainly character-
In this study, we investigated the kinematic deformation of ized by distributed thrusting
the Qinghai Lake and Chaka-Gonghe basins based on the
high-resolution DEMs, geomorphic chronology dating, and Data Availability
GPS. We draw the following conclusions: The data used to support the findings of this study are
included within the article.
(1) The late Pleistocene right-lateral strike-slip rate of
the Elashan fault is 2:6 ± 1:2 mm/yr and the vertical
slip rate is 0:4 ± 0:04 mm/yr. The vertical slip rate
Conflicts of Interest
of the Qinghainanshan fault is 0:2 ± 0:03 mm/yr We wish to confirm that we have no known competing
since the late Pleistocene financial interests or personal relationships that could have
(2) The consistency between the long-term geological appeared to influence the work reported in this paper.
slip rates and short-term geodetic rates indicates that
the present-day regional deformation may be inher- Acknowledgments
ited from the late Pleistocene
This work was supported by the second Tibet Scientific
(3) The nonrigid bookshelf kinematic model of the Expedition and Research Program (STEP) (2019QZKK0901),
northeastern Tibetan Plateau involves a combination National Natural Science Foundation of China (41590861,
Downloaded from http://pubs.geoscienceworld.org/gsa/lithosphere/article-pdf/doi/10.2113/2021/4115729/5415115/4115729.pdf
by guest20 Lithosphere
41774049, 41674051, 41972228, and 41602224), and collision zone,” Journal of Geophysical Research, vol. 91,
Guangdong Province Introduced Innovative R&D Team of no. B3, pp. 3664–3676, 1986.
Geological Processes and Natural Disasters around the [17] L. H. Royden, B. C. Burchfiel, R. W. King et al., “Surface defor-
South China Sea (2016ZT06N331). We gratefully acknowl- mation and lower crustal flow in eastern Tibet,” Science,
edge Li Xinnan, Dong Jinyuan, Ren Guangxue, and Wang vol. 276, no. 5313, pp. 788–790, 1997.
Cheng for their assistance in field work and geomorpho- [18] L. H. Royden, B. C. Burchfiel, and V. D. H. Rd, “The geological
logical dating. evolution of the Tibetan Plateau,” Science, vol. 321, no. 5892,
pp. 1054–1058, 2008.
[19] P. Z. Zhang, Z. K. Shen, M. Wang et al., “Continuous deforma-
References tion of the Tibetan Plateau from global positioning system
data,” Geology, vol. 32, no. 9, pp. 809–812, 2004.
[1] P. Tapponnier and P. Molnar, “Active faulting and tectonics in [20] P.-Z. Zhang, P. Molnar, and X.-W. Xu, “Late Quaternary and
China,” Journal of Geophysical Research, vol. 82, no. 20, present-day rates of slip along the Altyn Tagh fault, northern
pp. 2905–2930, 1977. margin of the Tibetan Plateau,” Tectonics, vol. 26, pp. 1–8,
[2] P. Tapponnier, G. Peltzer, and R. Armijo, On the mechanics 2007.
of the collision between India and Asia, Geological Society, [21] P. England and P. Molnar, “Right-lateral shear and rotation as
London, 1986. the explanation for strike-slip faulting in eastern Tibet,”
[3] T. M. Harrison, P. Copeland, W. S. Kidd, and A. Yin, “Raising Nature, vol. 344, no. 6262, pp. 140–142, 1990.
Tibet,” Science, vol. 255, no. 5052, pp. 1663–1670, 1992. [22] D.-Y. Yuan, W.-P. Ge, Z.-W. Chen et al., “The growth of
[4] P. Molnar, “Continental tectonics in the aftermath of plate northeastern Tibet and its relevance to large-scale continental
tectonics,” Nature, vol. 335, no. 6186, pp. 131–137, 1988. geodynamics: a review of recent studies,” Tectonics, vol. 32,
[5] J. J. Li and X. M. Fang, “Uplift of the Tibetan Plateau and envi- no. 5, pp. 1358–1370, 2013.
ronmental changes,” Chinese Science Bulletin, vol. 44, no. 23, [23] A. R. Duvall, M. K. Clark, E. Kirby et al., “Low-temperature
pp. 2117–2124, 1999. thermochronometry along the Kunlun and Haiyuan faults,
[6] P. Molnar, P. England, and J. Martinod, “Mantle dynamics, NE Tibetan Plateau: evidence for kinematic change during
uplift of the Tibetan Plateau, and the Indian monsoon,” late-stage orogenesis,” Tectonics, vol. 32, pp. 1190–1211, 2013.
Reviews of Geophysics, vol. 31, pp. 257–396, 1993. [24] A. Zuza and A. Yin, “Continental deformation accommodated
[7] A. Mulch and C. P. Chamberlain, “The rise and growth of by non-rigid passive bookshelf faulting: an example from the
Tibet,” Nature, vol. 439, no. 7077, pp. 670-671, 2006. Cenozoic tectonic development of northern Tibet,” Tectono-
[8] P. Tapponnier, X. Zhiqin, F. Roger et al., “Oblique stepwise physics, vol. 677, pp. 227–240, 2016.
rise and growth of the Tibet Plateau,” Science, vol. 294, [25] F. Cheng, A. V. Zuza, P. J. Haproff et al., “Accommodation of
no. 5574, pp. 1671–1677, 2001. India-Asia convergence via strike-slip faulting and block rota-
[9] G. Peltzer and P. Tapponnier, “Formation and evolution of tion in the Qilian Shan fold-thrust belt, northern margin of the
strike-slip faults, rifts, and basins during the India-Asia Tibetan Plateau,” Journal of the Geological Society, vol. 178,
collision: an experimental approach,” Journal of Geophysical no. 3, pp. jgs2020–jgs2207, 2021.
Research, vol. 93, no. B12, pp. 15085–15117, 1988. [26] R. Freund, “Rotation of strike slip faults in Sistan, southeast
[10] J. P. Avouac, P. Tapponnier, M. Bai, H. You, and G. Wang, Iran,” Journal of Geology, vol. 78, no. 2, pp. 188–200, 1970.
“Active thrusting and folding along the northern Tien Shan [27] W.-J. Zheng, D.-Y. Yuan, P.-Z. Zhang et al., “Tectonic
and late Cenozoic rotation of the Tarim relative to Dzungaria geometry and kinematic dissipation of the active faults in the
and Kazakhstan,” Journal of Geophysical Research, vol. 98, northeastern Tibetan Plateau and their implications for under-
no. B4, pp. 6755–6804, 1993. standing northeastward growth of the plateau (in Chinese with
[11] G. Peltzer and F. Saucier, “Present-day kinematics of Asia English abstract),” Quaternary sciences, vol. 36, pp. 775–788,
derived from geologic fault rates,” Journal of Geophysical 2016.
Research, vol. 101, no. B12, pp. 27943–27956, 1996. [28] G. M. Frost, R. S. Coe, Z. Meng et al., “Preliminary early Cre-
[12] W. Thatcher, “Microplate model for the present-day deforma- taceous paleomagnetic results from the Gansu Corridor,
tion of Tibet,” Journal of Geophysical Research, vol. 112, article China,” Earth and Planetary Science Letters, vol. 129, no. 1-4,
B01401, 2007. pp. 217–232, 1995.
[13] F. Cheng, M. Jolivet, G. Dupont-Nivet, L. Wang, X. Yu, and [29] Y. Chen, S. Gilder, N. Halim, J. P. Cogné, and V. Courtillot,
Z. Guo, “Lateral extrusion along the Altyn Tagh fault, Qilian “New paleomagnetic constraints on central Asian kinematics:
Shan (NE Tibet): insight from a 3D crustal budget,” Terra displacement along the Altyn Tagh fault and rotation of the
Nova, vol. 27, pp. 416–425, 2015. Qaidam Basin,” Tectonics, vol. 21, no. 5, pp. 6-1–6-19, 2002.
[14] J. du, B. Fu, Q. Guo, P. Shi, G. Xue, and H. Xu, “Segmentation [30] Y. Chen, H. Wu, V. Courtillot, and S. Gilder, “Large N-S
and termination of the surface rupture zone produced by the convergence at the northern edge of the Tibetan plateau?
1932 Ms 7.6 Changma earthquake: new insights into the slip New Early Cretaceous paleomagnetic data from Hexi
partitioning of the eastern Altyn Tagh fault system,” Litho- Corridor, NW China,” Earth and Planetary Science Letters,
sphere, vol. 12, no. 1, pp. 19–39, 2020. vol. 201, no. 2, pp. 293–307, 2002.
[15] P. England and D. McKenzie, “A thin viscous sheet model for [31] Z. M. Sun, Z. Y. Yang, J. L. Pei, T. S. Yang, and X. S. Wang,
continental deformation,” Geophysical Journal International, “New Early Cretaceous paleomagnetic data from volcanic
vol. 70, no. 2, pp. 295–321, 1982. and red beds of the eastern Qaidam Block and its implications
[16] P. England and G. Houseman, “Finite strain calculations of for tectonics of Central Asia,” Earth and Planetary Science
continental deformation. 2. Comparison with the India-Asia Letters, vol. 243, no. 1-2, pp. 268–281, 2006.
Downloaded from http://pubs.geoscienceworld.org/gsa/lithosphere/article-pdf/doi/10.2113/2021/4115729/5415115/4115729.pdf
by guestYou can also read