Tiverton Neighbourhood Plan - Appendix A to Neighbourhood Area Profile - Tiverton ...
←
→
Page content transcription
If your browser does not render page correctly, please read the page content below
Tiverton Neighbourhood Plan
                                                      Neighbourhood Profile

                              Appendix A to
                                    Tiverton
                 Neighbourhood Plan

   Neighbourhood Area Profile

   Note: Yet to be proofed and edited.
   March 2020

Tiverton Neighbourhood Plan Group
                                                                     Page 1
Tiverton Neighbourhood Plan
Neighbourhood Profile
Contents
1. Introduction .................................................................................................................... 4
Summary .............................................................................................................................. 6
2. Population ....................................................................................................................... 7
Age structure ........................................................................................................................ 7
3. Housing ........................................................................................................................... 9
Type and Size of Housing .................................................................................................... 9
Dwelling Type ............................................................................................................... 9
Number of bedrooms .................................................................................................. 11
Household composition .............................................................................................. 12
Household occupancy rates........................................................................................ 12
Size of property by tenure.......................................................................................... 13
Tenure and affordability of housing ................................................................................. 16
Market Housing ................................................................................................................. 19
Affordable housing for sale ................................................................................................ 20
Social Rented Housing ....................................................................................................... 22
The need – evidence from Devon Home Choice........................................................ 23
The need – homelessness evidence from Mid Devon District Council and the
Churches Housing Action Trust (CHAT) ....................................................... 23
The supply .................................................................................................................. 23
Delivering new social housing - financing social rented housing ........................... 25
The supply – funding social housing through planning agreements ...................... 25
The effect of Planning Policy on social housing provision ....................................... 26
Private rented housing ...................................................................................................... 27
4. Energy efficiency in social rented (LA) Housing ........................................................... 31
Solar panels ........................................................................................................................ 31
Maintenance ....................................................................................................................... 31
Energy efficiency ................................................................................................................ 32
5. Work and skills ............................................................................................................. 35
Economically active residents ........................................................................................... 35
Mode of travel to work ....................................................................................................... 35
Distance travelled to work ................................................................................................ 36
Access to a car .................................................................................................................... 38
Qualifications and industry ............................................................................................... 39
6. Health ........................................................................................................................... 41
Tiverton Neighbourhood Plan Group
Page 2Tiverton Neighbourhood Plan
Neighbourhood Profile
Tiverton Neighbourhood Plan Group
Page 3Tiverton Neighbourhood Plan
Neighbourhood Profile
1. Introduction
Tiverton is a large parish located in mid Devon, comprising the main market town of Tiverton,
with a population of around 21,000 people, and a very rural hinterland, spreading from
Bickleigh Bridge in the south to beyond Cove in the north, and from west of Withleigh to East
Mere. The parish is roughly shaped as a backwards capital L with Washfield parish cutting
deeply into it. Other hamlets include Bolham, Chettiscombe and Chevithorne. The River Exe
flows south through the western part of the parish, carving out the river valley, with steep,
wooded sides. Apart from the lowland areas to the east, and the flood plains, the greater part
of the parish comprises rolling farmland and wooded hilltops and valleys.
The town stands at the confluence of the rivers Exe and Lowman; the name ‘Tiverton’ derives
from "Twy-ford-ton" or "Twyverton", meaning "the town on two fords", and was historically
referred to as "Twyford".
Tiverton is located to the south of the A361, which provides direct access five miles to the east
to the M5 and to Tiverton Parkway Railway Station. This is on the region’s main line, with
frequent trains to Bristol, London, the Midlands and the North, as well as Exeter, Plymouth and
Cornwall. Beyond the A361, the road system comprises narrow, often single-track lanes
bordered by hedgerows and trees.
To inform the emerging Neighbourhood Plan, it is helpful to prepare a detailed profile of the
neighbourhood area. This includes statistical information about the local population, economy,
housing and health.
The profile helps in forming an understanding of the challenges and opportunities facing
Tiverton, which in turn will inform the development of the vision and objectives for the
Neighbourhood Plan, which the policies contained in the Neighbourhood Plan will seek to
deliver. Unless stated otherwise, figures are taken from the 2011 Census (Nomisweb).
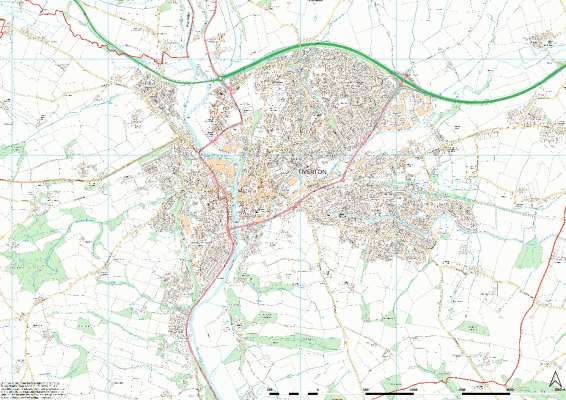
Figures 1.1 and 1.2 show maps of the neighbourhood area and the main settlement of Tiverton
within that.
Tiverton Neighbourhood Plan Group
Page 4Tiverton Neighbourhood Plan
Neighbourhood Profile
Figure 1.1: Neighbourhood Plan Area
Figure 1.2: Inset showing Tiverton town
Tiverton Neighbourhood Plan Group
Page 5Tiverton Neighbourhood Plan
Neighbourhood Profile
Summary
The key aspects of the profile of the neighbourhood area, as they relate to the Neighbourhood
Plan, are as follows:
• To complete – summarise the key aspects once the entire profile is complete – these will
help us to consider the main challenges and opportunities facing Tiverton which in turn will
help us to shape the draft vision and objectives for the parish. It will be the neighbourhood
plan policies (and any associated community actions) that serve to deliver those objectives
The following paragraphs set out the detailed statistics and trend data for the neighbourhood
area.
Tiverton Neighbourhood Plan Group
Page 6Tiverton Neighbourhood Plan
Neighbourhood Profile
2. Population
Age structure
The 2011 Census recorded that the usual population of the parish was 21,335 people and there
were 9,471 household spaces (9,182 of these with usual residents). The population of Mid Devon
district as a whole was 77,750, so the parish of Tiverton represents approximately 27% of the
overall population of the district. The majority of residents live within the settlement of Tiverton
itself.
Figure 2.1 below shows the age breakdown of the population for Tiverton in 2011, compared to
that for the district and the south west region. The figures for Tiverton reveal a slightly larger
population size among those aged 25 to 44, and 0 to 15, suggesting that the parish is popular with
younger families. There were significant numbers of older people, aged 65+, in 2011 and a large
cohort of those in the 45 to 65 bracket, many of whom in 2020, will have reached the older age
group.
35%
30%
25%
20%
15%
10%
5%
0%
0 to 15 16 to 24 25 to 44 45 to 64 65+
Tiverton 20% 10% 25% 25% 20%
Mid Devon 19% 9% 23% 29% 20%
South West 18% 11% 25% 27% 20%
Tiverton Mid Devon South West
Figure 2.1: Age profile of Tiverton residents, 2011
It’s interesting to consider how the population is evolving and Figure 2.2 reveals the change in
age profile of the population between 2001 and 2011. The total population of the parish
increased by 2,714 people (from 18,621 to 21,335), which is approximately a 15% increase. This
is significantly higher than the growth across mid Devon district (11%) and the south west region
(7%).
Tiverton Neighbourhood Plan Group
Page 7Tiverton Neighbourhood Plan
Neighbourhood Profile
25%
20%
15%
10%
5%
0%
-5%
0 to 15 16 to 24 25 to 44 45 to 64 65+
Tiverton 14% 19% 10% 18% 16%
Mid Devon 5% 19% -2% 19% 22%
South West -1% 20% -2% 15% 13%
Tiverton Mid Devon South West
Figure 2.2: Change in age profile of Tiverton residents, 2001 to 2011
Over the course of the 10 years between 2001 and 2011, the number of people aged across all
age groups increased quite dramatically, although it is the younger cohort and families in
particular that has grown the most when compared to the wider geographic areas. In contrast,
the number of those approaching retirement grew significantly. The growth in those aged 45
and over is significant as these will, in 2020, be approaching the final bracket.
Implications for the Neighbourhood Plan
The housing and care needs of the older generation, particularly those aged 85 and over,
should be considered within the neighbourhood plan in terms of the sorts of housing and
community services they might require.
Equally, it will be important to ensure that the full range of services and facilities to cater for
a growing number of younger people and families is provided.
Tiverton Neighbourhood Plan Group
Page 8Tiverton Neighbourhood Plan
Neighbourhood Profile
3. Housing
As part of the Neighbourhood Plan process, a Local Housing Needs Assessment (HNA) for
Tiverton was undertaken, which explored four topics: Tenure and affordability; Type and Size of
housing; Housing for Newly-forming households and first time buyers; and Specialist Housing for
older people. The report reviewed census data and also looked at trends that might impact on
population growth, in order to provide detail on the housing need within the parish and how this
might be most effectively met.
In parallel to the HNA, the Neighbourhood Plan Housing Focus Group also investigated data
about housing in Tiverton. Whilst the HNA is largely based on historic census data, the work of
the Housing Group sought to understand what has happened in the period since the 2011
Census.
A summary of the key findings of both the HNA and the work of the Housing Group is provided
below and a commentary on implications for the neighbourhood plan is included in the purple
boxes.
Type and Size of Housing
Dwelling Type
There were 9,471 household spaces in the parish in 2011 and Figure 2.3 breaks these down by
type, compared to those in Mid Devon district and across the south west region.
45%
40%
35%
30%
25%
20%
15%
10%
5%
0%
Detached Semi-detached Terraced Flats Other
Tiverton 26% 29% 30% 15% 0%
Mid Devon 38% 29% 23% 9% 1%
South West 30% 27% 23% 19% 1%
Tiverton Mid Devon South West
Figure 2.3 – Type of housing in the parish
The majority of homes in Tiverton parish are terraced, the number being significantly higher than
the other types. In contrast, the parish has a lower proportion of detached housing compared to
the wider area. The parish has a high number of flats compared to the district, although there is
concern locally that some town centre flats above shops may lie vacant.
Tiverton Neighbourhood Plan Group
Page 9Tiverton Neighbourhood Plan
Neighbourhood Profile
Empty properties
In 2011, of the 9,471 homes in the parish, 3% had no usual resident (289 homes), compared
to 4% across Mid Devon and 6% across the South West. The figures for the region are likely to
include a proportion of second homes, which are not usually occupied throughout the year.
An update provided from the Mid Devon District Council (MDDC) Communities Team suggests
that there are approximately 350 empty homes (across the district). In Tiverton, at Jan 2020
there were 107 empty homes targeted by MDDC to assist owners to bring them back into use.
This reveals that the number of empty homes has reduced since 2011.
Second home ownership is not, however, a significant factor for Tiverton. Rather the reason
for homes being vacant is that they are not in a fit state for habitation or do not meet current
fire regulations. This is certainly the case for many of the flats above retail units in Tiverton
Town Centre.
When considering how to bring flats above shops back into use, there are a number of issues:
i. Many shops are franchises with leases, so they are only interested in the business
premises (and in fact may only lease these, not the upper floors);
ii. Access in the past has usually been by a separate door at street level going to the
upper floors, but a number of these have been blocked up to widen the ground floor,
so the only route is through the commercial premises;
iii. Some flats above the shops can be accessed from nearby properties, though this leads
to long corridors;
iv. Making upper floor flats safe in case of fire, with suitable exits, is difficult.
The Neighbourhood Plan should encourage close working with MDDC and other partners to
continue to find ways to bring vacant properties back into use.
Figure 2.4 shows the difference in types of homes between 2001 and 2011. Overall during this
period, there was a 15% increase in the number of homes in Tiverton, compared to 13% and 10%
increase across the district and region respectively. All types of housing have increased, but most
significantly, the number of flats and semi-detached properties.
Tiverton Neighbourhood Plan Group
Page 10Tiverton Neighbourhood Plan
Neighbourhood Profile
35%
30%
25%
20%
15%
10%
5%
0%
Detached Semi-detached Terraced Flats
Tiverton 10% 19% 10% 29%
Mid Devon 9% 16% 13% 24%
South West 6% 7% 7% 27%
Tiverton Mid Devon South West
Figure 2.4: Change in % of types of property
Number of bedrooms
Figure 2.5 sets out the proportion of occupied dwellings by number of bedrooms in Tiverton and
respective geographies. The data reveals that the majority of homes in 2011 in Tiverton had two
or three bedrooms, with one bedroom properties also above average for the area. This is
perhaps unsurprising given the larger percentage of terraced houses and flats/apartments in the
parish.
On the other hand, the proportion of larger properties – with four or more bedrooms – is less
than across the region and wider area, suggesting that there could be a deficit of homes for those
with larger or extended families.
45%
40%
35%
30%
25%
20%
15%
10%
5%
0%
0 2 3 4 5 or more
1 bedroom
bedrooms bedrooms bedrooms bedrooms bedrooms
Tiverton 0% 11% 30% 41% 13% 5%
Mid Devon 0% 8% 26% 40% 19% 7%
South West 0% 11% 27% 40% 16% 5%
Tiverton Mid Devon South West
Figure 2.5: Number of bedrooms
Tiverton Neighbourhood Plan Group
Page 11Tiverton Neighbourhood Plan
Neighbourhood Profile
Household composition
Household composition is a fundamental factor driving the size of housing needed in the parish
in the future. Figure 2.12 sets out the household composition by age in the parish compared to
the district and wider region.
Mid South
Tiverton Devon West
One person Total 30% 27% 30%
household Aged 65 and over 15% 14% 14%
Other 16% 14% 16%
One family only Total 64% 67% 63%
All aged 65 and over 11% 11% 10%
With no children 19% 21% 20%
With dependent children 26% 26% 25%
All children non-dependent 8% 9% 9%
Other household
types Total 6% 6% 7%
Figure 2.12: Household composition by age
The figures for the parish largely mirror that of the district and region, with just under one third
of homes occupied by a single person, of which half are aged 65 years and over. Approximately
two-thirds of homes are occupied by a single family. As seen previously, the majority of homes
in the parish have two or three bedrooms, which could present a problem for families wishing
to upsize and also for singletons wishing to downsize.
Household occupancy rates
Figure 2.13 shows the average number of people living in a home in Tiverton parish compared
to the district and wider region. There were 9,182 households (occupied) in Tiverton and 21,335
usual residents. This means that the average number of people living in a dwelling was 2.3, which
is marginally lower than across Mid Devon and the south west.
2.38
2.37
2.36
2.35
2.34
2.33
2.32
2.31
2.3
2.29
Tiverton Mid Devon South West
Figure 2.13: Average number of people per dwelling.
Tiverton Neighbourhood Plan Group
Page 12Tiverton Neighbourhood Plan
Neighbourhood Profile
It is helpful to drill down further to explore the extent to which households are either over- or
under-occupied. Over-occupation may occur where there are a larger number of people living in
a dwelling with a smaller number of rooms and vice versa for under-occupation. Over-occupation
can lead to detrimental living conditions and is therefore not desirable. On the other hand, while
under-occupancy might suggest that housing is effectively tied-up and not available for growing
or extended families, many people choose to remain in their larger family home when their
children move out, in order to retain that property for space, value or sentimental purposes. If
however, the reason for under-occupation is because there are insufficient local properties to
downsize into, then this can indicate a challenge that can be addressed via the planning system.
Figure 2.14 provides this detail, showing the percentage of dwellings in Tiverton and the wider
geographies that are either under- or over-occupied, in the context of number of bedrooms. The
data reveals 35% of dwellings in the parish are under-occupied by two bedrooms or more and a
further 36% by one bedroom. The data is somewhat in line with the district and region, but shows
that under-occupation of housing is not uncommon in Tiverton, and perhaps leads to the
conclusion that additional numbers of smaller homes are required.
50%
45%
40%
35%
30%
25%
20%
15%
10%
5%
0%
Underoccupi Underoccupi
Overcrowded Overcrowded
ed by 2 or ed by 1 or Neither
by 1 by 2 or more
more more
Tiverton 35% 36% 26% 2% 0%
Mid Devon 44% 34% 21% 2% 0%
South West 39% 35% 24% 2% 0%
Tiverton Mid Devon South West
Figure 2.14: Percentages of properties either over- or under-occupied.
Size of property by tenure
Figure 2.10 shows the dwellings by number of bedrooms across the parish by tenure at the time
of the Census 2011. Both the social rented and private rented sectors have a significantly higher
proportion of 1-bedroom dwellings (c28% and c18% respectively) compared to 3% of owner-
occupied properties. This is important as it means that for those on median to lower incomes,
seeking smaller properties, the rental sector provides the main route for them. Equally, anyone
wishing to downsize to a smaller property may find it difficult unless they wish to rent.
The same is true for 2-bedroom dwellings, where numbers in both the social and private rented
sectors are also significantly higher than that of the owner-occupied properties at c39% and
c40% respectively.
3-bedroom dwellings form the highest percentage across the owned tenure category, but
significantly, the number is reduced for the rental sector. Approximately 25%% of the owner-
Tiverton Neighbourhood Plan Group
Page 13Tiverton Neighbourhood Plan
Neighbourhood Profile
occupied dwellings comprise larger (4+ dwellings) in contrast to the social rented sector, which
sits at just 3%. This could mean that larger or extended lower income families will struggle to
find affordable accommodation in the parish.
All ownership (inc. Private rented/
shared ownership) Social rented rent free
Number % Number % Number %
1 bed
dwellings 180 3% 469 28% 349 18%
2 bed
dwellings 1,365 24% 642 39% 769 40%
3 bed
dwellings 2,665 48% 497 30% 622 32%
4+ bed
dwellings 1,377 25% 43 3% 204 10%
Total 5,587 1,651 1,944
Figure 2.10: Dwellings by bedroom number by tenure in Tiverton
What type (terrace, semi, bungalows, flats and detached) and size (number of habitable rooms)
of housing is appropriate for the Plan area over the Neighbourhood Plan period?
The HNA concluded the following:
• The housing stock in Tiverton is currently characterised by small to medium size dwellings of 4-
6 rooms (67%), followed by larger dwellings of 7+ rooms (22%), and finally small dwellings
consisting of 1-3 rooms (11%).
• Tiverton has a slightly higher percentage of one person households than families when
compared to Mid Devon as a whole. There is also high number of families and older people
currently living in the parish.
• Over the period from 2011 to 2033, however, the 65+ age groups is expected to increase
dramatically by 66.4% while most other age groups tend to contract.
• By 2033, medium sized dwellings should form for the majority of Tiverton’s housing stock such
as 3 bedroom homes (40%), 2 bedroom homes (27%) and 4 bedrooms homes (18%).
• If local circumstance suggests smaller homes would be more appropriate for the purpose of
downsizing, this should be given greater weight.
The report suggests that combining projections with current preferences between household
age and dwelling size at district level indicates how many properties of each size will be needed
by the end of Tiverton’s Plan period. This results in the following dwelling size split, although this
should be flexible to changing circumstances.
• 1 bedroom (8.8%)
• 2 bedroom (27.1%)
• 3 bedroom (39.5%)
Tiverton Neighbourhood Plan Group
Page 14Tiverton Neighbourhood Plan
Neighbourhood Profile
• 4 bedroom (18%)
• 5+ bedroom (6.7%)
The Neighbourhood Plan Housing Group, however, has explored this further, considering
additional and more recent evidence at the very local level. It is concerned that the findings of
the HNA do not go far enough in recommendations to deliver smaller, one- and two- bedroom
properties, particularly for those requiring affordable housing. The HNA largely relies on the
2011 Census figures, which are now somewhat out of date, and recommend that its findings
should be subject to more local evaluation and evidence.
The following more recent evidence has been considered by the Housing Group:
The Exeter Strategic Housing Market Assessment (in 2015) estimated that 45% of the need for
social and affordable rented housing was for one bedroom properties, and 40% for two
bedroom.
The Housing Strategy for Mid Devon District Council (2015-2020) noted that 51% of current
applicants registered with Devon Home Choice in Bands A to D in Mid Devon were in need of
one bedroom accommodation, and 29% in need of two bedroom accommodation. It also noted
that approximately 260 tenants in 2015 were subject to a reduction in their housing benefit
(Universal Credit) through the removal of the Spare Bedroom Subsidy (more usually known as
the Bedroom Tax); it is likely that many of these tenants may want, or be forced by lack of
income, to downsize.
Figures supplied by Devon Home Choice (June 2019) show that, in Tiverton, in Bands A to D, the
percentage of applicants needing one bedroom was even higher than in the district as a whole,
at 54%, while those needing two bedrooms was lower at 21%.
Implications for the Neighbourhood Plan
Size of Home: The additional detail provided at the very local level supports strongly a need
to ensure that the new developments include adequate numbers of smaller (one- and two-
bedroom) homes, particularly in the affordable rented sector. This will enable those wishing
to get onto the housing ladder to do so, while also providing adequate numbers of properties
for those people wishing to downsize. This latter provision is significant given the growing
number of older people in the parish, who may want to remain independent but in a more
manageably sized home.
Type of Home: The type of home (detached, semi-detached, terraced or flat) is more a
matter of taste than need and was therefore of secondary importance in the context of a
Housing Needs Assessment. Notwithstanding this, the housing types that the report
recommended as most likely to meet local needs, based on the current stock transaction
data from the land registry, was detached homes. Additionally, bungalows appeal to the
elderly population and this particular type should be promoted so as to meet the demand
of a growing elderly population.
Tiverton Neighbourhood Plan Group
Page 15Tiverton Neighbourhood Plan
Neighbourhood Profile
In the context of the need for more affordable and smaller-sized homes, however, clearly
there will be a strong justification for higher density housing, which makes more efficient
use of land, thereby keeping costs to a minimum. There is a strong desire locally to ensure
that new housing is also designed in the most sustainable manner, which will not only serve
to minimise negative impacts on climate change, but will also help to reduce running costs
to the homeowner. This topic is explored in more detail later on in this report.
Empty Homes: As noted above, there is a significant number of empty homes, largely flats
above town centre retail units that could be brought back into habitable use. This is a
project that the Neighbourhood Plan should support.
Tenure and affordability of housing
The tenure of housing refers to the legal status of the occupier in relation to the property in
which they live. The key tenures for the purpose of this analysis are:
Owner occupier Where the occupier owns the property on a freehold or long
leasehold basis with or without a mortgage.
Private rent Where the tenant rents the property from a private individual or
organisation usually at a rent dictated by market conditions, but in
any event free from statutory or other regulatory rent controls.
Affordable housing Where the tenant rents the property from a registered provider of
for rent social housing (Registered Provider) and the property is let at a
below market level rent and controlled by statute or other
regulatory power. A Registered Provider is usually a local authority
landlord or housing association.
Affordable housing Where the occupier owns or part owns the property and has
for sale received some form of subsidy in order to do so. The property will
usually be bound by some form of condition or covenant that
ensures that the subsidy remains vested in the property.
The tenure of housing at the time of the 2011 Census is illustrated in Figure 2.6, revealing that a
large majority of homes in the parish were owned by their occupants, either outright or with a
mortgage, but that this was a significantly lower percentage than in Mid Devon or the South
West. The percentage of Local Authority housing was double the percentage in the region, and
the private rented sector was slightly larger. Other social rented (mainly housing association)
was relatively lower.
Tiverton Neighbourhood Plan Group
Page 16Tiverton Neighbourhood Plan
Neighbourhood Profile
80%
70%
60%
50%
40%
30%
20%
10%
0%
Rented from Other social
Owned Private rented Living rent free
local authority rented
Tiverton 60% 13% 5% 19% 2%
Mid Devon 69% 9% 4% 16% 2%
South West 67% 6% 8% 17% 1%
Tiverton Mid Devon South West
Figure 2.6: Tenure of housing
When viewed against the figures for 2001, as shown in Figure 2.7, it is clear that the number of
properties available to rent from the local authority reduced significantly over the ten year
period from 2001 to 2011. This could have a detrimental impact on the availability of homes at
more affordable rents, although the number of other social rented homes (for instance through
housing associations) has increased.
100%
80%
60%
40%
20%
0%
-20%
-40%
-60%
-80%
Rented from Other social Living rent free/
Owned Private rented
local authority rented other
Tiverton 22% -10% 54% 76% -49%
Mid Devon 21% -11% 44% 62% -50%
South West 13% -19% 41% 72% -60%
Tiverton Mid Devon South West
Figure 2.7: Tenure change between 2001 and 2011
The HNA investigated affordability of housing in the parish, exploring the levels of income
required to afford different tenures. Figure 2.8 shows the findings, based on average incomes
in Mid Devon, which is displayed in chart form in Figure 2.9.
Tiverton Neighbourhood Plan Group
Page 17Tiverton Neighbourhood Plan
Neighbourhood Profile
Figure 2.8: Affordability thresholds in Tiverton
Figure 2.9: Income required to afford different tenures of home
Implications for the Neighbourhood Plan
The data reveals that the income required to buy an entry-level market home for sale is
insufficient for those on median or lower quartile household incomes.
The most affordable forms of tenure in Tiverton are Social Rent, Affordable Rent and Shared
Ownership at 25% and 50%. The only potentially affordable tenure for those in the lower
income quartile is social rent.
The Neighbourhood Plan, therefore, needs to encourage the provision of lower cost housing
options, across all tenures, but particularly for affordable purchase and rent.
Tiverton Neighbourhood Plan Group
Page 18Tiverton Neighbourhood Plan
Neighbourhood Profile
Market Housing
At present home ownership is the most popular form of tenure in Tiverton. Figure 2.10 shows
changes in the number of properties sold each month in the EX16 postcode area and their
average price.
Figure 2.10: Average house prices in EX16 postcode area between July 2019 and October 2019 (source:
www.rightmove.co.uk)
A comparison of house price sales by type and value with nearby settlements between April 2019
to April 2020 is provided in Figure 2.11 below (data source: www.rightmove.co.uk).
Compared to the other locations, on the whole house prices in Tiverton appear to be more
modestly priced. This includes in comparison to the neighbouring larger settlements. Homes in
more rural areas, on the other hand, tend to be more expensive. This is not to say that market
house prices in Tiverton are ‘affordable’, as shown previously, where realistically only those with
a median or higher income is able to afford an entry-level market house.
Average sold price
Settlement Detached Semi-detached Terraced All properties
Tiverton £311,956 £228,231 £178,964 £220,763
(most sold) (256 sold)
Tiverton Neighbourhood Plan Group
Page 19Tiverton Neighbourhood Plan
Neighbourhood Profile
Cullompton £288,701 £236,685 £179,629 £220,629
(most sold) (136 sold)
East Mere £478,828 £247,429 £209,700 £367,291
(most sold) (29 sold)
Halberton £335,000 £212,500 £213,250 £253,667
(most sold) (9 sold)
Exeter £442,689 £293,461 £261,396 £297,094
(most sold) (1,617 sold)
Barnstaple £313,932 £227,027 £176,749 £227,968
(most sold) (394 sold)
Taunton £351,938 £238,891 £190,394 £238,218
(most sold) (940 sold)
Figure 2.11: Average sold house prices in Tiverton compared to neighbouring settlements (source:
www.rightmove.co.uk)
The HNA revealed that house prices in Tiverton have grown at a steady rate between 2009 and
2018, increasing by an average of 28%, higher than both district and national rates. Semi-
detached homes within the parish have seen the most significant increase in price, followed by
terraced and detached homes.
The median and lower quartile annual household income within the Neighbourhood Plan area
are £27,567 and £18,709 respectively. Comparing these affordability thresholds with costs of
each tenure, it is clear that the most affordable forms of tenure in Tiverton are Social Rent,
Affordable Rent and Shared Ownership at 25% and 50%.
Affordable housing for sale
The latest definition of affordable housing is defined in Annex 2 of the NPPF 2018 (updated Feb.
2019). The main ‘affordable housing for sale’ tenures are:
• Starter Homes - these are sold at 80% of the market value of the dwelling to qualifying first time
buyers up to the age of 40. After five years of occupation the unowned equity is gifted to the
owner. The Starter Homes programme requires secondary legislation to be enacted before the
programme can begin and this has yet to happen. It also appears that First Homes will in effect
replace Starter Homes as the key government initiative to help first time buyers.
• Discounted market sales housing - similar to Starter Homes, these are dwellings sold at up to
80% of their market value. However this tenure differs to Starter Homes in that dwellings can
sold at less than 80% of their value. Buyers are not restricted by age and they are not discounted
if they have purchased a property before, although they cannot continue to own another
property. Unlike Starter Homes the discounted element remains in perpetuity.
• Shared ownership housing – this is the most common form of Affordable Housing for Sale. The
buyer acquires a share of the dwelling of between 25% and 75% and pays a subsidised rent
(usually 2.5% to 2.75%) of the unowned value of the dwelling. Buyers usually have the option
to acquire the unowned proportion after a period of occupation. This is known as staircasing.
MDDC's policy (in the Local Plan and its new version) is that unless otherwise stated in a site allocation policy, on
open market housing sites the targets for affordable dwellings should be:
Tiverton Neighbourhood Plan Group
Page 20Tiverton Neighbourhood Plan
Neighbourhood Profile
- In Tiverton, on sites of 11 dwellings or more: 28%
- Outside Tiverton and the other main towns, on sites of 6 dwellings or more: 30%, although if
the sites are between 6 and 10 dwellings, a financial contribution can be made to build the
housing elsewhere.
Policy TIV1 notes that the Masterplan for the Eastern Urban Extension includes a target for
affordable housing of 35% ‘subject to further assessment of viablility’.
The table below provides a summary of the numbers of affordable homes delivered (or to be
delivered) in recent Tiverton developments:
No of Policy Policy Negotiated Negotiated Gain or shortfall
homes number
%1 % No.
Barrett David
Wilson Homes
330 35% 21.5%
Outline
Barrett David 248 plus 78 35%
Wilson Homes affordable
114 24% 78 36
Reserve
Chettiscombe
Trust Land
700 35% 245 22.5% 157 88
36 Post Hill 18 35% 6 11% 2 4
Farleigh 255 35% 25.4% 65 24
Meadows
Palmerston 26
Park
Tiverton EUE
total Area A
10442 35% 365 237 128
The figures demonstrate a trend in the undersupply of affordable homes against the policy
requirements.
1 Subject to viability
2 Outline permission is for 1048 total, but Barrett/David Wilson reduced by 4 at Reserve Matters
Tiverton Neighbourhood Plan Group
Page 21Tiverton Neighbourhood Plan
Neighbourhood Profile
In Tiverton, between 2001 and 2011, Shared Ownership in the parish increased significantly
thanks to a government-backed schemed relaunched in the last 10 years. That said, only Shared
Ownership at 25% can be considered a viable option for those on a lower quartile income seeking
home ownership.
The Exeter Housing Market SHMA advises building more low cost market housing within the
District to assist first time buyers, although it weights the tenure mix balance in favour of Social
rent over Affordable housing for sale (75:25), to account for those unable to afford Private Rent.
Implications for the Neighbourhood Plan
Mid Devon District Council provides a quantity figure of 2,358 dwellings to be provided in Tiverton
over the Neighbourhood Plan period. Local Policy requires that 30% of these or 707 homes should
be affordable.
In terms of a tenure split, the HNA recommends that 40% offer routes to home ownership (10%
Starter Homes and 30% Shared Ownership at 25% and 50%) and 60% offer Affordable Housing for
rent in the form of Social Rent. The rationale for this % split is explored more in the social rent
section of this report, where the Housing Focus Group consider that the split should in fact be
weighted more toward Social Rent.
Another consideration, however is the proposed introduction of First Homes as a form of discounted
market housing. The government consultation on First Homes proposes that the minimum discount
is 30% off the market sale value, as opposed to the 20% minimum required of discounted market
homes. The MHCLG consultation paper February 2020 (para. 18) states that “Local Authorities have
the discretion to set higher discounts on properties on a site-by-site basis, and we expect them to
seriously consider this when determining local discounts”.
It is also proposed that Local Authorities (LA) also set criteria for eligibility, which enables LAs to
prioritise local residents and essential workers, although this shall be time limited.
As mentioned, it is anticipated that the Starter Homes programme will be effectively disbanded and
that First Homes will become the Government’s flagship affordable home ownership tenure.
Given the lack of affordability of Affordable Houses for Sale in the parish, the Neighbourhood Plan
should strongly encourage higher discounts to be applied to First Homes, to tackle this.
Social Rented Housing
The HNA examines the affordability of housing to local people, by taking the median annual
household income (£27,567) and the lower quartile household income (£18,709) for the
neighbourhood plan area, and comparing these to the income needed to buy or rent a home at
entry level market sale, shared ownership, starter homes and various types of renting.
The report concludes that ‘surprisingly half of these tenure forms (such as Starter Homes and
Shared Ownership at 75% and 50%) are out of reach for most people on both lower quartile and
median incomes. Only Shared Ownership at 25% can be considered a viable option for younger
buyers seeking home ownership in the neighbourhood area.’
Tiverton Neighbourhood Plan Group
Page 22Tiverton Neighbourhood Plan
Neighbourhood Profile
On renting, the report concludes that ‘it is evident that market rents are unaffordable for most
people, edging just over the median income. Affordable renting can be considered just about
viable for those on a lower quartile income. Social rent is the most affordable tenure option in
Tiverton, falling below the lower quartile and well below the median.’
The need – evidence from Devon Home Choice
Devon Home Choice is the organisation which administers lettings on behalf of local councils and
housing associations. People who want housing need to register with the organisation, who then
assess their need and then place them in a Band – A to E - with A being the most in need, and
band E assessed as not in need.
Devon Home Choice does not keep statistics at parish level, however in Mid Devon it records
that at the end of each of the last three years, the number of households registered were:
As at
A B C D Total A to D E
end
Mar-19 0 110 262 503 875 1081
Mar-18 0 104 270 517 891 1031
Mar-17 0 150 270 474 894 844
Figure x: Households registered with Devon Home Choice (Source: Devon Home Choice)
From this table it can be seen that the numbers of people in need of housing (in bands A to D)
reduced by 2% in two years.
The need – homelessness evidence from Mid Devon District Council and the Churches
Housing Action Team (CHAT)
MDDC received 599 approaches for advice or assistance from potentially or actually homeless
households during the financial year 18/193.
CHAT provides support and advice to people who are homeless, or threatened with
homelessness. In the year to March 2019 they supported 442 households, over 300 of whom
registered with an EX16 post-code, and 50% of whom were aged between 17 and 344.
The supply
At 2018, there were 1,396 social rented housing association homes in Mid Devon5. A breakdown
of these is shown in Figure x (the difference in totals may be explained by the date and source
of the data).
3
Source: Claire Fry, Housing Manager, MDDC, June 2019
4
Source: CHAT
5 Regulator of Social Housing statistical data Table SDR 2018
Tiverton Neighbourhood Plan Group
Page 23Tiverton Neighbourhood Plan
Neighbourhood Profile
Total
Housing Association stock at Social General Housing
April 2019 (Private Registered Stock in needs self- for older Low cost
Provider (PRP) is the current legal Mid contained Supported people home
term for a housing association. Devon units housing units units ownership
Mid Devon
All units: 1,699 1,128 36 284 251
Advance Housing and Support
1 Limited 3 - - - 3
2 Aster Communities 11 6 - - 5
Clarion Housing Association
3 Limited 20 20 - - -
4 Cornerstone Housing Limited 19 19 - - -
5 Falcon Rural Housing Limited 28 28 - - -
Guinness Care and Support
6 Limited 73 - 21 52 -
Hastoe Housing Association
7 Limited 113 79 - - 34
Heylo Housing Registered
8 Provider Limited 1 - - - 1
9 Housing 21 39 - - 39 -
10 LiveWest Homes Limited 315 254 2 - 59
Progress Housing Association
11 Limited 3 - 3 - -
12 Sanctuary Housing Association 62 33 - 28 1
South Devon Rural Housing
13 Association Limited 2 2 - - -
South Western Housing Society
14 Limited 83 83 - - -
Sovereign Housing Association
15 Limited 299 222 6 - 71
16 Stonewater (5) Limited 31 31 - - -
17 Stonewater Limited 24 20 - - 4
The Abbeyfield Tiverton Society
18 Limited 10 - - 10 -
19 The Guinness Partnership Limited 25 25 - - -
20 Tiverton Almshouse Trust 83 - - 83 -
Westmoreland Supported
21 Housing Limited 4 - 4 - -
22 Westward Housing Group Limited 325 227 - 72 26
23 Yarlington Housing Group 126 79 - - 47
Figure x: Housing Association Housing Stock in Tiverton, 2019. Source: Regulator of Social Housing
Tiverton Neighbourhood Plan Group
Page 24Tiverton Neighbourhood Plan
Neighbourhood Profile
In addition, at 20th May 2019, MDDC owned 2,878 homes, both flats and houses (plus 122 flats
where the council is only the freeholder)6. Of these, 1,236 Council dwellings were located in
Tiverton Parish (of which 52 are leasehold flats) and the vast majority of these are in Tiverton
town7. Within Tiverton parish, the number of social rent homes (from LA) in 2011 was 1,164,
therefore there has been a 6% rise in local authority rented housing.
This 6% rise should be treated with caution however, as although the MDDC has been building
recently (after several decades when they weren’t allowed to), the numbers are very small, and
will have been at least partly offset by further Right-to-Buys. Additionally, while the Census is a
good place to look for relative percentages, it should not be regarded as completely accurate in
terms of the number of Council houses in existence because it relies on people knowing who
their landlord is, and it is not uncommon for people to think they are in a Council house but in
fact are in a housing association house.
The figures today should also be set against the longer term context. Since 1980, when the ‘Right
to Buy’ at a substantial discount was given to Council tenants, 2,846 homes have been sold under
this scheme. Council owned homes in the rural parts of the parish have been particularly
attractive for sitting tenants to purchase. Initially this would make little difference to meeting
housing need, but as the sitting tenants of those properties either sold or died, the properties
would be sold at market value, putting them out of reach of the next generation in need of low-
cost housing.
Therefore whilst the number of Local Authority and housing association social/affordable rent
houses has risen very modestly in the last ten years, when considered over the longer period, it
can be clearly demonstrated that this tenure has been severely eroded, and this needs to be
redressed. The Devon Home Choice statistics (para 2.21 of this report) show households of all
sizes are needed. To be accepted into Band A to D on Devon Home Choice you have to
demonstrate a level of need, not just desire: for Mid Devon this was 1,081 households at March
19, a figure that has actually risen over the last three years.
Delivering new social housing - financing social rented housing
New social rented housing can only be built with a subsidy, as the lower rents cannot fully pay
for the costs of management, maintenance and loan finance for construction. This subsidy
comes either in the form of a capital sum, provided by government (through Homes England),
by local authorities or housing associations from their own funds; or from developers, as part of
a Section 106 agreement8 as a condition of the planning agreement.
The supply – funding social housing through planning agreements
MDDC policy is set out in the Local Plan Review S3, unchanged from the Local Plan. It says that,
unless otherwise stated in a site allocation policy, on open market housing sites the targets for
affordable dwellings should be
- In Tiverton, on sites of 11 dwellings or more: 28%
6
Source: ‘Overview of the Housing Service’ report to Homes Policy Development Group 13/8/19
7 Information from Claire Fry, Housing Manager, MDDC, in June 2019, at a meeting with the focus group
8 Section 106 of the 1990 Town and Country Planning Act (as amended)
Tiverton Neighbourhood Plan Group
Page 25Tiverton Neighbourhood Plan
Neighbourhood Profile
- Outside Tiverton and the other main towns, on sites of 6 dwellings or more: 30%, although if
the sites are between 6 and 10 dwellings, a financial contribution can be made to build the
housing elsewhere.
Policy DM6 enables the development of a site for predominantly affordable housing to meet
proven local need in rural areas, under certain conditions.
Policy TIV1 notes that the Masterplan for the Eastern Urban Extension includes a target for
affordable housing of 35% ‘subject to further assessment of viability’.
Supplementary Planning Document: Meeting Housing Needs, approved in 2012, states that the
Council will seek the provision of affordable housing in approximately the following proportions:
- Social Rented Housing 60%
- Intermediate and Affordable Rent Housing 40%
This, despite a Housing Needs Assessment which concluded that the overall affordable housing
tenure mix balance to address local need could be set at 70% for social rent and 30%
intermediate housing, but should be subject to a wider range of social stock supply and other
planning, regeneration and development viability factors at local area level.
The effect of Planning Policy on social housing provision
The effect of these policies for social housing on sites of various sizes means that:
Number of dwellings on Number of affordable Number of social rented
a site homes (28% on sites
above 10 homes) (60% of 28%)
10 zero zero
20 6 3
50 14 8
100 28 17
The Local Plan Review includes a target of 7,860 houses to be built by 2032/33. With the existing
policy, this would produce 1,321 social rented homes, which, together with the housing
association stock built to date would almost equal the number lost through the Right to Buy, i.e.
take us back to the supply position of 1980, some 50 years earlier, despite the substantial
population increase, to date and projected. The situation could then only be improved by the
development of social rented housing funded through capital grants by MDDC or housing
associations.
Implications for the Neighbourhood Plan
In the light of the housing need figures above, we recommend that:
Tiverton Neighbourhood Plan Group
Page 26Tiverton Neighbourhood Plan
Neighbourhood Profile
• MDDC policy is changed to require 35% affordable housing on all sites of six or more
dwellings
• MDDC policy is changed to require a 75%/25% split of affordable housing into social
rented/other affordable housing
• MDDC renews its efforts to attract capital grant into the district, to develop more
social rented housing.
The Neighbourhood Plan should strongly encourage the highest levels of affordable social
rented accommodation to be delivered in the parish.
Private rented housing
Between 2001 and 2011, the number of people renting privately in Tiverton has increased
dramatically. This could be down to several reasons such as potential buyers being priced out of
home ownership, younger generations seeking the greater flexibility associated with Private
Rent and an increase in buy-to-let investors.
The Housing Focus Group discussed the private rental sector with private rented Sector Tanya
Wenham, Team Leader of the Communities Team in January 2020, who was able to share the
following information:
The 2011 Census revealed that there are about 8,500 houses in the parish, of which about 1,900
(approximately 19%) are privately rented. MDDC do not hold information on how many of these
are ‘buy to let’ landlords, who more commonly are renting out relatively modern properties. It
is thought that most landlords in the town have relatively small portfolios, for instance 5 to 6
properties.
Private rented accommodation (including entry-level) is affordable only to those with median or
above incomes in Tiverton.
As expressed earlier in the report, there are approximately 107 empty properties in Tiverton, the
majority of which are thought to have potential for private rental, and ways to bring these back
into use should be explored.
There are currently 13 properties defined as Houses in Multiple Occupation (HiMOs) in Tiverton.
These are defined as at least five people in at least two households. Need to be licensed (costs
£800)
Implications for the Neighbourhood Plan
The NPPF 2018 acknowledges that build-to-rent dwellings have a role to play in providing
affordable market homes and may meet affordable housing need where they include a
component of affordable private rent.
In Tiverton, however, the majority of private rental properties, including entry-level, are out
of the reach of many earners. It should therefore form part of the housing mix, but not a
Tiverton Neighbourhood Plan Group
Page 27Tiverton Neighbourhood Plan
Neighbourhood Profile
fundamental one, if the aim is to enable more people to be able to have their own home
(be it rented or owned).
Housing for Newly-forming households and first time buyers
What provision should be made in terms of housing for newly forming households/first-time buyers
over the Neighbourhood Plan period?
• In 2011, 17% of all 9,182 households in Tiverton had a head of household aged 35 or less. A
further 331 households like this could potentially be formed, based on the 2011
demographics.
• Those aged 24 and under tend to live within rented accommodation or live rent free (86.1%).
Meanwhile, those aged 25 to 49 tend to be more equally split, with 53.2% owning their own
homes and 46.8% renting or living rent free.
• At the Mid Devon level, those aged 25 or younger are much more likely to be in private
rented accommodation than older age groups, and less than half as likely to be on a path to
home ownership as those over 30. In additions, a much higher proportion of social rented
tenants tend to be under 25, potentially indicating a lack of affordable homes for young
people in the area.
• The Exeter Strategic Housing Market Assessment predicts an increase in the population
across the younger economically active age groups from 2013-2033.
Implications for the Neighbourhood Plan
New-build homes should meet the specific tenure needs of newly forming households,
to include both entry-level market sales (including affordable routes to home ownership)
and private rent. The Assessment suggested that 36% of new home should be offered
for social rent.
Again, the emerging First Homes government policy may provide opportunities to
maximise this figure, at the discretion of the local authority.
Specialist Housing for older people
Tiverton Neighbourhood Plan Group
Page 28Tiverton Neighbourhood Plan
Neighbourhood Profile
What provision should be made for specialist housing for older and disabled people over the
Neighbourhood Plan period?
• Data for Mid Devon suggests that the majority of those over age 55 own their homes outright. 13%
rent their accommodation, primarily within the social rented tenure.
• There are 12 specialist accommodation establishments in Tiverton, excluding communal
establishments (which are outside the scope of the study). These collectively provide 316 bed
spaces. The rate of provision in Tiverton is therefore close to 155 dwellings per 1,000 of the
population aged 75+.
• The elderly population in Tiverton is expected to grow by 5.5%, in line with that of Mid Devon. By
2033, 15% of Tiverton’s population is projected to be elderly (Tiverton is forecast to have an over-
75 population of 3,557 by the end of the Plan period), which will likely increase the demand for
homes that meet the needs of aging people. The projected tenures required to accommodate this
growing demographic are shown in Figure 2.16.
Figure 2.16: Projected tenure of households aged 75+ in Tiverton to the end of the Plan period
• This cohort of the population can be further sub-divided into those whose day-to-day activities are
limited a lot and will need housing with care (e.g. extra care housing, with significant on-site
services, including potentially medical services); and those with their day to day activities are
limited only a little and may simply need adaptations to their existing homes, or alternatively
sheltered or retirement living that can provide some degree of oversight or additional services.
The number of households falling into potential need for specialist accommodation is 1,672, which
is 47% of the 3,557 households in total aged 75 and above projected to live in Tiverton by the end
of the Plan period.
Implications for the Neighbourhood Plan
Given the existing provision of 316 bed spaces in specialist accommodation combined with the
projected growth in the over 75 years age group, and considering those who might require
extra care, there is potentially a need for an additional (i.e. net) 62 specialist units (378 – 316
bed spaces) over the Plan period. Based on current supply, the net additional supply might be
delivered as follows:
Tiverton Neighbourhood Plan Group
Page 29Tiverton Neighbourhood Plan
Neighbourhood Profile
It is considered that 25% of all specialist housing for the elderly should comprise AH tenures is
reasonable and realistic, midway between the tenure-led and Housing LIN projections. This
midpoint target should be monitored for viability as it is implemented, with neighbourhood
planners seeking a higher proportion where appropriate.
Tiverton itself is considered the most sustainable location for such provision, as it is the most
accessible.
Cost effectiveness and economies of scale. This can be achieved by serving the specialist
elderly housing needs arising from a number of different locations and/or neighbourhood plan
areas from a single, centralised point (i.e. what is sometimes referred to as a ‘hub-and-spoke’
model).
Tiverton Neighbourhood Plan Group
Page 30Tiverton Neighbourhood Plan
Neighbourhood Profile
4. Energy efficiency in social rented (LA) Housing
A core principle of the Neighbourhood Plan is to ensure that development mitigates, as far as
possible, its impact on climate change. The Housing Focus Group has engaged with MDDC9 to
understand the extent to which the 1,254 local authority-owned properties in the parish are
addressing sustainability issues. The findings are set out below:
Solar panels
Of the council dwellings in Tiverton parish, 476 (39%) have solar panels. (1,175 of the properties
in Mid Devon district). This is illustrated in Figure 4.1.
39%
62%
With solar panels Without solar panels
Figure 4.1: Local authority-owned properties with solar panels
The panels were installed in 2012 by Anesco. The tenants get free use of the electricity
generated (worth an average of approximately £180 pa to each tenant). The Council receives a
rent for the use of its roofs, amount and duration unknown (the Feed in Tariff payments, which
presumably are paid to Anesco, last for 25 years).
This rent is used (possibly ring-fenced?) for further energy efficiency improvements to Council
housing.
MDDC confirm that it is unlikely that further panels will be fitted, as the properties need to be
of a suitable roof area and orientation to the sun, and not to be overshadowed by trees.
Maintenance
Accommodation owned by social housing landlords must meet the Decent Homes Standard.
Landlords must continue to maintain homes to at least this standard. A decent home must:
9 Mark Baglow, Group Manager for Building Services
Tiverton Neighbourhood Plan Group
Page 31You can also read