New Plymouth District - Waste Management and Minimisation Plan - New ...
←
→
Page content transcription
If your browser does not render page correctly, please read the page content below
WASTE MANAGEMENT & MINIMISATION PLAN 2017

                                       New Plymouth District
                                        Waste Management and
                                             Minimisation Plan
Document Set ID: 7572092                                                            1
Version: 1, Version Date: 08/11/2017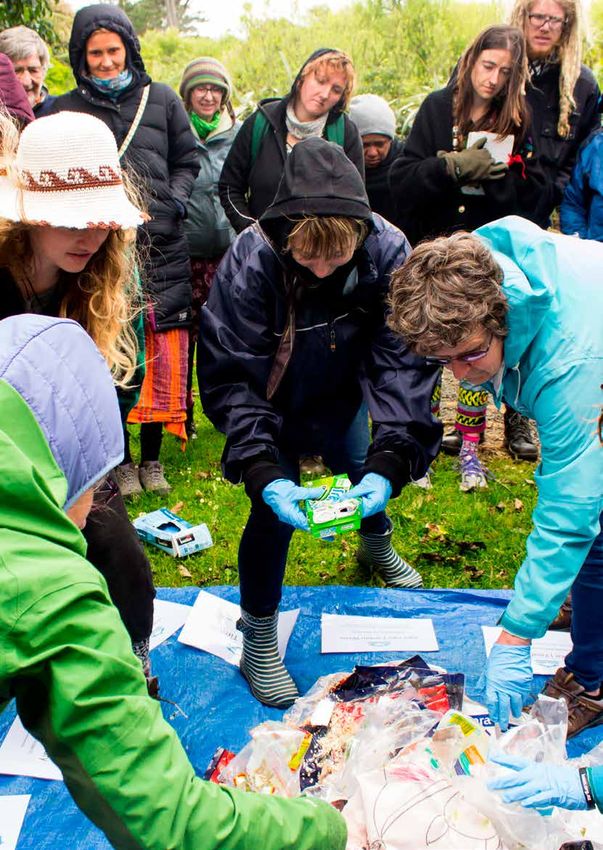
WASTE MANAGEMENT & MINIMISATION PLAN 2017

       Executive Summary

       The New Plymouth District Waste Management                 Using data about waste managed by the Council,
       and Minimisation Plan (2017-23) is the Council’s           and community consultation, these options have
       strategy to deliver an effective, efficient service for    been assessed in terms of their future social,
       the next six years. The Plan sets out the Council’s        economic, environmental and cultural impacts on
       vision, objectives and targets, and details how            the district and its residents.
       they will be accomplished and funded, in line
       with an overarching aim to achieve Zero Waste.             In 2016/17, the cost of NPDC’s solid waste services
       The introduction of a kerbside recycling collection        was $8.2 million, funded by fees, waste levies
       has contributed to a reduction in rubbish being            and rates. Efficiencies are expected to come from
       consigned to the landfill. However, there is potential     collaboration between the region’s councils. A new
       for further improvement, particularly in the areas of      regional landfill is scheduled to replace the Colson
       commercial and organic waste.                              Road facility in 2019, and will increase the cost of
                                                                  transporting waste from New Plymouth.
       The key goals for the next six years are to:
       •    Maximise opportunities to reduce levels of            The community has expressed a strong desire
            waste sent to the landfill.                           for the Council to drive a reduction in waste; to
                                                                  reduce the cost and potential harm of waste and to
       •    Reduce the harmful and costly effects of waste.       improve the efficiency of resource use. This Waste
       •    Improve efficiency of resource use.                   Management and Minimisation Plan sets out how
                                                                  local issues will be approached, in line with central
       To reach those goals, we will focus on:                    and local government regulations and community
                                                                  expectations. The Plan represents an important
       Achieving behaviour change.
                                                                  move towards New Plymouth District Council’s
       Developing collaboration and partnerships.                 aspirational goal of Zero Waste.
       Showing leadership and innovation.
       Providing accessible services and facilities.

       The Plan also:
       •    Outlines current waste management services
            and resources.
       •    Details the sources, expense, and content of
            waste in Taranaki.
       •    Reviews progress from the last six years.
       •    Identifies specific issues and potential solutions.

    2
Document   Set ID: 7572092
Version: 1, Version Date: 08/11/2017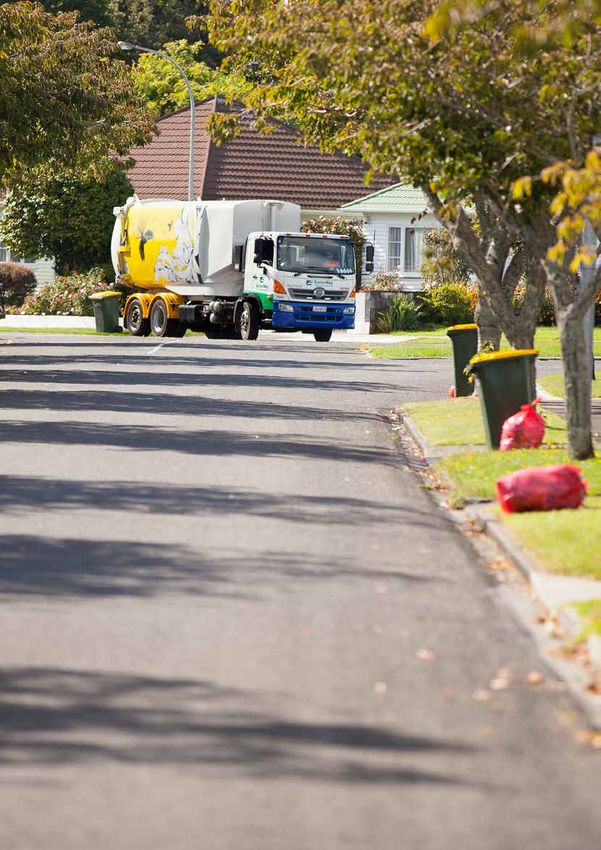
WASTE MANAGEMENT & MINIMISATION PLAN 2017

              Contents
               PART A. STRATEGY                                                                      5
               1.      INTRODUCTION                                                                   6
               1.1     Purpose                                                                        6
               1.2     Scope                                                                          6
               1.3     Commencement and review                                                        6
               1.4     What is waste?                                                                 7
               1.5     Statutory requirements                                                         8
               2.      THE WASTE SITUATION                                                            9
               2.1     Our waste                                                                      9
               2.2     Waste infrastructure and services                                             17
               2.3     What have we achieved in the last six years?                                  19
               2.4     Future waste projections                                                      20
               2.5     Key issues and gaps                                                           21
               3.      HOW THE COUNCIL PROPOSES TO ADDRESS THE ISSUES                                22
               3.1     What the community has told us                                                22
               3.2     Targets                                                                       24
               3.3     The Council’s intended role                                                   25
               4.      FUNDING                                                                       26
               4.1     Plan implementation                                                           26
               4.2     Proposed funding sources                                                      26
               4.3     Waste minimisation levies                                                     27
               4.4     Provisions for granting and advancing monies                                  27
               4.5     Provisions for waiving waste disposal charges                                 27
               5.      MONITORING AND REPORTING                                                      28
               5.1     Monitoring and reporting                                                      28
               5.2     Review of the plan                                                            28

               PART B. ACTION PLAN                                                                  29
               6.      SUMMARY OF ACTION PLAN                                                        31
               7.      ACTION PLAN                                                                   32
               8.      ZERO WASTE 2050 - OUR JOURNEY                                                 42

               PART C. APPENDICES                                                                   45
               APPENDIX 1: NPDC WASTE ASSESSMENT 2017                                                46
               APPENDIX 2: DEFINITION OF TERMS                                                       49
               APPENDIX 3: MONITORING PLAN                                                           50

Document Set ID: 7572092                                                                                       3
Version: 1, Version Date: 08/11/2017
Document Set ID: 7572092
Version: 1, Version Date: 08/11/2017
WASTE MANAGEMENT & MINIMISATION PLAN 2017

              Part A. Strategy
                              The Waste Management and Minimisation Plan is the guiding
                              document for achieving effective and efficient waste management
                              and minimisation within the New Plymouth District.

                              This section outlines our current waste situation, what we achieved
                              in the six years of the previous plan, future waste projections and
                              identifies the key issues that we should focus on in the future.

Document Set ID: 7572092                                                                                   5
Version: 1, Version Date: 08/11/2017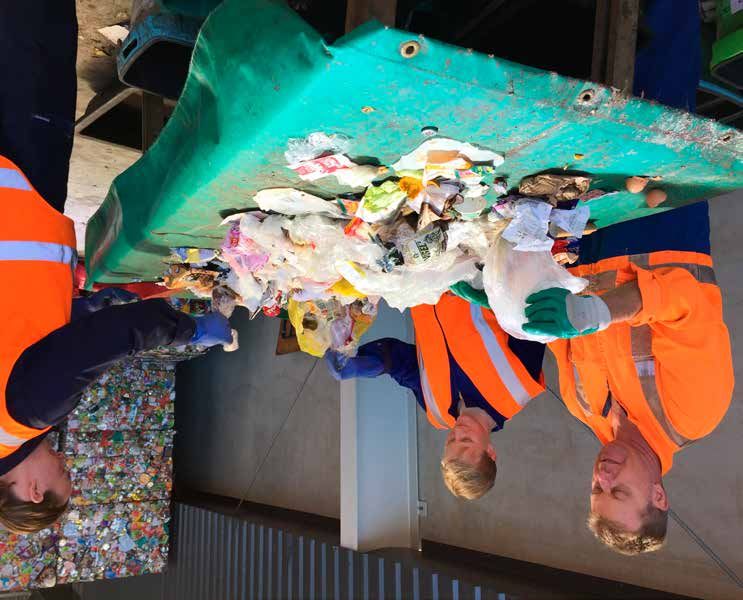
WASTE MANAGEMENT & MINIMISATION PLAN 2017

       1. Introduction
       1.1 Purpose
       New Plymouth District Council is required by the Waste Minimisation Act 2008 to produce a Waste
       Management and Minimisation Plan. This will be the guiding document for achieving effective and
       efficient waste management and minimisation within the New Plymouth District for the next six years
       (2017 to 2023). This Plan contains the Council’s vision, objectives, and targets for waste management and
       minimisation and details how the Council will deliver and fund these.

       In preparing the Plan we have considered the Waste Hierarchy (Figure 1) and the outcomes of the Waste
       Assessment (Appendix 1).

       1.2 Scope
       The Plan covers the whole New Plymouth District. It addresses all waste and diverted material, which
       includes items being reused, recycled or composted. It excludes liquid and gas wastes that are more
       effectively managed through other policies.

       The Council provides a large part of the district’s waste services and infrastructure - kerbside rubbish
       and recycling collection, transfer stations, landfill and some waste education. There is a web of private
       companies and community organisations involved in everything from behaviour change programmes
       to collection, diversion and alternative disposal using cleanfills and composting. However, there is a
       responsibility for Council to consider all waste in the district, and to identify and suggest areas where other
       groups can be involved.

       Taranaki’s territorial authorities: New Plymouth (NPDC), South Taranaki (STDC) and Stratford (SDC)
       district councils along with the Taranaki Regional Council (TRC), are committed to collaborating to achieve
       efficiencies and effectiveness in waste management. The NPDC Waste Assessment and Waste Management
       and Minimisation Plan have been developed together with the other councils, and consider regional waste
       data and options where applicable. This Plan is consistent with the Waste Management and Minimisation
       Strategy for Taranaki.

       1.3 Commencement and review
       This is the second Waste Management and Minimisation Plan for NPDC. It was publicly notified on 14 June
       2017 and the Council sought public comment on the Plan until 14 July 2017. The Plan was formally adopted
       on 14 November 2017 following consideration of submissions. The Plan will be reviewed six years from the
       date of approval, unless reviewed in the interim.

    6
Document   Set ID: 7572092
Version: 1, Version Date: 08/11/2017
WASTE MANAGEMENT & MINIMISATION PLAN 2017

       1.4 What is waste?
       The Waste Minimisation Act 2008 defines waste as “material that has no further use and is disposed of or
       discarded”. This Plan addresses predominantly solid waste, and includes waste that is diverted to other uses
       (e.g. to reuse, recycling or composting).

       Waste minimisation includes the avoidance and reduction of waste, and the reuse, recycling and recovery
       of waste. Minimising the amount of waste generated lowers the economic, social and environmental costs
       associated with the consumption of resources, which can deplete critical and non-renewable resources.
       Some waste represents a potential asset that may have economic value (e.g. through recycling) and can
       contribute to the sustainable management of our environment.

       1.4.1 Waste hierarchy
       The waste hierarchy (Figure 1) refers to the preferred order of waste minimisation and management
       methods. Avoiding waste is the preferred method for reducing waste and disposal is the least preferred.

                Most preferred behaviour
                                                                         REDUCE

                                                                          REUSE

                                                                         RECYCLE

                                                                        RECOVER

                                                                          TREAT

                                                                         DISPOSE
                 Least preferred behaviour
                 FIGURE 1: Waste hierarchy

Document Set ID: 7572092                                                                                              7
Version: 1, Version Date: 08/11/2017
WASTE MANAGEMENT & MINIMISATION PLAN 2017

       1.5 Statutory requirements
       Waste in New Zealand is legislated by a number of Acts (Figure 2). Of primary importance is the Waste
       Minimisation Act 2008 (WMA). This Act was developed with the purpose of encouraging waste minimisation
       and decreasing waste disposal in order to:
       •        protect the environment from harm; and
       •        provide environmental, social, economic and cultural benefits.

       Details on other legislation are provided in the Council’s Waste Assessment (Appendix 1).

                                                                NEW ZEALAND WASTE STRATEGY

                                                               Legislative Framework
                                                                       Hazardous Substances
             Waste Minimisation           Local Government Act                                          Climate Change            Resource Management
                                                                        and new Organisms                                                                      Other Tools
                  Act 2008                        2002                                                 Response Act 2002                Act 1991
                                                                             Act 1996

                                                                        Regulations and group
            Waste Minimisation &                                                                                                  National environmental       International
                                                  By-laws                standards related to             Disposal facility
             Management Plan                                                                                                            standards              Conventions
                                                                                water

                                                                                                                                   District and Regional     Ministry guideline
             Waste Disposal Levy             Long-term plans                                                                        plans and resource     codes of practice and
                                                                                                                                          consents          voluntary initiatives

             Waste Minimisation
                   Fund

             Product Stewardship

              Other regulations

       FIGURE 2: Toolkit for managing and minimising waste in New Zealand1

       1
           Source: Ministry for the Environment 2010. The New Zealand Waste Strategy. Ministry for the Environment. Wellington.

    8
Document   Set ID: 7572092
Version: 1, Version Date: 08/11/2017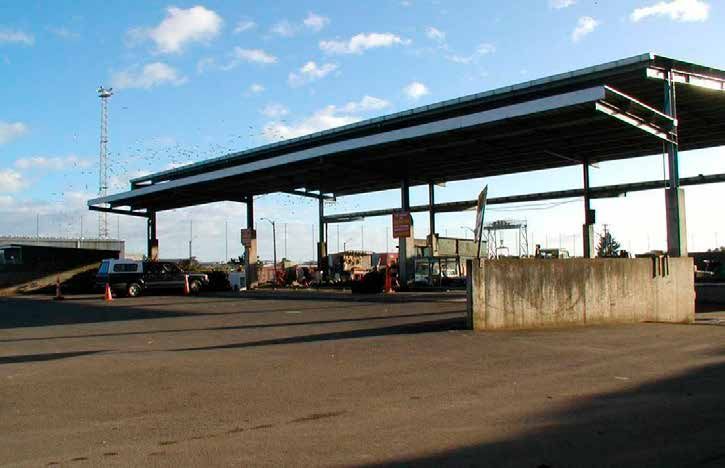
WASTE MANAGEMENT & MINIMISATION PLAN 2017

       2. The waste situation
       2.1 Our waste
       To understand the waste we generate, the Council collated data about the waste that it manages and
       conducted a number of surveys with the commercial sector. Those details are provided in the Waste
       Assessment (Appendix 1).

       The flow of waste in the Taranaki Region is complex involving services from both the Council and private
       sector. How the waste flows through the district and region is shown in Figure 3.

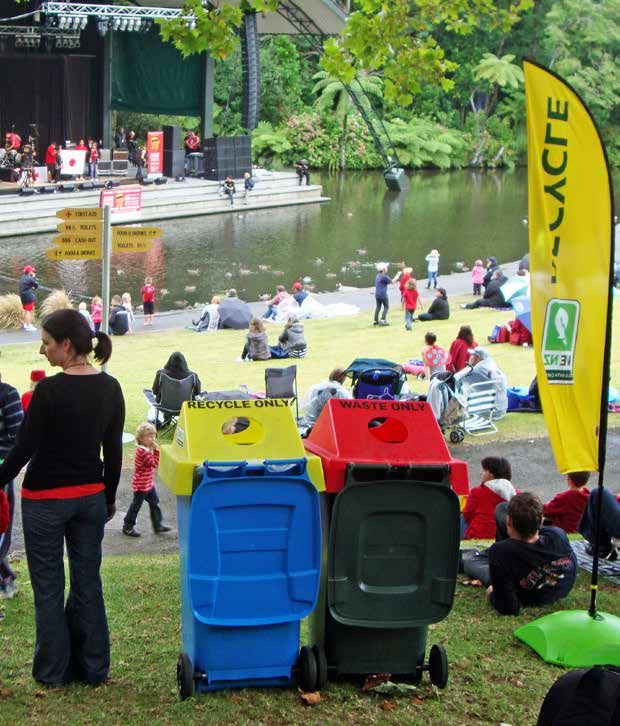
       PHOTO 1: Recycling at an event in the Bowl of Brooklands

Document Set ID: 7572092                                                                                          9
Version: 1, Version Date: 08/11/2017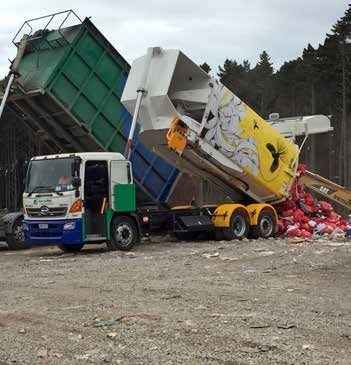
WASTE MANAGEMENT & MINIMISATION PLAN 2017

                          Commercial Collection                                   Residential Collection

        Commercial Recycling                Commercial Waste       Kerbside Recycling                 Kerbside Waste

                4,500t                         11,999t                  4,915t                         16,903t
                                                                          Includes both Council and Private collections

                               NP Transfer Station                             Rural Transfer Stations

                     Landfills
                  61,098t*

                                                       STDC                                     SDC
                                                     12,535t                                 2,484t

       FIGURE 3: Flow of waste in New Plymouth 2016
       * Includes Colson Road Landfill and disposal to landfill outside the Taranaki region.
    10 Set ID: 7572092
Document
Version: 1, Version Date: 08/11/2017
WASTE MANAGEMENT & MINIMISATION PLAN 2017
Special Waste Transfer Station Drop Off
Special Waste Green Waste Recycling Waste
6,065t 1,082t 918t 14,712t
Compost Windrow
3,453t
Materials Recovery Facility
13,080t
Compost
Recycling Market
14,091t
Sorted Recyclables
Document Set ID: 7572092 11
Version: 1, Version Date: 08/11/2017WASTE MANAGEMENT & MINIMISATION PLAN 2017
The key findings from the Waste Assessment are:
Landfill
• The region has a single functioning landfill, • Organic waste, timber, paper, plastic and rubble
where all waste from the Council-provided made up the greatest portion of waste that is
services is disposed. Access to the landfill is also disposed to landfill (Figure 5).
available to commercial waste service providers.
• Organic material was the largest component of
The landfill is expected to reach capacity in 2019
the overall waste to landfill in 2016, comprising
and will close at the end of June 2019. A new
23% of the total, by weight. Timber was the
regional landfill, near Eltham in South Taranaki,
second largest component, comprising 16% of
is scheduled to open in July 2019. This will
the total. Paper, plastic, and rubble comprised
increase the cost of transporting waste from
similar proportions, from 10% to 14% (Figure 5).
New Plymouth.
• The amount of organics to landfill has halved
• Annual waste tonnage to the landfill has
since the previous Waste Assessment (2011).
remained around 60,000 tonnes since 2007,
The amount of glass going to the landfill is
when waste was consolidated to a single landfill
around a third.
in the region. In the 2015-16 year this reduced
to 55,000 tonnes (Figure 4). • The landfill does not allow for some
contaminated or hazardous commercial wastes.
• The amount of waste generated per person and
Currently these are being transported out of the
disposed to landfill, has decreased from 0.63
region.
tonnes per capita per annum in 2009-10 to 0.56
tonnes per capita per annum.
NPDC SDC STDC
70,000
60,000
Waste (tonnes/year)
50,000
40,000
30,000
20,000
10,000
0
1996-97
1997-98
1998-99
1999-00
2000-01
2001-02
2002-03
2003-04
2004-05
2005-06
2006-07
2007-08
2008-09
2009-10
2010-11
2011-12
2012-13
2013-14
2014-15
2015-16
FIGURE 4: Waste disposed to Colson Road Landfill 1996 to 2016
12 Set ID: 7572092
Document
Version: 1, Version Date: 08/11/2017WASTE MANAGEMENT & MINIMISATION PLAN 2017
0.8%
2.7%
Ferrous Metals
Nonferrous Metals
2.9%
Rubber 22.7%
Organics
2.9%
Glass
16%
Timber
5%
Sanitary Paper
5.6% 14.3%
Potentially Hazardous Plastics
5.7% 10.6%
Textiles
11%
Rubble
Paper
FIGURE 5: Composition of waste disposed to landfill in 2016
Forty per cent of waste
being disposed of at the
landfill could have been
diverted to either recycling
or composting.
Document Set ID: 7572092 13
Version: 1, Version Date: 08/11/2017WASTE MANAGEMENT & MINIMISATION PLAN 2017
Kerbside collections
• Eighty-eight per cent of households in the
district receive a Council-provided kerbside
•
collection.
In 2015, a new recycling service was 14%
implemented, consisting of a wheelie bin for RECYCLABLES
mixed recyclables and a crate for glass.
• Since this new service has been in place,
kerbside waste has reduced from 12,000 tonnes
38%
per annum (2014-15) to 7,000 tonnes in the REFUSE
2015-16 year as a result of increased recycling.
• The average weight of a rubbish bag has
decreased from 8.10kg to 6.49kg. 43%
• Organic material is the largest single component FOOD WASTE
in kerbside rubbish bags comprising 52.4% of the
total (48% of which is compostable). Forty-three
per cent of the weight of the bags is food waste 5%
and 14% is recyclable, e.g. paper, card, plastics GREEN WASTE
1-7 (Figure 6).
FIGURE 6: Composition of an NPDC rubbish bag 2016
Transfer stations
• There are five transfer stations in the New Plymouth district – the New Plymouth Transfer Station is the
largest and caters for both residential and light commercial waste, with four smaller rural transfer stations
catering for domestic volumes.
• Timber was the largest component (31%) of transfer station waste that is sent to landfill. This is followed
by rubble, such as plaster board, soil and masonry which comprises 18%, and organic waste (15%).
PHOTO 2: New Plymouth Transfer Station
14 Set ID: 7572092
Document
Version: 1, Version Date: 08/11/2017WASTE MANAGEMENT & MINIMISATION PLAN 2017
Diversion from landfill
• NPDC, along with SDC and STDC, provide an • Diversion at transfer stations is generally low.
urban kerbside recycling collection. This service Twenty six percent of waste disposed to landfill
collects paper, card, aluminium and steel cans, via transfer stations, and nearly 30% of industrial
grade 1-7 hard plastics, and glass bottles and and commercial wastes could also be diverted to
jars. existing reuse and recycling services.
• The average composition of New Plymouth • Significant diversion of waste already occurs in
recycling bins (by weight) was 56% paper and the region. However, there is potential for an
19% was cardboard (Figure 7). Eight per cent of increase above current levels, particularly for
the weight was contamination (non-recyclable recycling and organic waste (Table 1).
items). Regionally, contamination is about 12%
of all recycling collected and processed at the
Material Recovery Facility.
• Diversion of waste
from landfill through
the kerbside recycling
collection has increased
from 13% to 45% since the
new recycling service was
implemented. However,
64% of waste in kerbside
bags (mostly food waste)
could still be diverted.
56%
R
PAPE
D
BOAR
CARD
19% -2
TIC 1
PLAS
9% CYC LABL
ES
N-RE
8%
NO
TIN
3% D P LAST
MIXE (3-7)
ICS
3% INIU
M
ALUM
2%
FIGURE 7: Kerbside recycle bin composition 2016
Document Set ID: 7572092 15
Version: 1, Version Date: 08/11/2017WASTE MANAGEMENT & MINIMISATION PLAN 2017
TABLE 1: Proportion of waste diverted in the region
Potentially divertable material going to landfill
Sent for Recycling or Recovery - COUNCIL
Sent for Recycling or Recovery - OTHER
Recycling*** Compostable organic Compostable organic
Greenwaste Foodwaste
Landfill* 31% Landfill* 18% Landfill* 51%
Council 19% Council 23% Council 0%
Other** 51% Other** 58% Other** 49%
Other organic Timber Concrete +
waste Bricks
Landfill* 3% Landfill* 3% Landfill* 5%
Council 1% Council 0% Council 0%
Other** 96% Other** 97% Other** 95%
* Data sourced from SWAP report 2016.
** Data sourced from organic wastes diversion study, industry surveys.
*** Includes mixed reyclables, glass, whiteware, steel, e-waste and farm plastics.
16 Set ID: 7572092
Document
Version: 1, Version Date: 08/11/2017WASTE MANAGEMENT & MINIMISATION PLAN 2017
2.2 Waste infrastructure and services
There are a number of waste service providers in Taranaki. The three district councils have a joint regional
contract for the collection of urban residential kerbside refuse and recycling and the operation of key
transfer stations. Private service providers offer waste services to the rural community, the commercial
sector, and those residential customers wanting a greenwaste collection or a larger bin option. A growing
number of community sector organisations are also involved in waste services (Table 2).
PHOTO 3: New Plymouth District Council services
Document Set ID: 7572092 17
Version: 1, Version Date: 08/11/2017WASTE MANAGEMENT & MINIMISATION PLAN 2017
TABLE 2: Summary of waste infrastructure and services in Taranaki
INFRASTRUCTURE/SERVICE COUNCIL PROVIDED OTHER PROVIDERS2
Reduce Education/behaviour The Council has a regional education strategy A wide range of organisations and businesses
change and provides waste related campaigns. The provide waste education and programmes in
Council distributes waste levy funds for this Taranaki.
purpose.
Reuse Second hand trading The Council is developing a Community Reuse Taranaki residents have access to many charity
and upcycling and Recycle Centre and has a reuse shop at the stores, markets, demolition and building trade
New Plymouth Transfer Station. stores, second hand traders, and online trading
sites.
Council/New Zealand Transport Authority There are options for reuse of items such as
contractors reuse roading wastes for bedding gas bottles (’swap a bottle’ and refilling) and
and sub-base material. retreading tyres.
Recycle Collection Council provides a fortnightly kerbside There are limited residential kerbside collections
collection of mixed recycling and glass for urban of recyclables but a small range of commercial
residents. There are recycling bins in some recycling options are available including
public places. cardboard, mixed recycling, farm plastics,
cooking oil, automotive wastes and tyres.
Refuse transfer Free drop off of household recyclables at all Industry have balers for commercial plastics,
stations NPDC transfer stations. User pays services at cardboard and farm plastics.
New Plymouth transfer station for whiteware,
e-waste and waste oil.
Resource recovery New Plymouth Resource Recovery Facility (RRF) The district has three scrap metal dealers and
facilities is under development. The Material Recovery providers for commercial skip processing.
Facility at the RRF currently sorts and bales
kerbside recycling.
Recover Organic waste No NPDC collections (STDC has an opt-in user The region has existing providers for kerbside
collection pays kerbside greenwaste collection). greenwaste collection. Piggeries and
coordinating organisations have informal and
formal arrangements with supermarkets and
hospitality sector for collection of food scraps.
Organic waste None in New Plymouth (STDC Patea site accepts There are numerous commercial providers of
processing greenwaste for dune stabilisation) organic waste processing.
Refuse transfer Greenwaste is accepted for a lower fee than
stations general waste at transfer stations.
Biosolids/drilling Wastewater biosolids from NP wastewater Drilling muds are applied to land (landfarming).
muds/sludges treatment plant is thermally dried and sold as a
fertiliser.
Trade waste (solid One private waste dewatering facility is available
portion) in NP district. Private collectors of trade waste
use the landfill for non-liquid wastes disposal.
Treat Hazardous waste Residential quantities of hazardous waste are Providers are available to collect and transport
accepted at the three main transfer stations commercial hazardous wastes outside of the
in the region. The region’s councils support a region for treatment / disposal.
regular agricultural chemical collection.
Dispose Clean fills The Landfill accepts cleanfill as cover. Okato and There are 23 consented cleanfills in Taranaki.
Inglewood transfer stations accept and dispose Some of these are only available for owner use.
of cleanfill onsite.
Collection NPDC provides a weekly kerbside waste There are a number of commercial waste
collection of rubbish bags from urban collectors in the region. Many organisations
residential customers. The Council has public are involved in clean-ups of litter in beach, river
place litter bins and a regular clean-up of illegal and urban environments including schools and
dumping. conservationists.
Transfer Stations Waste disposal is available at all transfer stations
(user pays).
Landfills The region has one landfill (Colson Road,
New Plymouth); A new regional landfill, is
scheduled to open in South Taranaki in 2019.
2
Refer to Recycling Directory (www.wecan.org.nz) for diversion options for vehicle batteries, waste oil, used paint, solvents, waste cooking oil, gas bottles, construction and demolition
wastes etc.
18 Set ID: 7572092
Document
Version: 1, Version Date: 08/11/2017WASTE MANAGEMENT & MINIMISATION PLAN 2017
2.3 What have we achieved in the last six years?
Since the previous plan was adopted, the new NPDC has achieved most of the targets set in the
kerbside recycling collection has been implemented previous plan including:
along with the construction of the Material Recovery • a reduction of per capita waste to landfill,
Facility which processes the recycling from the three
district councils kerbside collections. Planning is • increased kerbside recycling (Figure 8), and
progressing steadily towards further development of • improved customer satisfaction.
the Resource Recovery Facility (which incorporates
the MRF) and the new regional landfill. The Council has not achieved 100% compliance with
the landfill resource consents nor extended landfill
Targets for construction and demolition waste have life by the target timeframe of seven years (extended
not been achieved with an increase in construction by three years).
and demolition waste being taken to landfill
compared to 2010 levels. The Council’s focus in Considerable infrastructure has been implemented
the commercial waste sector has involved mainly at the Landfill to address consent requirements.
education, with infrastructure and services for
commercial waste not being a core Council function.
NPDC has continued to deliver waste education,
specifically aimed at improving recycling, decreasing
contamination3 in recycling bins and reducing food
waste to landfill.
New recycling service
35
Waste or recycling ((kg/household/year
30
25
20
15
10
5
0
Jun 15 Jul 15 Aug 15 Sep 15 Oct 15 Nov 15 Dec 15 Jan 16 Feb 16 Mar 16 Apr 16 May 16 Jun 16
Waste to landfill Recycling
FIGURE 8: Kerbside waste and recycling rates (per household) 2015-2016
3
Unauthorised or non-recyclable items.
Document Set ID: 7572092 19
Version: 1, Version Date: 08/11/2017WASTE MANAGEMENT & MINIMISATION PLAN 2017
2.4 Future waste projections
The amount of waste generated and disposed of, or • The potential revenue from sale of recyclable
diverted, is driven by a number of factors. Key drivers items.
include: • National policy and priorities including product
• Population growth and the economy. stewardship, the New Zealand Emissions Trading
• The cost of waste disposal or diversion. Scheme and resource management.
• Availability and capacity of local infrastructure to With the current services, infrastructure and policy
divert or dispose of waste. provided in Taranaki, waste disposal to landfill is
• Technology changes which may result in more predicted to increase by between 1 to 3% per year
cost effective ways to recycle, recover or dispose (Figure 9).
of waste.
80,000
70,000
60,000
Waste disposal (tonnes/year)
50,000
40,000
30,000
20,000
10,000
0
2011
2012
2013
2014
2015
2016
2017
2018
2019
2020
2021
2022
2023
2024
2025
2026
2027
2028
2029
2030
2031
2032
2033
2034
2035
2036
2037
2038
2039
2040
2041
Residential waste - Private
Residential waste - Council
Commercial and industrial waste
FIGURE 9: Projected waste generation by waste source
20 Set ID: 7572092
Document
Version: 1, Version Date: 08/11/2017WASTE MANAGEMENT & MINIMISATION PLAN 2017
2.5 Key issues and gaps
The Waste Assessment has identified the following Organic waste
gaps in waste minimisation and management in the
district. • Uptake of greenwaste services by residential
households is low and these services are
provided solely by the private sector.
Commercial services
• The Council does not have direct control over
commercial and industrial waste and the Food waste is the largest
ability to facilitate change is primarily through
education. portion of household waste
• Diversion options for commercial and industrial going to landfill and is
waste streams are limited within the region. potentially divertable
• Some waste streams (specifically contaminated through changing household
and hazardous wastes) are not catered for within
Taranaki and must be transported out of the practices4, a food waste
region. collection service and/or
• Due to the smaller size of many of our
commercial and industrial premises, diversion
home composting initiatives.
options are not viable. There is potential for
aggregation of divertable wastes from industry
to make local diversion options more cost Other
effective.
• Better understanding and implementation
• Farm waste management within the region of behaviour-change strategies (including
is not well researched. Greater research in education) is needed to reduce waste, illegal
this area would assist in identifying diversion dumping and recycling contamination, and
opportunities and appropriate services for the increase diversion. Long term, this could provide
rural community. widespread change in relation to waste.
• Residents would like bins for waste and
greenwaste as part of the Council kerbside
Commercial and industrial collection, and also an extension of the kerbside
waste comprises the largest service into semi-rural areas and the CBD.
portion of waste disposed to • Better understanding of the long-term
implications of volatile commodity prices of
landfill. recyclables and different waste streams entering
the system that need to be managed at the end
of their life.
• Data availability, quality and management,
particularly for non-council-provided services is
poor.
• Inconsistent implementation and enforcement
of solid waste bylaw provisions leading to poor
data on waste flows and management of illegal
dumping.
4
NPDC is involved in delivering the national Love Food Hate Waste campaign which aims to reduce food waste.
Document Set ID: 7572092 21
Version: 1, Version Date: 08/11/2017WASTE MANAGEMENT & MINIMISATION PLAN 2017
3. How the Council proposes to address
the issues
3.1 What the community has told us
The community has expressed a strong desire for the Council to drive a reduction in waste; to reduce the
cost and potential harm of waste and to improve the efficiency of resource use (Figure 10). There has been a
high level of support for an aspirational vision of Zero Waste.
The residential community would like a green waste collection service and waste bins instead of bags.
The commercial sector indicated a desire for improved collaboration and local solutions to divert waste.
Education was important across the whole community.
As per our District Blueprint, the Council’s long-term focus is People, Place, Prosperity. Our place is a
beautiful natural landscape and we want to protect it for future generations. We value biodiversity and have
a strong focus on sustainability. Our people love to be active and enjoy an outdoors lifestyle.
Based on the above, the strategic direction on the next page is proposed for the duration of this plan.
Community Reuse
Organic Waste Reduce Energy
Options Composting
Minimise Avoid Illegal Dumping Ewaste
Recycling
Efficient Food Waste
Business
Plastic
Industry
Separation
Free Packaging Glass
Incentives
Waste Bins Green Waste
Collection Ban Red Bags
Plastic Bags
Environment Manufacturers
Responsibility
Education
Biodegradable
Zero Waste
FIGURE 10: Community feedback on 10 year focus for waste
22 Set ID: 7572092
Document
Version: 1, Version Date: 08/11/2017WASTE MANAGEMENT & MINIMISATION PLAN 2017
Strategic Direction
ZERO Vision
Waste
Goals
MAXIMISE OPPORTUNITIES
to reduce waste to landfills
REDUCE the harmful and costly
effects of waste
IMPROVE EFFICIENCY
of resource use
Behaviour change
Collaboration and partnerships
Objectives
Leadership and innovation
Accessible services and facilities
Document Set ID: 7572092 23
Version: 1, Version Date: 08/11/2017WASTE MANAGEMENT & MINIMISATION PLAN 2017
3.2 Targets
The following targets address the goals of this Plan. These targets are based on the expected performance
of implementing the Action Plan provided in Part B.
TARGETS 2015/16 BASELINE DATA REF #
Waste to landfill
Reduce the total waste volume per capita going to the regional 0.56 tonnes/capita/annum (NPDC) L1
landfill by 10% by 2023.
Reduce the total waste volume per household going to landfill 0.26 tonnes/household/year L2
from the Council kerbside collection by 25% by 2023. (7,132 tonnes; 27,536 households)
Any increase in waste volumes to landfill to remain below any Total waste to landfill: 54,801 tonnes L3
increase in regional economic performance. Taranaki $75,941 GDP per capita5
National $52,953 GDP per capita6
Diversion of waste
Increase the amount of household waste diverted to recycling by Waste: 7,131 D1
1% per year (Council provided kerbside collection only). Recycling: 4,918
Proportion: 41%
Reduce contamination of Council provided kerbside recycling 8% (NPDC) D2
delivered to the Material Recovery Facility to 8% or below. 12% (Region)
Organic waste
Reduce the amount of organic waste to landfill by 30% by 2023. 9,984 tonnes/annum O1
Reduce the amount of organic waste in the Council provided 4,510 tonnes/annum O2
kerbside rubbish collection by 50% by 2023. (3.4 kg per household per week)
Customer satisfaction
Percentage of community satisfied with the solid waste service 82% (excluding ‘don’t knows’) S1
exceeds 81% (NRB Survey).
Total number of complaints received about the Council’s solid 0.84 complaints per 1,000 households S2
waste service remains at or below three per 1,000 households. (26 complaints; 31,000 households)
Public health
No public health advisory notices from Taranaki District Medical Zero H1
Officer of Health in relation to the Council’s responsibilities for
solid waste under the Health Act 1956.
95% of the population has access to a waste disposal service – 98% H2
either via a kerbside collection or live within 20 minutes’ drive of a
transfer station.
Environmental, health and safety compliance
No abatement notices received for the landfill. 1 C1
No infringement notices received for the landfill. 1 C2
No enforcement notices received for the landfill. 0 C3
No convictions received for the landfill. 0 C4
No convictions under the Health and Safety at Work Act 2015. 0 C5
Community engagement
Number of education tours to the Resource Recovery Facility will 56 tours in 2016 E1
exceed 52 per year.
Waste community engagement survey completed every two years. N/A E2
5
Stats NZ Regional Gross Domestic Product Year ended March 2015 - tables.
6
Stats NZ Regional Gross Domestic Product Year ended March 2015 - tables.
24 Set ID: 7572092
Document
Version: 1, Version Date: 08/11/2017WASTE MANAGEMENT & MINIMISATION PLAN 2017
3.3 The Council’s intended role
The Council’s statutory obligations in respect of the • Investing in waste facilities.
planning and provision of waste services are detailed • Distributing waste levy funds in support of waste
in Section 1. The Council needs to ensure that the management and minimisation goals.
statutory obligations are met in the delivery of the
Waste Management and Minimisation Plan. • Educating the community in waste minimisation.
• Monitoring and measuring waste flows and
The Council currently provides a significant information in order to inform planning and
proportion of the waste services in the district decision making. It is intended that Council will
via a regional contract for kerbside and transfer enforce bylaws to improve data to this effect.
station services, and another contract for landfill
• Researching and considering implementation of
management. Providing these services in-house
new activities to divert waste from landfill.
ensures that the Council provides for public health
and gives effect to the Waste Minimisation Act.
It is intended that the Council will continue to build
The Council also provides and/or funds waste
on these activities as outlined in the action plan
minimisation activities, including:
provided in Part B of this Plan.
• Working with others, including community
groups, iwi, the private sector and the other
councils in the region, to achieve waste
management and minimisation goals.
PHOTO 4: Kerbside waste bag audit being undertaken in 2016
Document Set ID: 7572092 25
Version: 1, Version Date: 08/11/2017WASTE MANAGEMENT & MINIMISATION PLAN 2017
4. Funding
4.1 Plan implementation
The current cost of solid waste services provided by the Council is $8.2m (2016/2017) which is recovered by
user fees, waste levy and rates. To implement the action plan provided in Part B some options will need to be
considered as part of the Long-Term Plan process.
For those options proposed in the first year of the Long-Term Plan (2018/2019), the total operational cost to
the Council to implement the Waste Management and Minimisation Plan is estimated to be $9.3 million. The
total weekly increase in the household cost of waste services is estimated to be 55 cents. This is a one per
cent increase on the average household rate.
4.2 Proposed funding sources
To fund the recommended actions in this Plan, the Council must consider alignment with the intent of the
Waste Minimisation Act to minimise waste to landfill and consider the impact on the community through the
Long-Term Plan.
The implementation of this Plan will be funded through a range of mechanisms including:
• General rates.7
• Uniform annual charges.7
• User fees.
• Waste levy.8
• Waste Minimisation Fund.9
• Other, including community and industry funding, contestable funding, sponsorship and other
government sources (not part of the waste minimisation fund).
7
The term ‘rates’ refers to both the general rate (i.e. the property levy) and targeted rates (i.e. uniform annual charges). Uniform annual charges are yearly fixed charges for sewage
disposal, water supply and refuse collection. Only properties that receive these services pay the charges. Also known as service charges.
8
A national waste levy is funded via the establishment of a $10 per tonne levy on all waste disposed of to landfill. Half of the money raised is distributed quarterly to territorial authorities
on a population basis for waste minimisation initiatives in their district. The remaining half is in a contestable fund.
9
This is a contestable fund administered by the Ministry for the Environment. Councils and others can apply for additional funds for waste minimisation activities on a case-by-case basis
in accordance with nationally set criteria and priorities. This funding is sourced from half of the waste levy paid through landfill disposal.
26 Set ID: 7572092
Document
Version: 1, Version Date: 08/11/2017WASTE MANAGEMENT & MINIMISATION PLAN 2017
4.3 Waste minimisation levies
All waste levy funding received by the Council is spent on waste minimisation
activities, including providing grants, supporting contract costs or as
infrastructure capital. The Council has flexibility in the timing and manner in
which waste levy funds are utilised. Funds can be pooled with other councils,
or pooled for several years to use for infrastructure development, as long as
this use is provided for and explained in the Plan.
4.4 Provisions for granting and
advancing monies
The Council may make grants or financial advances to any person, organisation,
group, or body of people for the purpose of promoting or achieving waste
management and minimisation (section 47 of the Act). In deciding whether to
fund such proposals, the Council will consider the following criteria:
• The benefits of a proposal in relation to present and future needs of the
district.
• The extent to which the benefits of the proposal are public or private.
• The extent to which a proposal contributes to goals and objectives set out
in this Plan.
• The cost of the proposal, including funding sources.
• The effects of the proposal on waste minimisation of any existing waste
minimisation services, facilities or activities, either provided by the Council
or by others.
A grant or financial advance may be made subject to any terms or conditions
that the Council thinks fit, including that an advance of money is free of
interest.
4.5 Provisions for waiving waste
disposal charges
The Council may waive waste disposal (landfill, collection) charges, in full or
in part, in certain circumstances. In deciding whether to waive charges, the
Council must be satisfied that:
• Waiving charges will not significantly prejudice the attainment of the
Plan’s objectives.
• The charges are clearly unreasonable or inappropriate in the particular
case.
• The benefits of waiving charges in relation to providing for community
events or needs in the district outweigh the costs.
• There is no potential for adverse effects on the environment or public
health.
Any waiving of waste disposal charges may be made subject to any terms or
conditions that the Council thinks fit.
Document Set ID: 7572092 27
Version: 1, Version Date: 08/11/2017WASTE MANAGEMENT & MINIMISATION PLAN 2017
5. Monitoring and reporting
5.1 Monitoring and reporting
The Council will monitor and report on the implementation of the Plan. The monitoring will address the
targets of this Plan and the effectiveness of the action plan. The monitoring will include:
• The quantity and composition of waste and diverted resources;
• The origin of waste;
• Litter and illegal dumping;
• The effectiveness of actions in the Plan;
• Compliance of with legislative requirements; and
• Progress towards the targets set in this Plan.
A detailed monitoring plan is provided in Appendix 3.
5.2 Review of the plan
A full review of the Plan will be conducted by the Council at intervals of not more than six years after
adopting the Plan or the last review. Any review of the Plan will be preceded by a Waste Assessment under
section 51 of the Act.
28 Set ID: 7572092
Document
Version: 1, Version Date: 08/11/2017WASTE MANAGEMENT & MINIMISATION PLAN 2017
Part B. Action Plan
This action plan outlines a six-year programme to work towards the
vision and targets presented in Part A of this Waste Management and
Minimisation Plan. Any significant changes to current levels of service
will be incorporated into the Council’s Long-Term Plan process and
are subject to public consultation. The action plan has been designed
to meet the requirements of the Waste Minimisation Act 2008 and
the Local Government Act 2002, by including all practicable options
to achieve the Council’s waste minimisation objectives. These
options have been assessed in terms of their future social, economic,
environmental and cultural impacts on the district and its residents.
For each objective, the action plan presents:
• Specific actions to achieve the objective, including whether it is a
new or existing action;
• An indicative timeframe for implementation of that action;
• Funding source, such as whether actions will be funded through
general rates, user fees and waste levies (for further information
on funding sources refer to Section 4 of Part A);
• Position on the waste hierarchy.
These actions are derived from priority options identified in the
Waste Assessment (Appendix 1) and community consultation which
have been developed to address the vision of the Plan and key issues
and gaps.
Document Set ID: 7572092 29
Version: 1, Version Date: 08/11/2017WASTE MANAGEMENT & MINIMISATION PLAN 2017
30 Set ID: 7572092
Document
Version: 1, Version Date: 08/11/2017WASTE MANAGEMENT & MINIMISATION PLAN 2017
6. Summary of Action Plan
FINAL CONCEPT
&$123WASTE MANAGEMENT & MINIMISATION PLAN 2017
7. Action Plan
BEHAVIOUR CHANGE
NEW OR EXISTING
ISSUE ADDRESSED SPECIFIC ACTION
ACTION
Achieve reduction of priority Implement a targeted education programme which will result New
waste streams entering in behavior change10.
landfill.
Deliver home composting workshops and incentives. New
Undertake, participate and fund regional and national Existing
research and programmes based on sustainable behaviour
change practices.
Promote organisations and facilities that contribute to the Existing
goals of this plan, e.g. through case studies and social media.
10
This option will focus on all sectors and align with events, infrastructure and policy changes to maximise effectiveness. It includes incentives and rewards for waste reduction.
32 Set ID: 7572092
Document
Version: 1, Version Date: 08/11/2017WASTE MANAGEMENT & MINIMISATION PLAN 2017
IMPLEMENTATION TARGET
FUNDING SOURCE HIERARCHY POSITION
TIMEFRAME ADDRESSED
2018 Rates, waste levy, user fees, contestable Reduce, Reuse, All
Ongoing funds Recycle, Recover
Pilot trial 2017 Rates, waste levy, user fees, contestable Reduce, Recover O1, O2
Ongoing funds, sponsorship
As applicable Rates, waste levy, other as applicable All All
Ongoing Rates, waste levy Reuse L1, L2, L3
Document Set ID: 7572092 33
Version: 1, Version Date: 08/11/2017WASTE MANAGEMENT & MINIMISATION PLAN 2017
COLLABORATION AND PARTNERSHIPS
NEW OR EXISTING
ISSUE ADDRESSED SPECIFIC ACTION
ACTION
Provide consistency Collaborate with Taranaki councils to provide a Regional Existing
and efficiencies for our Waste Minimisation Officer to implement the Regional Waste
customers through regional Strategy, Waste Education Strategy and this Plan.
collaboration.
Develop regionally consistent services, contracts, education Existing
and messages, and support schemes that will benefit the
region.
Provide model contract clauses around waste management New
and minimisation and infrastructure to support business in
procurement.
Bring forward the Waste Plan cycle for STDC and SDC to be New
adopted in 2023 to align with NPDC and allow a Regional
Waste Plan.
Review and regionally align solid waste bylaws that will New
consider contamination, illegal dumping, accessibility, organic
waste and central landfill.
Support and promote Provide a regional contestable fund using waste levy funding. New
organisations and businesses
contributing to the goals of
Support organisations and businesses to minimise waste, Existing
this Plan.
e.g. through awards, networking events, workshops, media,
events.
Reduce waste generated in Collaborate with others to develop innovative solutions New
Taranaki. to waste challenges11.
11
Includes schools, tertiary education providers, community organisations and business. Scope will include solutions for reducing packaging in supermarkets and manufacturing.
34 Set ID: 7572092
Document
Version: 1, Version Date: 08/11/2017WASTE MANAGEMENT & MINIMISATION PLAN 2017
IMPLEMENTATION TARGET
FUNDING SOURCE HIERARCHY POSITION
TIMEFRAME ADDRESSED
Ongoing Rates, waste levy Reduce, Reuse, L1, L2, L3, D1, D2,
Recycle, Recover O1, O2
Ongoing Rates, waste levy, user fees All S1, L1, L3, D2
2021 Rates, waste levy, user fees Recycle, Recover, D2, C5
Treat, Dispose
Pre-planning for Rates, waste levy, user fees All
Waste Plan 2021
2019 Rates, user fees Recycle, Recover, L1, L2, D2, O1, C1,
Dispose C2, C3, C4, C5
Implement in 2018 Waste levy Reduce, Reuse, All
Ongoing Recycle, Recover
Oingoing Rates, waste levy, user fees, All L1, L3
contestable funds, sponsorship
Ongoing Rates, waste levy, user fees, All L1, L3
contestable funds, sponsorship
Document Set ID: 7572092 35
Version: 1, Version Date: 08/11/2017WASTE MANAGEMENT & MINIMISATION PLAN 2017
LEADERSHIP AND INNOVATION
NEW OR EXISTING
SPECIFIC ACTION
ACTION
Reduce potential Support clean up week and community litter collections by Existing
environmental and personal promoting and providing free access to transfer stations for
harm, and improve aesthetics waste disposal.
of community by reducing
Continue to provide a web form and phone line for the public Existing
illegal dumping and littering.
to report illegal dumping.
Develop a comprehensive strategy to reduce illegal dumping New
and littering.
Monitor success of waste minimisation programmes through Existing
waste disposal records, Solid Waste Analysis Protocol surveys
and customer surveys.
Investigate and implement improved recycling in public places New
and at events.
“Walk the talk”. Develop an in-house waste strategy, identifying all waste New
streams and plan for reducing or diverting these.
Reduce environmental harm Implement bylaws, licensing and pricing to reduce greenwaste New
and cost by diverting organic disposed to landfill and encourage waste diversion.
waste from landfill.
Aggregate commercial and Investigate options for aggregating commercial and industrial New
industrial wastes to access waste to maximise diversion.
diversion markets. Establish a Commercial and Industrial Materials Recovery New
Facility that will divert C&D and other commercial wastes.
Facilitate local diversion Employ a commercial Waste Minimisation Officer. New
and disposal options for the
commercial and industrial
Establish and administer an interactive information portal for New
sector.
commercial and industrial sector.
Design the new Colson Road refuse transfer station to New
maximise recovery of reusable and recyclable goods from
rubbish pit.
Consider initiatives that support the reuse or recycling of Existing
other waste streams and work with waste service providers to
offer options for diversion.
36 Set ID: 7572092
Document
Version: 1, Version Date: 08/11/2017WASTE MANAGEMENT & MINIMISATION PLAN 2017
IMPLEMENTATION TARGET
FUNDING SOURCE HIERARCHY POSITION
TIMEFRAME ADDRESSED
Annually and as Rates (or provision for waiving of fees), Dispose S1
required user fees
Ongoing Rates, other government/contestable fund Dispose S1
2018 Strategy development: rates, user fees All S1
Implementation: rates, waste levy, user
fees, contestable funds, sponsorship
Ongoing Rates, waste levy, All All
user fees
2021 Rates, waste levy, user fees, Recycle, Recover L1, L3
contestable funds, sponsorship
2018 Rates, waste levy Reduce, Reuse, L1
Recycle, Recover
2019 Rates, waste levy, user fees Recycle, Recover L1, O1
2019 Rates, user fees, sponsorship, other Reuse, Recycle, L1, L3
Recover, Treat
2021 (subject to User fees, contestable funds, other Recycle, Recover L1, L3
investigation above)
2018 Rates, sponsorship, All L1, L3
user fees
Priority 2 Rates, sponsorship, user fees Reduce, Reuse, O1, L1, L3
Dependent on time Recycle, Recover,
and resources
2018 Rates, user fees Reuse, Recycle, L1, L3
Recover
Ongoing Rates, waste levy, user fees, Reuse,Recycle L1, L2, D1, D2, O1
contestable funds, sponsorship
Document Set ID: 7572092 37
Version: 1, Version Date: 08/11/2017WASTE MANAGEMENT & MINIMISATION PLAN 2017
LEADERSHIP AND INNOVATION continued
NEW OR EXISTING
ISSUE ADDRESSED SPECIFIC ACTION
ACTION
Develop and implement Align data collection to the National Waste Data Framework New
effective and efficient policy to enable regional and national benchmarking and reporting.
and practices based on quality
Monitor success of waste minimisation programmes through Existing
data to support our goals.
waste disposal records, data collection and surveys.
Understand the economic liability and social drivers of waste New
separation in the future including consideration of alternative
technologies.
Engage with the rural community to identify waste New
behaviours, gaps in service and customer satisfaction.
Develop and implement a strategy to advocate to Central New
Government where local policy and bylaws will be ineffective.
38 Set ID: 7572092
Document
Version: 1, Version Date: 08/11/2017WASTE MANAGEMENT & MINIMISATION PLAN 2017
IMPLEMENTATION TARGET
FUNDING SOURCE HIERARCHY POSITION
TIMEFRAME ADDRESSED
2018 Rates, user fees All
Ongoing Rates, waste levy, user fees All All
2021 Rates, user fees Recycle, Recover, L1, L3
Treat, Dispose
Priority 2 Rates, waste levy, user fees, All S1, H1, C5
Dependent on time contestable funds
and resources
2018 Rates, other All L1, L2, L3, D1
Document Set ID: 7572092 39
Version: 1, Version Date: 08/11/2017WASTE MANAGEMENT & MINIMISATION PLAN 2017
ACCESSIBLE SERVICES AND FACILITIES
NEW OR EXISTING
ISSUE ADDRESSED SPECIFIC ACTION
ACTION
Provide safe disposal of Provide resource recovery facility and transfer station Existing
waste. services including e-waste and hazardous waste drop-off.
Provide a subsidy for e-waste recycling. Existing
Establish and operate a regional Class 1 landfill based on Existing
best practice.
Provide a kerbside waste and recycling collection service Existing
to all households within the serviced area.
Reduce environmental Provide a weekly food waste collection service to all New
harm and make reducing households within the serviced area
organic waste easy to
residents.
Respond to customer Extend the kerbside collection area to include: New
demand. A. Rural areas where feasible.
B. Recycling for early childhood centres.
C. Commercial premises (including CBD and community
organisations).
Replace kerbside refuse bags with 120L bins collected New
fortnightly.
Offer flexibility in waste bin sizes to cater for different New
household needs (80L and 120L).
Subsidise the kerbside back door collection service by 50 New
per cent.
Reduce environmental Publicise disposal or alternative recycling options for Existing
harm from special wastes. all categories of special wastes, including promotion of
organisations in the region that take back or responsibly
dispose of wastes generated or supplied by them.
Enhance recycling diversion Review accessibility of rural transfer station locations. New
rates for those who do not
receive Council provided
kerbside collection service. Review infrastructure and customer experience provided New
at rural transfer stations to improve recycling and
diversion of recyclable waste.
Increase the reuse of Develop a Community Reuse and Recycle Centre within New
resources. the Resource Recovery Facility at Colson Road.
Facilitate local diversion Provide commercial access to the Material Recovery New
and disposal options for the Facility.
commercial and industrial
sector.
40 Set ID: 7572092
Document
Version: 1, Version Date: 08/11/2017WASTE MANAGEMENT & MINIMISATION PLAN 2017
IMPLEMENTATION TARGET
FUNDING SOURCE HIERARCHY POSITION
TIMEFRAME ADDRESSED
Ongoing Rates, user fees, waste levy Recycle, Treat, L1
Dispose
Ongoing Waste levy, user fees Reuse, Recycle L1, D1
Ongoing (new landfill User fees, other Dispose C1, C2, C3, C4
2019)
Ongoing Rates, waste levy Recycle, Dispose H1, H2
2019 Rates Recover O1, O2
Rates Recycle, Dispose H1, H2, S1
A. 2018
B. 2018
C. At contract
renewal (2023-
25)
2019 Rates Dispose S1, S2, C5
2019 Rates Recycle, Recover, S1, S2
Dispose
2018 Rates Recycle, Dispose S1, S2
Ongoing Rates, waste levy Recycle, Treat, L1, D1
Dispose
Priority 2 Rates, user fees Reuse, Recycle, L1, L3, O1, S1, S2,
Dependent on time Recover, Dispose H2
and resources
Priority 2 Rates, waste levy, user fees Reuse, Recycle L1, S1
Dependent on time
and resources
2017 Rates, waste levy, user fees, Reduce, Reuse, L1, L3, D1
contestable funds, sponsorship, other Recycle
2017 User fees Recycle L1, L3
Document Set ID: 7572092 41
Version: 1, Version Date: 08/11/2017Zero Waste 2050 - our journey
an
ASPIRATION
to work where waste
towards becomes a
RESOURCE
DESIGNED
a into products
Zero waste is CIRCULAR & processes
lifecycle
Where are we now?
Total Waste to Landfill 2016 What is happening at the kerbside?
60,000 tonnes.
Where does this waste
come from?
2.9%
Landscaping
4.5%
Special Waste
8.2%
Residential
28.6%
Kerbside
collections
(council & private)
58.5% Waste Recycling
Industrial / Commercial
17,000
Tonnes per year
5,000
Tonnes per year
What types of waste
are landfilled? Composition of an NPDC rubbish bag 2016
14%
2.9% Glass
2.9% Rubber
3.5% Metals Recyclables
38%
Refuse
5% Sanitary Paper
5.6% Potentially Hazardous
5.7% Textiles
10.6% Paper
11% Rubble
5%
Green waste
14.3% Plastics
16% Timber
22.7% Organics
43%
Food Waste
Document Set ID: 7572092
Version: 1, Version Date: 08/11/2017How we will get there
Our goals 2017 - 2023
REDUCE Behaviour Change
the harmful Targeted education
and costly Community reuse and
MAXIMISE effects of IMPROVE recycle centre
opportunities waste efficiency of
to reduce resource use
waste Collaboration and
Partnerships
Regionally and nationally
Support local initiatives
78%
of organic Leadership and
waste going Innovation
to landfill is
divertible Illegal dumping strategy
Commercial waste aggregation
32%
of commercial Accessible services
waste going and facilities
to landfill is Kerbside services (food waste)
divertible
Resource Recovery Facility
Future Plans
Behaviour change
Resource recovery networks
(transfer station improvements) 2050 0
Alternative waste recovery
(not landfill) 0 0
2040 1 0,0
0 0
0,0
Rural waste
2028 2
Local solutions 0 0
2023 5 , 0
4
Collaboration and research
0 0
2017 6 0,0 r
yea
Policy changes er
e sp
nn
To
Document Set ID: 7572092 Our vision - Zero Waste 2050
Version: 1, Version Date: 08/11/2017WASTE MANAGEMENT & MINIMISATION PLAN 2017
44 Set ID: 7572092
Document
Version: 1, Version Date: 08/11/2017WASTE MANAGEMENT & MINIMISATION PLAN 2017
Part C. Appendices
Document Set ID: 7572092 45
Version: 1, Version Date: 08/11/2017WASTE MANAGEMENT & MINIMISATION PLAN 2017
Appendix 1: NPDC Waste Assessment 2017
46 Set ID: 7572092
Document
Version: 1, Version Date: 08/11/2017WASTE MANAGEMENT & MINIMISATION PLAN 2017
Appendix 2: Definition of terms
Biosolids refers to treated sewage sludge that is Disposal*, unless the context requires another
stabilised and suitable for beneficial reuse. meaning, means:
a) The final (or more than short-term) deposit
Cleanfill site refers to a waste disposal site that of waste into or onto land set apart for that
accepts only cleanfill material. purpose; or
Cleanfill material refers to material that when b) The incineration of waste.
buried will have no adverse effect on people or
the environment. Cleanfill material includes virgin Disposal facility*, unless the context requires
natural materials such as clay, soil and rock, and another meaning, means:
other inert materials such as concrete or brick that a) A facility, including a landfill,
are free of:
i) At which waste is disposed of; and
• Combustible, putrescible, degradable or
ii) At which the waste is disposed of includes
leachable components;
household waste; and
• Hazardous substances;
iii) That operates, at least in part, as a business
• Products or materials derived from hazardous to dispose of waste; and
waste treatment, stabilisation and disposal
b) Any other facility or class of facility at which
practices;
waste is disposed of that is prescribed as a
• Materials that may present a risk to human or disposal facility.
animal health such as medical and veterinary
waste, asbestos or radioactive substances; District means the district of a territorial authority.
• Liquid waste.
Diverted material* means any thing that is no
Commercial and industrial (C&I) wastes refer to longer required for its original purpose and, but for
waste sourced from industrial, commercial and commercial or other waste minimisation activities,
institutional sources (i.e. supermarkets, shops, would be disposed of or discarded.
schools, hospitals, offices). This waste can also be
referred to as industrial, commercial and institutional Domestic kerbside waste refers to Domestic-type
waste. waste collected from residential premises by the
local council (or by a contractor on behalf of the
Construction and demolition (C&D) wastes refer to Council), or by private waste collections (through
waste material from the construction or demolition kerbside or similar collection).
of a building, including the preparation and/or
clearance of the property or site. Hazardous waste refers to materials that are
flammable, explosive, oxidising, corrosive, toxic,
Contaminated land means land that has a hazardous ecotoxic, radioactive or infectious. Examples include
substance in or on it that: unused agricultural chemicals, solvents and cleaning
fluids, medical waste and many industrial wastes.
a) Has significant adverse effects on the
environment; or Household waste* means waste from a household
b) Is reasonably likely to have significant adverse that is not entirely from construction, renovation or
effects on the environment. demolition of the house.
Contaminated sites refer to land areas that are Inert material refers to material that when placed
contaminated, as defined above. in the ground have minimal adverse effects on the
surrounding environment.
Document Set ID: 7572092 47
Version: 1, Version Date: 08/11/2017You can also read


