BACHELOR'S THESIS - UIS BRAGE
←
→
Page content transcription
If your browser does not render page correctly, please read the page content below
FACULTY OF SCIENCE AND TECHNOLOGY

              BACHELOR’S THESIS
Study programme/specialisation:                      Spring semester, 2021

Computer Science,
Electrical Engineering
                                                      Open / Confidential

Authors: Nikolas Cameron Grimstad, Simen Graue Kase,
Stephan Frederik Werner Brandasu

Programme coordinator: Naeem Khademi

Supervisor(s): Naeem Khademi

Title of Bachelor’s Thesis: An Indoor Positioning System for IDE
using Bluetooth Low-Energy Beacons

Credits: 20

Keywords:                                                  Pages: 37
                                                         + attachments
Indoor positioning, wireless communication,      Stavanger, 15th of May / 2021
Bluetooth Low Energy                                       date/year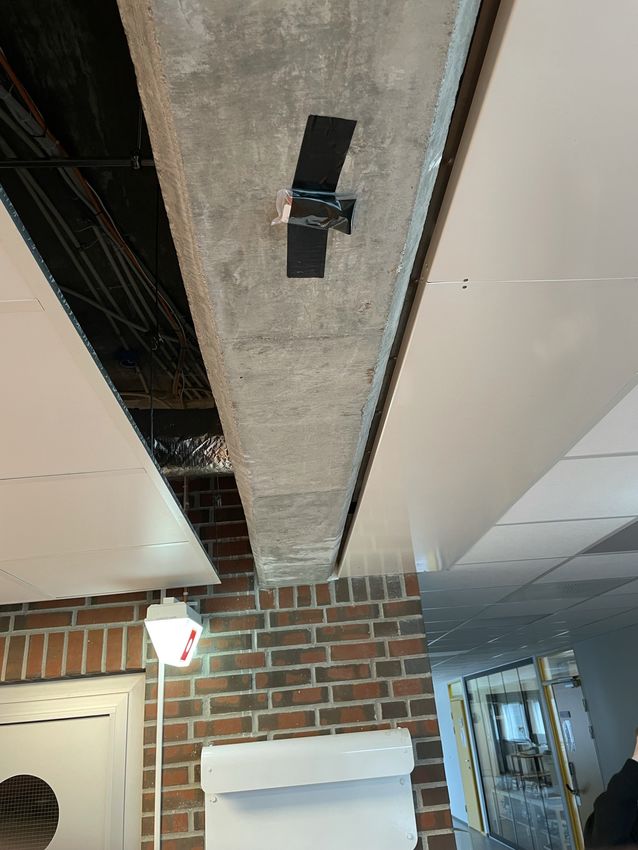
An Indoor Positioning System for
IDE using Bluetooth Low-Energy
           Beacons

                                 by
                 Nikolas Cameron Grimstad
                     Simen Graue Kase
             Stephan Frederik Werner Brandasu
                    Supervisor: Naeem Khademi

A thesis submitted in partial fulfillment for the bachelor’s degree of
           Computer Science and Electrical Engineering
                               at the
              Faculty of Science and Technology
   Department of Electrical Engineering and Computer Science

                            May 2021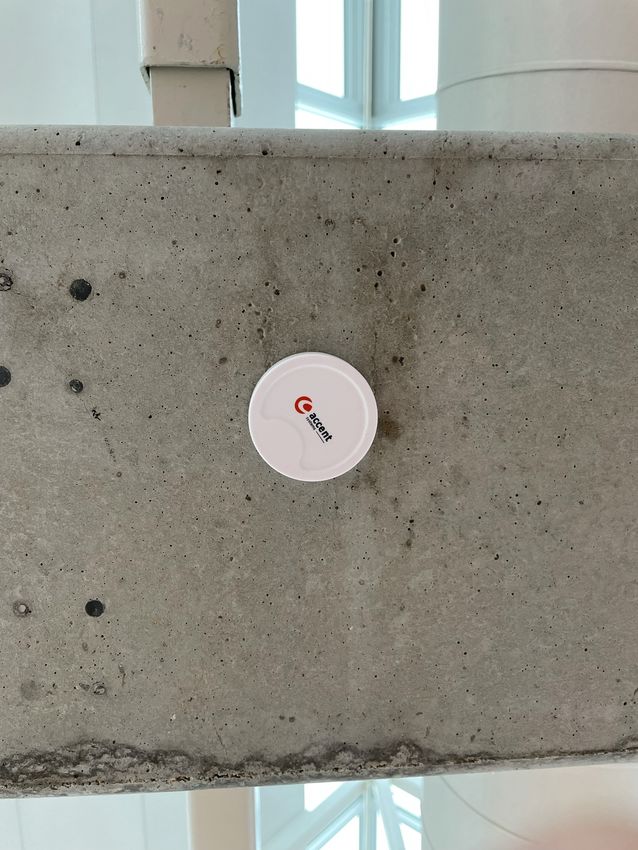
Abstract
This thesis provides a solution for the challenge of accurate indoor positioning.
Using both commercial Bluetooth Low Energy (BLE) beacons and our own Do It
Yourself (DIY) beacons, using ESP32’s, we were able to compare these solutions
in different environments.
A Two-dimensional (2D) Indoor Positioning System (IPS) was setup in the hallway
of the Kjølv Egeland building at the University of Stavanger.
Test were run both before and after implementation of the IPS, and even though
we were only able to run a limited amount of tests, the results show that an IPS
could be a viable solution.

                                        ii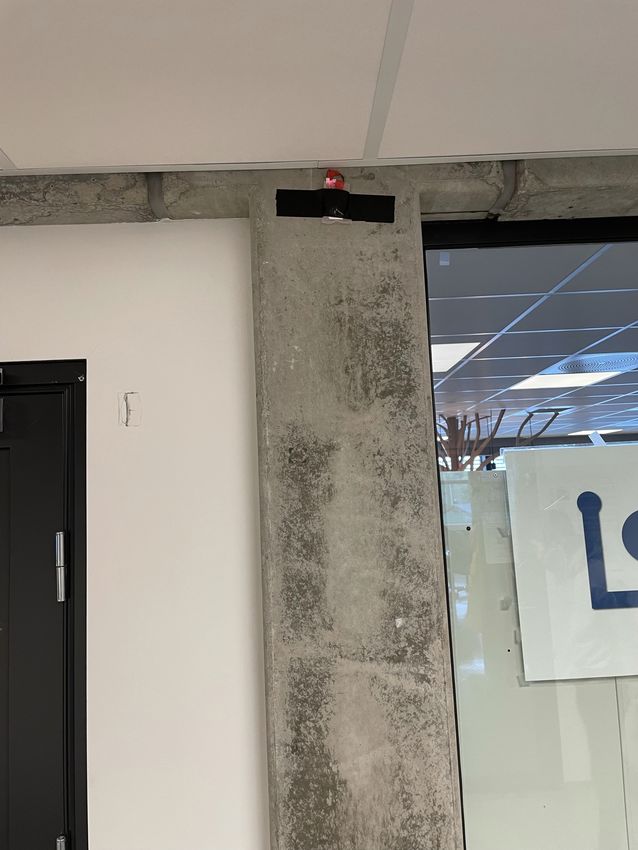
Preface
This bachelor thesis was written at the Department of Electrical Engineering and
Computer Science at the University of Stavanger.
We would like to give a special thanks to our supervisor Naeem Khademi, an
Associate Professor at UiS, who has given us valuable guidance and contributed
with insightful and nuanced perspectives.
We would also like to thank Ståle Freyer for teaching us how to solder and for
helping us with our beacon hardware orders.
Thanks to Statsbygg, to Operations Manager Jan Magnus Kringstad, for giving
us the floor plans for UiS.
Also thanks to Sorina Sarac for loaning us her Huawei Mate 10 Lite, Saskia Brandasu
for loaning us her Samsung Galaxy S8, and to Ingunn Graue Kase for helping
with proofreading our thesis.
Finally we would like to thank UiS, for offered learning resources and for buying
the beacon hardware for us.

                                        iii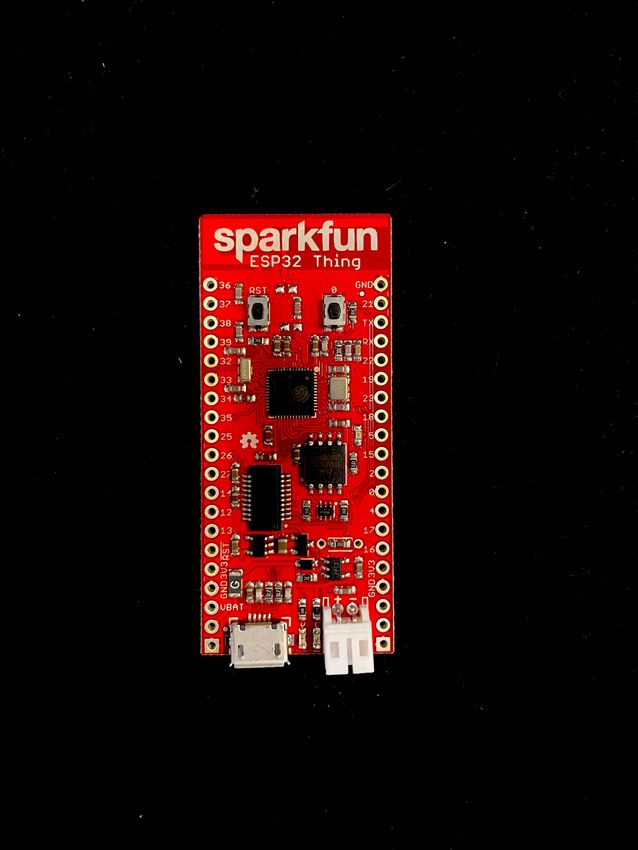
Contents

 1   Introduction . . . . . . . . . . . . . . . . . . . . . . . . . . . . . . . .     1
     1.1     Problem . . . . . . . . . . . . . . . . . . . . . . . . . . . . . .      1
     1.2     Objective . . . . . . . . . . . . . . . . . . . . . . . . . . . . .      1
     1.3     Approach . . . . . . . . . . . . . . . . . . . . . . . . . . . . .       1
     1.4     Thesis Outline . . . . . . . . . . . . . . . . . . . . . . . . . .       2
 2   Literature Review     . . . . . . . . . . . . . . . . . . . . . . . . . . . .    3
     2.1     Methods of detecting position in 2D space . . . . . . . . . . .          3
             2.1.1     Trilateration . . . . . . . . . . . . . . . . . . . . . .      3
             2.1.2     ToA & TDoA . . . . . . . . . . . . . . . . . . . . .           3
             2.1.3     RSSI & RX Power level . . . . . . . . . . . . . . . .          4
             2.1.4     AoA & AoD . . . . . . . . . . . . . . . . . . . . . .          4
             2.1.5     Fingerprinting . . . . . . . . . . . . . . . . . . . . .      5
     2.2     Positioning methods and technologies . . . . . . . . . . . . .           5
             2.2.1     GPS positioning . . . . . . . . . . . . . . . . . . . .        6
             2.2.2      BLE positioning system . . . . . . . . . . . . . . .          6
             2.2.3     Wi-Fi positioning system . . . . . . . . . . . . . . .         6
             2.2.4      Ultra-Wideband indoor positioning . . . . . . . . .           6
     2.3     Spec sheet comparison of commercial beacons . . . . . . . . .           7
     2.4     Beacon protocols . . . . . . . . . . . . . . . . . . . . . . . . .       8
     2.5     Related works . . . . . . . . . . . . . . . . . . . . . . . . . . .     10
             2.5.1     Fighting the global pandemic . . . . . . . . . . . . .        10
 3   Methodology . . . . . . . . . . . . . . . . . . . . . . . . . . . . . . .       11
     3.1     Base Stations . . . . . . . . . . . . . . . . . . . . . . . . . . .     11
             3.1.1     ESP32     . . . . . . . . . . . . . . . . . . . . . . . . .   11
             3.1.2     iBKS 105 . . . . . . . . . . . . . . . . . . . . . . . .      12
             3.1.3     Beacon installation . . . . . . . . . . . . . . . . . .       13
             3.1.4     Little-endian . . . . . . . . . . . . . . . . . . . . . .     14
             3.1.5     Differentiating between beacons . . . . . . . . . . .         15
     3.2     Mobile Phones . . . . . . . . . . . . . . . . . . . . . . . . . .       16

                                       iv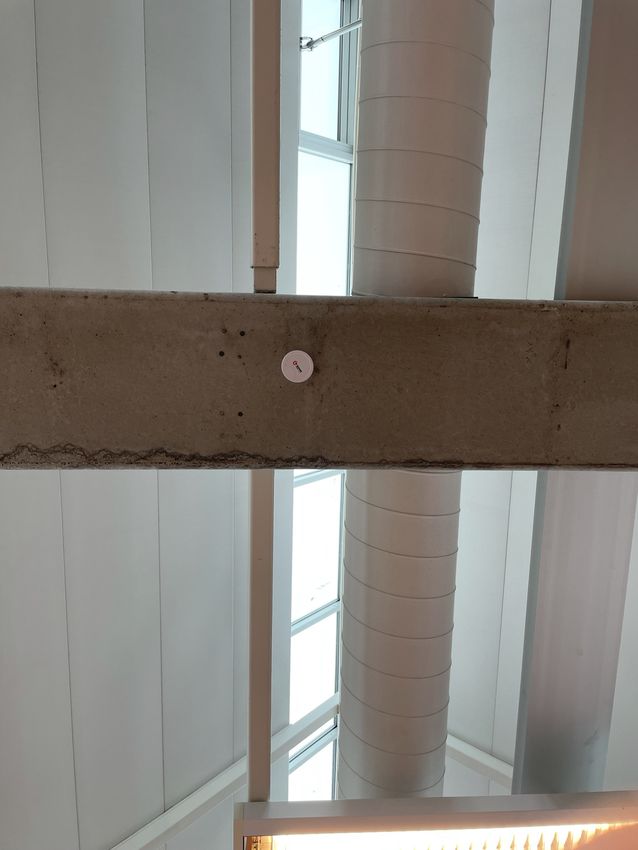
3.3     RSSI monitoring app . . . . . . . . . . . . . . . . . . . . . . .       17
              3.3.1     The code . . . . . . . . . . . . . . . . . . . . . . . .      17
              3.3.2     Collecting the Received Signal Strength Indication
                        (RSSI) measurements . . . . . . . . . . . . . . . . .         19
      3.4     Indoor Mapping Service . . . . . . . . . . . . . . . . . . . . .        21
              3.4.1     Test map . . . . . . . . . . . . . . . . . . . . . . . .      21
              3.4.2     Layout of the Beacons . . . . . . . . . . . . . . . . .       22
              3.4.3     Creating the map in IndoorAtlas . . . . . . . . . . .         23
              3.4.4     Recording the data . . . . . . . . . . . . . . . . . .        23
  4   Results . . . . . . . . . . . . . . . . . . . . . . . . . . . . . . . . . . .   26
      4.1     RSSI Measuring app results . . . . . . . . . . . . . . . . . . .        26
              4.1.1     iBKS 105 Results . . . . . . . . . . . . . . . . . . .        26
              4.1.2     ESP32 Results . . . . . . . . . . . . . . . . . . . . .       28
              4.1.3     Comparison between the iBKS105 and ESP32 . . .                30
      4.2     Indoor positioning accuracy . . . . . . . . . . . . . . . . . . .       32
              4.2.1     Indoor accuracy results on Android between no
                        beacons, medium density and high density beacon
                        placement . . . . . . . . . . . . . . . . . . . . . . . .     32
              4.2.2     Indoor accuracy results on iOS between no beacons
                        and high density beacon placement . . . . . . . . .           34
  5   Conclusions & Recommendations . . . . . . . . . . . . . . . . . . . .           36
      5.1     Conclusion . . . . . . . . . . . . . . . . . . . . . . . . . . . .      36
              5.1.1     Research question 1 . . . . . . . . . . . . . . . . . .       36
              5.1.2     Research question 2 . . . . . . . . . . . . . . . . . .       36
      5.2     Future Work . . . . . . . . . . . . . . . . . . . . . . . . . . .       37

A Source Code                                                                         42

                                         v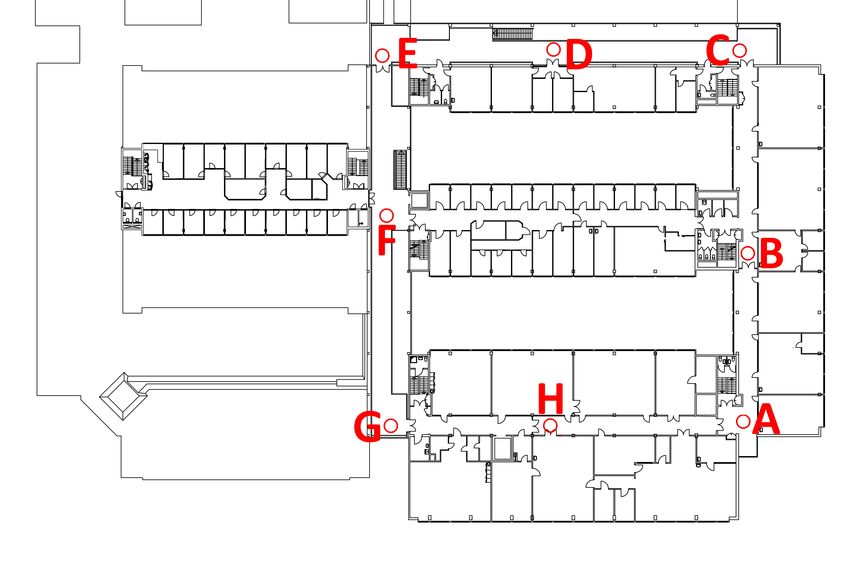
List of Figures

 2.1   Trilateration method . . . . . . . . . . . . . . . . . . . . . . . . . . .      3
 2.2   Using the phase difference to get the Angle of Arrival . . . . . . . .          5
 3.1   Picture of the SparkFun ESP32 Thing Model . . . . . . . . . . . . .            12
 3.2   Picture of the iBKS 105 beacon . . . . . . . . . . . . . . . . . . . . .       13
 3.3   An iBKS 105 mounted to the bottom of a vertical beam using the
       adhesive on the back . . . . . . . . . . . . . . . . . . . . . . . . . . .     13
 3.4   ESP32’s mounted in the hallway of Kjølv Egeland building in the
       university . . . . . . . . . . . . . . . . . . . . . . . . . . . . . . . . .   14
 3.5   Little-endian . . . . . . . . . . . . . . . . . . . . . . . . . . . . . . .    14
 3.6   Showing all the beacons with their Major and Minor values using
       the Beacon Sample app by Apple . . . . . . . . . . . . . . . . . . . .         15
 3.7   Line 26-45 in ibeacon distance measure/ContentView.swift           . . . . .   17
 3.8   Line 47-59 in ibeacon distance measure/ContentView.swift           . . . . .   18
 3.9   Line 61-83 in ibeacon distance measure/ContentView.swift           . . . . .   19
 3.10 The hallway used for indoor RSSI measuring marked in red. Note:
      This image is flipped 90 degress counter clockwise so North is to
      the left. . . . . . . . . . . . . . . . . . . . . . . . . . . . . . . . . . .   20
 3.11 RSSI readings being measured can be seen in the bottom right of
      this figure. Note the preview window in the middle right does not
      show a live preview of the phone screen, it there to show the layout
      of the UI. . . . . . . . . . . . . . . . . . . . . . . . . . . . . . . . . .    20
 3.12 Map of where location accuracy was tested in the 4th floor of the
      Kjølv Egeland (KE) building rotated 90 degress counter clockwise
      (north is to the left) . . . . . . . . . . . . . . . . . . . . . . . . . . .    21
 3.13 The medium density beacon map, where beacons are placed near
      corners and door to hallways to ensure coverage in important places             22
 3.14 The high density beacon map where beacons are placed in the
      middle of long corridors, and more doorways are covered. . . . . . .            23
 3.15 The setting required to do 1 second jumps through a recording
      played back in VLC. Make sure to set ’Very short jump length’
      from the default value of 3 to 1, and search ’very short’ to find
      what the default key-bind is for your system. . . . . . . . . . . . . .         24
 3.16 shows 2 different samples from the recording used to measure the
      data for high beacon density on iOS at test spot A . . . . . . . . . .          25

                                         vi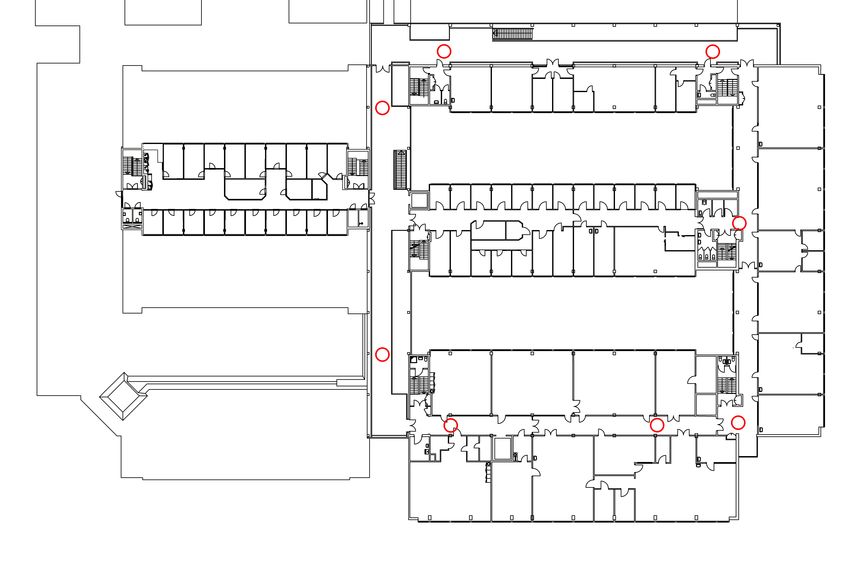
4.1   2 figures showing the iBKS 105 RSSI measurements over the 2
      minute testing periods, including the median of each test distance. .          27
4.2   Comparison of RSSI measured on the iBKS 105 indoors and outdoors 28
4.3   2 figures showing the ESP32 RSSI measurements over the 2 minute
      testing periods, including the median of each test distance. . . . . .         29
4.4   Comparison of RSSI measured indoors and outdoors . . . . . . . . .             30
4.5   iBKS 105 vs ESP32 RSSI measurement comparison indoors and
      outdoors . . . . . . . . . . . . . . . . . . . . . . . . . . . . . . . . . .   31
4.6   3 figures showing the inaccuracy measured at each testing point for
      10 seconds, where 1 sample represents 1 second. Note: The same
      legend applies to all 3 figures. . . . . . . . . . . . . . . . . . . . . . .   32
4.7   2 figures showing the inaccuracy measured at each testing point for
      10 seconds, where 1 sample represents 1 second. Note: The same
      legend applies to both figures. . . . . . . . . . . . . . . . . . . . . . .    34

                                        vii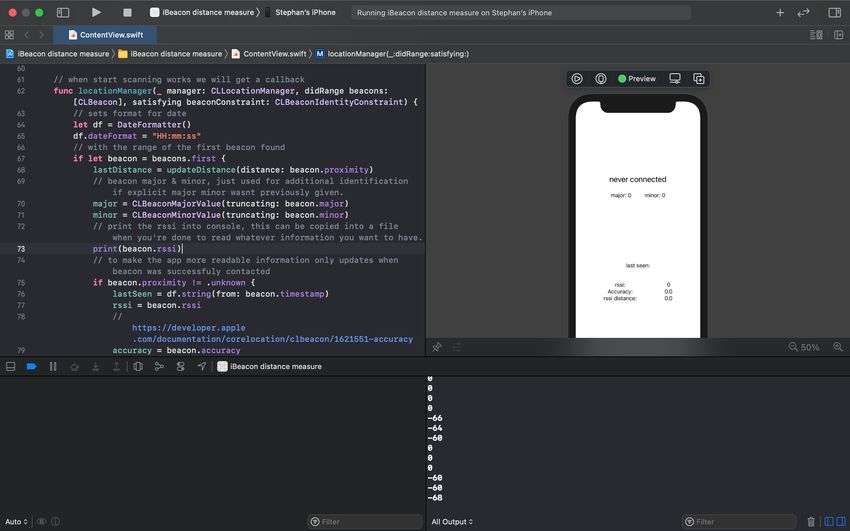
Acronyms

2D    Two-dimensional
AoA Angle of Arrival
AoD Angle of Departure
APs Access Points

BLE Bluetooth Low Energy
dBm Decibel-milliwatt
DIY Do It Yourself

EID Ephemeral Identifier

GPS Global Positioning System
IPS   Indoor Positioning System
KE    Kjølv Egeland

RSSI Received Signal Strength Indication
RX    Receive Level
SoC   System on a Chip
TDoA Time Difference of Arrival

TLM Telemetry

ToA    Time of Arrival

ToF    Time-of-flight

UID Unique Identifier
URL Uniform Resource Locator
UUID Universally Unique Identifier

UWB Ultra-Wideband

                                     viii
1. Introduction 1.3. Approach
1 Introduction
1.1 Problem
The question that will be be explored through this thesis comes in 2 parts; Is it
viable to make your own DIY beacon instead of buying a commercial ready made
solution, and is the improvement of setting up an IPS worth it?
Map applications used for finding your way around places have become very common,
but Global Positioning System (GPS) struggles a lot when you move indoors.
This makes navigating using these map applications very difficult in large and
complex buildings. The solution to this problem is a technology dedicated for
indoor use referred to as IPS. But there are many different methods of implementing
IPS. In this thesis we will focus on implementing IPS through the use of BLE
beacons. This is a small device that broadcasts a Bluetooth signal at a set power
and a set interval. This can be used to help improve location accuracy indoors.
1.2 Objective
To document the process of choosing the type of Bluetooth beacon, whether it
be commercial or a DIY solution based on factors such as convenience and price.
Document the process of setting up said beacons, and to see how well each solution
works in specific scenarios. This information can aid places like Universities, Library’s,
stadiums or tunnels to set up a beacon network to enable indoor positioning at
their venue.
1.3 Approach
The system consists of a beacon, a mobile phone, and a IPS service. The beacons
will be our DIY beacons and some commercial beacons. These beacons will be
installed and then an IPS will be set up to take advantage of them. The mobile
phones will look for beacons, and with the help of a specific app will know what
to do with them.
11. Introduction 1.4. Thesis Outline
1.4 Thesis Outline
Chapter 2 - Literature Review
Literature review of key concept, beacons and related works.
Chapter 3 - Methodology
Implementations and details of our system.
Chapter 4 - Results & Discussion
The results and analysis of significance of the results.
Chapter 5 - Conclusions - & Recommendations
Summary of our project, our general thoughts and recommendations for
future works.
Appendix A - Source Code
The software developed during this thesis.
22. Literature Review 2.1. Methods of detecting position in 2D space
2 Literature Review
2.1 Methods of detecting position in 2D space
There are many different methods of trying to detect the position of a device in
2D space, in this sub chapter we will explore some of these.
2.1.1 Trilateration
Figure 2.1: Trilateration method
Trilateration is a common method for position calculations. Trilateration uses
three or more fixed points in 2D space to calculate the position of an object, by
finding the intersection of a series of circles, as shown in figure 2.1. The distance
between the Access Points (APs) can be found by using either RSSI, Time of
Arrival (ToA) or Time Difference of Arrival (TDoA). The distance estimated
by signal strength is presented as a circle with a radius around the APs. The
intersection of three AP radius’s provide a point or an area of the user equipment
[31].
2.1.2 ToA & TDoA
ToA and TDoA measure distance to a stationary by measuring the signal loop
time. This means that a stationary device sends a signal to a mobile device. The
mobile device returns the signal to the stationary device, and the stationary device
will calculate the full round travel time to determine how far away the mobile
device is. The formula for ToA calculation is:
d = c ∗ (tarrival − tsent )
Where c refers to the speed of light. The formula for TDoA calculation is:
∆d = c ∗ (∆t)
32. Literature Review 2.1. Methods of detecting position in 2D space
[29]
To find the location of the mobile device in 2-dimensional space, multiple
stationary devices have to be used to triangulate the location of the mobile device.
The difference between ToA and TDoA is that in ToA all devices must have a
synchronised clock, while for TDoA only the stationary devices need to have a
synchronised clock.
2.1.3 RSSI & RX Power level
Receive Level (RX) and RSSI measure distance using radio signal strength received
by the antenna. RX is measured in milliWatts (mW) or Decibel-milliwatt (dBm)
which is an absolute measurement. While RSSI is measured through a relative
measurement set by a given device manufacturer. This means that RSSI is not
measured on the same scale between different devices. Some manufacturer might
choose to have a ”normal” scale going from 0-100, while another one could choose
to do 0-60 [35]. Additionally, this type of measurement could be problematic
because different chip-set manufacturers for the mobile phone could give different
readings [15].
Power level based measurements also struggle a lot with signal noise. Signal
noise could be created by reflective surfaces in the environment the beacon is
installed in, or by having to fight over the same frequency as a lot of other nearby
Bluetooth devices. Objects such as pillars can also physically block the signal
making readings unreliable.
The issue of signal noise can be partially remedied using a Kalman filter [8].
This filter is designed to estimate the value of a measurement based on a joint
probability distribution. This will significantly reduce the amount of noise in the
RSSI readings of a beacon. [8]
To find your position in 2D space power level based measurements use trilateration
in the same way that ToA does.
2.1.4 AoA & AoD
Angle of Arrival (AoA) and Angle of Departure (AoD) are different from the
other listed methods, because they can find your location in 2D space using only
a single beacon. In AoA a transmitter sends a signal to a receiver which has an
array of multiple antennas. The receiving device can determine the direction using
the phase difference of the incoming signal. The calculation to determine the
angle of the incoming signal is:
θ = arccos((ψλ)/(2πd))
where ψ is the phase difference, λ is the wave length and d is the distance between
each adjacent antenna.[36]
42. Literature Review 2.2. Positioning methods and technologies
Figure 2.2: Using the phase difference to get the Angle of Arrival
AoA works the opposite way from AoD, this means that in this case the
transmitter has multiple antennae and the receiver only has 1 [18].
In theory, this technology would be the best one for our use due to needing
less beacons and being very accurate. The issue is that there are very few mobile
phones at the time of writing with Bluetooth 5.1 support, this could be very relevant
in a few years though.
2.1.5 Fingerprinting
Fingerprinting can be used to improve the location accuracy of any of the technologies
listed above. This is done by essentially calibrating the equipment to teach it that
a given measurement is in a specific manually measured location. The issue with
this though is that for example with RSSI, if a piece of furniture being added
or removed could make the measurements inaccurate again. This is due to the
furniture blocking the signal.
2.2 Positioning methods and technologies
IPS is an up and coming technology which keep attracting more attention due
to its many use cases. Some of the use cases include: Human detection/tracking,
sending messages to devices, navigation and many more. There are several different
methods and technologies that can be used for an IPS. In this section we will
compare a few different technologies, BLE, Wi-Fi and Ultra-Wideband (UWB).
52. Literature Review 2.2. Positioning methods and technologies
2.2.1 GPS positioning
While GPS works great outside and in building through windows, it often struggle
with its accuracy when it comes to indoor positioning. This is because the GPS
satellites works best with a direct line of sight to devices. When indoors, the
signals weakens or distorts as it travels through walls, and the result is inaccurate.
2.2.2 BLE positioning system
Bluetooth Low Energy (BLE) [24] is a radio-frequency technology which can be
used for device tracking, indoor navigation, and many more indoor positioning
cases. Its low energy, fairly accurate and supports both iOS and Android.
An IPS using BLE relies on Bluetooth beacons being mounted on objects,
walls or ceilings, from where they emit radio signals at predetermined intervals.
Bluetooth beacons operate on the BLE protocols. They are low-power Bluetooth
transmitters that can be detected by devices such as smartphones and BLE-enabled
sensors. The beacons do not transmit signals constantly. They ”blink”.
Although one beacon is sufficient in establishing the presence of an object,
it cannot pinpoint the specific location. Usually, the location accuracy increases
with the number of beacons. BLE typically relies on RSSI value to estimate the
location of devices defined by the protocols chapter 2.4.
BLE is the IPS solution that we are going to use for our project.
2.2.3 Wi-Fi positioning system
Wi-Fi is a local wireless network that uses radio waves to communicate data. A
Wi-Fi positioning system uses several techniques to locate a connected object or
device. A Wi-Fi IPS uses APs and already existing infrastructure to calculate
a device’s location. By analyzing the signal strength of multiple Wi-Fi signals
and knowing the locations of the APs, you are able to determine the approximate
location of a connected device [32].
The two primary methods for tracking Wi-Fi enabled UE is RSSI and fingerprinting.
RSSI of a Wi-Fi signal is inversely proportional to distance, meaning that one
value decreases at the same rate that the other value increases. An example of
this is that the closer a connected device is to an AP the stronger the RSSI values,
and vice versa.
The main advantage of Wi-Fi positioning is accessibility. Many buildings
already have a Wi-Fi network infrastructure already installed. It also has higher
data transfer and greater range than BLE.
One of its disadvantages is its security. Wi-Fi is such a common technology
so its less secure to being hacked [26].
2.2.4 Ultra-Wideband indoor positioning
UWB is a short-range radio technology which uses Time-of-flight (ToF) to get
positioning. UWB indoor positioning has a significant advantage over the others.
It has the best accuracy with up to 30cm [23], and almost no interference. Its
biggest disadvantage is that it only works with iPhone 11 or newer models [34].
62. Literature Review 2.3. Spec sheet comparison of commercial beacons
BLE Wi-Fi UWB
Location2. Literature Review 2.4. Beacon protocols
the university to have to change the batteries every year or so. So that eliminated
a lot of the potential beacon options.
They needed to support BLE and either iBeacon or Eddystone. Which all
our beacons did thankfully. Their size should be as small and therefor less detectable
as possible, considering they where going to be put up in the university. And last
but not least, the beacons needed to be capable of being funded. The beacons
should be as cost effective as possible, which will help our case for funding.
2.4 Beacon protocols
iBeacon and Eddystone
iBeacon [20] and Eddystone [13, 14] are 2 different profiles developed by
Apple and Google respectively. They are used by mobile phone apps on both
iOS and Android to communicate with compatible Bluetooth beacons. These 2
beacon formats are different in some of the payload that is sent in each frame.
The iBeacon frame contains:
1. UUID: General information about the beacon (Owner for example)
2. Major: The beacon’s most general information (building and/or floor its on)
3. Minor: More specific information about the beacon (beacon is in room 42)
While the Eddystone frame contains:
1. UID: Similar to UUID major and minor, has a namespace and instance
2. URL: a compressed URL that can be directly used by an end user
3. TLM: telemetry data useful for fleet management
4. EID: additional security measure
These extra Eddystone packets mean its more controllable and has better fleet
management than iBeacon, but it also makes it more difficult to implement. Eddystone
is also open source while iBeacon is proprietary. It’s very important for Eddystone
to be open source, because somebody could continue maintaining Eddystone after
Google shuts it down on April 1st, 2021.[13]
82. Literature Review 2.4. Beacon protocols
iBeacon Eddystone
Compatibility Compatible with Native to both
Android and iOS, but Android and iOS.
only native to iOS.
Battery life A little more than Bit less than iBeacon
Eddystone. depending on which
frames is being used.
Profile Its proprietary Its specifications
software, so the are open source on
specifications is GitHub. So developers
controlled by Apple. can contribute to make
it better.
Usage For sending messages, Eddystone can send
iBeacon needs an app URL directly to
on smartphones to smartphones. For
do a particular task iOS, its supported
with the received on Chrome. And on
information. So either Android its supported
create our own app or on the physical web.
use a third party app.
Security and The signal transmitted The EID feature,
privacy by beacons using that constantly
iBeacon is a public change which allows
signal, meaning it can a broadcast signals to
be detected by any iOS only be identified by
and Android devices. ”authorized clients”.
For the user Less features, more More features
documentation, and and sends more
simpler to implement. information, but more
complicated when it
comes to integration.
Table 2.3: Comparison between iBeacon and Eddystone [16]
92. Literature Review 2.5. Related works
AltBeacon
AltBeacon [3] is an open source beacon protocol from Radius Network. It’s very
similar to iBeacon as it covers the same functionalities as it, only that its open
source, not company specific and not widely used [5]. AltBeacon can deliver more
data per message than iBeacon, however its main problem is that its not as widely
supported. AltBeacon was created to make an open, competitive market for beacon
protocols.
Competing against Apple’s iBeacon is not an easy task. In time it may increase
in popularity due to the fact that it is able to carry more data per message, and
being open source.
Despite the fact that AltBeacon was a good option, we decided to use the iBeacon
protocol, as it suited our project better.
2.5 Related works
2.5.1 Fighting the global pandemic
In an effort to track, and possibly stop the flow of new Covid-19 cases, Governments
around the world are rushing to track the locations of their populace [7]. One
way to do this could be to set up indoor positioning systems in malls, universities
and schools, and a whole range of other public locations where strangers might
run into each other. The government could write a smartphone app which uses
Bluetooth technology, and encourage, or even mandate, that citizens download
the application. One example of an already existing app in Norway is Smittestopp.
Smittestopp is designed with user privacy in mind. Once you download the
app you are already on your way. There is no need to log in, thus you have never
told the app who you are. The app never shares data in regards to your movement,
but instead “identifies” you for other application users within the proximity using
Bluetooth [27]. The way it does so is by sharing an auto generated number. This
number is constantly changing, and is not traceable to any particular person in
the first place. But all the numbers you “meet” are stored on your phone.
The way the app uses these stored numbers, is when a person reports that
he or she is infected by the virus in the app. The person must then log in, and
the list of stored number over a 2-week period are sent into a central overview.
Phones are then checked and if a number from the central overview is also stored
on your phone, you are then considered a close contact, and will have to quarantine
[27].
103. Methodology 3.1. Base Stations
3 Methodology
The main objective of this system is further increase the accuracy of indoor navigation.
This chapter discusses what steps that needed to be taken in order to setup our
IPS.
3.1 Base Stations
When designing a positioning system, there are typically two components needed.
A base station (in our case a Bluetooth beacon) and a mobile station (in our case
a mobile phone). In GPS, the satellites acts as the base stations, while people,
cars etc. works as the mobile stations. We’re using beacons for positioning, so the
beacons are the base stations, while smartphones or other smart devices acts as
the mobile stations.
When using beacons for positioning there are at least two design options:
1. The beacons are at fixed locations constantly listening for known signals
from smart devices.
2. The beacons are at fixed locations transmitting signals that smart devices
pick up.
Option 1 is a good option for positioning, however the beacons would do a lot
more work than in option 2. This would drain our beacons battery life at a faster
rate.
We chose option 2, where the beacons will be our base stations transmitting signals
at a predetermined interval, and the mobile station, in this case smartphones, will
listen for these signals. This will give our beacons longer battery life, as their only
job is to transmit signals.
Some companies prohibit smartphones, however since we are installing these base
stations at UiS it shouldn’t be a problem.
Requirements for the base stations:
• BLE enabled.
• Either iBeacon or Eddystone compatible.
• Small and mostly unnoticeable.
• Should run on a battery.
A prototype that fitted the regiments was built using the ESP32 series. For fulfilling
the last requirement, we connected the ESP32 to a LiPo battery. A powerbank
could also had worked.
3.1.1 ESP32
ESP32 is a series of low cost, low power system on a chip microcontroller with
integrated Wi-Fi and dual-mode Bluetooth. It is a successor to the ESP8266.
Our base stations will be the SparkFun ESP32 Thing [33]. They will use the Eddystone
protocol, which smartphones will pick up.
The SparkFun ESP32 Thing module features:
113. Methodology 3.1. Base Stations
• Up to a 240MHZ dual-core Tensilica LX6 microprocessor
• 520kB internal SRAM
• Micro USB port
• 2-pin JST connector port
• Integrated LiPo battery charger
• Integrated sleep mode
• BLE compatible
• Configurable
Figure 3.1: Picture of the SparkFun ESP32 Thing Model
Should this system go into production, the ESP32 could be replaced by a different
model to further reduce the footprint and cost. We chose the SparkFun ESP32
Thing mainly for its integrated JST connector port. This port made it so that we
could connect a LiPo battery for our power source. It also filled all our requirements
for a base station.
The ESP32 could also be replaced by a commercial beacon.
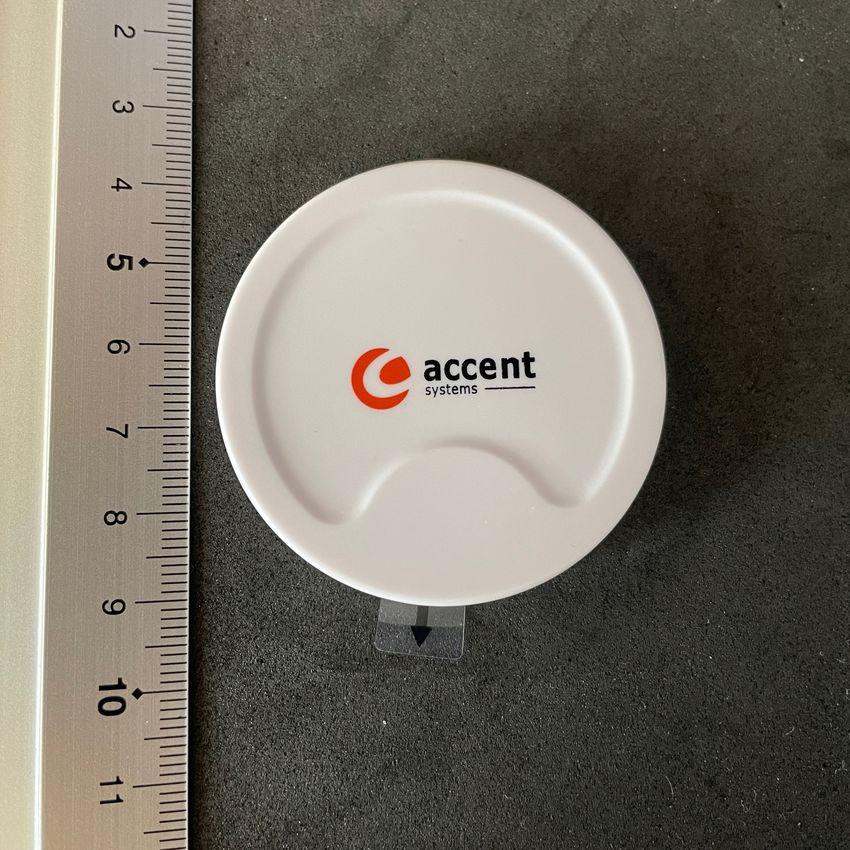
3.1.2 iBKS 105
We chose the iBKS 105 [22] model for our commercial beacons. They operate on
the BLE protocol, and supports both Eddystone and iBeacon protocol. The iBKS
105 beacons run of a coin battery, and can last for 24-48 months depending on
their configuration. Our configuration should give it a battery life of approximately
38 months.
123. Methodology 3.1. Base Stations
Figure 3.2: Picture of the iBKS 105 beacon
3.1.3 Beacon installation
The beacons were always installed on concrete due to it being a non reflective
surface, either on the side of pillars or on the bottom of beams going across the
ceiling. For the ESP32’s it was important to keep in mind the placement of the
ESP32, and the relative position of the battery. The battery is almost the size
of the ESP32 and could interfere with it’s signal. The battery was always on the
side of the surface the beacon was being attached to.
The iBKS 105 could be mounted using the adhesive on the back of the beacon
as shown in figure 3.3
(a) iBKS105 shown from a small (b) iBKS105 shown close up
distance
Figure 3.3: An iBKS 105 mounted to the bottom of a vertical beam using the
adhesive on the back
The ESP32’s were put in the small plastic bag they came in together with
the battery, and taped to the surface they were being attached to as seen in figure
3.4.
133. Methodology 3.1. Base Stations
(a) ESP32 attached to the bottom of a (b) ESP32 attached to the side of a
vertical beam going across the ceiling pillar
Figure 3.4: ESP32’s mounted in the hallway of Kjølv Egeland building in the
university
3.1.4 Little-endian
When we tested our ESP32 we got a different UUID than we expected. We found
out that the ESP32 is a little-endian native architecture, meaning that the ESP32
stores the least significant byte of a word at the largest memory address (Illustrated
in figure 3.5).
Figure 3.5: Little-endian
143. Methodology 3.1. Base Stations
So in the case of figure 3.5, the 32-bit-integer ACB18A09 would be stored in
the memory as
0x09 0x8A 0xB1 0xAC 0x8A
This is important to note, or else we can interpret data in an incorrect fashion.
Endianness is important to know when you are writing and reading the data across
networks from one system to another [28]. In our case this data was from our
ESP32s to our monitoring app.
3.1.5 Differentiating between beacons
For our system we decided to use iBeacon as the beacon protocol, this means that
to identify each beacon there is a UUID, Major, and Minor. In our system the
UUID would always be 098AB1AC − 28F 4 − 42D6 − A080 − F D45387B4231, the
Major and Minor combination should be unique on the other hand.
The Major in our case was 1104 on all our beacons. This was chosen because
we found that starting the Major with 0 would sometimes create some issues, so
we would start counting from 11. The first half would signify what building the
beacon is placed in, all beacons in our case were in the same building, so it was
the same on all of them. The 2nd half of the Major would signify the floor of the
building which in our case is the 4th floor, so it became 04.
The Minor would either start counting from 0 or from 10 depending on which
beacon it was. The ESP32’s started counting from 0, so since we had 7 of them
the ESP32 Minors would range from 0 − 6. Meanwhile the iBKS 105’ would
start counting from 10, so since we had 5 of them their Minors would range from
10 − 14.
Figure 3.6: Showing all the beacons with their Major and Minor values using the
Beacon Sample app by Apple
153. Methodology 3.2. Mobile Phones
3.2 Mobile Phones
When testing how the IPS works we primarily used 2 different phones, 1 Android
and 1 iPhone. This was not to compare how they relatively performed, but to
show that the IPS works on both platforms. Additionally a different Android
phone was used when fingerprinting the area, but it was not used for measuring.
The primary phones used for testing was the Huawei Mate 10 Lite for Android,
and the Apple iPhone 12 mini for iOS. The 12 mini was also used for the RSSI
measurement app. Additionally a Samsung Galaxy S8 was needed when mapping
the 4th floor, due to the Huawei Mate 10 Lite not having the necessary hardware
for mapping[4].
Phone Huawei Mate Apple iPhone Samsung
10 Lite 12 mini Galaxy S8
release October 2017 October 2020 April 2017
Bluetooth 4.2, A2DP, LE, 5.0, A2DP, LE 5.0, A2DP, LE,
aptX aptX
OS when Android 8.0 / iOS 14.5.1 Android 9.0 /
testing EMUI 5.1 (14.4.2 when One UI 1.0
testing RSSI)
Kirin 659 Apple A14 Exynos 8895
System on a Bionic
Chip (SoC)
Full [19] [25] [30]
specifications
Table 3.1: overview of relevant specifications of mobile phones used
Looking at table 3.1, it can be seen that the phone representing the Android
side of things is slightly older than it’s Apple counter part. As mentioned previously
this is not an issue due to the purpose of this thesis is not to compare the 2 platforms
against each other.
Another difference between the 2 main testing phones is that the Android
phone had no SIM card in it, meaning that if a part of the building has poor
Wi-Fi it could struggle with positioning. This is because it can’t fall back on
cellular broadband for internet. This could give it a harder time in some scenarios.
This should mean that it, thanks to its age and lack of cellular to fall back on,
it should be relatively close to a worst case scenario for the type of phone that
might be used with the IPS. So if it works with this Android phone it should
work with almost anything Android.
163. Methodology 3.3. RSSI monitoring app
3.3 RSSI monitoring app
To help us measure the RSSI values that a phone reads from a beacon, and be
able to extract this data and easily plot it, we developed an iOS app written in
swift. This connects to an iBeacon, reads it’s major and minor values, the time
it was last seen, its RSSI, the proximity, and the accuracy. Proximity is a value
which gives a very rough estimate of the distance between the beacon, and the
mobile phone in 4 possible cases[11].
• unknown: The proximity could not be determined.
• immediate: The beacon is in the immediate vicinity.
• near: The beacon is relatively close to the user.
• far: The beacon is far away.
The accuracy value is used to differentiate between beacons with the same
proximity value, but is not intended to be used as a way of finding the precise
location of a beacon[1].
3.3.1 The code
1 override init(){
2 super.init()
3 // requests permission to scan for beacons
4 locationManager = CLLocationManager()
5 locationManager?.delegate = self
6 locationManager?.requestWhenInUseAuthorization()
7 }
8
9 func locationManager(_ manager: CLLocationManager, didChangeAuthorization
,→ status: CLAuthorizationStatus){
10 // if app is authorized to use location
11 if status == .authorizedWhenInUse{
12 // monitoring is available for our device
13 if CLLocationManager.isMonitoringAvailable(for:
,→ CLBeaconRegion.self){
14 // ranging is available for our device
15 if CLLocationManager.isRangingAvailable(){
16 startScanning()
17 }
18 }
19 }
20 }
Figure 3.7: Line 26-45 in ibeacon distance measure/ContentView.swift
Figure 3.7 shows what happens when the app is opened. First the app will
create a location manager, and request permission to get the device location on
first open. This will only happen the first time the app is opened. After the permission
has been given, the app will check if it was given the permission. If it was, then it
will check if region monitoring is available for the current device. If it is, then it
will check if ranging is available for the current device. After the permission has
173. Methodology 3.3. RSSI monitoring app
been checked, and it has been checked if the device the app is installed on, has
the necessary hardware to support scanning for iBeacon. The app will call the
startScanning() function.
1 func startScanning(){
2 // "uuidgen" in terminal can generate a uuid
3 let uuid = UUID(uuidString: "098AB1AC-28F4-42D6-A080-FD45387B4231")!
4 let major = CLBeaconMajorValue("1104")!
5 let minor = CLBeaconMinorValue("0000")!
6 let constraint = CLBeaconIdentityConstraint(uuid: uuid, major: major,
,→ minor: minor)
7 let beaconRegion = CLBeaconRegion(beaconIdentityConstraint: constraint,
,→ identifier: "TestBeacon")
8
9 // start monitoring for the beacon identified above
10 locationManager?.startMonitoring(for: beaconRegion)
11 // start raning said beacon
12 locationManager?.startRangingBeacons(satisfying: constraint)
13 }
Figure 3.8: Line 47-59 in ibeacon distance measure/ContentView.swift
Figure 3.8 Shows the startScanning() function. The function defines a UUID
which must be added to the beacon constraint[9], and the beacon constraint must
be added to the beacon region[10]. This essentially is telling the app which beacons
to look for. The Major and Minor are optional, but they were used in our case to
differentiate between beacons with our system for differentiating beacons which
was detailed in chapter 3.1.5.
183. Methodology 3.3. RSSI monitoring app
1 // when start scanning works we will get a callback
2 func locationManager(_ manager: CLLocationManager, didRange beacons:
,→ [CLBeacon], satisfying beaconConstraint: CLBeaconIdentityConstraint) {
3 // sets format for date
4 let df = DateFormatter()
5 df.dateFormat = "HH:mm:ss"
6 // with the range of the first beacon found
7 if let beacon = beacons.first {
8 lastDistance = updateDistance(distance: beacon.proximity)
9 // beacon major & minor, just used for additional identification if
,→ explicit major minor wasnt previously given.
10 major = CLBeaconMajorValue(truncating: beacon.major)
11 minor = CLBeaconMinorValue(truncating: beacon.minor)
12 // print the rssi into console, this can be copied into a file when
,→ you're done to read whatever information you want to have.
13 print(beacon.rssi)
14 // to make the app more readable information only updates when
,→ beacon was successfuly contacted
15 if beacon.proximity != .unknown {
16 lastSeen = df.string(from: beacon.timestamp)
17 rssi = beacon.rssi
18 //
,→ https://developer.apple.com/documentation/corelocation/clbeacon/1621551-accuracy
19 accuracy = beacon.accuracy
20 rssiDistance = calcDistanceRSSI(rssi: beacon.rssi)
21 }
22 }
23 }
Figure 3.9: Line 61-83 in ibeacon distance measure/ContentView.swift
Figure 3.9 shows what happens when a beacon is found. The if on line 7
will take the first beacon that is found and connect to it to read information from
it.
The information read from the beacon is the proximity on line 8. The Major
and Minor on line 10-11 which was used to confirm that the beacon the app found,
was the same one as expected based on the filters from figure 3.8. line 13 will
print the RSSI, this part of the code is detailed further in chapter 3.3.2.
The if statement on line 15 is only relevant for what is displayed on the
phone. It was put behind the if statement to try to improve the readability of
the information on the phone. If the beacon couldn’t be read momentarily, the
values wouldn’t all jump to 0.
The full source code can be found in Appendix A.
3.3.2 Collecting the RSSI measurements
The testing for RSSI values was done in 2 different environments for 6 different
distances, each distance double the previous. The distances were 1, 2, 4, 8, 16
and 32 metres. The locations used for indoor testing, was the East hallway on the
4th floor of the KE building at the university, shown in figure 3.10. The outdoor
testing was done in an outdoor football field.
193. Methodology 3.3. RSSI monitoring app
Figure 3.10: The hallway used for indoor RSSI measuring marked in red. Note:
This image is flipped 90 degress counter clockwise so North is to the left.
To get the RSSI values the print statement from figure 3.9 on line 13 becomes
important. This would print the RSSI values as measured by the phone into the
debug output, as shown in figure 3.11. Each distance would be measured for 2
minutes doing 1 beacon at the time.
Figure 3.11: RSSI readings being measured can be seen in the bottom right of
this figure. Note the preview window in the middle right does not show a live
preview of the phone screen, it there to show the layout of the UI.
203. Methodology 3.4. Indoor Mapping Service
3.4 Indoor Mapping Service
We chose to use IndoorAtlas as our service to test indoor positioning. This was
because they support integration with Mazemap, which the university currently
uses as their indoor mapping provider. All testing of how good the location accuracy
was before any beacons were installed and fingerprinting had been done were
done using Mazemap. Testing after beacon installation and fingerprinting was
done using the testing functionality of the IndoorAtlas map creator, and their
positioning test app for iOS due to the map creator not being available on any
other platform than Android.
3.4.1 Test map
We did 3 separate test runs to determine the positioning accuracy, the first run
was done before any installation. The second was done installing 8 beacons in
various locations on the 4th floor of the KE building, and third test was done
with 12 beacons installed in various locations. This was to see how much the
accuracy would improve with a more dense beacon map.
For each of the separate test location, stood we still for 10 seconds, while
screen recording the map app to see where the Blue Dot were. The distance that
the Blue Dot has to our actual location, would be measured afterwards using a
cad model of the building. Due to the inaccuracy of this method, a margin of
error off about 0.5-1m should be applied to all results. A map of all the testing
points can be seen in figure 3.12. Whenever a test location is referenced, the letters
from this figure will be used.
Figure 3.12: Map of where location accuracy was tested in the 4th floor of the KE
building rotated 90 degress counter clockwise (north is to the left)
213. Methodology 3.4. Indoor Mapping Service
3.4.2 Layout of the Beacons
Beacons were installed in 2 different configurations. 1 medium density configuration
and 1 high density configuration. The medium density configuration used 7 ESP32’s
and 1 iBKS105, while the high density configuration used 7 ESP32’s and 5 iBKS105’s.
This were all the beacons we had.
The beacon maps can be seen in figure 3.13 and 3.14. The medium density
map was based on the idea of getting a basic coverage map of the 4th floor to do
basic testing with. Based on the results of this test, some beacons were moved
and others were added to try to fix some of the areas that didn’t have as good
location accuracy.
Figure 3.13: The medium density beacon map, where beacons are placed near
corners and door to hallways to ensure coverage in important places
223. Methodology 3.4. Indoor Mapping Service
Figure 3.14: The high density beacon map where beacons are placed in the
middle of long corridors, and more doorways are covered.
3.4.3 Creating the map in IndoorAtlas
When creating a map in IndoorAtlas, first you must create a venue[12]. This is
the building that you are going to be adding floors to. Once the venue has been
created you must then add floor plans to it[2]. These floor plans are an image
which must be aligned over a satellite image of the address of the venue, and it
must be defined what floor the floor plan belongs to.
Once the floor plan has been created, Waypoints must be added to it. These
are essentially virtual checkpoints to walk between when fingerprinting. We put
a Waypoint in each of the testing locations from figure 3.12. Once this has been
done, an Android phone which is supported by Google ARCore[4], can be used
together with the IndoorAtlas MapCreator 2 to start fingerprinting. When this
is being done, it is important to already have any beacons that are going to be
used set up. The fingerprinting should automatically detect the beacons when
you walk between checkpoints, and then be able to use the beacons to assist with
indoor positioning.
In our case we walked between each Waypoint twice. Once in each direction
to make the calibration as accurate as possible. The phone was always held in the
same way, and we tried to maintain a consistent walking speed too.
3.4.4 Recording the data
The process of recording the data, to measure the accuracy of the positioning,
was to use the screen recording feature built into iOS and the Android skin that
the Huawei Mate 10 Lite uses. For each location marked in figure 3.12, we would
attempt to stand approximately in the exact same spot each time for a bit over
10 seconds. The spots were marked by physical features in the area. This method
likely meant there was a margin of about 1 metre. Additionally, people in the
233. Methodology 3.4. Indoor Mapping Service
surrounding area could be present during a test, and not during another. This
could’ve affect the results the same way as it would in the RSSI measuring tests.
The app’s used were Mazemap in browser as ’before’ testing, meaning before
any beacon’s were installed. This was to get the most accurate possible impression
of how the positioning accuracy was before any improvements were implemented.
To test after beacon installation, the IndoorAtlas Positioning app was used on
iOS, while the IndoorAtlas MapCreator 2 was used to test on Android.
The recordings would be loaded up on to a computer, and played back using
software which allows skipping forwards or backwards through time exactly 1
second. In this case, that software was VLC media player. The setting required
to replicate this method can be seen in figure 3.15.
Figure 3.15: The setting required to do 1 second jumps through a recording
played back in VLC. Make sure to set ’Very short jump length’ from the default
value of 3 to 1, and search ’very short’ to find what the default key-bind is for
your system.
For each recording, we would skip through it 1 second at the time. Then
using CAD drawings of the university, we would measure the distance from where
we were standing, to the center of the BlueDot. We tried to align it using features
of the area, such as walls of other rooms if the dot was in the middle of a room
for example.
An example of the process can be seen in figure 3.16. This figure is showing
the 4th and 5th measurement taken when testing with a high beacon density
on iOS at location A. It can be seen how the BlueDot has moved slightly down
between these 2 frames, and that can also be seen in the data shown in chapter
4.2.2. This was how the measurements would be taken. Go through the video 1
second at the time for 10 seconds. If the BlueDot moved, the distance the BlueDot
has from the location we were standing would be measured.
243. Methodology 3.4. Indoor Mapping Service
(a) Sample #4 (b) Sample #5
Figure 3.16: shows 2 different samples from the recording used to measure the
data for high beacon density on iOS at test spot A
254. Results 4.1. RSSI Measuring app results
4 Results
4.1 RSSI Measuring app results
In this chapter we will analyse the RSSI measurements between the iBKS 105
and the ESP32 beacons, both indoors and outdoors. First they will be analysed
individually and then compared against each other.
4.1.1 iBKS 105 Results
Starting with the iBKS 105, we will look at the raw measuring results in figure
4.1. Looking at these scatter plots its rather obvious how noisy RSSI can be.
Some of this noise is inherent, however, it can also be seen how the figure showing
the RSSI measurements outdoors is significantly less noisy. Although that one
also has some unexpected aspects to it.
First of all, something which is immediately noticeable is how some of the
medians are in the wrong order to what was expected. It is expected for the RSSI
to decrease as the distance increases, but this was not the case after studying
the data we collected. The 2m median on the indoor test is higher than the 1m
median, and the 4m median is also higher than the 1m median. Although it at
least managed to be lower than the 2m median. These distances are so close to
each other that it could be argued that it doesn’t matter so much if they get
mixed up. But then if we look at the results for 16m and 8m, we see that these
have also gotten mixed up. This would seem extremely unexpected except as will
be seen later, RSSI does not decrease linearly. So the chance to get the further
distances wrong in a perfect environment, is more likely than getting the close
distances wrong.
Looking at figure 4.1b, which shows the outside measurements of the iBKS
105, the results are closer to what is expected. The reduction in signal noise either
created by reflective surfaces or by devices in the surroundings, which are all
fighting over the same Bluetooth frequency, has created a much cleaner scanner
plot. Where the 1m and 2m results are closer to what is expected. What can
also be seen is that as described previously the gap between the median RSSI
decreases as the distance increases.
264. Results 4.1. RSSI Measuring app results
−50
1m median 1m 2m median 2m 4m median 4m
8m median 8m 16m median 16m 32m median 32m
RSSI(db) −60
−70
−80
−90
0 10 20 30 40 50 60 70 80 90 100 110 120
Time(seconds)
(a) iBKS 105 indoors
−50
1m median 1m 2m median 2m 4m median 4m
8m median 8m 16m median 16m 32m median 32m
−60
RSSI(db)
−70
−80
−90
0 10 20 30 40 50 60 70 80 90 100 110 120
Time(seconds)
(b) iBKS 105 outdoors
Figure 4.1: 2 figures showing the iBKS 105 RSSI measurements over the 2 minute
testing periods, including the median of each test distance.
Figure 4.2 is a result of using the same data from figure 4.1 and plotting it
in a box plot. This reveals something which was not visible in the scatter plot.
At 32m the box extends all the way up to 0db. This is because when the beacons
RSSI could not be determined, it will be read as 0. This means that for a large
amount of the 2 minute test, the iBKS 105 beacon could not be read, meaning
that if this would happen again in a real world scenario, the beacon would almost
give no assistance to positioning accuracy if a person was standing 32m away
from it.
274. Results 4.1. RSSI Measuring app results
0
−20
RSSI(db)
−40
−60
−80
1m 2m 4m 8m 16m 32m
in/out in/out in/out in/out in/out in/out
Figure 4.2: Comparison of RSSI measured on the iBKS 105 indoors and outdoors
Another thing that can be seen when looking at the data in the box plot,
are the blue boxes for the outdoor readings. As the distance increases the RSSI
values flatten out. This shows more clearly what was mentioned previously about
RSSI not being fully linear. As the distance increases, the RSSI readings will
relatively speaking come closer together.
Overall the interquartile range for each box plot in the outdoor measurements
is smaller than the one for the indoor measurements. The upper and lower whiskers
also don’t extend as far out from the interquartile range, which again shows that
the overall inconsistency of the readings were lower when measuring in the outdoor
environment, though not always so. The plot for 16m indoors appears to be slightly
smaller than the one for 16m outdoors. So sometimes indoors readings can be
quite consistent, but not always.
4.1.2 ESP32 Results
Looking at the raw RSSI measurements for the ESP32 in figure 4.3 a lot of the
same themes as from chapter 4.1.1 can be seen. In the indoor test it managed
to get the order of the medians correct, which is good although the measurements
for 16m seem to have jumped from higher than expected to a bit lower than expected,
while keeping the overall median mostly as expected. This is likely due to the
fact that when testing, we were not the only people in the area. If anyone were to
walk past with Bluetooth headphones this could create noise in the environment,
which in return could affects the results. This would seem like a negative thing,
but this is exactly what would happen in the real world, and that’s what the
indoor plot shows more than anything. It shows how the RSSI readings would
look like in the real world. Inside of a building where there are lots of devices
fighting over a small frequency range, and there are lots of reflective surfaces that
can also add noise.
284. Results 4.1. RSSI Measuring app results
−40
1m median 1m 2m median 2m 4m median 4m
8m median 8m 16m median 16m 32m median 32m
−50
−60
RSSI(db)
−70
−80
−90
0 10 20 30 40 50 60 70 80 90 100 110 120
Time(seconds)
(a) ESP32 indoors
−40
1m median 1m 2m median 2m 4m median 4m
8m median 8m 16m median 16m 32m median 32m
−50
−60
RSSI(db)
−70
−80
−90
0 10 20 30 40 50 60 70 80 90 100 110 120
Time(seconds)
(b) ESP32 outdoors
Figure 4.3: 2 figures showing the ESP32 RSSI measurements over the 2 minute
testing periods, including the median of each test distance.
Looking at the outdoor results in figure 4.3b, unexpectedly, they appear to
be worse than the indoor results. The difference between each distance is smaller,
and the measurements have a lot more overlap. The reason for this could be relative,
due to the inconsistencies of doing a more ’real world’ style test for the indoor
results. The ESP32 could also have been ’lucky’, and that the test were done at
a time where there was relatively little signal noise in the environment. However,
this would still not explain why the outdoor measurements are so poor.
294. Results 4.1. RSSI Measuring app results
0
−20
RSSI(db)
−40
−60
−80
1m 2m 4m 8m 16m 32m
in/out in/out in/out in/out in/out in/out
Figure 4.4: Comparison of RSSI measured indoors and outdoors
Putting the measurements from figure 4.3 into a box plot, we end up with
figure 4.4. This one again shows the unexpected fact that the indoor measurements
have turned out better than the outdoor ones. In fact, the outdoor 32m test couldn’t
establish the RSSI for a large amount of the test. Overall except for the 16m
test, the measurements were relative consistent and stayed within a small range.
Although the results for 1m, 2m, 4m, and 8m are closer than expected.
4.1.3 Comparison between the iBKS105 and ESP32
Comparisons of the iBKS 105 and the ESP32 can be seen in figure 4.5. For the
indoor tests in figure 4.5a, it can be seen that overall both beacons performed
very similarly. As mentioned previously, the ESP32’s results were good in the
indoor environment which can be seen in figure 4.5a. But when looking at figure
4.5b, the ESP32 relatively to the iBKS 105 looks the same as the iBKS 105 looks
to the ESP32 in the indoor test.
Regardless of the strange switch around of their relative performance indoors
and outdoors, the ESP32 in terms of RSSI performs extremely similarly to the
iBKS 105. While it could be argued that the outdoor measurements are a more
’true’ representation due to it being a more controlled environment. The thing
that actually matters is how they perform in the real world, which would be inside.
In short conclusion, the iBKS 105 and ESP32 perform so similarly that in terms
of signal performance we’re calling them identical.
304. Results 4.1. RSSI Measuring app results
0
−20
RSSI(db)
−40
−60
−80
1m 2m 4m 8m 16m 32m
iBKS105 iBKS105 iBKS105 iBKS105 iBKS105 iBKS105
ESP32 ESP32 ESP32 ESP32 ESP32 ESP32
(a) Indoors
0
−20
RSSI(db)
−40
−60
−80
1m 2m 4m 8m 16m 32m
iBKS105 iBKS105 iBKS105 iBKS105 iBKS105 iBKS105
ESP32 ESP32 ESP32 ESP32 ESP32 ESP32
(b) Outdoors
Figure 4.5: iBKS 105 vs ESP32 RSSI measurement comparison indoors and
outdoors
314. Results 4.2. Indoor positioning accuracy
4.2 Indoor positioning accuracy
In this chapter we will analyse the inaccuracy of no beacons, medium beacon
density and high beacon density on Android and iOS. Each platform is split into
it’s own sub chapter to avoid comparison, because the purpose is not to compare
these 2 platforms.
4.2.1 Indoor accuracy results on Android between no beacons, medium
density and high density beacon placement
Starting with Android, we will look at the raw location measurements in figure
4.6 below:
40 40
Inaccuracy (metres)
Inaccuracy (metres)
30 30
20 20
10 10
0 0
0 2 4 6 8 0 2 4 6 8
sample # sample #
(a) No beacons (b) Medium beacon density
40
A B
Inaccuracy (metres)
C D
30 E F
G H
20
10
0
0 2 4 6 8
sample #
(c) High beacon density
Figure 4.6: 3 figures showing the inaccuracy measured at each testing point for 10
seconds, where 1 sample represents 1 second. Note: The same legend applies to
all 3 figures.
In figure 4.6 we see in all 3 sub figures that some locations, like location G
for example, is consistently more inaccurate than others. Like location A which
consistently performs relatively good regardless of the beacon setup. It can also
be seen that setting up beacons and mapping the area, doesn’t always guarantee
a better result. Location G for example, is stuck at a 39m inaccuracy for the
entire 10 second test. Location D is stuck in a similar way, where it consistently
for the entire duration of the test, is placing the BlueDot incorrectly, as can be
seen in 4.6b and 4.6c. This could be due to a calibration error when fingerprinting
324. Results 4.2. Indoor positioning accuracy
or due to a loss of signal. Though over all, it is clear that as the number of beacons
increases, the inaccuracy decreases. Which can be seen by the number of plots
that are bunching together near the bottom on the Y-axis in 4.6b, and even more
so in 4.6c.
Taking the data from figure 4.6 and using it in a table, we end up with table
4.6. It should be noted due to the inaccuracies of the testing methods used, all
values have been rounded up to the nearest half a metre.
point x̄ x̃ s point x̄ x̃ s
A 7 7 0.5 A 4 4 0.5
B 2 1 1 B 4 4 0
C 15 15 0.5 C 1.5 1 1
D 7 7 0 D 12 12 0
E 6.5 5.5 3.5 E 4.5 4.5 1.5
F 9.5 9.5 0 F 9 9 0.5
G 26 26 8.5 G 39 39 0
H 8 6 5.5 H 1.5 1.5 0
total 10 7 2.5 total 9.5 4.5 0.5
(a) No beacons (b) Medium beacon density
point x̄ x̃ s
A 2 2 0
B 5.5 6 1
C 1.5 1.5 0
D 17 17 0.5
E 6.5 6.5 0
F 5.5 5.5 1
G 22 22.5 1
H 2 2.5 0.5
total 8 5.5 0.5
(c) High beacon density
Table 4.1: 3 tables showing the mean, median and standard deviation of the
measured inaccuracy at each testing point. The total average is the average of
all averages, median is the median of all the medians, and the total standard
deviation is the average of all the standard deviations.
Table 4.1 shows in numbers what was previously discussed concerning figure
4.6. Exactly as could be seen previously, location G struggles quite badly with
its accuracy in the medium density beacon setup. It can also be seen that the
accuracy becomes slightly better in the high beacon density setup, and that the
standard deviation isn’t 0. This would imply that at least part of the issue in
the medium density setup is a lack of Wi-Fi reception, causing the BlueDot to
be unable to move. Although, it’s still quite far off so the fingerprinting getting it
33You can also read