A Distance-Adaptive Refueling Recommendation Algorithm for Self-Driving Travel - MDPI
←
→
Page content transcription
If your browser does not render page correctly, please read the page content below
International Journal of
           Geo-Information

Article
A Distance-Adaptive Refueling Recommendation
Algorithm for Self-Driving Travel
Quanli Xu 1,2, *, Kun Yang 2,3, *, Shuangyun Peng 1,2 and Liang Hong 1,2
 1    School of Tourism and Geographic Science, Yunnan Normal University, Kunming 650500, China;
      frankmei@126.com (S.P.); hongliang20433@hotmail.com (L.H.)
 2    GIS Technology Engineering Research Centre for West-China Resources and Environment of Educational
      Ministry, Kunming 650500, China
 3    School of Information Science, Yunnan Normal University, Kunming 650500, China
 *    Correspondence: go2happiness@163.com(Q.X.); kmdcynu@163.com (K.Y.);
      Tel.: +86-0871-6594-1255 (Q.X. & K.Y.)

 Received: 12 December 2017; Accepted: 7 March 2018; Published: 12 March 2018

 Abstract: Taking the maximum vehicle driving distance, the distances from gas stations, the route
 length, and the number of refueling gas stations as the decision conditions, recommendation rules
 and an early refueling service warning mechanism for gas stations along a self-driving travel route
 were constructed by using the algorithm presented in this research, based on the spatial clustering
 characteristics of gas stations and the urgency of refueling. Meanwhile, by combining ArcEngine and
 Matlab capabilities, a scenario simulation system of refueling for self-driving travel was developed
 by using c#.net in order to validate and test the accuracy and applicability of the algorithm. A total of
 nine testing schemes with four simulation scenarios were designed and executed using this algorithm,
 and all of the simulation results were consistent with expectations. The refueling recommendation
 algorithm proposed in this study can automatically adapt to changes in the route length of self-driving
 travel, the maximum driving distance of the vehicle, and the distance from gas stations, which could
 provide variable refueling recommendation strategies according to differing gas station layouts along
 the route. Therefore, the results of this study could provide a scientific reference for the reasonable
 planning and timely supply of vehicle refueling during self-driving travel.

 Keywords: intelligent transportation; recommendation algorithm; distance adaptive; spatial cluster;
 K-Means; refueling; APP

1. Introduction

1.1. Motivation
     Self-driving travel is a kind of independent travel that is an organized and planned form of
tourism based on the primary transportation means of driving oneself [1]; at present, self-driving
travel has become the most popular travel form in the world, as well as a family gathering pattern [2].
This prevalence of self-driving travel has not only brought vitality and prosperity to the global tourism
market but has also placed higher demands on the infrastructure and management services that
support self-driving travel; in particular, the challenge of refueling a vast number of self-driving
vehicles is one of the issues gas station owners and drivers focus on. Stories of vehicles breaking down
on the road due to fuel exhaustion have been reported [3]. Some such vehicles have caused traffic
accidents [4], and Saarinen’s study also revealed an increase in drivers who ran out of fuel on the
roadside in Great Britain in 2014 [5]. Although it is feasible to solve the embarrassing situation of fuel
exhaustion during travel by road rescue and other means, no self-driving traveler wishes to experience
such an accident. This indicates that timely refueling on the road is one of the most fundamental

ISPRS Int. J. Geo-Inf. 2018, 7, 94; doi:10.3390/ijgi7030094                      www.mdpi.com/journal/ijgi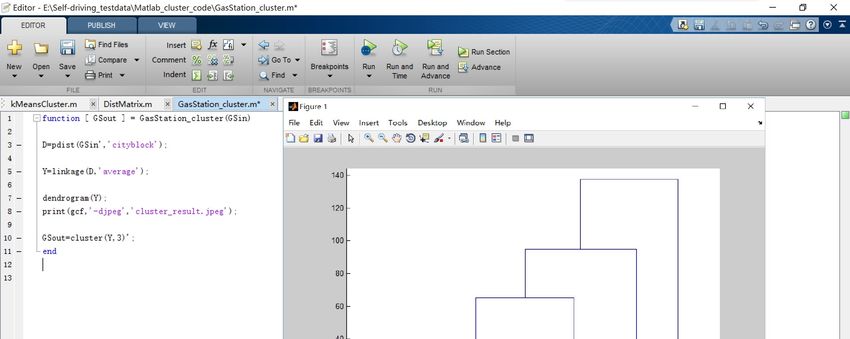
ISPRS Int. J. Geo-Inf. 2018, 7, 94                                                                    2 of 23

guarantees for the safety of self-driving travel [2]. Currently, the vehicle refueling strategy is judged
and executed mainly by relying on the driver’s experiences during self-driving travel [6,7]; although
this kind of “experience refueling” method is feasible, it still has the following obvious defects.
      First, the “experience refueling” method requires the driver to be familiar with the conditions
of the road and the self-driving vehicle, so that the driver can determine where and when to refuel.
However, in most cases, the drivers in self-driving travel are not always familiar with the road
conditions or even the vehicle condition (for example, when renting a car), which often causes
excessive or insufficient refueling [8]. Second, the “experience refueling” method requires the driver
to put considerable effort into the calculation and judgment of refueling, which may increase the
risk of fatigue driving and is not conducive to driving safety [9]. Finally, self-driving travel has been
characterized by freedom, individuality, and mavericks since its appearance. In order to pursue this
travel experience, some self-driving tourists tend to avoid the traditional tourist route and visit more
obscure tourist destinations, which generally feature fewer tourists, less modern tourism services and
infrastructure, fewer gas stations, and inconsistent oil quality; consequently, the timely replenishment
of standard fuel can be difficult after entering such scenic areas [10].
      In conclusion, “experience refueling” is a common method for self-driving vehicles to refuel
on the road, but this method also has some disadvantages: the timing of refueling cannot easily be
accurately controlled, tourists’ energy is wasted, driving costs are increased, driving safety is adversely
affected, and the pleasure of self-driving travel is reduced. Therefore, how to judiciously plan vehicle
refueling according to the travel schedule to improve the safety of self-driving travel is an important
scientific problem worthy of further study. Being motivated by the refueling problem in self-driving
travel, we proposed this study in order to solve that very problem. Considering parameters including
the number of refueling gas stations, the maximum driving distance of the vehicle, the distances
between gas stations, the route length, and other distance variables, and based on the spatial clustering
characteristics of gas stations along the route and the urgency of refueling, the algorithm constructed
recommendation rules and a refueling service warning mechanism, which could provide humanized
intelligent refueling strategies for the driver so that he would not be distracted by the refueling problem.
The results of this study could fundamentally remedy the deficiencies of “experience refueling” and
finally achieve the objective of improving the safety and quality of self-driving travel.

1.2. Literature Review
     At present, the vehicle refueling problem has led to several research areas, including the following
fields: (1) the green vehicle route problem from a low carbon perspective (GVRP), (2) the location
problem of gas stations, (3) scheduling of mobile refueling and recharging facilities, and (4) the refueling
optimization problem, among others. Field (1) mainly studies the vehicle routing optimization problem
as determined according to the minimum driving distance, the shortest driving time, and the fewest
dispatched vehicles, and as an extension of traditional VRP research, GVRP focuses on the vehicle
routing optimization problem as determined according to the lowest overall oil consumption while
driving [11]. The core issue in this field is how to establish the objective function of energy consumption
and optimally solve it: for example, Jabbarpour [12] and Kwon [13] studied a multiple-variable GVRP
computational model, as well as model solution methods based on the ant colony optimization
algorithm and tabu search algorithm. In addition, some researchers took vehicle fuel supply demand
as a constraint to solve the vehicle routing problem, forming the Fuel-Constrained Vehicle Routing
Problem (FCVRP). For instance, Montoya [14] studied the influence of nonlinear charging time on the
route planning of electric vehicles; Sundar [15] studied path planning algorithms for small Unmanned
Aerial Vehicles (UAVs) with resource constraints; and Bruglieri [16] examined how to optimally route
Electric Vehicles (EVs) to handle a set of customers in a given time considering recharging needs
during trips. The research content in reference [17] was similar to that in reference [15], but the
objective function and decision variables in reference [17] were more complex, addressing a multiple
depot, multiple unmanned vehicle routing problem with fuel constraints. Field (2) mainly studies the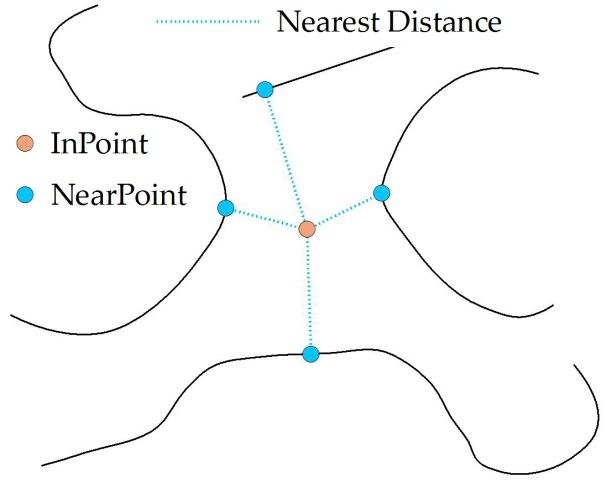
ISPRS Int. J. Geo-Inf. 2018, 7, 94                                                                   3 of 23

reasonable location problem of gas stations, the core of which is the construction and evaluation of gas
station location models, which are typically analyzed and evaluated based on Geography Information
System (GIS) spatial analysis and the actual demand for vehicle refueling [18]. For example, based
on different route choices and traveling conditions, Hosseini [19] and Miralinaghi [20] studied the
construction methods of a gas station location model, as well as its heuristic algorithm, and finally
showed that GIS spatial analysis can be used to scientifically optimize the location of gas stations.
In Field (3), the major research is concerned with scientific scheduling and routing optimization for
mobile refueling facilities, such as airport tankers, space refueling aircraft, etc. For example, Heng [21]
and Feng [22] studied a scheduling optimization model and found solutions for an airport tanker
based on planning time windows and genetic algorithms.
      The vehicle refueling problem we are examining here and the areas of study of the above three
fields intersect in part, but there are also some obvious differences in research objective, content, and
methods, which are mainly reflected in the following aspects: (1) First, the GVRP or FCVRP problem
is aimed at optimizing total oil consumption and does not consider how to refuel along the way;
however, refueling en route is the core research content of this study, i.e., where and when the vehicle
“can”, “needs to”, and “must” refuel during travel. (2) Second, the location of gas stations is considered
when planning gas station construction. In this case, more consideration is given to optimizing the
spatial layout of gas stations, and the main object of the research is gas stations themselves rather
than vehicles that need refueling. However, the research subjects of the present study are self-driving
vehicles and their refueling environment (the driving route, the number of gas stations, and the layout
of gas stations along the route), focusing on the scientific planning problem of refueling during travel
based on GIS spatial calculations and spatial analysis. (3) Third, the research subjects of the scientific
scheduling problem for mobile refueling facilities are mobile; however, the refueling facilities in the
present study are gas stations, which are immobile.
      Field (4) mainly studies the decision-making model and intelligent management of vehicle
refueling, and the correlation between Field (4) and this study may be the closest among the above
four fields. Studies have shown that rational planning of the refueling process can help reduce fuel
costs; for example, U.S. truckload (TL) carriers developed a software program called “Fuel optimizers”
for fuel cost management, which reduces the fuel cost of motor carriers at the “point of purchase”
by way of an optimization algorithm [23]. However, Suzuki has argued that these products upset
many truck drivers by “confiscating” their freedom to choose truck stops. Then, a decision support
system was developed, which reduced the fuel cost of motor carriers at the point of purchase without
confiscating the drivers’ freedom to choose truck stops, so that higher driver compliance rates were
expected [23–27]. Also, Lin [28] considered the fixed-route vehicle refueling problem, similar to that
addressed by commercial fuel optimizers, and developed a linear-time greedy algorithm for finding
optimal fueling policies. Nicholas et al. [29] studied whether the refueling of AFVs (Alternative Fuel
Vehicles) could be informed by refueling experiences from the traditional petrochemical refueling
network. Kuby [30] and Kelly [31] systematically studied the differences in refueling behavior between
liquid fossil fuel vehicles and alternative fuel vehicles and proposed a decision model of AFV refueling
according to actual refueling data for Alternative Fuel Vehicles in Southern California. As seen from
the above references, the existing refueling decision models have mainly studied the problem of how to
plan the refueling route to save fuel costs, optimizing the economy of refueling by using mathematical
modeling and other methods, which has been very useful for guiding people to save more in fuel costs.
However, these decision and optimization models might also deprive drivers of the choice freedom of
“where to refuel”: not only are the mathematical formulas used in these models often comparatively
complex, but the refueling recommendations are difficult to understand during the actual refueling
process, and therefore the models’ decision-making effectiveness is far from satisfactory.
      To sum up, the refueling decision-making model for moving vehicles is still a scientific problem
worthy of current study in the field of intelligent transportation. Thus, taking vehicle refueling with
traditional liquid fossil fuels as an example, a distance-adaptive refueling recommendation algorithm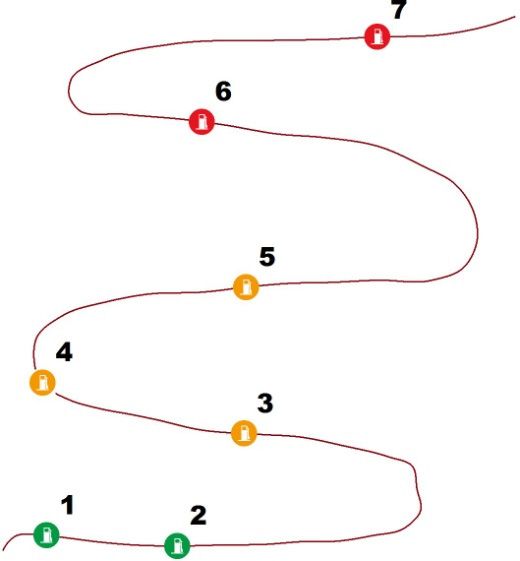
ISPRS Int. J. Geo-Inf. 2018, 7, 94                                                                      4 of 23

for self-driving travel was put forward in this study in order to assist in refueling decision-making for
moving vehicles. Utilizing the strong geo-computation ability of GIS, this refueling recommendation
algorithm calculated various distance variables affecting the refueling behavior of moving vehicles,
and an optimized spatial clustering algorithm was used to calculate the refueling priority at gas
stations along the route; finally, the refueling recommendation results were visualized based on
the rich mapping function of GIS to verify the practicability and effectiveness of the algorithm.
Although the work we did may be relatively simple, we propose that our study may be quite
helpful for self-driving drivers to make reasonable choices about the timing and location of refueling.
The expectation of this study is that our work and results can promote the intersection and integration
of intelligent transportation and GIS, as well as other geospatial sciences, and can also provide a
theoretical foundation and feasible technical means for rational refueling of and automatic warnings
in self-driving vehicles.

2. Materials and Methods

2.1. Algorithm Description
      The refueling problem in self-driving travel can be described as follows: how does one determine
when and where to refuel according to the travel route and the layout of gas stations along the way?
This is actually a refueling strategy optimization problem, which is described in Figure 1 and can be
summarized as follows: (1) the closer the vehicle runs to the maximum driving distance, the more
it needs to be refueled; (2) the more gas stations along the route from the starting position to the
maximum distance, the stronger the refueling ability. Therefore, the number of gas stations, the relative
positions of the vehicle and gas stations, and the relative distance variables are the key conditions for
solving the refueling problem in this study. In particular, we use three distance variables, two distance
differences, and two counters of gas stations along the route [32]. Among them, the three key distance
variables are the maximum driving distance of the vehicle (Dto_maxdriving ), the route length (Droute ),
and the distance from the starting point to a given gas station (Dto_node ); all of the distances used in this
study are curve distances obtained by driving from the starting point (Pstart ) along the traveling route.
The two distance differences are the difference between the maximum driving distance of the vehicle
and the route length (∆Dmaxdriving_route ) and the difference between the maximum driving distance of
                                                                           i
the vehicle and the distance from every gas station along the way (∆Dmaxdriving_to_node      , i represents the
ith gas station). The two counters of gas stations are the total number of gas stations along the traveling
route (Ngas_stations ) and the total number of refueling gas stations within the maximum driving distance
of the vehicle (Nused_gasstations ).
      According to the diagram illustration of the refueling recommendation problem described
above (Figure 1), a distance-adaptive refueling recommendation algorithm for self-driving travel
was developed for this study; the algorithm flowchart is shown in Figure 2.
      The main steps and explanation of the algorithm are as follows:
      Step 1: The three key distance variables and the number of gas stations along the route Ngas_stations
are calculated.
      Step 2: The first distance difference ∆Dmaxdriving_route is calculated by using the distance variable.
      Step 3: If ∆Dmaxdriving_route > 0, then Strategy 1 is recommended (see Table 1 for details); otherwise,
go to Step 4. In Strategy 1, the remaining fuel is sufficient for the vehicle to complete travel from this
point, and no refueling is required along the route.
      Step 4: If Ngas_stations = 0, then Strategy 2 is recommended; otherwise, go to Step 5. In Strategy 2,
the remaining fuel is insufficient for the vehicle to reach the nearest gas station, and hence the driver
should have filled up the gas tank in advance or carried gas with him.
      Step 5: All of the gas stations along the route are traversed, and the second distance difference
∆Dmaxdriving_to_node is calculated by using the distance variable. The ith gas station is located within the
    i

refueling range if ∆Dmaxdriving_to_node
                     i                  > 0, in which case the position and distance difference of the ith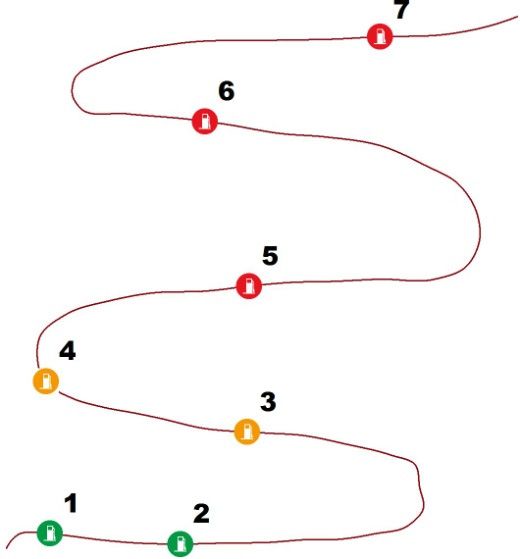
ISPRS Int. J. Geo-Inf. 2018, 7, 94 5 of 23
ISPRS Int. J. Geo-Inf. 2018, 7, x FOR PEER REVIEW 5 of 23
i
refueling
gas station savediftoΔconstruct
arerange node >
Dmaxdriving _ to _ the 0 , in which case the
recommendation rulesposition and distance
of Strategy 3 and difference
Strategy 4;ofmeanwhile,
the ith
gas station
the counter are savedgas
of refueling to construct
stationsthe recommendation
is increased by 1 (Nrules of Strategy 3 and Strategy 4; meanwhile,
used_gasstation ++).
the counter of refueling gas stations is increased
Step 6: If Nused_gasstations ≤ 3, then Strategy 3 is recommended;++). by 1 ( N used _ gasstation otherwise, go to Step 7. In strategy
3, moderateStepfuel N used _ gasstations
6: Ifremains, ≤ 3 , then Strategy
but refueling is needed3 isalong
recommended;
the routeotherwise,to ensurego to Step
that 7. In strategy
the vehicle can reach
3, moderateWhich
the destination. fuel remains,
gas station but refueling
will be is neededfor
chosen along the route
refueling to ensure
depends onthat the vehicle
whether can reach
the number of gas
the destination.
stations is 1, 2, or 3. Which gas station will be chosen for refueling depends on whether the number of
gas stations
Step is 1, 2, orto
7: According 3. the positions of the refueling gas stations and the value of the second
Step 7: According i to the positions of the refueling gas stations and the value of the second
distance difference (∆Dmaxdriving_to_nodei
), clustering analyses of the refueling gas stations are conducted;
distance difference ( ΔD _ node ), clustering analyses of the refueling gas stations are conducted;
refueling service levels formaxdriving each_ togas station can be marked and evaluated based on the clustering
refueling
results, service providing
consequently levels for each gas stationbasis
a calculation can beformarked and evaluated
the construction based on
of Strategy 4. the clustering4, the
In Strategy
results, consequently providing a calculation basis for the construction of Strategy 4. In Strategy 4,
choice of gas stations for refueling depends on the clustering of available gas stations.
the choice of gas stations for refueling depends on the clustering of available gas stations.
Step 8: The recommended strategy for refueling during self-driving travel obtained by the above
Step 8: The recommended strategy for refueling during self-driving travel obtained by the
calculations is displayed
above calculations and counted,
is displayed and the and
and counted, program ends. ends.
the program
Pend
Legend
GS2
Gas station
Max driving location
GS1
Real location
Preal
Destination
Starting location
Dmax_driving DSi Dmax_driving
Distance from Pstart
∆D < 0
∆D > 0
Pstart Self-driving route
Auxiliary line
Figure
Figure 1. Diagram
1. Diagram ofofthe
therefueling
refueling recommendation
recommendation problem.
problem.
Table
Table 1. Recommendation
1. Recommendation rulesand
rules andstrategies
strategies of
of refueling
refuelingfor
forself-driving travel.
self-driving travel.
Value
Determination Condition 1 2 3 4 5 6 7
Value Range
Determination Condition 1 2 3 4 5 6 7
The total number of gas stations Range = 0 T
The total number of gas stations =0 =1 T T
=1 =2 T T
The number of refueling gas stations =2 T
The number of refueling gas stations =3 TT
=3
>3 >3 T T
The distance
The distance from aggregate
from aggregate mileage mileage
>0 >0 T T F F FF
F FF F F
The distance from gas
The distance stations
from gas stations >0 >0 F F TTT
T TT T T
Recommendation strategy Strategy 1
Strategy 2
Strategy Strategy Strategy Strategy Strategy
Strategy 2 Strategy 3
Strategy3 Strategy
Strategy 3 Strategy 4
Strategy
Recommendation strategy
T indicates that the condition must be satisfied, 1F indicates2 that the condition
2 must
3 not be
3 satisfied,3 and a blank
4
indicates that the condition
T indicates does not need
that the condition must to
bebe judged. F indicates that the condition must not be satisfied,
satisfied,
and a blank indicates that the condition does not need to be judged.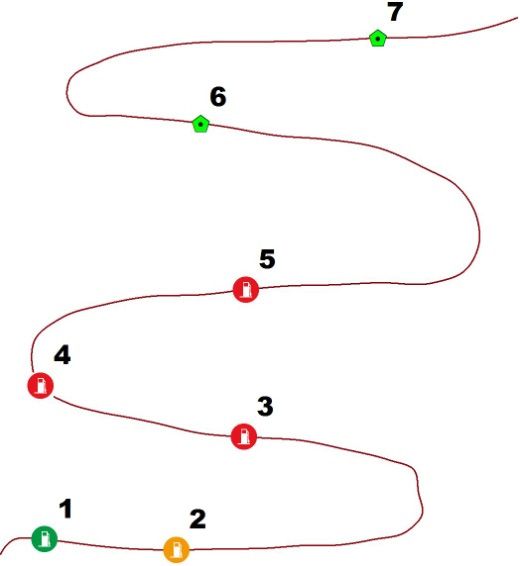
ISPRS Int. J. Geo-Inf. 2018, 7, 94                                                                                   6 of 23
   ISPRS Int. J. Geo-Inf. 2018, 7, x FOR PEER REVIEW                                                       6 of 23

                             Figure 2. Procedure of the refueling recommendation algorithm.
                            Figure 2. Procedure of the refueling recommendation algorithm.
   2.2. Key Decision Variables and Calculation Methods
2.2. Key Decision Variables and Calculation Methods
   2.2.1. Calculation of the Three Distance Variables
2.2.1. Calculation of the Three Distance Variables
          Two methods were used to calculate the maximum driving distance of the vehicle
   ( DTwo     methods
      to _ maxdriving
                      ): one were
                             was manual
                                  used toentry of thethe
                                          calculate   distance;
                                                         maximumthe second wasdistance
                                                                      driving  an estimation
                                                                                       of thebased on (D
                                                                                              vehicle  theto_maxdriving
                                                                                                            fuel        ):
oneconsumption
     was manual   per hundred
                   entry of thekilometers   FC100
                                 distance;(the    ) and was
                                               second   the remaining        G le ft ), on
                                                                       fuel (based
                                                             an estimation              which
                                                                                           the isfuel
                                                                                                   shown  in
                                                                                                      consumption
perFormula
    hundred(1):kilometers (FC100 ) and the remaining fuel (Gle f t ), which is shown in Formula (1):

                                                                          Gle f t
                                                       Dto_maxdriving =                                                 (1)
                                                                          FC100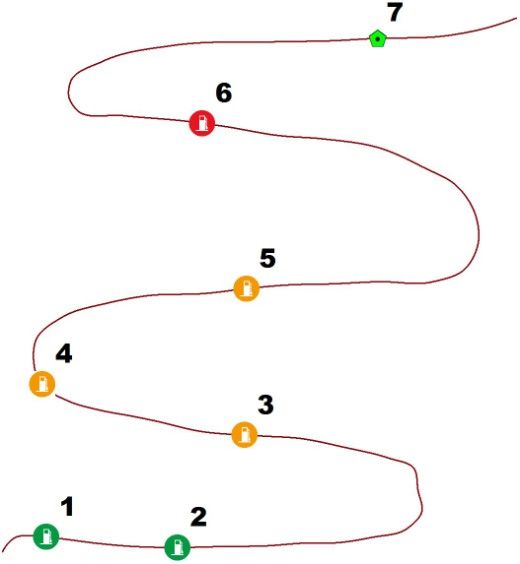
ISPRS Int. J. Geo-Inf. 2018, 7, x FOR PEER REVIEW 7 of 23
ISPRS Int. J. Geo-Inf. 2018, 7, 94 G left 7 of 23
D to _ maxdriving = (1)
FC 100
Mathematically speaking, speaking,there thereisisconsiderable
considerablesimilarity
similarity between
between thethe calculation
calculation method
method of
of the
the route
route length length(Droute( D)route
and ) and
thatthat of distance
of the the distance
fromfrom
the gasthestation
gas station
to thetostarting
the starting
point point
along along the
the route
(D
route ( D),to _which
to_node node
werewere
), which both both
solved by using
solved the arc
by using thelength calculation
arc length method
calculation method[33]. [33].
However,
However, gas
stations in real life are usually located on both sides of the road, and
gas stations in real life are usually located on both sides of the road, and their locations do not their locations do not intersect
with the curve
intersect with the formedcurve byformed
the routebyoftheself-driving travel, so there
route of self-driving are so
travel, some differences
there are somebetween
differencesthe
calculations
between theof the two distances,
calculations anddistances,
of the two the calculative
and theprocess of the process
calculative route distance from the
of the route gas station
distance from
to the starting point is often more complicated. As shown
the gas station to the starting point is often more complicated. As shown in Figure 3, in Figure 3, InPoint represents theInPoint
actual
location
represents of the the actual
gas station,
location NearPoint
of the gas represents the closestrepresents
station, NearPoint position of thethe gas station
closest positiontoofthetheroad,
gas
the
station to the road, the blue dotted line represents the nearest distance between InPointroute
blue dotted line represents the nearest distance between InPoint and NearPoint, and the and
distance
NearPoint, of the andself-driving travel between
the route distance the gas station
of the self-driving andbetween
travel the starting
the gaspoint can be
station andapproximated
the starting
as
point can be approximated as the route length from the closest position (NearPoint) to thetostarting
the route length from the closest position (NearPoint) to the starting point. It is not easy design
algorithms separately to calculate these two distances [34]. Fortunately, many
point. It is not easy to design algorithms separately to calculate these two distances [34]. Fortunately, GIS software programs
now
manyprovide
GIS software calculation methods
programs now for provide
these two distances.methods
calculation For example, Environmental
for these two distances. SystemsFor
Research Institute (ESRI)’s ArcGIS software provides many
example, Environmental Systems Research Institute (ESRI)’s ArcGIS software provides manycomputing tools and functions for curve
distance
computing [35].tools Specifically,
and functionsthe PolyCurve
for curve component
distanceprovided by ESRI ArcEngine
[35]. Specifically, the PolyCurve was used to solve
component
these two by
provided kinds ESRI ofArcEngine
distance calculation
was used problems in this
to solve these twostudy;
kindsthe of PolyCurve OMD (Object
distance calculation problemsModelin
Diagram) used is shown in Figure 4. This component uses the
this study; the PolyCurve OMD (Object Model Diagram) used is shown in Figure 4. This componentICurve interface, and the calculation
methods for the curve
uses the ICurve interface,lengthandand
thethe route distance
calculation methods areforboth
thedefined in this and
curve length interface, according
the route distance to the
are
following function prototype and calling method:
both defined in this interface, according to the following function prototype and calling method:
Droute = Geometry
Droute = Geometry route .get_Length(length)
route .get_Length (length)
Dto_node = DGeometry
to_node = Geometry .QueryPointAndDistance
.QueryPointAndDistance
route route (2)
(2)
(null, (null, InPoint, false, NearPoint,distanceAlongCurve,
distanceAlongCurve, distanceToCurve, false) f alse)
InPoint, f alse, NearPoint, distanceToCurve,
where Geometryroute
where Geometry represents the
route represents the geometric
geometric object
object of
of the
the vector
vector element
element of of the
the self-driving
self-driving route,
route,
distanceAlongCurve represents
length is the return value of the route length, distanceAlongCurve represents the distance
distance from the
input point InPoint (the actual location of the gas station) to the starting starting point (of the the self-driving
self-driving
travel) along
along thetheroute, distanceToCurverepresents
route,distanceToCurve representsthethe
nearest distance
nearest from
distance InPoint
from to the
InPoint to route (the
the route
length of the blue dotted line in Figure 4), and the other parameters are either default
(the length of the blue dotted line in Figure 4), and the other parameters are either default or empty. or empty.
In addition, InPoint overlaps with NearPoint when InPoint InPoint is just on the curve, and the distance
function
function still can work normally and yield the correct Therefore,
still can work normally and yield the correct result. for convenience
result. Therefore, of calculation,
for convenience of
the
calculation, the later test data were designed such that InPoint was on the curve, and thispeople’s
later test data were designed such that InPoint was on the curve, and this did not affect did not
understanding of the fact that gas
affect people’s understanding stations
of the aregas
fact that off the center
stations areline
offin reality.
the center line in reality.
Figure 3.
Figure 3. Relationship between InPoint,
Relationship between InPoint, NearPoint,
NearPoint, and
and Nearest
Nearest Distance.
Distance.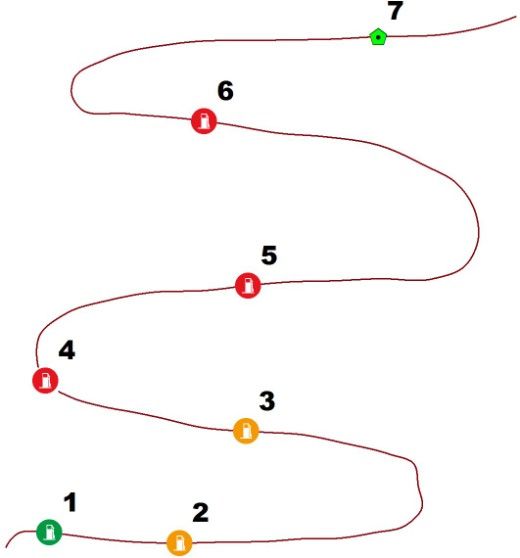
ISPRS Int. J. Geo-Inf. 2018, 7, 94 8 of 23
ISPRS Int. J. Geo-Inf. 2018, 7, x FOR PEER REVIEW 8 of 23
Figure 4. Object Model Diagram (OMD) of PolyCurve component.
Figure 4. Object Model Diagram (OMD) of PolyCurve component.
2.2.2. Calculation of the Two Distance Differences
2.2.2. Calculation of the Two Distance Differences
In order to preserve the direction of the distance difference calculations, the maximum driving
distance
In orderoftothe
preserve D to _direction
vehicle (the maxdriving
) was stored
of the as the subtrahend,
distance and the route the
difference calculations, length ( Droute ) and
maximum driving
the distance
distance from the
of the vehicle (Dgas station to
to_maxdriving the starting
) was stored as point Dto _ node ) were and
the (subtrahend, stored
theasroute
the minuends; the ) and
length (Droute
the distance
calculationfrom
of thethe gas
two station
distance to the starting
differences is shownpoint in Formula(Dto_node (3) )(iwere stored
represents theas
iththe
gasminuends;
station). the
calculation of the two distance differences is shown in Formula (3) (i represents the ith gas station).
ΔDmaxdriving _ route = Dto _ maxdriving − Droute
i (3)
ΔDmaxdriving _ to _ node =
∆Dmaxdriving_route = DDto _ maxdriving − Dto _−
(
to_maxdriving nodeDroute
(3)
∆Dmaxdriving_to_node
i = Dto_maxdriving − Dto_node
2.2.3. Calculation of the Two Counters of Gas Stations
2.2.3. Calculation of the Two Counters of Gas Stations
The calculation method and process for the two counters of refueling gas stations along the
route can be seen in
The calculation Step 1 and
method and Step 5 of the
process for algorithm flow above.
the two counters of refueling gas stations along the route
can be seen in Step 1 and Step 5 of the algorithm flow above.
2.3. Construction of Recommendation Rules and Design of Warning Mechanism
2.3. Construction of Recommendation
It was apparent Rules and Design
from the problem-solving of Warning
principle Mechanism
and the overall process of the algorithm
that the refueling recommendation strategies were closely related to the two distance differences
It was apparent from the problem-solving principle and the overall process of the algorithm
and the two counters of gas stations along the route, so the construction of recommendation rules
that the refueling recommendation strategies were closely related to the two distance differences
needed to comprehensively consider the influences of the above variables on the refueling process.
and In
theaddition,
two counters
because of the
gas gas
stations along
stations thethe
along route,
routesowere
the construction of recommendation
located at different points, it was rules
needed
necessary to rationalize the refueling order according to the location difference, and refueling
to comprehensively consider the influences of the above variables on the the refuelingprocess.
In addition, because the gas stations along the route were located at different
priority needed to be evaluated and marked as well; consequently, a scientific refueling warning points, it was necessary
to rationalize
mechanism the refueling
was formed order
[8]. Theaccording to the location
recommendation rules anddifference,
refuelingand the refueling
warning mechanism priority needed
in this
to bestudy were designed
evaluated and markedbased as onwell;
the consideration
consequently, thatathe recommendation
scientific refuelingstrategy
warning should reflect was
mechanism
the necessity
formed and urgency of refueling
[8]. The recommendation rules andcaused by changes
refueling warningin distance
mechanismand fuel consumption
in this study were during
designed
vehicle operation [36] (Table 1).
based on the consideration that the recommendation strategy should reflect the necessity and urgency
Three refueling warning levels were set in this study, corresponding to three color symbols
of refueling caused by changes in distance and fuel consumption during vehicle operation [36] (Table 1).
(green, orange, and red). The warmer the color, the higher the level of refueling warning, indicating
Three refueling warning levels were set in this study, corresponding to three color symbols (green,
a greater necessity of refueling at that gas station. In order to improve the readability of the
orange, and red). Thestrategy,
recommendation warmerthe the words
color, the higher
“Can”, the level
“Need”, andof“Must”
refueling
werewarning,
used toindicating
represent a greater
the
necessity of refueling at that gas station. In order to improve the
refueling recommendations of the three respective warning levels. Accordingly, four readability of the recommendation
strategy, the words “Can”,
recommendation “Need”,
strategies and “Must”
of refueling were as
were formed used to represent the refueling recommendations
follows:
of the three respective
(1) Strategy warning
1: The levels.
remaining fuelAccordingly, four
is sufficient for the recommendation
vehicle to completestrategies
travel fromofthe refueling
current were
point,
formed as and hence no refueling is required along the route.
follows:
(2) Strategy
(1) Strategy 2: The
1: The remainingfuel
remaining fuelisissufficient
insufficient
forforthe
thevehicle
vehicletoto complete
reach the nearest gas station,
travel from the current
and hence the driver should have filled up
point, and hence no refueling is required along the route. the fuel tank in advance or carried fuel with him.
(2) Strategy 2: The remaining fuel is insufficient for the vehicle to reach the nearest gas station,
and hence the driver should have filled up the fuel tank in advance or carried fuel with him.
(3) Strategy 3: The remaining fuel is moderate at the moment, but refueling is needed along the
route to ensure that the vehicle can reach the destination. At this time, there are no more than three
ISPRS Int. J. Geo-Inf. 2018, 7, 94                                                                     9 of 23

gas stations within the refueling range, and the refueling warning level cannot exceed the default
total number of refueling priority levels (three refueling warning levels of green, orange, and red);
therefore, it is not necessary to classify the refueling warning level of all gas stations that could provide
refueling by using the clustering algorithm. However, when there are fewer than three available gas
stations that could provide refueling, the refueling warning level should be increased with decreasing
opportunity for refueling, indicating that the necessity for refueling at the corresponding gas stations
is also increased. The possible recommendation results are as follows:

•     When Nused_gasstations = 1, there is one and only one refueling gas station along the route, which
      is marked with a red warning.
•     When Nused_gasstations = 2, beginning from the direction of the starting point, the first gas station
      is marked with an orange warning and the second gas station is marked with a red warning.
•     When Nused_gasstations = 3, beginning from the direction of the starting point, the first gas station
      is marked with a green warning, the second gas station is marked with an orange warning, and
      the third gas station is marked with a red warning.

     (4) Strategy 4: Nused_gasstations ≥ 4 at the moment; first, cluster analyses of refueling gas stations
are conducted according to the second distance difference ∆Dmaxdriving_to_node
                                                                    i              , and then the warning
levels of resupply urgency at refueling gas stations are marked based on the classification results.

2.4. Layout Optimization of Refueling Service Based on Cluster Analysis
      Clustering is the process of grouping spatial data objects into a series of meaningful clusters so
that objects within a particular cluster share similarities while being dissimilar to other clusters [37,38].
The most commonly used spatial clustering algorithms are as follows: partitioning methods, such
as K-Means [39]; hierarchical methods, such as CURE (Clustering Using Representatives) [40]; and
density-based methods, such as DBSCAN (Density-based Spatial Clustering of Applications with
Noise) [41]. In fact, no particular clustering method has been shown to be superior to its competitors
with regards to all of the necessary aspects [42]. To date, the advantages and disadvantages of various
algorithms have been extensively analyzed [43–46]. Clustering attributes are the most important
judgment criteria in clustering calculations. For spatial data, clustering attributes generally come
from the characteristics of the sample data, which generally include not only some spatial features
such as position, shape, and size but also some other nonspatial features such as name, quantity
index, evaluation index, etc. [47]. Therefore, the clustering of spatial data tends to be more complex,
considering not only the similarity of spatial relations but also the influences of nonspatial features in
clustering. The distance difference between gas stations was used as a clustering attribute in this study,
which was mainly based on the following ideas: proximal gas stations were similar in their refueling
ability, and could be classified as one category; by contrast, the farther apart the gas stations were, the
more different the refueling effects were, and the less likely the gas stations fell into one category [46].
      Based on the above analyses, considering the diversity and convenience of clustering attributes in
distance calculations, a hierarchical clustering algorithm was chosen as the clustering analysis tool
in this study. Meanwhile, in the test section of this paper, the clustering effects of the hierarchical
clustering algorithm and K-Means clustering algorithm were compared to verify the performance of
the selected clustering algorithm. The spatial clustering steps for calculating the gas station layout by
using the hierarchical clustering algorithm were as follows:
      (1) Cluster attribute evaluation. Take ∆Dmaxdriving_to_node
                                                 i                as a cluster attribute.
      (2) Calculate the two–two distance matrix. The form of the two–two distance matrix is shown
in Table 2, where Dij indicates the relative distance between gas stations. Because the clustering
attribute itself is an actual distance value, “absolute distance” was used to calculate the value of Dij ,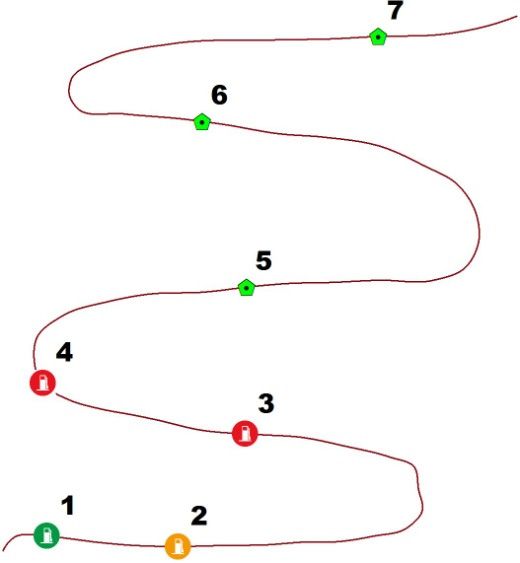
ISPRS Int. J. Geo-Inf. 2018, 7, 94 10 of 23
the calculation method and properties of which are shown in Formula (4), where n is the number of
gas stations that could be used for refueling along the route.
Dij = Di − D j
Dij = Dji i, j ∈ n (4)
ISPRS Int. J. Geo-Inf. 2018, 7, x FOR PEER
REVIEW 10 of 23
Dij = 0 ⇔ i = j
calculation method and properties of which are shown in Formula (4), where n is the number of gas
(3) Clustering
stations thatand
couldwarning level
be used for assignment.
refueling The shortest distance method was used to classify
along the route.
the following: first, the shortest distance DijD=pqDi=- Dj
min Dij was determined from the nondiagonal
elements of the n × n distance matrix, and the corresponding gas stations D and D were merged into
Dij = Dji i, j ∈ n p q (4)
a new class, Dr ; second, the distance between the remaining classes and the new class was recalculated
Dij = 0 ⇔ i = j
according to Formula (5), generating a new (n − 1)-order distance matrix; finally, we looked again for
(3) Clustering and warning level assignment. The shortest distance method was used to classify
the shortest distance and categorized the results based on the new distance matrix, and repeated this
the following: first, the shortest distance Dpq = min{ Dij } was determined from the nondiagonal
until all gas stations were placed into one category [40].
elements of the n × n distance matrix, and the corresponding gas stations D p and Dq were merged
into a new class, Dr ; second, the distance between the remaining classes and the new class was
n o
Drk = min D pk , Dqk (k 6= p, q) (5)
recalculated according to Formula (5), generating a new (n − 1)-order distance matrix; finally, we
looked again for the shortest distance and categorized the results based on the new distance matrix,
and repeated this until all gas stations were
Table 2. placed
Matrixinto one category [40].
of distance.
Drk = min{Dpk , Dqk } ( k ≠ p, q) (5)
Dij 1 2 3 4 n
1 0 D21 2. Matrix
Table D31 of distance.
D41 Dn1
2 D12 0 D32 D42 Dn2
3 DD ij 1D 2 03 4 D n Dn3
13 23 43
4 D141 0D D21 DD 31 D41 0 Dn1 Dn4
24 33
n D1n2 DD12 0 DD 32 D
D424n . . . D. n2
.. 0
2n 3n
3 D13 D23 0 D43 Dn3
4 D14 D24 D33 0 Dn4
3. Results and Discussion n D1n D2n D3n D4n…… 0
3.1. Design and Development
3. Results of the Scenario Simulation System
and Discussion
The 3.1.
algorithm’s
Design and scenario simulation
Development system
of the Scenario wasSystem
Simulation designed and developed by utilizing ArcEngine
and Matlab2012b, and the development
The algorithm’s environment
scenario simulation system was
was VS C#.netand
designed 2012.developed
ArcEngineby was mainly used
utilizing
to solve routing
ArcEngineand gas
and station problems
Matlab2012b, such as data
and the development entry, map
environment wasdisplay,
VS C#.netand computing,
2012. ArcEngine was and Matlab
was mainlymainly
usedused
for to solve clustering
spatial routing andanalysis
gas station problems
of gas such The
stations. as data entry, map
simulation display,
system and
interface based
computing, and Matlab was mainly used for spatial clustering analysis of gas
on the above mixed design idea is shown in Figure 5a, and the clustering algorithm and its results stations. The
simulation system interface based on the above mixed design idea is shown in Figure 5a, and the
(clustering spectral pattern diagram) are shown in Figure 5b.
clustering algorithm and its results (clustering spectral pattern diagram) are shown in Figure 5b.
(a)
Figure 5. Cont.ISPRS Int. J. Geo-Inf. 2018, 7, 94 11 of 23
ISPRS Int. J. Geo-Inf. 2018, 7, x FOR PEER REVIEW 11 of 23
(b)
Figure 5. System development of scenario simulation based on ArcEngine and Matlab. (a) Interface
Figure 5. ofSystem
scenariodevelopment
simulation; (b) of
cluster analysis
scenario of gas stations
simulation based
based ononArcEngine
Matlab. and Matlab. (a) Interface of
scenario simulation; (b) cluster analysis of gas stations based on Matlab.
3.2. Comparison and Sensitivity Analysis of Clustering Algorithm
In order to determine which clustering algorithm was more suitable for the distribution
3.2. Comparison and Sensitivity Analysis of Clustering Algorithm
optimization and refueling ability classification of gas stations, based on the two common clustering
algorithms
In order of K-Means and
to determine whichhierarchical clustering,
clustering the sensitivity
algorithm was moreof clustering attributes
suitable and distribution
for the the
clustering results of the two methods were compared and analyzed to verify the rationality of the
optimization and refueling ability classification of gas stations, based on the two common clustering
selected clustering algorithm. The verification test was divided into two parts:
algorithms of(1)K-Means
Sensitivity and hierarchical
analysis of clusteringclustering, theclustering
attributes. The sensitivity of clustering
operation was carriedattributes
out based and the
clusteringonresults of thecriteria
the judgment two methods
of the routewere compared
distance andgasanalyzed
between two to the
stations and verify the rationality
locations of the gas of the
stations, andalgorithm.
selected clustering then the influence of clustering attributes
The verification test wasondivided
the classification
into two rationality
parts: of gas stations
in different gas station layouts was analyzed.
(1) Sensitivity analysis of clustering attributes. The clustering operation was carried out based
(2) Effects comparison of the clustering algorithm. Cluster analysis was conducted for a given
on the judgment criteria of the route distance between two gas stations and the locations of the gas
gas station layout by using the K-Means and hierarchical analysis clustering algorithms, and the
stations, and then the influence
clustering results of the two of clustering attributes
algorithms were on the
compared andclassification rationality
analyzed according to the of gas stations
actual
in different gas station
refueling layouts
needs for wasgas
the given analyzed.
station layout, so that a more scientific and efficient clustering
method comparison
(2) Effects could be identified.
of the clustering algorithm. Cluster analysis was conducted for a given
gas station layout by using the K-Means and hierarchical analysis clustering algorithms, and the
3.2.1. Sensitivity Analysis of Clustering Attributes
clustering results of the two algorithms were compared and analyzed according to the actual refueling
The S-type route and corresponding gas station layout shown in Figure 1 were designed for this
needs forstudy.
the given gas station layout, so that a more scientific and efficient clustering method could
This kind of S-type road exists in many places around the world, especially in mountainous
be identified.
areas where the original ecological environment is well maintained, such as the sky mountain road
in Zhangjiajie, Hunan Province, China. In addition, another reason for designing this kind of S-type
3.2.1. Sensitivity
route withAnalysis
twists andof Clustering
turns Attributes
was that this kind of curve could better reflect the difference between the
route distance and the linear distance, which supported testing the sensitivity of clustering
The attributes.
S-type routeThe and corresponding
clustering calculation gas
wasstation layout
conducted by shown in Figure
using two 1 were
clustering designed
attributes (the for this
study. This kind of
Euclidean S-type
distance road exists
between two gasinstations
manyand places around
the route thebetween
distance world, two
especially in mountainous
gas stations), and
then the
areas where the original
clusteringecological
results were evaluated. Theis analysis
environment process and such
well maintained, evaluation
as theresults of the
sky mountain road
clustering calculation are shown in Table 3 and Figure 6.
in Zhangjiajie, Hunan Province, China. In addition, another reason for designing this kind of S-type
route with twists and turns was that this kind of curve could better reflect the difference between the
route distance and the linear distance, which supported testing the sensitivity of clustering attributes.
The clustering calculation was conducted by using two clustering attributes (the Euclidean distance
between two gas stations and the route distance between two gas stations), and then the clustering
results were evaluated. The analysis process and evaluation results of the clustering calculation are
shown in Table 3 and Figure 6.ISPRS Int. J. Geo-Inf. 2018, 7, 94 12 of 23
ISPRS Int. J. Geo-Inf. 2018, 7, x FOR PEER REVIEW 12 of 23
Table 3.
Table Clustering effects
3. Clustering effects comparison
comparison of
of different
different clustering
clustering attributes.
attributes.
Item Original Data Original
(×104) Data (×104 ) Attributes
Attributesand
andResults
Results of Clustering
of Clustering
Item
The Distance between
The Distancethe The Clustering
between the Result
The Clustering under
Result thethe
under The The Clustering
Clustering ResultResult
of of
Gas X-Coordinate of X-Coordinate
Y-Coordinateof of Y-Coordinate
the of The
The Clustering
Clustering Result
Result of
Gas Station
Gas Station and theand the Starting
Constraint ofConstraint
Euclideanof Distance
Euclideanand Distances
Distancesbetween the the Gas
between
Station the Gas Station/m
Gas Station the Gas Station/m
Gas Station/m the Gas Station/m Euclidean Distance
of Euclidean Distance
Point/km
Starting Point/km Distance and Route Distance
Route Distance Gas Stations
Stations
1 1 −6.6425 −6.6425−4.2083 − 4.2083 0.0494 0.0494 c1 c1 c1c1 c1 c1
2 −3.6308 −4.4530 0.0463 c2 c2 c1
2 3
−3.6308 −2.0886
−4.4530 −1.8608
0.0463 0.0355
c2 c2 c2
c2 c2
c1
3 4 −2.0886 −6.7309−1.8608 −0.6905 0.0355 0.0306 c2 c1 c1c2 c2 c2
4 5 −6.7309 −2.0426−0.6905 1.5114 0.0306 0.0244 c1 c3 c3c1 c2 c2
5 6 −2.0426 −3.06011.5114 5.3208 0.0244 0.0111 c3 c3 c3c3 c3 c2
7 0.9865 7.2768 0.0001 c3 c3 c3
6 −3.0601 5.3208 0.0111 c3 c3 c3
7 0.9865 c1, c2, or c3 indicates
7.2768 that the corresponding gas station is classified into the green,
0.0001 c3 orange, or red warning level, respectively.
c3 c3
c1, c2, or c3 indicates that the corresponding gas station is classified into the green, orange, or red warning level, respectively.
(a) (b) (c)
$
1 Gas station Green warning class Orange warning class Red warning class Self-driving route Euclidean distance Distance along route
Figure 6. The impact sensitivity analysis of clustering attribute changes on clustering results. (a) Hypothetical gas station layout under complex road conditions; (b)
Figure 6. The impact sensitivity analysis of clustering attribute changes on clustering results. (a) Hypothetical gas station layout under complex road conditions;
calculation result based on Euclidean-distance and mixed-distance clustering attributes; (c) calculation result based on the distance between the gas station and the
(b) calculation result based on Euclidean-distance and mixed-distance clustering attributes; (c) calculation result based on the distance between the gas station and the
starting point as a clustering attribute.
starting point as a clustering attribute.ISPRS Int. J. Geo-Inf. 2018, 7, 94 13 of 23
As seen in Table 1 and Figure 2, there was no difference in the clustering effect between
Euclidean-distance and mixed-distance clustering attributes, calculated by Euclidean distance and the
route distance from a gas station. The clustering results of this approach had the following deviations:
(1) the first and the fourth gas station were improperly clustered into one category; (2) the second gas
station (closer to the first) and the third gas station (closer to the fourth) were improperly clustered into
one category; (3) the fifth gas station, which was clearly more suitable for the c2 class, was classified
into the c3 class. The probable reason causing the deviation in clustering from the actual situation is
that Euclidean distance is a linear distance between two points, so clustering is free from the restraint
of route (the actual driving path) when taking Euclidean distance as the determining criterion for
clustering, resulting in a deviation. The above results indicated that this approach was an effective
clustering analysis method for gas stations based on the clustering attribute of the distance difference
between two gas stations along the route, and the clustering results well reflected the availability and
refueling urgency level of the gas stations along the route.
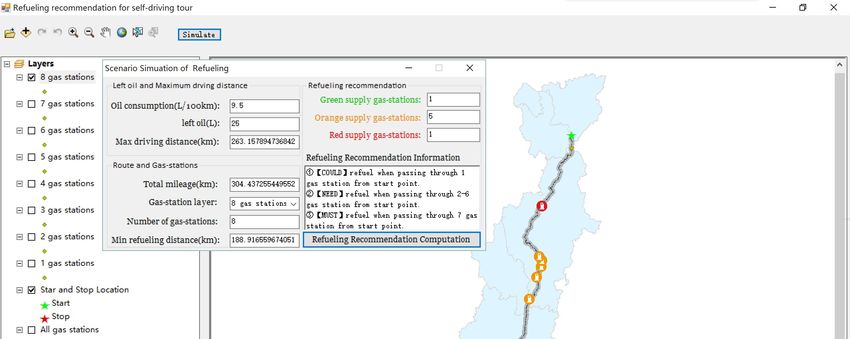
3.2.2. Comparative Analysis of Clustering Algorithms
The classical K-Means algorithm, belonging to the partitioning clustering method, was selected
for comparison with the hierarchical clustering method used in this study. Theoretically, the ability of
the K-Means algorithm to identify noise and outliers is relatively weak, and the initial center of mass is
the key to the calculation; the hierarchical clustering method can identify noise and outliers without
needing to specify the initial center of mass, but this convenience also comes with extra computing
overhead in time and space [40]. Fortunately, the distribution of gas stations along the route is generally
sparse, so this computing overhead is almost negligible when the amount of data is small. The S-type
route and the corresponding gas station layout designed above were used again as comparison test
data; the Matlab clustering tool developed by Ph.D. Kardi Teknomo was adopted to implement
the K-Means algorithm (http://people.revoledu.com/kardi/copyright.html), and the hierarchical
clustering tool was developed by the authors using Matlab. Finally, a clustering effect comparison is
shown in Table 4 and Figure 7; cells in Table 4 with the same color indicate inconsistencies between the
calculation results of the two clustering methods when the number of gas stations is the same.
Table 4. The effect comparison of clustering by different clustering algorithms.
Clustering Algorithm and Result Comparison
D (× 104 )/km K-Means Hierarchical Clustering Method
4 Gas 5 Gas 6 Gas 7 Gas 4 Gas 5 Gas 6 Gas 7 Gas
Stations Stations Stations Stations Stations Stations Stations Stations
1 0.0494 c1 c1 c1 c1 c1 c1 c1 c1
2 0.0463 c2 c2 c2 c1 c1 c1 c1 c1
3 0.0355 c3 c3 c2 c2 c2 c2 c2 c2
4 0.0306 c3 c3 c3 c2 c3 c2 c2 c2
5 0.0244 c3 c3 c3 c3 c2 c2
6 0.0111 c3 c3 c3 c3
7 0.0001 c3 c3
D means the distance between the gas station and the starting point. c1, c2, or c3 indicates that the corresponding
gas station is classified into the green, orange, or red warning level, respectively.
It can be seen from the effects of the two clustering algorithms that the K-Means algorithm
was greatly affected by the initial center of mass and was prone to producing outliers and excessive
merging, and some clustering did not realistically reflect the distance relationship among gas stations.
By contrast, the results of the hierarchical clustering algorithm were more stable, largely avoiding
the phenomenon of isolating or far-fetched merging of gas stations, and the clustering results of this
algorithm basically reflected the distance relationships among gas stations. From the analyses above,
we can see that the reasonability of clustering results obtained by the hierarchical clustering algorithm
was superior to that of the K-Means algorithm, proving that the hierarchical clustering algorithm is
more suitable for clustering analysis of the gas station layout along the route.ISPRS Int. J. Geo-Inf. 2018, 7, 94 14 of 23
ISPRS Int. J. Geo-Inf. 2018, 7, x FOR PEER REVIEW 14 of 23
(a1) (a2) (b1) (b2)
(c1) (c2) (d1) (d2)
$
1 Gas station Green warning class Orange warning class Red warning class
Figure 7. Results comparison between the hierarchical clustering algorithm and the K-Means clustering algorithm. (a1, b1, c1, and d1) show the clustering results of
Figure 7. Results comparison between the hierarchical clustering algorithm and the K-Means clustering algorithm. (a1, b1, c1, and d1) show the clustering results of
the K-Means algorithm when the number of gas stations is 4, 5, 6, or 7; (a2, b2, c2, and d2) show the clustering results of the hierarchical clustering algorithm when
the K-Means algorithm
the number when
of gas the is
stations number of7.gas stations is 4, 5, 6, or 7; (a2, b2, c2, and d2) show the clustering results of the hierarchical clustering algorithm when the
4, 5, 6, or
number of gas stations is 4, 5, 6, or 7.ISPRS Int. J. Geo-Inf. 2018, 7, 94 15 of 23
3.3. Test Data and Scenario Simulation Scheme
In this study, a real geographical environment and simulated positions and distributions of gas
stations were used as test data, and the testing procedure of the algorithm was as follows:
(1) The self-driving route: A real path was used as the self-driving route, the starting point of which
was located in Kunming, Yunnan Province, and the terminus of which was located in Zhaotong
City, Yunnan Province, represented by red and blue stars, respectively.
(2) Gas stations along the route: Several point elements representing gas stations were manually
created near the route. According to the requirement for the scenario simulation, ten layers of gas
stations were set up in this study; the number of gas stations per layer increased from 1 to 10,
and these gas stations were located in different positions.
Testing schemes for the scenario simulations designed in this study are shown in Table 5. A total
of nine testing schemes of four simulation scenarios were set up to test the accuracy and applicability
of the algorithm presented in this research, as described below:
(1) Scenario 1: There was one testing scheme designed in Scenario 1. In this scenario, the maximum
driving distance was greater than the aggregate mileage, and refueling was not required along
the route. Scenario 1 was utilized to test the adaptability of recommendation Strategy 1.
(2) Scenario 2: There were two testing schemes designed in Scenario 2 (Scheme 2-1 and Scheme
2-2). Scheme 2-1 indicated that the current remaining fuel was not enough for the vehicle to
reach the nearest gas station along the way; Scheme 2-2 indicated that there was no refueling gas
station along the route, recommending that the driver bring gas or fill up the gas tank in advance.
The two testing schemes in Scenario 2 were utilized to test the adaptability of recommendation
Strategy 2.
(3) Scenario 3: There were three testing schemes designed in Scenario 3 (Scheme 3-1, Scheme 3-2,
and Scheme 3-3). Supposing that the vehicle needed to refuel on the way, the impacts of a change
in the number of refueling gas stations along the route on the recommendation strategy were
explored in this scenario. The three testing schemes in Scenario 3 were mainly used to test the
adaptability of mixed recommendations from Strategy 3 and Strategy 4.
(4) Scenario 4: There were three testing schemes designed in Scenario 4 (Scheme 4-1, Scheme 4-2,
and Scheme 4-3,). Supposing that the vehicle needed to refuel and that there were plenty of
gas stations along the way, the influence of a change in the maximum driving distance of the
vehicle and the number and layout of refueling gas stations on the recommendation strategy
were explored in this scenario. The three testing schemes in Scenario 4 were mainly used to test
the adaptability of mixed recommendations from Strategy 2 and Strategy 4.You can also read