BOARD REPORT Mark R. Isfeld Secondary School, Courtenay, BC
←
→
Page content transcription
If your browser does not render page correctly, please read the page content below
Mark R. Isfeld Secondary School, Courtenay, BC

BOARD REPORT
School District 71 (Comox Valley) – Long Range Facilities Plan 2018 – 2027                  BOARD REPORT

                                       TABLE OF CONTENTS

Section        Title                                                                                Page

   1       Introduction .................................................................................. 3

   2       District Vision and Goals ……………………………………………. 4

   3       LRFP Principles and Objectives ………………………………..….. 5

   4       Existing Infrastructure and Programs ........................................... 6

   5       Community Demographics ......................................................... 17

   6       Enrolment Projections and School Capacities ........................... 35

   7       Analysis of Educational Need .................................................... 44

   8       Development of Options ............................................................ 46

   9       Recommendations ……………………………………………..…... 47

   10      Implementation Strategy ............................................................ 49

   11      Conclusions ................................................................................ 52

                                               Page 2 of 52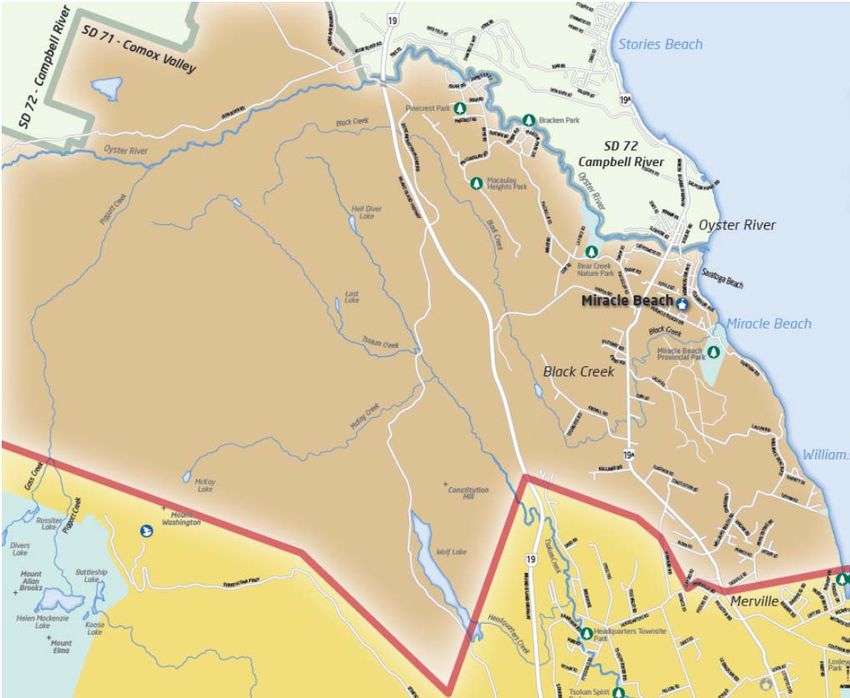
School District 71 (Comox Valley) – Long Range Facilities Plan 2018 – 2027 BOARD REPORT
1. INTRODUCTION
1.1 The Ministry of Education 2016/17 Capital Plan Instructions issued June 2016 require Boards
of Education to develop and maintain a comprehensive School District Long Range Facilities
Plan (LRFP).
Ministry of Education Capital Plan Instructions state:
School Districts are to maintain a current, comprehensive LRFP that:
o forms the basis for school districts’ capital investment decisions;
o aligns with best practices in asset management;
o is a key component for district-wide capital planning; and
o is a framework for other local programming and operational decisions.
The LRFP should use a ten-year planning horizon with consideration for the longer
term. The scope and emphasis of each LRFP will vary depending on the specific
circumstances and priorities of each school district. School districts are required to
develop and maintain a comprehensive LRFP, available upon Ministry request.
The fundamental premise of the LRFP is to provide a mechanism for districts to
demonstrate they are managing their facilities in an effective, economic and efficient
way in support of their educational goals. The LRFP places the need for capital
projects in a district-wide context and becomes the basis for submission of capital
project requests by the district and for investment decisions by the Ministry.
1.2 Note that the LRFP is a Facilities Plan, not an educational study of the appropriate grade
structure of schools, the appropriate placement of district programs, nor the
viability/desirability of neighbourhood schools.
1.3 In June 2016 School District 71 Comox Valley (SD 71) engaged Bill Low of Cascade
Facilities Management Consultants Ltd (www.cascade-cslts.com) of Langley, BC, to prepare
this School District Long Range Facilities Plan (LRFP) with direction and input from senior
district staff and the Board’s Facilities Committee.
Page 3 of 52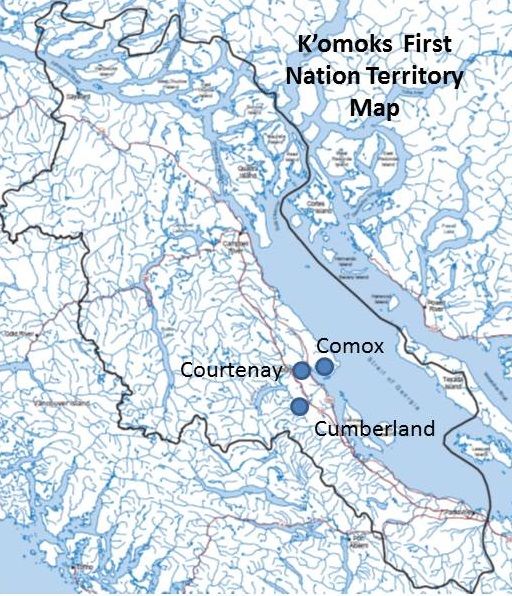
School District 71 (Comox Valley) – Long Range Facilities Plan 2018 – 2027    BOARD REPORT

2. DISTRICT VISION AND GOALS

2.1 SD 71 has a long tradition of providing effective educational programming to students in the
    Comox Valley.

2.2 The Objectives for the Long Range Facilities Plan are as follows:

   a. To determine the 10 year enrolment projections by school;
   b. To optimize district capacity utilization in schools, mindful of the Ministry of Education
      target of 85% (enrolment up to 7,500 students);
   c. To consider and align the district’s school grade configurations with long-term district
      structure planning; and
   d. To plan alignment of school and district programs with school facility structures and
      resources.

2.3 SD 71 has gone through several grade structure organizations over the past 30 years. Early
    in this period, schools were organized into elementary, middle, and secondary. When
    enrolments declined and some elementary schools had to close, the decision was made to
    return to a previous organization of elementary Kindergarten to Grade 7, and secondary
    Grades 8 to 12. It was not possible to completely change the district grade structure in all
    schools, resulting in the current 2017/18 organization which includes one middle school and
    one community school to Grade 9. Refer to Section 4.

                                             Page 4 of 52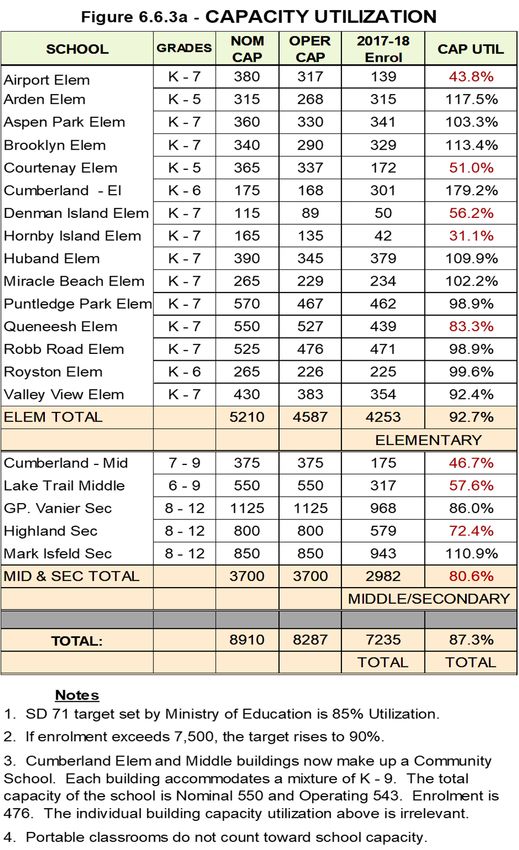
School District 71 (Comox Valley) – Long Range Facilities Plan 2018 – 2027 BOARD REPORT
3. LRFP PRINCIPLES AND OBJECTIVES
3.1 The purpose of the Long Range Facilities Plan (LRFP) is to guide facilities development
decisions by both the district and the Ministry over the coming ten year period. The annual
Capital Plan submission should always address specific needs already justified at the macro
level by the LRFP.
3.2 Principles
The 2018-2027 LRFP must take into account changes in school enrolment, future growth
or decline in school-age population, building condition, and district philosophy on grade
structure organization;
The LRFP must identify and support the facility needs of any revised grade structure that
the district has set as its next goal;
The LRFP must recognize the importance of small rural schools as the heart of the
community in isolated parts of the district;
The LRFP must allow for Ministry of Education initiatives such as Full Day Kindergarten,
Strong Start, and Neighbourhoods of Learning;
The School District LRFP must support the unique First Nations cultural and educational
development needs.
3.3 Objectives
Provide viable educational facilities capable of accommodating the catchment population;
Provide school facilities capable of providing a successful educational environment for the
assigned grade structure;
Provide healthy and safe physical facilities as schools; and
Provide accessible community spaces in support of the local population’s educational and
cultural needs, recognizing the importance of the school building as a resource to the
community.
Page 5 of 52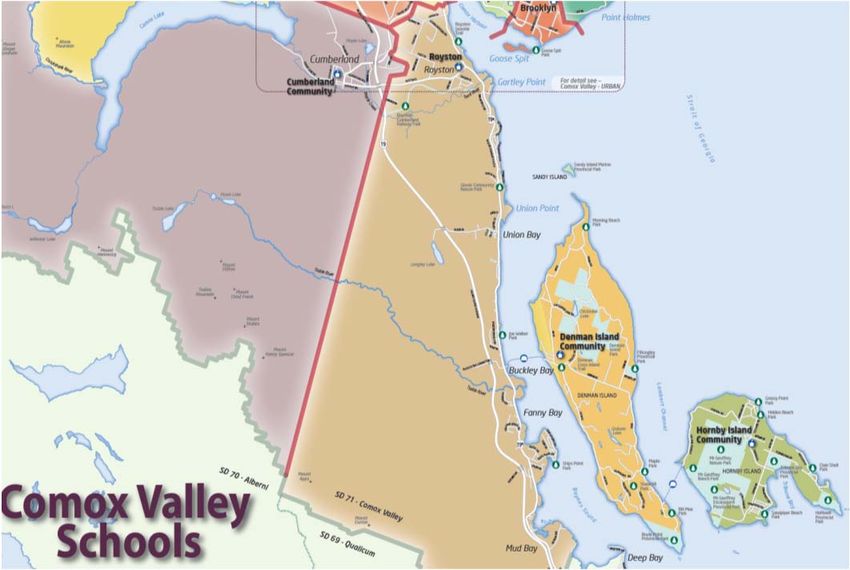
School District 71 (Comox Valley) – Long Range Facilities Plan 2018 – 2027 BOARD REPORT
4. EXISTING INFRASTRUCTURE AND PROGRAMS
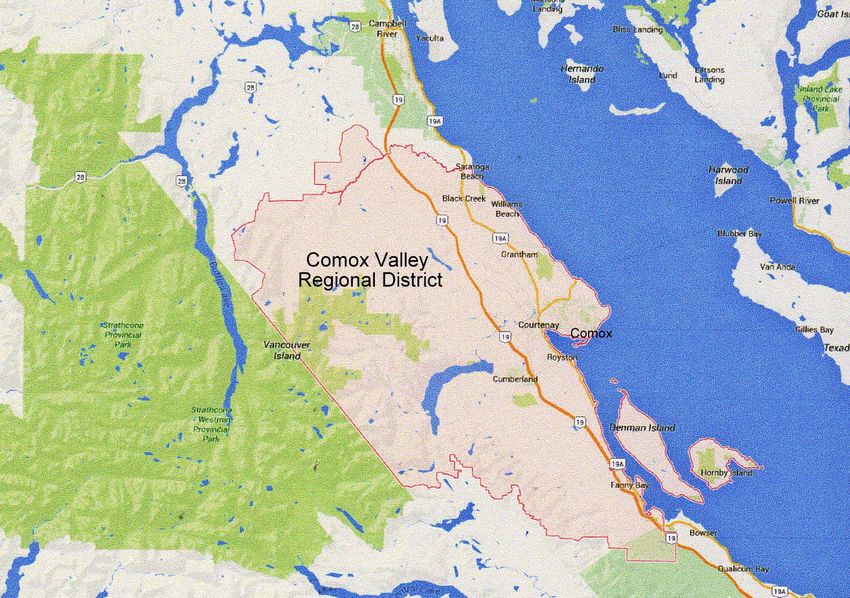
4.1 SD 71 serves the urban centres of Courtenay and Comox, the village of Cumberland, and the
smaller unincorporated communities of the Comox Valley Regional District located in
northeastern Vancouver Island. See Figure 4.1. The communities are mainly connected by
Highway 19 (north-south). The population includes a small First Nations population. In the
smaller communities north and south of the urban centre, the school is the main social
centre. These include Miracle Beach, Royston, Hornby Island, and Denman Island.
Figure 4.1 – Comox Valley School District Geographic Location on the northeast coast of
Vancouver Island, British Columbia
Page 6 of 52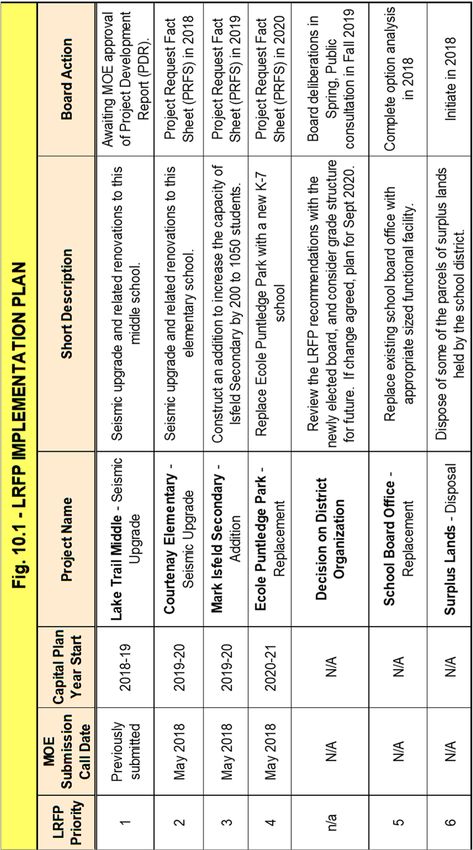
School District 71 (Comox Valley) – Long Range Facilities Plan 2018 – 2027 BOARD REPORT
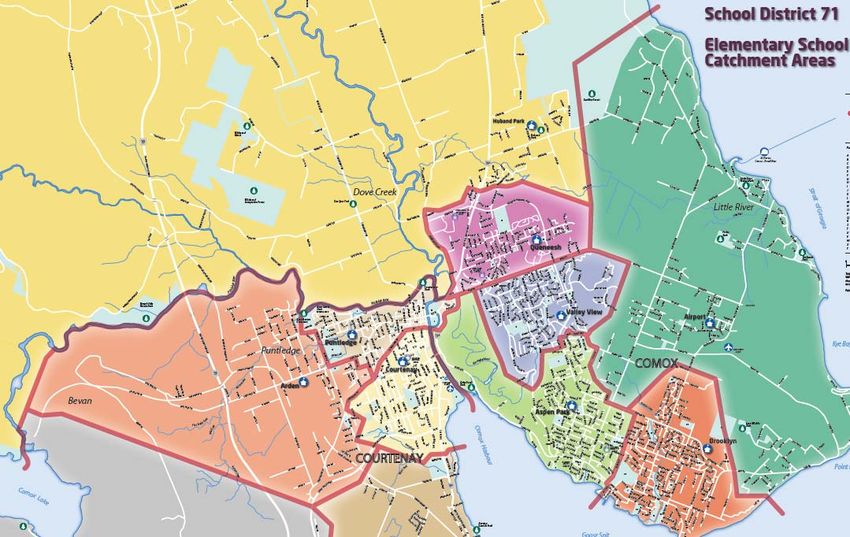
4.2 District Zones. For the purposes of planning, it is recommended that the school district be
organized into two zones: Urban and Rural. This varies from the political divisions and
representation within the board of school trustees, but from the point of view of facilities
management, is the most logical. Refer to the maps below.
a. Urban Zone includes all the schools in Courtenay and Comox (Figure 4.2a);
b. Rural Zone includes the outlying elementary schools: Miracle Beach and North Island
Distance Education Centre (NIDES) in the north (Figure 4.2b), Cumberland in the
southwest, and Royston, Denman Island, and Hornby Island in the south (Figure 4.2c).
Figure 4.2a –
Urban Zone
Page 7 of 52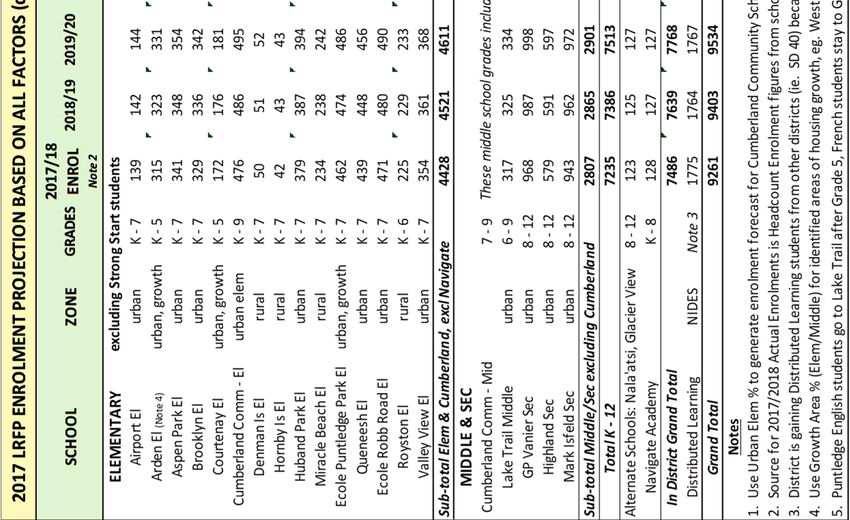
School District 71 (Comox Valley) – Long Range Facilities Plan 2018 – 2027   BOARD REPORT

                                                                              Figure 4.2b
                                                                              Rural Zone
                                                                                ‐ north

                                                                              Figure 4.2c ‐
                                                                              Rural Zone ‐
                                                                                 south

                                             Page 8 of 52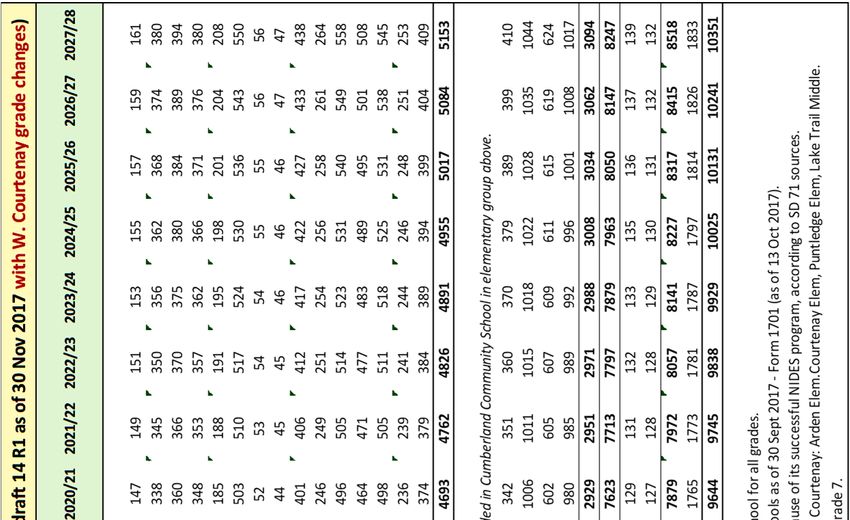
School District 71 (Comox Valley) – Long Range Facilities Plan 2018 – 2027 BOARD REPORT
4.3 Facilities in Service. In 2017/2018 Comox Valley School District was operating and
maintaining the following schools and other facilities:
ELEMENTARY –
o Urban Zone:
Airport Elementary (K-7);
Arden Elementary (K-5);
Aspen Park Elementary (K-7);
Brooklyn Elementary (K-7);
Courtenay Elementary (K-5);
Huband Park Elementary (K-7);
Ecole Puntledge Park Elementary (Dual Track with K-7 French
Immersion, but K-5 for English stream);
Queneesh Elementary (K-7);
Ecole Robb Road Elementary (K-7 French Immersion);
Valley View Elementary (K-7)
o Rural Zone:
Royston Elementary (K-6);
Cumberland Community School (K-9);
Denman Island Elementary (K-7);
Hornby Island Elementary (K-7);
Miracle Beach Elementary (K-7);
MIDDLE & SECONDARY –
o Urban Zone:
Lake Trail Middle School (6-9)
Highland Secondary (8-12);
Mark R. Isfeld Secondary (8-12 Dual Track);
Georges P. Vanier Secondary (8-12);
Glacier View Secondary Alternate School (8-12).
o Rural Zone:
None
Page 9 of 52
School District 71 (Comox Valley) – Long Range Facilities Plan 2018 – 2027 BOARD REPORT
OTHER ACTIVE PROPERTIES –
o Urban Zone:
Sandwick Technical School;
Nala’atsi Alternate Program (First Nations Alternate) in two separate
buildings on the Courtenay Elementary property;
School Board Office;
School District Facilities and IT Departments;
o Rural Zone:
North Island Distance Education (NIDES) (K – 12) and Fine Arts e-
Cademy (FAE) (K - 8) occupying former Tsolum School.
4.4 Photos and descriptions of the schools – refer to the full LRFP.
4.5 School Communities. The September 2017 school organization and the flow of students
from elementary to secondary is shown in the following Chart (Figure 4.5).
Figure 4.5 – Organization in September 2017
Page 10 of 52School District 71 (Comox Valley) – Long Range Facilities Plan 2018 – 2027 BOARD REPORT
4.6 Facility Condition. The following Figure 4.6a shows the Facility Condition Index for each
school as determined by the Ministry of Education funded Capital Asset Management System
(CAMS) building assessments.
In 2009 the Ministry of Education contracted VFA Inc, a Boston based facility capital planning
and asset management company, to complete a facility condition assessment of all schools
in the province.
The relative measure of the condition of the facilities is usually categorized into a five-tiered
condition scale ranging from Excellent to Very Poor, as follows:
Rating Condition Remarks
Near new; meets present and foreseeable future
under 0.05 Excellent
requirements
0.05 to 0.15 Good Meets all present requirements
Has significant deficiencies, but meets minimum
0.15 to 0.30 Average requirements; some significant building system components
nearing the end of their normal life-cycle
Does not meet requirements. Immediate attention required
0.30 to 0.60 Poor to some significant building systems. Some significant
building systems at end of their life-cycle. Parts no longer in
stock, or very difficult to obtain. High risk of failure of some
systems.
Does not meet requirements. Immediate attention required
over 0.60 Very Poor to most significant building systems. Most significant building
systems at end of their life-cycle. Parts no longer in stock, or
very difficult to obtain. High risk of failure of most systems.
In July 2016, VFA carried out a new assessment in SD 71. It was apparent that the scoring
criteria has changed significantly because the new Facility Condition Indexes (FCI) for
Comox Valley schools were lower (better condition) than in the previous rating even where no
upgrading has taken place. The current FCI scores are now more realistic – see Fig. 4.6a.
Page 11 of 52School District 71 (Comox Valley) – Long Range Facilities Plan 2018 – 2027 BOARD REPORT
Figure 4.6a – Current Facility Condition Assessments scores compared to past
Figure 4.6c – Facility Condition Assessments Graph
SD 71 Facilities Condition ‐ from Best to Worst 2018
Very
0.7 Poor
0.6 Poor
0.5
Average
FCI Score
0.4
0.3
0.2
0.1
0
Page 12 of 52School District 71 (Comox Valley) – Long Range Facilities Plan 2018 – 2027 BOARD REPORT
4.7 As can be seen by the facility condition scores above, many of the school facilities are in
need of improvement. A combination of capital projects and Annual Facilities Grant projects
has been identified to the Ministry. The following projects were submitted to the Ministry:
Capital Plan Submission June 2017:
1. Lake Trail Middle – Seismic Upgrade;
2. Courtenay Elementary – Seismic Upgrade;
3. Cumberland Community School – Building Envelope Upgrade of junior secondary
building;
4. GP Vanier Secondary – Replace moveable gym wall;
5. Highland Secondary – Replace moveable gym wall;
6. Mark Isfeld Secondary – Mechanical Upgrade;
7. Royston Elementary – Mechanical Upgrade;
8. Cumberland Community School – Mechanical Upgrade of junior secondary building;
9. Mark Isfeld Secondary – Sheet Flooring Replacement;
10. Valley View Elementary – Boiler Replacement;
11. Ecole Puntledge Park – DDC Replacement.
4.8 Seismic Upgrading. The 2015 Seismic Ratings of SD 71 schools is shown in Figure 4.8 of
the full LRFP report.
Current Seismic Upgrading Projects
a. Lake Trail Middle – constructed in 1964. Initially Lake Trail Middle school was listed as
having high seismic risk to only one block:
Block 4 – 1964 1-Storey Science/Shops and Arts. Two factors led to this becoming a
more extensive project. First, the prior assessments were based on limited information
and did not include a detailed assessment based on site visits by a structural engineer,
and second, with the release of the Seismic Retrofit Guidelines 3rd Edition (SRG3),
assumed ground force motions from a subduction earthquake on Vancouver Island have
increased significantly. With a more detailed assessment it is likely Block 1 (1955 Old
Gym) would have been assessed as having high risk under SRG2, and risk for Blocks 2
(1955 1-Storey Admin) and Block 3 (1955 2-Storey Classrooms) increased from Medium
risk to High 2 risk under SRG3.
Seismic Project Identification Report (SPIRs) have been completed by a local structural
Page 13 of 52School District 71 (Comox Valley) – Long Range Facilities Plan 2018 – 2027 BOARD REPORT
engineering firm, Herold Engineering, which have now confirmed High 2 risk for four of
the five school blocks under SRG3. Only the new gymnasium and library (Block 5)
constructed in 1999 is rated with low seismic risk. The project is awaiting provincial
approval and funding.
b. Courtenay Elementary – 2-storey timber frame construction, built in two phases 1952 and
1960. The classroom block seismic upgrade will include: improved north-south
foundations, improved roof diaphragm connections, and classroom/corridor walls upgraded
to shear walls. The gym was previously seismically upgraded. A Project Request Fact
Sheet (PRFS) is required.
4.9 Surplus Property. In the past, SD 71 has had to deal with declining enrolment at some
schools and the resulting budget cuts. As a result, the board made tough decisions in past
years to close a number of schools. Current surplus sites are:
Union Bay school site – school closed. No tenants;
Comox Elementary – school closed. Leased to Korean ESL program using four
classrooms;
Atlas Road site – 5 acre property contiguous with a City of Courtenay 5 acre property.
Reserved for future development;
Sandwick Technical School – part of Glacier View Alternate School.
Harmston Park – in process of being disposed of, see Figures 4.9a and b in the full LRFP
report.
4.10 Location of Portable Classrooms.
Portable classrooms are not included in the nominal capacity of the school at which they are
placed. They provide flexibility in accommodating students at over-capacity sites and swing
space for seismic upgrades and other renovation projects. There are 35 portable classrooms
in Comox Valley School District. The inventory is shown in Figure 4.10.
Page 14 of 52School District 71 (Comox Valley) – Long Range Facilities Plan 2018 – 2027 BOARD REPORT
Figure 4.10 – Portable Classroom Inventory
Page 15 of 52School District 71 (Comox Valley) – Long Range Facilities Plan 2018 – 2027 BOARD REPORT
4.11 District Programs. The district supports a variety of programs at these locations:
Aboriginal Education / Nala’tsi – located on the Courtenay Elementary site. Approximately
40 students;
Glacier View Learning Centre – alternate education program for secondary students.
Approximately 120 students;
Sandwick Technical Education Program – affiliated with Glacier View. Approximately 20
students;
French Immersion Program – elementary at Ecole Puntledge Park (dual track) and Robb
Road (single track), and secondary at Mark Isfeld (dual track). Approximately 700
elementary and 400 secondary students;
North Island Distance Education School (NIDES) – located at former Tsolum school.
Approximately 1300 enrolled, equal to about 550 FTE, Grades K - 12;
NIDES Fine Arts e-Cademy (FAE) – also located at the former Tsolum school.
Approximately 125 students Grades K - 8;
Montessori Program – at Queneesh Elementary. Approximately 150 students;
Lifeskills Program – located at Mark Isfeld Secondary. Approximately 30 students;
PREP Program – located at Vanier Secondary. Approximately 30 students;
Behaviour Resource Services – located at Robb Road Elementary. Approximately 25
students;
ENTER (Robotics Program) – elementary at Aspen Park and secondary at Highland
Secondary. Approximately 50 students.
Page 16 of 52School District 71 (Comox Valley) – Long Range Facilities Plan 2018 – 2027 BOARD REPORT
5. COMMUNITY DEMOGRAPHICS
5.1 INTRODUCTION
SD 71 is located on Vancouver Island, sharing the same boundaries as the Comox Valley
Regional District. This regional district was established in February 2008, following the
restructure of the Comox Strathcona Regional District into two regional administrative areas:
Comox Valley Regional District and the Strathcona Regional District. This change along with
changes in the Canada Census Division and Subdivision boundaries between the Census
years of 1996, 2001, 2006, 2011, and 2016, has presented challenges in comparing data and
undertaking trend analysis. The demographic information includes Census Canada data as
well as projections generated by BC Statistics PEOPLE modelling. Best efforts were made in
adjusting and applying the available data used to generate the estimates contained in this
section. The 2016 Census data added to this report is preliminary and may be subject to
undercount adjustments, therefore, the projections may need to be recalibrated with later
data.
5.2 BOUNDARIES
SD 71, the Comox Valley Regional District (CVRD), and the Courtenay Local Health District
have the same boundaries and include the communities of Courtenay, Comox and
Cumberland. A map of each administrative unit is shown as Figures 5.2a, b, and c in the full
LRFP report. Therefore, demographic data that applies to these administrative units will
simply refer to the Comox Valley.
5.3 HISTORIC POPULATION
The Comox Valley has a distinct urban and rural dichotomy.
Comox, Courtenay and Cumberland comprise the “urban population centre” for the Comox Valley
Regional District. From the Census population tables below, the majority of the residents reside
within this urban core, increasing from 62.5% urban dwellers in 2006 to 64.7% urban dwellers in
2011. This follows the same pattern as in British Columbia as a whole, which increased, albeit
more slowly, from 85% to 86% urban dwellers in the same period (Statistics Canada). Their rapid
growth is evident from the figure below.
Figure 5.3a
This is contrasted by the populations for the rural area
outside of the three municipalities. The rural areas are
made up of three Electoral Districts shown on the Figure
5.3a map. Much of the land is within the Agricultural Land
Reserve and is farmland. When 2006 and 2011
populations are compared, two of the three Electoral Areas
Page 17 of 52School District 71 (Comox Valley) – Long Range Facilities Plan 2018 – 2027 BOARD REPORT
(A and B) are in decline. The third rural area (Area C) may also be in decline based on earlier
1996 to 2001 figures.
The 2016 Census statistics for provincial and national urban/rural growth are not yet available to
determine if the urban/rural split has changed or to be more conclusive about the rural decline. In
the meantime, it is reasonable to focus separately on the urban and rural areas in assessing
school facility needs.
Table 5.3a: Estimated Populations of the Region and Communities
1996 - 2001 -
2006 - 2011 -
Location (and 2001 2006
1996 2001 2006 2011 2011 2016
Notes) change change 2016
change change
(3) (3) (4)
Comox Valley 59,482 63,538 6.8% 66,527 4.7%
Comox (1) 11,069 11,172 0.9% 12,385 10.9% 13,627 10.0% 14,028 2.9%
Courtenay (1) 17,404 18,304 5.2% 2,2021 20.3% 2,4099 9.4% 25,599 5.7%
Cumberland 2,548 2,618 2.7% 2,762 5.5% 3,398 23.0% 3,753 10.4%
First Nations
272 251 -7.7% n/a
Reserves
Comox Valley A (2) 6,988 6,762 -3.2% 6,973 3.1% 6,899 -1.1% 7,213 7.1%
Comox Valley B
8,074 7,941 -1.6% 6,970 -12.2% 6,939 -0.4% 7,095 2.0%
(Lazo North) (1)
Comox Valley C
(Puntledge - Black 8,615 7,584 -12.0% 8,099 6.8% 8,325 2.8% 8,617 3.2%
Creek)
Notes applicable to Table 5.3a above:
(1) On-line data tables include notations that the boundaries of geographic areas may change
from one census to another. Therefore, there may be a fair margin of error in comparing
population figures between the Census periods.
(2) For 1996 and 2001, this area has been estimated by Cascade by combining the statistics
for Comox-Strathcona Areas A and K. These two areas are combined into Comox Valley
Area A for the 2006 and 2011 Census. On-line data tables include notations that the
boundaries changed over the four Census periods. Therefore, there may be a fair margin
of error in comparing population figures between the Census periods.
(3) May not be reliable because the boundaries of geographic areas may have changed;
(4) The boundaries between Courtenay and the three Electoral Areas have changed
between the 2011 and 2016 Census. Some of the data sources have adjusted the 2011
Census figures to follow the new boundaries; therefore, there may be minor
inconsistencies in the figures for the same year quoted for these four areas in this report.
Page 18 of 52School District 71 (Comox Valley) – Long Range Facilities Plan 2018 – 2027 BOARD REPORT
Municipal population statistics are maintained by BC Stats using Canada Census for the urban
centres over a significant period of time. These figures may not be exactly comparable due to
changes such as annexations. An example is the population gain of 824 when land was annexed
by Courtenay in 2002 (Source: the City of Courtenay Official Community Plan).
Notwithstanding such changes, the long period of time gives a good indication of the historical
growth. Figure 5.3b below graphs the historic populations for Comox, Courtenay, and
Cumberland. Since about 1931, Courtenay has had the highest population of the three centres.
Both Comox and Courtenay show a history of growth. Cumberland has grown far less over the
years in comparison to Comox and Courtenay and maintains a more stable population.
Figure 5.3b
Page 19 of 52School District 71 (Comox Valley) – Long Range Facilities Plan 2018 – 2027 BOARD REPORT
BC Stats also had developed data tables based on Canada Census data for consistent
comparison of Regional Districts, but not on a community level. The numbers are different from
above, but relatively close and comparable for the Census years. Table 5.3b shows BC Stats
data for the Comox Valley for 1986 to 2011 and preliminary data from Statistics Canada for 2016:
Table 5.3b: Population of the Region
Population % Change
1986 38,798 n/a
1991 45,653 17.7%
1996 56,914 24.7%
2001 56,371 -1.0%
2006 60,365 7.1%
2011 64,417 6.7%
2016 66,527 3.3%
The area has gradually grown over the period of 1986 to 2016 (as shown in Figure 5.3c). The
historic population line generally follows a steady linear increase, with some evidence of slightly
reduced growth following the 1996 census. With the preliminary 2016 Census available now, it
appears the previous growth rate is moderating.
Figure 5.3c
Page 20 of 52School District 71 (Comox Valley) – Long Range Facilities Plan 2018 – 2027 BOARD REPORT
Plotting the growth rates reveals a potential pattern, namely the rate of growth between census
years shows robust increase rates; however, the rate of growth is declining (Figure 5.3d).
Considered together, the current trends suggest that the general population may not continue to
grow at the same rapid rate that it has most recently.
5.4 AGE OF POPULATION
The age of the population for 2006, 2011, and 2016 is shown in the Table 5.4a below.
5.4.1 Youth Age Groups. Whereas between 2006 and 2011, youth age group 0 – 4 years was
increasing and all groups of 5 years and over were in decline, the 2011 to 2016 statistics
reveal a change. The change is that the age groups below 10 years of age being the break in
growth. The 0 to 4 (+1.4 %) and 5 to 9 (+9.0 %) age groups are increasing whereas the 10 to
14 and 15 to 19 continue to decline. This suggests that there is a demographic “bump”
moving its way through time that is very important when assessing the needs of the school
age population.
5.4.2 Adult Age Groups. The greatest growth continues to be experienced by the seniors age
category of 65 years and over. Growth in this age group remains relatively constant with a
26.4% increase between the 2006 and 2011 census and a 25.5% increase between 2011
and 2016. The growth for the 45 to 64 years age group declined significantly from 13.2%
growth between 2006 and 2011 to a 2.5% decline between the 2011 and 2016 census. The
Page 21 of 52School District 71 (Comox Valley) – Long Range Facilities Plan 2018 – 2027 BOARD REPORT
20 to 44 age group which declined slightly by 1.0% between 2006 and 2011, grew slightly by
2.2% between 2011 and 2016. Note that this is the child-bearing age group.
Table 5.4a: Population by Age Group
Note: The 2006 figures for age groups could not be adjusted for 2011 boundary
changes. The total unadjusted and adjusted populations for 2006 are 58,825 and
59,482. The 2016 population is preliminary and subject to adjustment.
2006 2011 % Change 2016 % Change
0 to 4 years 2,525 2,760 +9.3 % 2,800 +1.4 %
5 to 9 years 3,100 2,955 -4.7 % 3,220 +9.0 %
10 to 14 years 3,785 3,360 -11.2 % 3,170 -5.7 %
15 to 19 years 3,975 3,800 -4.4 % 3,395 -10.7 %
20 to 44 years 15,855 15,690 -1.0 % 16,035 +2.2 %
45 to 64 years 18,875 21,375 +13.2 % 20,835 -2.5 %
65 years and more 10,745 13,585 + 26.4 % 17,060 +25.6 %
Figure 5.4 – Children Age Group changes
Page 22 of 52School District 71 (Comox Valley) – Long Range Facilities Plan 2018 – 2027 BOARD REPORT
Another measure of the age of the population is the median age. This is the exact age where half
of the population is older and half is younger. Using 2011 Census data, Comox Valley has a
median age of 48.3 years, compared to the Vancouver Island/Coast Region median age of 46.5
years and BC as a whole being 41.9 years. Therefore, the population of the Comox Valley is
slightly older in composition than the Island/Coast area and moderately older than the province in
general.
5.5 ABORIGINAL POPULATION
A robust assessment of Aboriginal population and age characteristics is difficult. Not only do the
boundary changes over the years affect the ability
to compare numbers and establish trends, the
statistics for some area are not reported. Statistics
Canada suppresses all data for geographic areas
with populations below a specified size for reasons
of confidentiality. Where data is over this size, it is
randomly rounded either up or down to a multiple
Figure 5.5a
of 5 or 10. Therefore there is ether no data or total
value may not match the sum of a list of values.
This applies to data collected in each Canada
Census or the 2011 National Household Survey.
2016 data not yet available.
The Comox Valley is located in the southern
portion of the Territory of the K’omoks First Nation.
The map to the right shows the K’omoks Territory
with the three urban areas of Comox, Courtenay
and Cumberland within the Comox Valley.
The following Table 5.5b shows the Aboriginal populations for Courtenay, Comox and the Comox
Valley. The Aboriginal population in Courtenay has grown, but is a constant 5% of the total
population of Courtenay in both 2006 and 2011. In Comox, the Aboriginal population increased in
numbers as well as in percentage. The Aboriginal population made up 2.9% of the total
population of Comox in 2006 and increased to 3.3% in 2011.
For Cumberland, only the total Aboriginal populations but not the age characteristics were
available. The 2006 population is 225 people or 8.1% of the total population. For 2011, this
population declined to 175 people making up 5.2% of the total population of Cumberland.
For the entire Comox Valley, the Aboriginal population was 2,900 people, making up 4.6% of the
total population.
Page 23 of 52School District 71 (Comox Valley) – Long Range Facilities Plan 2018 – 2027 BOARD REPORT
Table 5.5b: Aboriginal Population Statistics
Comox
Courtenay Comox Cumberland
Valley
2006 2011 2006 2011 2006 2011 2011
Total Aboriginal
identity population 1110 1205 360 455 225 175 2910
Aboriginal
Population as a
percentage of total
5.0% 5.0% 2.9% 3.3% 8.3% 5.2% 4.6%
population
0 to 4 years 105 105 25 0 170
5 to 9 years 80 70 25 50 240
10 to 14 years 125 95 50 55 255
15 to 19 years 105 90 35 65 325
Sources: Statistics Canada 2006 Census and the 2011 National Household Survey. 2016 not yet available.
Where the data is available, a comparison of median age shows a striking difference between
Aboriginal and the overall Comox Valley population data as shown in Table 5.5c:
TABLE 5.5c: Comparison of Median Age in
Available Areas for the Total and the Aboriginal Population (2011)
Total Population Aboriginal Population
Median Age Median Age
Comox 49.1 years 30.8
Courtenay 46.5 31.6
Comox Valley Area A 53.9 30.6
Comox Valley B
(Lazo North) 50.1 n/a
Comox Valley C
(Puntledge - Black 48.1 36.7
Creek)
Page 24 of 52School District 71 (Comox Valley) – Long Range Facilities Plan 2018 – 2027 BOARD REPORT
Figure 5.5d compares the Aboriginal school age characteristics for Courtenay and Comox for the
census years of 2006 and 2011. This data not yet available for 2016 as of this date.
Figure 5.5d – Aboriginal School Age Characteristics for Courtenay and Comox
5.6 FACTORS INFLUENCING POPULATION
There are a number of factors influencing population growth.
5.6.1 Fertility rates in BC have changed over the years, becoming relatively level in recent
years. Figure 5.6.1 concerning fertility rates shown below is from latest BC Vital Event Annual
Report (2011). Historically fertility rates increased after World War II through the decades of
1950 and 1960. There is a pronounced decline until the late 1970s. This declining trend
slowed with some variations, until a low in 2002, increased until 2007 after which fertility rates
have leveled off.
In a report Our Babies, Our Future: Aboriginal Birth Outcomes in British Columbia, the
authors observe that the younger population structure of Aboriginal population is BC is linked
to a higher fertility rate for Aboriginal women compared to the non-Aboriginal women.
According to the 2005 report by V. O’Donnell Aboriginal Women in Canada, in the period
between 1996 and 2001, the fertility rate of Aboriginal women was 2.6 children compared
with a figure of 1.5 among all Canadian women.
Page 25 of 52School District 71 (Comox Valley) – Long Range Facilities Plan 2018 – 2027 BOARD REPORT
Figure 5.6.1 Fertility Rates
Source: Trends in Vital Events – Vital Statistics Agency Annual Report 2011
5.6.2 Life Expectancy. The increase in the life expectancy of residents in the Comox
Valley mirrors that of Vancouver Island and the Province. A report produced by Local
Health, show that the average life expectancy at birth has increased from 78.0 years in
1987-1991 to 82.1 years in 2010-2014. Refer to Figure 5.6.2.
Figure 5.6.2
Life Expectancy in Courtenay Local Health District
Source: 2014 Local Health Area Profile Courtenay (71) p. 13.
Page 26 of 52School District 71 (Comox Valley) – Long Range Facilities Plan 2018 – 2027 BOARD REPORT
5.6.3 Growth and Migration. Considering natural growth and migration, deaths will begin
to exceed births with the population generally aging. In-migration, although highly
variable, will become the main source for growth once natural growth becomes negative.
Provincial level data from BC Stats about BC births, deaths and in migration was used to
generate the Figure 5.6.3a below. Because there was an apparent jog between the
historic and projection periods, the initial projection data is smoothed out to reflect the
most recent historic death statistics. For both projections, the number of deaths will
become greater than the number of births in the 2030’s and therefore any growth will be
from migration into the province.
Figure 5.6.3a
Page 27 of 52School District 71 (Comox Valley) – Long Range Facilities Plan 2018 – 2027 BOARD REPORT
People migrating into the Comox Valley Regional District add to the local population. Figure
5.6.3b shows the migration trend (mainly in-migration). Comox Valley is the destination of a
small number of immigrants.
Source: BC Regional District Migration Components (Released Feb 2016)
Note that some of the data above is based on BC Stats tables for the Comox-Strathcona
Regional District before the Comox Valley Regional District was created in 2008.
The population increase from immigration as a percentage of the total population shown in
Figure 5.6.3c ranged between 0.24% in 2009 to a low of 0.06% in 2012.
Figure 5.6.3c - Migration as a Percent of Population
Source: Appendix A to International Education in the Comox Valley: Current and Potential Economic Impacts (2014).
Page 28 of 52School District 71 (Comox Valley) – Long Range Facilities Plan 2018 – 2027 BOARD REPORT
5.6.4 Housing Affordability. There are some new factors that may have an influence on
growth. A 2015 Angus Reid poll reveals that 150,000 families are struggling and are
seriously thinking about moving away from Metro Vancouver to avoid that region’s
increasing housing costs and transportation issues.
To the extent that the Comox Valley has relatively more affordable house prices and
available jobs, this could make the area more attractive. However, if the area’s house
prices also accelerate as elsewhere in BC, there may only be a limited advantage to
migrate into the area.
The 2015 VanCity report Help Wanted: salaries, affordability and labour exodus in Metro
Vancouver, among its conclusions, states that Metro Vancouver’s housing crisis will
motivate Millennials to migrate away in search of better opportunities.
The 2014 reports in Metro Press Metro Votes: Young Vancouverites Fleeing to More
Affordable Pastures cites Statistics Canada numbers the Vancouver region is losing
residents aged 20 to 30 to other provinces; resulting in a net loss of 1,571 residents in that
age group in 2013 and 770 leaving the year before. Certainly the Comox Valley is more
affordable for families than Metro Vancouver.
Anecdotally, locals have also identified Alberta oil patch workers locating their families in
Comox Valley and commuting to work by convenient air services from here to Alberta.
5.7 POPULATION PROJECTIONS
5.7.1 General Population.
BC Stats projects future population, including population at the school district level. British
Columbia provincial-level Population Projections, referred to as P.E.O.P.L.E., is a model that
generates population figures based on trends and assumptions of future trends for the factors
described in the previous section. P.E.O.P.L.E. population projection for the Comox Valley
shown below in Figure 5.7.1a, were generated by BC Stats in August 2017, an update from
the previous May 2015 version.
This August 2017 update still does not appear to take into consideration the 2016 Census.
The update P.E.O.P.L.E. projection including the 2016 Census will become available in early
2018 and will provide estimates from July 2017 onward over the projection period to 2041. At
that time, these projections may require adjustment. On a very general level, the projected
population shown for 2016 in Figure 5.7.1a as the starting point for the 2016 – 2041 period, is
very close to the actual preliminary 2016 Census figure for Comox Valley RD - the difference
is just 1,680. Therefore, the BC Stats projection used as the base was corrected by this
difference and may be used with a high level of confidence, subject to future updating.
Page 29 of 52School District 71 (Comox Valley) – Long Range Facilities Plan 2018 – 2027 BOARD REPORT
Figure 5.7.1a ‐ Chart 12: PEOPLE 2017
Population Projection
90000
85000
80000
Population
75000
70000
65000
60000
2016 2021 2026 2031 2036 2041
Year
Population projections for the Aboriginal population are available at the national and provincial
levels, but not at the community level. The Cumberland Official Community Plan (OCP) includes
a graph for Aboriginal and Non-Aboriginal population growth shown in Figure 5.7.1b. It is based
on a growth rate of 6% in the Aboriginal community and 3% in the general population.
Figure 5.7.1b - Graph from the Cumberland OCP
.
Page 30 of 52School District 71 (Comox Valley) – Long Range Facilities Plan 2018 – 2027 BOARD REPORT
5.7.2 School Age Population Projection
School ages are typically encompassing Census data ranging between 5 to 19 years of age.
Thus the census categories of ages 5 to 9 years, 10 to 14 years, and 15 to 19 years are
assessed in this section.
Knowing the number of students in these five year age groups allows understanding of the
numbers of students that flow through the system and provide the capacity to accommodate
them.
Tracking the trend for the preschool groups is valuable in determining the capacity for each year’s
incoming kindergarten.
The figures for the Comox Valley generated by the PEOPLE model are shown in Table 5.7.2a
below and graphed in Figures 5.7.2a and b. Once the provincial PEOPLE projections are
updated, these projections may require adjustment.
Table 5.7.2a - Preschool and School Age Population Projections
Under 5 5 to 9 10 to 14 15 to 19
Years
Years years years years
2016 2,804 3,116 3,046 3,441
2017 2,715 3,173 3,097 3,380
2018 2,691 3,184 3,125 3,336
2019 2,718 3,185 3,208 3,202
2020 2,770 3,114 3,341 3,194
2021 2,820 3,107 3,382 3,221
2022 2,890 3,063 3,450 3,246
2023 2,961 3,062 3,480 3,266
2024 3,026 3,121 3,499 3,338
2025 3,078 3,194 3,444 3,459
2026 3,118 3,275 3,449 3,504
2027 3,146 3,357 3,417 3,575
Page 31 of 52School District 71 (Comox Valley) – Long Range Facilities Plan 2018 – 2027 BOARD REPORT
Page 32 of 52School District 71 (Comox Valley) – Long Range Facilities Plan 2018 – 2027 BOARD REPORT
5.8 ABORIGINAL STUDENT POPULATION
The Ministry of Education’s report Aboriginal Report 2010/11 - 2014/15 How Are We Doing?
reports on the Aboriginal populations within various School Districts in BC. Between 2004/5 and
2014/15, the Aboriginal student population was fairly steady, having an average of 1,372
students. In terms of the school population, the Aboriginal students have been slightly increasing
as a percent of the overall school population, due to the higher fertility rate of the Aboriginal
population compared to Canada as a whole. Aboriginal students in SD 71 make up a higher
percentage of the overall school population in comparison to British Columbia as a whole, as
shown in Figure 5.8 below:
Figure 5.8
5.9 HOUSING AVAILABILITY
Residential Building Permits. Housing construction in the Region by type of dwelling unit
(single family houses, row housing and apartments) is shown in Figures 5.9a and b.
The number of dwelling units constructed peaked about 2010 (371 starts) and 2011(356 starts),
dipped down and began to rise steadily from 2013 (204 starts) returning and exceeding the 2010
peak in 2015 (361 starts) and 2016 (434 starts).
Page 33 of 52School District 71 (Comox Valley) – Long Range Facilities Plan 2018 – 2027 BOARD REPORT
Most of the units constructed are single family. Apartments outpaced Single Family construction
starts in 2015, returning to their more historical levels in 2016. This 2015 peak may be due to
large projects such as Veyron in Courtenay.
Row housing makes up a very small proportion of the overall number dwelling units constructed.
Figure 5.9a
In the six year period between 2010 and 2016, Courtenay has had more dwelling units
constructed than in each of the other communities and the rural areas of the Comox Valley,
except in 2009 when Comox led in the number of dwelling units constructed. The Rural Area and
Comox are in the mid-range and Cumberland had the least number of new dwelling units
constructed. The distribution of new dwelling units by municipality is shown in Figure 5.9b.
Page 34 of 52School District 71 (Comox Valley) – Long Range Facilities Plan 2018 – 2027 BOARD REPORT
Figure 5.9b
Figure 5.9c in the full LRFP report demonstrates that the majority of dwelling units are
constructed in the urban areas. Construction in the rural area has been relatively stable over the
six year period of 2009 to 2016, averaging 27.2% of all dwelling units constructed in the Comox
Valley.
6. ENROLMENT PROJECTIONS AND SCHOOL CAPACITIES
6.1 The Demographic Analysis in Section 5 leads us to the following conclusions as they affect
public school enrolments:
a. School age population growth will be very low compared to previous forecasts and
optimistic municipal housing scenarios. General population growth will mostly occur in
empty-nest families (singles and retirees);
b. The slow increases in school age population will occur mainly in the urban areas of
Courtenay and Comox and the village of Cumberland, while rural schools enrolments will
remain stable;
c. New housing developments, such as in West Courtenay, especially the Arden area, are
more likely to result in a shift of students within the district rather than an overall increase
(greater than our forecast);
d. Unforeseen new employment opportunities, not currently identified, are the only factors
which could result in a future influx of families with school-age children.
Page 35 of 52School District 71 (Comox Valley) – Long Range Facilities Plan 2018 – 2027 BOARD REPORT
6.2 The previous SD 71 Enrolment Projection was based on Baragar Demographics and was
previously used for all the analysis during the 2015/2016 public consultation related to
recommendations flowing from the previous 2012 Long Range Facilities Plan. That
enrolment projection was provided as Figure 6.2 in the full LRFP report.
6.3 That previous Enrolment Projection showed the student population increase or decrease for
each school by year. The simplified graph in Figure 6.3 summarizes the expected % change
for the district using that Baragar Demographics models. It should be noted that these
models do not include “local factors” such as employment opportunities, housing availability,
new developments, opening of new private schools, etc.
Figure 6.3 – 2015 Baragar Demographics Percentage Enrolment Changes
Baragar Enrolment Projection % Change
2.50%
2.00%
1.50%
1.00%
0.50%
0.00% Elem % Change
‐0.50% 2016 2017 2018 2019 2020 2021 2022 2023 2024 2025 2026 2027 Secondary % Change
‐1.00%
District Total % Change
‐1.50%
‐2.00%
‐2.50%
‐3.00%
Years
6.4 Analysis of three different enrolment projections for the Comox Valley for the next five and
ten years show wildly varying percentage changes for the elementary and secondary school
populations. Figure 6.4 – Previous Projections Enrolment Changes
Page 36 of 52School District 71 (Comox Valley) – Long Range Facilities Plan 2018 – 2027 BOARD REPORT
Note that the 2012 LRFP and Baragar Demographics predicted declining elementary
enrolment and increasing middle and secondary enrolment. On the other hand, BC Stats
predicted growth in elementary school age population and a decline in secondary school age
children.
6.5 The work in this strategic study indicates a need for a new Enrolment Projection,
discarding both the previous version from the 2012 LRFP, the Baragar projection from 2015,
and BC Stats which was based on the 2011 Census. The new Enrolment Projection is
presented in Figure 6.5a and b below.
Figure 6.5a – Proposed Percentage Enrolment Changes
ENROLMENT PROJECTION % BY CASCADE IN 2017
ELEMENTARY & MIDDLE SECONDARY DISTRICT
YEAR URBAN GROWTH AVERAGE OF
RURAL URBAN
ELEM & AREA ALL
ELEM SECONDARY
MIDDLE ELEM/MID SCHOOLS
2017 1.80% 2.60% 3.38% 0.50% 2.07%
2018 1.80% 2.00% 2.60% 2.00% 2.10%
2019 1.70% 1.90% 2.47% 1.10% 1.79%
2020 1.40% 1.70% 2.21% 0.75% 1.52%
2021 1.20% 1.40% 1.82% 0.50% 1.23%
2022 1.00% 1.30% 1.69% 0.40% 1.10%
2023 1.00% 1.30% 1.69% 0.30% 1.07%
2024 1.00% 1.25% 1.63% 0.40% 1.07%
2025 0.90% 1.20% 1.56% 0.60% 1.07%
2026 1.00% 1.30% 1.69% 0.70% 1.17%
2027 1.00% 1.30% 1.69% 0.80% 1.20%
2028 1.00% 1.30% 1.69% 0.90% 1.22%
Notes
1. Use Urban Elem % to generate enrolment forecast for Cumberland
Community School for all grades.
2. Use Growth Area % (Elem/Mid) for identified areas of housing growth, eg.
West Courtenay area: Arden El, Courtenay El, Puntledge El, Lake Trail Middle.
Page 37 of 52School District 71 (Comox Valley) – Long Range Facilities Plan 2018 – 2027 BOARD REPORT
Figure 6.5b – Proposed Enrolment Forecast
Page 38 of 52School District 71 (Comox Valley) – Long Range Facilities Plan 2018 – 2027 BOARD REPORT
6.6 Capacity Utilization
6.6.1 The Ministry of Education manages the province-wide school infrastructure needs by
examining Capacity Utilization, the percentage of occupancy compared to building capacity.
Nominal versus Operating Capacity. Historically the Ministry established a school “Nominal
Capacity” based on 25 students per classroom for Grades 1 – 12 and did not include
Kindergarten. It was excluded because at that time it was a half-day program. This has
changed with full day kindergarten which has resulted in more blended classes such as K-1
across the province. Nominal capacity now includes the Kindergarten classrooms.
The Operating Capacity is the effective capacity of the school recognizing mandated
maximum class sizes of 25 students for Grades 4 – 12, 21 students for Grades 1 – 3, and 19
students for Kindergarten. To determine Capacity Utilization, the Nominal Capacity of a
school is used. The Ministry record of Nominal Capacity of a school can be amended by
submission of a Design Aid Sheet for the school, showing the feasible usage of all spaces.
The lower the capacity utilization, the less efficiently a district is using its facilities. The
district is maintaining, heating, and cleaning “unoccupied” space. The Ministry calculates this
for every school as well as for the total district.
6.6.2 The Ministry clarified its target capacity utilization factors in the 2016/2017 Capital Plan
Instructions issued in June 2016. For School District 71 (Comox Valley) the target average
across the district was 85% capacity utilization. However, the threshold to a higher utilization
factor of 90% is a district enrolment total of 7,500 students, which will occur during the life of
this Long Range Facilities Plan. The Ministry instructions state: “for most areas, a forecast of
10 years is the standard for anticipating growth and should be included when assessing
utilization.”
On September 27th, 2016, the Ministry issued a letter to school districts removing the District
Average Capacity Utilization Guideline Table from the Capital Plan Instructions, and stated
that districts still have to optimize available space to alleviate capital investment needs.
Therefore it is important to report capacity utilization, especially in neighbouring schools,
when seeking approval for a space related project.
6.6.3 Current Capacity Utilization factors in Comox Valley schools in 2017/2018 are shown in
Figure 6.6.3a as follows:
Page 39 of 52School District 71 (Comox Valley) – Long Range Facilities Plan 2018 – 2027 BOARD REPORT
Page 40 of 52School District 71 (Comox Valley) – Long Range Facilities Plan 2018 – 2027 BOARD REPORT
The impact of a district being below the Ministry capacity utilization factor is that priority for
capital projects from that district can be reduced when the Ministry assesses competing
district submissions. To have capital projects accepted into the funding approval flow, it is
very desirable to exceed the Ministry capacity utilization. Currently the target is 85% for SD
71, but once enrolment reaches 7500 students the target will be 90%.
Creating Two Zones: Urban and Rural. It is recognized by the Ministry of Education that in
isolated rural communities, the under-utilized school cannot be closed. It is a vital part of the
community infrastructure and supports more than just the K – 12 education services. The
2016/2017 Capital Plan Instructions issued June 2016 state “While utilization guidelines are
intended to be applied as an average across the school district, they may also be applied at a
“sub-district” level due to unique geographic features … or at a “family of schools” level
where there are extremes in enrolment variances across the school district.”
It is appropriate to consider Capacity Utilization in two separate zones in SD 71: urban and
rural. The rural schools will likely never reach their capacity, but cannot be considered for
closure as they are essential components of the community.
Using two zones, the Capacity Utilization is shown in Figure 6.6.3b of the full LRFP report.
The Urban Zone achieves the target utilization of 85%, while the Rural Zone remains just
under which is acceptable for school populations of less than 1,500 students.
Notwithstanding the 2016 relaxation of the requirements for achieving the target utilization
levels, Ministry staff indicate that space-related capital projects will still be assessed against
capacity availability in other schools in the district.
Capacity utilization in the secondary schools is unbalanced. This could be improved
between the three schools by any or all of the following measures: boundary adjustments,
feeder school assignments, or relocation of programs of choice.
6.6.4 Enrolment vs Capacity. Within the Families of Schools, grouped into families based on
the secondary schools and Lake Trail Middle, it is useful to compare current and future
enrolment against the school Operating Capacity. See Figures 6.6.4a and b.
Page 41 of 52School District 71 (Comox Valley) – Long Range Facilities Plan 2018 – 2027 BOARD REPORT
Figure 6.6.4a – Elementary Capacity vs Enrolment – Current Organization (Sep 2017)
Note that most of the current excess capacity exists in the elementary schools which feed
Georges P Vanier Secondary. However it must be acknowledged that this excess capacity
mostly exists in the two rural schools on Denman and Hornby Islands.
The schools feeding Mark Isfeld Secondary will reach capacity late in this 10 year planning
period.
Page 42 of 52School District 71 (Comox Valley) – Long Range Facilities Plan 2018 – 2027 BOARD REPORT
Figure 6.6.4b – Secondary Capacity vs Enrolment – Current Organization (Sep 2017)
Page 43 of 52School District 71 (Comox Valley) – Long Range Facilities Plan 2018 – 2027 BOARD REPORT
7. ANALYSIS OF EDUCATIONAL NEED
7.1 Comox Valley School District serves a relatively compact geographic area, with the
population concentrated in the two urban centres of Courtenay and Comox. The Village of
Cumberland is an area transitioning from rural to urban, with Cumberland Community School
providing excellent education opportunities in the elementary and middle grades. The rural
areas to the north and south of these centres are served by small elementary schools. In
particular Hornby and Denman Islands, connected to the main Vancouver Island by car
ferries, are each served by their own elementary school. These two schools are important
social centres for the two islands, and must be retained to serve at least the younger grades
of the local population. Miracle Beach Elementary and Royston Elementary similarly serve
small rural communities and provide important social centres for the communities to the north
and south of the urban area.
7.2 There is operating and organizational flexibility available to the district in considering
adjusting the catchment areas of some schools and district programs. Similarly, given the
relative proximity of the three secondary schools, there are some opportunities to change the
assignment of feeder elementaries to particular secondaries and to vary the program
offerings at the three secondaries to influence student enrolment choice.
7.3 Elementary. Looking at the elementary enrolment versus capacity in Figure 6.6.4a, the
group of most concern comprises those schools currently feeding GP Vanier Secondary.
This also includes Lake Trail Middle which feeds Vanier after Grade 9.
7.4 Middle and Secondary. Considering the secondary situation in Figure 6.6.4b, the total
capacity of the three secondary schools combined is adequate to accommodate the
secondary population over the coming ten years. This is definitely the case if the two existing
middle schools (Lake Trail and Cumberland Community School) continue to accommodate
Grades 8 and 9. Individual overcrowding, such as in Mark Isfeld Secondary, could be
addressed by catchment boundary adjustments, relocation of choice programs between the
secondaries, and by a future addition to the school. Furthermore some pressure on the
secondary schools could be reduced by increasing enrolment at:
Lake Trail Middle (by adjusting its catchment boundaries and/or adding another feeder
elementary) to improve its capacity utilization; and/or
Cumberland Community School Grades 7 – 9 (by adjusting its catchment boundaries).
7.5 Phasing Out Middle Schools. If the Board wishes to phase out one or both of the
remaining middle schools in the district (Lake Trail Middle and Cumberland Community
School senior grades), accommodating those Grade 8 and 9 in the secondary schools is
problematic and will require more portable classrooms or a permanent addition to at least one
of the secondaries. Currently the Grade 8 - 9 students at Lake Trail and Cumberland could
Page 44 of 52School District 71 (Comox Valley) – Long Range Facilities Plan 2018 – 2027 BOARD REPORT
be accommodated in the 285 surplus spaces in the existing secondary schools, but this
situation would quickly become untenable.
7.6 Improving Capacity Utilization. The following schools, as seen in Section 6.6.3, are very
under capacity:
Airport Elementary
Courtenay Elementary
Denman Island Elementary
Hornby Island Elementary
Lake Trail Middle
Some strategies for improving the use of these schools include:
a. Relocating district programs from more crowded schools;
b. Adding another French Immersion program;
c. Closing part of a school building to all access and adjusting the official capacity with the
Ministry via submission of a “Design Aid Sheet”;
d. Introducing or moving a Strong Start program;
e. Leasing out the surplus space;
f. In the case of Lake Trail Middle, redirecting one or more additional elementaries to feed
this middle school.
7.7 District Program Location. During the development of this LRFP, consideration was given
to moving the district programs located at the former Tsolum School: namely North Island
Distance Education (NIDES) (K – 12) and Fine Arts e-Cadamy (FAE) (K – 8).
The FAE program at NIDES uses 6 classrooms and a music room. If relocation to another
facility was desirable, there are three location options that could provide the needed physical
space:
a. Courtenay Elementary – there are 6 rooms that are not core instruction at the
school. They are dedicated to Strong start, Aboriginal head start, Challenge, and
Boost. It would be very difficult to pull those services from that school. Furthermore
this school is in the West Courtenay area which is the fastest growing enrolment
area in the district. Therefore Courtenay Elementary space will be needed for future
enrolment growth;
b. Highland Secondary – there could be 6 rooms made available. However the
majority of the FAE students are elementary age students. Not an appropriate
location in a high school;
Page 45 of 52You can also read


