Limited Pay-Out Machines (LPM) Distribution Study in the Eastern Cape
←
→
Page content transcription
If your browser does not render page correctly, please read the page content below
1 | EASTERN CAPE GAMBLING BOARD LPM DISTRIBUTION STUDY – FINAL REPORT

Please cou

                           Eastern Cape Gambling Board

                           Limited Pay-Out Machines (LPM)
                           Distribution Study in the Eastern Cape

                           July 2020 – Final Report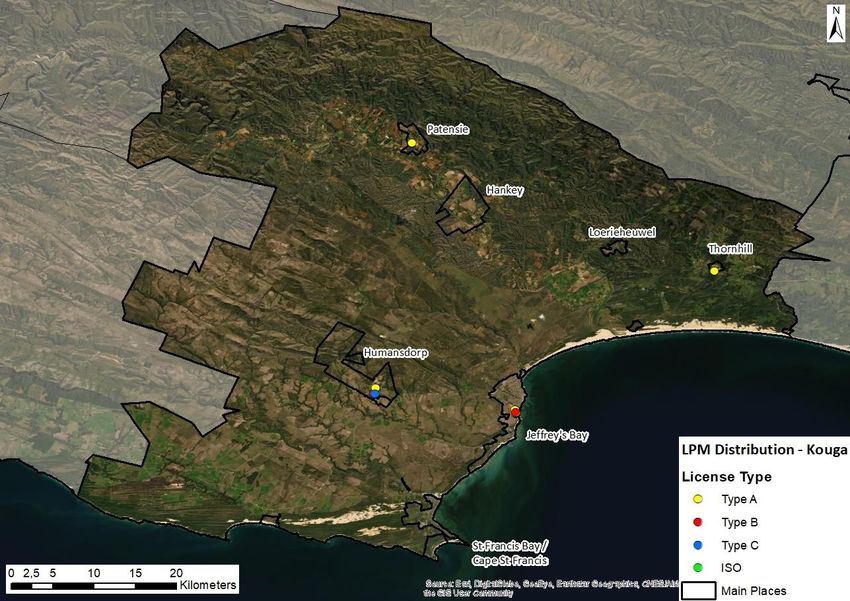
1 | EASTERN CAPE GAMBLING BOARD LPM DISTRIBUTION STUDY – FINAL REPORT

CONTENTS
1.   INTRODUCTION ................................................................................................................................................................... 3

              Scope of Work ........................................................................................................................................................... 3

              Spatial Parameters of the Study ......................................................................................................................... 4

              Report Structure ....................................................................................................................................................... 6

2.   METHODOLOGY .................................................................................................................................................................. 7

              Concentration Analysis .......................................................................................................................................... 7

              Saturation Analysis .................................................................................................................................................. 7

              Methodological Approach ................................................................................................................................... 8

              Methodology Limitations ..................................................................................................................................... 9

                   Leakages ...............................................................................................................................................................10

                   Injections ..............................................................................................................................................................10

                   Leakages and Injections in this Study .......................................................................................................10

3.   SOCIO-ECONOMIC INDICATORS ...............................................................................................................................12

              Number of households in each area and household growth rate .....................................................12

              Annual household income (inflation adjusted) ..........................................................................................12

              Propensity and gambling expenditure per income group ....................................................................12

              Existing LPM GGR, per LPM GGR, and LPMs per area .............................................................................13

              GGR Distribution across Gambling Modes & LPM GGR Capture Rate .............................................14

              Socio-Economic Indicator Summary ..............................................................................................................15

              Methodological Process Utilising the Indicators .......................................................................................16

4.   SPATIAL DISTRIBUTION OF LPMS (LPM SUPPLY) ................................................................................................18

              Buffalo City Metropolitan Municipality .........................................................................................................18

              Nelson Mandela Bay Metropolitan Municipality .......................................................................................19

              Kouga LM ..................................................................................................................................................................20

              Gambling Distribution in the Eastern Cape .................................................................................................21

              LPM Site Closures ..................................................................................................................................................22

5.   LPM CONCENTRATION ANALYSIS .............................................................................................................................23

              Alfred Nzo District LPM Concentration Analysis .......................................................................................23

              Amathole District LPM Concentration Analysis .........................................................................................25

              Chris Hani District LPM Concentration Analysis ........................................................................................27

              Joe Gqabi District LPM Concentration Analysis .........................................................................................29

              OR Tambo District LPM Concentration Analysis .......................................................................................31

              Sarah Baartman District LPM Concentration Analysis .............................................................................33
2 | EASTERN CAPE GAMBLING BOARD LPM DISTRIBUTION STUDY – FINAL REPORT

                  Buffalo City Metropolitan LPM Concentration Analysis .........................................................................36

                  Nelson Mandela Bay Metropolitan LPM Concentration Analysis .......................................................36

                  Spatial Analysis of LPM Concentration ..........................................................................................................38

                  Impact of COVID-19 on Gambling Spend ....................................................................................................39

                            Steep but Short-Lived Downturn ..........................................................................................................40

                            Prolonged Pandemic and Delayed Rebound....................................................................................40

                            Worst Case Scenario ...................................................................................................................................41

6.      LPM SATURATION ANALYSIS .......................................................................................................................................42

7.      SOCIO-ECONOMIC IMPACTS OF LPM ROLL-OUT...............................................................................................44

                  Impact Indicators ...................................................................................................................................................44

                  Impact Summary ....................................................................................................................................................48

8.      CONCLUSION .....................................................................................................................................................................50

References .....................................................................................................................................................................................51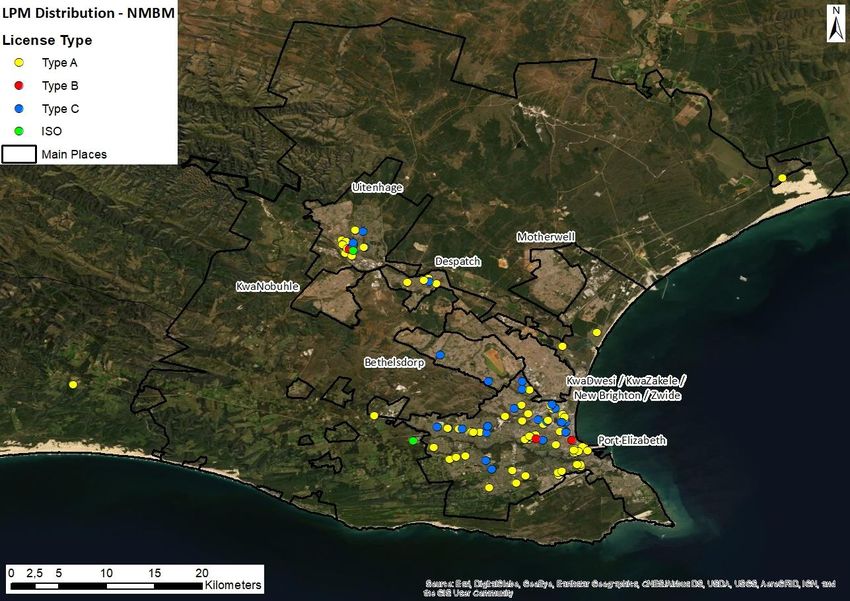
3 | EASTERN CAPE GAMBLING BOARD LPM DISTRIBUTION STUDY – FINAL REPORT

1. INTRODUCTION
Urban-Econ Development Economists were appointed by the Eastern Cape Gambling Board (ECGB) to

undertake an independent desktop study to investigate Limited Pay-out Machine (LPM) Distribution
within the Eastern Cape. This study is intended to inform the future allocation of LPM gambling

licences in the Province. This will assist the Board to oversee and monitor equitable allocation and
distribution of gambling activities in communities across the Province.

         Scope of Work

This scope of work was defined predominantly from the original Terms of Reference (ToR) issued by
ECGB, as well as consultation with the ECGB through the inception phase and through the Service
Level Agreement (SLA).     This study aims to assist the Board in allocating and distributing LPM

gambling licences in different areas of the Province in compliance with the regulatory requirements.

The study developed a quantitative methodology and approach to assessing existing or potential

over-concentration of LPMs in each area within the local municipalities (LMs) and metropolitan

municipalities of the Eastern Cape Province, having considered, amongst others, the following factors:

In respect of the decision to permit the roll-out of a further 400 LPMs in the Province for independent

site operators:

    •   assess whether the roll-out of the additional 400 LPMs had led to the over-saturation of LPMs

        in the Province;
    •   assess the social, economic, and environmental impact and the impact on problem gambling

        of the existing 2 000 LPMs and the roll-out of the additional LPMs in the Province; and
    •   consider any other relevant information on whether the roll-out of the additional LPMs was in

        the best interest of the Province.

In respect of the allocation of the 2 400 LPMs in specific areas of the Province, the study assessed
existing and potential – over-concentration of LPMs in each area within the local and metropolitan
municipalities having considered, amongst others, the following:

    •   the outcomes and recommendations of the 2015 LPM study and any other relevant research;

    •   the number, geographical location, and proximity to each other of existing gambling modes,
        particularly LPM sites, casinos and bingo outlets, in various areas within local and
        metropolitan municipalities across the Province;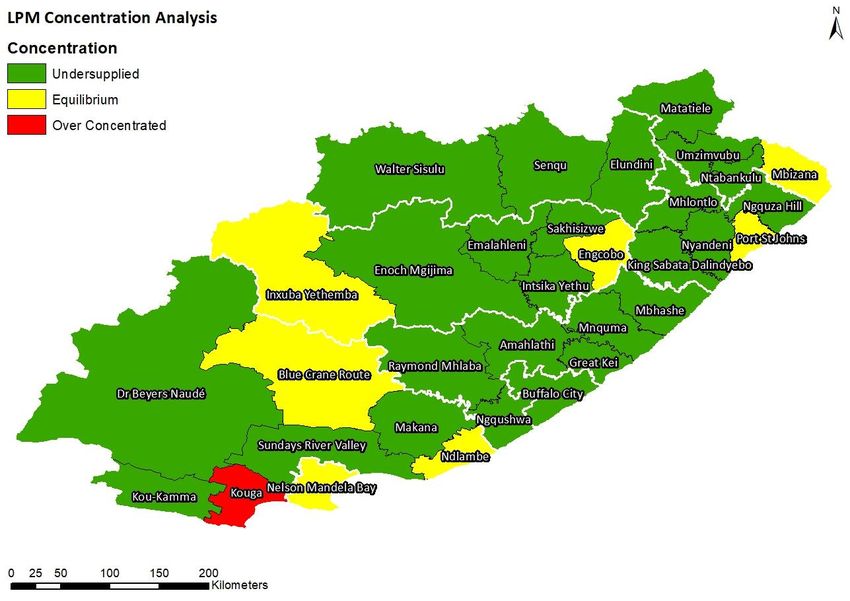
4 | EASTERN CAPE GAMBLING BOARD LPM DISTRIBUTION STUDY – FINAL REPORT

    •      the adequacy of the geographical location and distribution of current licensed gambling
           activities across the Province, taking into account socio-economic factors and alignment to

           provincial development outcomes;

    •      demand-side socio-economic indicators/factors considered include personal income,

           population, population density, propensity to gamble, participation variances in LPM
           gambling, urban/rural locality factor, expenditure on gambling;

    •      supply-side socio-economic indicators/factors considered include: regional outlier factors, i.e.

           historic gambling trends in each area, the influence of other existing gambling modes in each
           area (excl. LPMs), realised existing gross gaming revenue (GGR) turnover per area; and
    •      the potential social, economic, and environmental impact and the impact on problem

           gambling of the existing allocation of 2 400 LPMs and on the roll-out of the additional LPMs

           in the Province.

This report also takes into account the 2015 report which recommendations were considered by the

ECGB to be flawed. The 2015 study’s methodology and analysis were considered to be too broad and

could not necessarily support the outcomes and recommendations that were being suggested. Thus,
this report attempts to rectify this utilising a “mixed-method” approach in determining the

concentration and saturation of LPMs in the Province.

           Spatial Parameters of the Study

In order to perform the modelling at the required spatial dimensions within the Province, it was

necessary to define the terms “concentration” and “saturation” for this study. These are as follows:

    •      Concentration - the assessment of the distribution of LPMs at a regional or local level.
    •      Saturation - the assessment of the number of playable LPMs at a provincial level.

These definitions have thus, necessitated the development of two separate segments of the modelling

process.

For this study, it was important to consider the spatial parameters where data analysis was performed.

The study aimed to examine each metropolitan municipality and LM at a nodal level. Nodes are areas
of significant population compared to the surrounding areas. These urban areas are normally

classified as towns or large villages. For this analysis, nodes were determined by utilising the Municipal
Demarcation Board’s ‘main place’ spatial divisions. Main place spatial divisions can be utilised to

obtain personal and household data of residents. Using this definition, nodes were determined for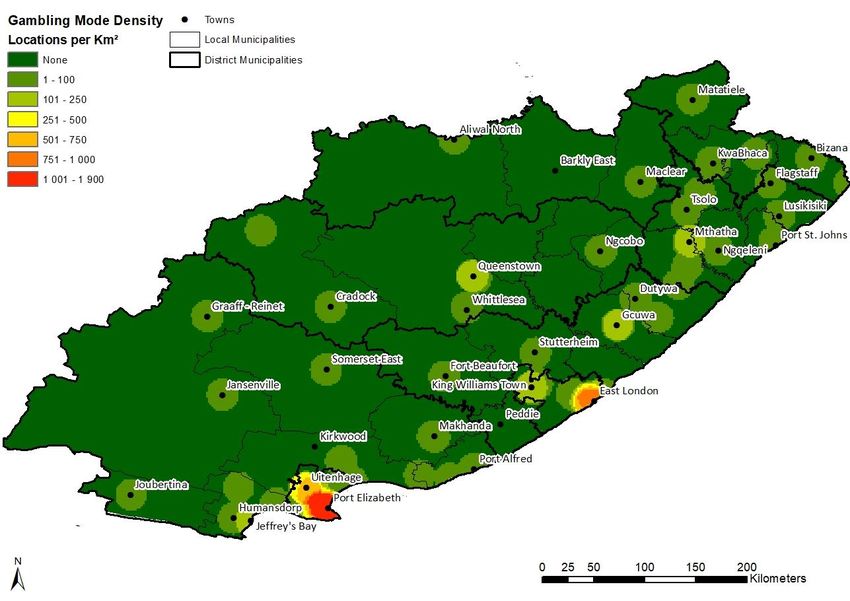
5 | EASTERN CAPE GAMBLING BOARD LPM DISTRIBUTION STUDY – FINAL REPORT

each LM and metropolitan municipality in the Province. Some LMs (Makana, Ntabankulu, Mbashe)only
have a single major node where the population resides with the remainder spread out in the rural

periphery. Other LMs and metropolitan municipalities have multiple nodes where the population

resides (Kouga, Beyers Naude, Matatiele). For Nelson Mandela Bay, the main place nodes included

Port Elizabeth, Uitenhage/Despatch/KwaNobuhle, Motherwell, Bethelsdorp           and   KwaDwesi /
KwaZakele / New Brighton / Zwide. Buffalo City included the areas of East London (including the

coastal areas of Gonubie, Kidds Beach), Mdantsane (including Berlin), King William’s Town/Bhisho

(including Zwelitsha) and Dimbaza (including surrounding villages).

The analysis also included the examination of outlying rural areas beyond the nodal areas which were

then classified as the “remainder areas” of the municipality. These are typically described as rural

areas, farms, hamlets, and small villages.
6 | EASTERN CAPE GAMBLING BOARD LPM DISTRIBUTION STUDY – FINAL REPORT

        Report Structure

The remainder of the report is structured under the following headings:

                                        Discussion of the method used to determine concentration
      Methodology                       and saturation, including the methodology limitations, the
2                                       methodological approach and processes used.

                                        Identification of the key economic indicators of the areas
      Socio-economic Indicators
3                                       where the LPMs are located.

      Spatial Distribution of LPMs
 4    (LPM Supply)
                                        Geographical distribution of LPMs in the Province.

                                        Determination of the distribution of LPMs at a regional
      Concentration
5                                       level in the Eastern Cape.

                                        Determination of the distribution of LPMs at a provincial
6     Saturation
                                        level in the Eastern Cape.

      Socio-economic Impacts of         Determination of the socio-economic and environmental
7     LPM Roll-Out                      impacts of LPM gambling in the Eastern Cape.

8     Conclusion                        Consolidation of the findings of the report.
7 | EASTERN CAPE GAMBLING BOARD LPM DISTRIBUTION STUDY – FINAL REPORT

2. METHODOLOGY
This chapter discusses the method used to determine LPM concentration and saturation, including

concentration analysis, saturation analysis, methodology limitations, the methodological approach
and processes used.

         Concentration Analysis

The concentration analysis involved the assessment in distribution of LPMs at a regional or local level.

It comprised the steps highlighted in Figure 1.1 below.

Step 1: Potential Analysis           Step 2: Gap Analysis                 Step 2a: Spatial Analysis
• Determination of total potential   • Determination of     the gap       • Spatial   representation of
  GGR for each urban node and          between potential and realised       existing LPMs within metros
  for metros and LMs                   LPM GGR                              (multi-nodal areas)

Figure 2.1: Concentration Analysis Steps

Step 1: Involved the determination of the total potential Gross Gambling Revenue (GGR) for each
        urban node and for the entire metropolitan and LM area.

Step 2: Involved utilising existing realised LPM GGR data supplied by ECGB at a local level to

        determine if a gap exists between potential and realised GGR.

Step 2a: Included a spatial analysis of the locations of LPMs for metropolitan areas.

LPM concentration was analysed based on the total demand for gambling at a nodal level for each
metropolitan municipality and LM. Demand was then compared to the current supply of LPMs, and

other modes present in each LM and metropolitan municipality.

         Saturation Analysis

The saturation analysis involved assessing the potential gap of LPMs across the Province using the
steps in Figure 1.2 below.
8 | EASTERN CAPE GAMBLING BOARD LPM DISTRIBUTION STUDY – FINAL REPORT
Figure 1.2: Saturation Analysis
Step 1: Potential Analysis Step 2: Gap Analysis
• Determination of the total potential • Comparison of the total potential
LPM GGR at a provincial level GGR and the realised GGR from the
based on the modelling province
Step 1: Involved determining of the total potential LPM GGR at a provincial level based on the
modelling.
Step 2: Involved the comparison of the total potential GGR and the realised GGR from the Province.
Saturation thus represented the accumulated “gap” between demand versus supply for all
municipalities in the Province informing future licence decisions for LPMs at a provincial-wide level.
Methodological Approach
The methodological approach to this study took the form of a model that quantifies the potential GGR
of LPMs in local and metropolitan municipal areas and the Province as a whole. This data was
compared to realised GGR figures provided by ECGB at a provincial and municipal level to determine
and quantify the gap between potential and realised LPM GGR. A GGR per LPM was determined from
supplied data, and the potential number of LPMs in the area could be determined. This was then
compared to the existing operational supply of LPMs in the local area and the number of licences
granted for the given area. The process of determining the gap of GGR and LPMs can thus be
considered balancing the demand of LPMs with the supply. The diagram below indicates the process
mentioned above. The diagram thus indicates that a demand for LPMs that is greater than the supply
will result in an under-supply of LPMs at the provincial or local municipal level while a supply of LPMs
that is greater than the demand will result in an overconcentration or saturation of LPMs in the
provincial or local municipal area.9 | EASTERN CAPE GAMBLING BOARD LPM DISTRIBUTION STUDY – FINAL REPORT
Figure 2.3 Methodological Approach
An illustrative example of the model used in the study is depicted in the figure below. The
methodology outlined in this section was used to determine the concentration and saturation of LPMs
in each respective study area.
Figure 2.4: Illustrative Example of the Model
Methodology Limitations
As a result of the desktop nature of the study, two primary limitations existed: the examination of
leakages and injections.10 | EASTERN CAPE GAMBLING BOARD LPM DISTRIBUTION STUDY – FINAL REPORT
Leakages
Leakage refers to capital or income that exits a system or economy rather than remaining within it. In
this study, leakages represent the expected net outflow of gambling activities from a local economy.
In other words, potential gamblers who choose to use gambling facilities/modes outside of their place
of residence. This expenditure outside of the boundaries of their local economy contributes towards
an expenditure leakage.
Injections
Injections are variables in a system or economy that add to the flow of capital or income. Injections, in
the case of this study, occur when gamblers from outside the boundaries of a defined node partake in
gambling in a particular node.
Leakages and Injections in this Study
To ascertain the level of leakages and injections into an area, primary data would need to be collected
to understand these movement and expenditure patterns amongst gamblers. The figure below
indicates how leakages and injections occur and how they were considered for LMs and metropolitan
municipalities.
Figure 2.5: Leakages and Injections
LMLM
LM
Metro
As a desktop study relies on secondary data, there was limited understanding of injections and
leakages in certain areas, with specific reference to the metropolitans. Movement and spending11 | EASTERN CAPE GAMBLING BOARD LPM DISTRIBUTION STUDY – FINAL REPORT patterns are not limited to the areas within which people reside and are thus not captured in the model. For example, in the Nelson Mandela Bay it is a common phenomenon for residents of Motherwell and KwaDwesi / KwaZakele / New Brighton / Zwide to undertake recreational spend in other areas such as Central and Walmer. In addition, residents of surrounding LMs chose to undertake recreational spend. Hence, it is difficult to allow for injections and leakages. Thus, there is need to be cognisant of this phenomenon when examining the data for the metropolitan areas. It is recommended that primary research be undertaken in the future as this study did not take into account the effects of tourism for business or leisure on gambling activities in Buffalo City and Nelson Mandela Bay. In the case of LMs, some residents who live in one municipality may not opt to visit the main node in their own municipality and may, in fact, utilise another node in another municipality. An example may be that residents of Libode (Nyandeni LM) may choose to spend their recreation budget on activities in Mthatha (King Sabata Dalindyebo LM) rather than Libode. This may be as a result of the distance to other nodes or the availability of services. These aspects differ from municipality to municipality and are not necessarily captured in the model. An in-depth primary investigation of such a phenomenon would be required to ascertain such local level details.
12 | EASTERN CAPE GAMBLING BOARD LPM DISTRIBUTION STUDY – FINAL REPORT

3. SOCIO-ECONOMIC INDICATORS
The methodology outlined in Section 2 indicated the different approaches used to determine the

concentration of LPMs at a local level and saturation of LPMs in the Province. A ‘mixed-method’
approach, accounting for a variety of economic and socio-economic indicators, was undertaken
including the number of households in each area, local household growth rate, annual household

income bracket, gambling expenditure per income group, existing GGR for the local area, average
GGR generated per LPM, number of LPMs per area, and current offering of other gambling modes. It
is thus, of great importance to examine and understand the indicators that form the basis of the
modelling process. The assumptions are discussed below.

        Number of households in each area and household growth rate

The number of households was utilised to determine the number of households per income group

residing in each urban area and the total number of households for each LM. The data was forecast

based on growth rate between Census 2001 and 2011 to estimate the current number of households.

To ensure reliability, this data was benchmarked with household numbers in the Stats SA Community

Survey 2016. The data utilised in these calculations was sourced from Stats SA Census 2001 and 2011.

        Annual household income (inflation-adjusted)

Household income was used to calculate total household disposable expenditure for a given area. The

proportion of population in each area was distributed across standardised income brackets (low

income, middle income, high income) and adjusted according to income group spending patterns
(NGB, 2012). The outcome was used in conjunction with propensity to gamble to determine the GGR

for an area (GGR demand).      The data utilised in these calculations was sourced from Census
2011(inflation-adjusted, 2020) and the NGB (2012 & 2017).

        Propensity and gambling expenditure per income group

Given the desktop nature of this study, it was necessary to apply a gambling propensity indicator

informed through prior studies. “Propensity to gamble is defined as the percentage of household

expenditure allocated to gambling” (Ligthelm & Mabaso, 2003). Due to the unavailability of exact data

on the propensity, this source has become a widely accepted industry norm of propensity which
eliminates the complexity of allocating expenditure between gamblers and non-gamblers, as well as
13 | EASTERN CAPE GAMBLING BOARD LPM DISTRIBUTION STUDY – FINAL REPORT
part-time social gamblers. The propensity value (household spend on gambling activities) of 0,97%
(NGB, 2017) chosen falls in line with household recreational spend data (5%) provided by StatsSA
(Census, 2011) for the Eastern Cape.
Propensity to gamble accounted for all gambling modes as well as “gamblers” and “non-gamblers”. It
was applied in conjunction with household disposable income to calculate potential GGR for each
study area. Gambling expenditure is the percentage of household income allocated to gambling as
per the household’s income group. Gambling expenditure is income-sensitive and varies between
0,92% and 1,02%, dependent on what income cohort the household is part of. Generally, more
affluent households spend a smaller proportion of their household income on gambling activities than
low-income households. The propensity data utilised in these calculations was sourced from the
National Gambling Board (NGB, 2017).
Existing LPM GGR, per LPM GGR, and LPMs per area
The ECGB is the custodian of GGR data at a provincial level. The GGR data is collated and aggregated
monthly for each gambling mode (casinos, bingo, LPM, betting). The ECGB also keeps data on the
location of these various modes as well as the number of LPMs that operate and are licenced. This
data was provided by the ECGB for the modelling process and was a key component in the
calculations of concentration and saturation. The number of LPMs was obtained from the supply
information received from ECGB (2019/20) for the study.
The LPM GGR data was aggregated for each area and was used to determine the existing supply of
LPM GGR per area. This LPM GGR data was then divided by the LPMs in the area to get a “per LPM
GGR”. This per LPM GGR was utilised to determine the LPM demand per area. Each area’s per LPM
GGR was analysed based on the provincial LPM GGR. If this value was considered an outlier (if it fell
above or below 20% of the provincial per LPM GGR) it was adjusted to the upper or lower bound
value of the provincial GGR.
It should be noted that LPM GGR data that was provided by the ECGB was adjusted (average of
previous 11 months was utilised) for the month of March 2020 data as a result of the state of disaster
caused by COVID-191.
1
COVID-19 is the infectious disease caused by coronavirus (a large family of viruses which may cause illness in animals or
humans). This new virus and disease were unknown before the outbreak began in Wuhan, China, in December 2019. COVID-19
is now a pandemic affecting many countries globally (WHO, 2020).14 | EASTERN CAPE GAMBLING BOARD LPM DISTRIBUTION STUDY – FINAL REPORT
GGR Distribution across Gambling Modes & LPM GGR Capture Rate
For this study, it was important to differentiate between different gambling modes and the
distribution of GGR in different municipal areas. Different municipalities fell largely into two
categories; those that had gambling activities present and those that did not.
• For the areas that had no gambling present, it was necessary to determine a likely LPM GGR
capture rate. This was based on the GGR distribution across gambling modes at a provincial
level. Based on the ECGB (2019/20) data, it was determined that LPMs contribute
approximately 17% to the total provincial GGR whilst nearly 48% was contributed by casinos.
However, in areas without any gambling, the introduction of LPMs would likely capture a
higher proportion to the potential GGR than the provincial average. In such instances, the
provincial average was adjusted to account for an increased LPM capture rate. The potential
LPM capture was then increased to 39% to account for such instances. This value was
determined by dividing the casino provincial proportion between LPMs and bingo gambling.
This was done because it was considered unlikely that additional casinos would be developed
in the Province, especially in smaller rural nodes. Bingo was important to consider as it is most
likely to compete with LPMs for households recreational spend where casinos were absent,
and it was considered more likely that bingo establishments would be established in smaller
rural nodes.
This value was utilised by areas such as Port St Johns, Mhlontlo, Ntabankulu and Matatiele
and other areas that had no gambling.
• For areas that had gambling present the current LPM GGR capture rate was utilised. The
capture rates varied between 7% and 51%.
The following table indicates the areas and their respective LPM capture rates.
Table 3.1: Areas and the Corresponding LPM Capture Rates
Areas LPM Capture Rates15 | EASTERN CAPE GAMBLING BOARD LPM DISTRIBUTION STUDY – FINAL REPORT
Bhisho/King William’s town 30,77%
Butterworth 22,21%
Cradock 24,76%
East London 16,63%
Jeffrey's Bay 29,37%
Lusikisiki 7,73%
Makhanda 45,03%
Mthatha 16,20%
Ngcobo 20,88%
Port Elizabeth 21,79%
Komani 19,74%
Uitenhage/Despatch/KwaNobuhle 51,78%
These values (both when gambling is present and when it is not present) account for other gambling
modes in a given area.
Additionally, it was determined that scenarios be developed to account for variations in the data that
may occur and natural variations in consumers’ demands. The model incorporated a 5% variation in a
“low” and “high” scenario on the LPM GGR capture value. This allowed the model to capture the
sensitivities of the local areas. The “medium” scenario was the unchanged LPM capture rate that was
developed above.
Socio-Economic Indicator Summary
The section covers the socio-economic indicators used in the LPM model. The indicators were key
inputs used in developing a model in order to calculate the concentration and saturation of LPM at a
regional and provincial level. A summary of the socio-economic indicators discussed in the section is
provided in the table below.16 | EASTERN CAPE GAMBLING BOARD LPM DISTRIBUTION STUDY – FINAL REPORT
Table 3.2: Summary of Socio-Economic Indicators
Indicator Summary
Number of households in each area • Utilised to determine the number of households per
income group based on Stats SA Census 2001 and 2011.
Local household growth rate • Utilised to estimate the current number of households
(forecast) based on Stats SA Census 2001 and 2011 and Community
Survey 2016.
Annual household income • Used to calculate the total disposable expenditure for a
given area based on Stats SA Census 2011 (inflation
adjusted, 2020).
Propensity to gamble • Percentage of household expenditure allocated to
gambling sourced from NGB, 2017.
Ga • Percentage of household expenditure allocated to
mbling expenditure per income gambling as per the household’s income group sourced
group from Quantec.
Existing LPM GGR, per LPM GGR, • Used to calculate concentration and saturation and was
and LPMs per area sourced from ECGB (2019/20) and adjusted to March 2020.
GGR Distribution across Gambling • Used to inform demand scenarios i.e. proportion of
Modes household expenditure on gambling between different
modes sourced from ECGB (2019/20).
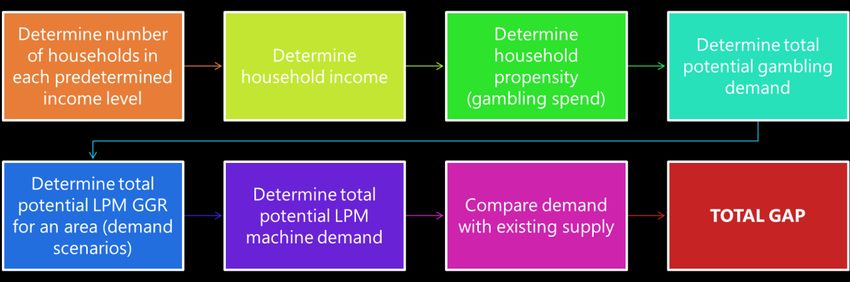
Methodological Process Utilising the Indicators
Figure 3.1: Methodological Process which Utilises the Indicators
The socio-economic indicators could thus be utilised to determine the concentration and saturation
using an eight-step process. The figure above outlines this process:17 | EASTERN CAPE GAMBLING BOARD LPM DISTRIBUTION STUDY – FINAL REPORT
(i) The initial step involved forecasting the data obtained from StatsSA Census 2011 based
on the household growth rate between 2001 and 2011 to determine the current number
of households in each predetermined income level in each local area.
(ii) The second step was to determine household income to calculate the total disposable
expenditure for a given area based on Stats SA Census 2011 (inflation-adjusted, 2020).
(iii) Step three was used to determine household propensity (gambling spend), which is the
percentage of household expenditure allocated to gambling as per the household’s
income group.
(iv) Step four was thus to determine total potential gambling demand by finding the sum of
the total potential GGR for the different income groups.
(v) Step five was to determine total potential LPM GGR for an area by calculating the total
potential LPM GGR for the low, medium, and high demand scenarios.
(vi) Step six was to determine total potential LPM demand for the low, medium, and high
demand scenarios.
(vii) Step seven was to compare demand with existing supply.
(viii) The final step was to determine the total gap between supply and demand. This could
then be used to determine the concentration at a local level and the saturation at a
provincial level.18 | EASTERN CAPE GAMBLING BOARD LPM DISTRIBUTION STUDY – FINAL REPORT
4. SPATIAL DISTRIBUTION OF LPMS (LPM SUPPLY)
This section aims to determine the spatial distribution of existing LPM supply at a provincial and
metropolitan level in the Eastern Cape. It provides the spatial representation of existing LPMs of areas
that have LPMs in multiple nodes. Most LMs only have one or two nodes that contain LPMs, but the
following areas have multiple nodes that contain LPMs.
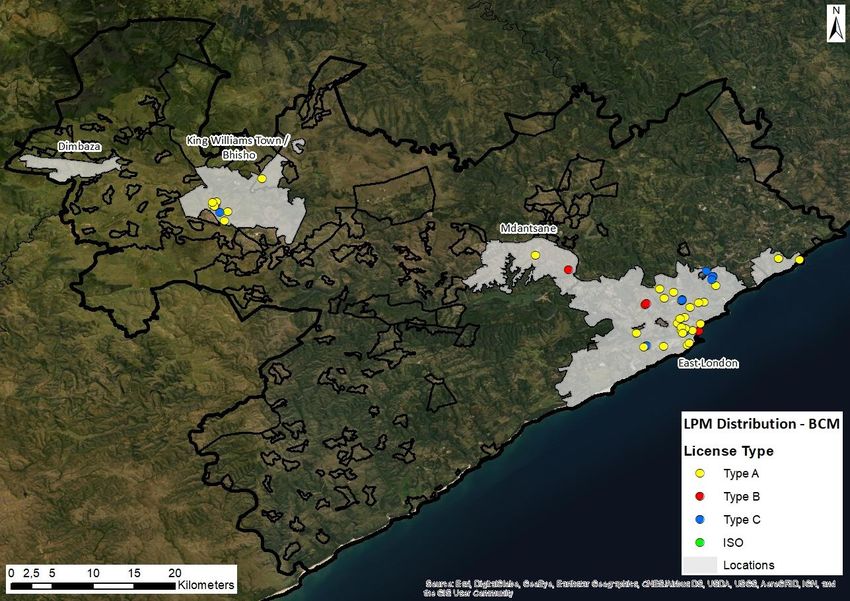
Buffalo City Metropolitan Municipality
Buffalo City Metropolitan Municipality consists of the following areas: Bhisho, Dimbaza, East London,
Kidds Beach, King William's Town, Mdantsane, Phakamisa and Zwelitsha. Bhisho, the provincial capital
of the Eastern Cape, falls under the municipality. The following map outlines the distribution of LPMs
at a main place level in Buffalo City.
Figure 4.1: Distribution of LPM Sites in Buffalo City Metropolitan Municipality
Adapted from: (ECGB, 2020)
As depicted in the map above, a large proportion of the LPMs in BCMM are located in the main urban
node of East London. With few located in Mdantsane and Bhisho/King William's Town. The Dimbaza
and northern areas are devoid of LPMs. Furthermore, the outlying areas of Buffalo City have few LPMs.19 | EASTERN CAPE GAMBLING BOARD LPM DISTRIBUTION STUDY – FINAL REPORT
Popular holiday areas along the southern coastal belt are also devoid of LPMs. This indicates that
while there is scope for expansion of LPMs in the municipality, it is likely that the large majority of
demand emerges from areas that are outside the main node of East London. Areas such as
Mdantsane, King William’s Town, Bhisho and the surrounding rural hamlets that are part of Buffalo
City are underserviced in terms of LPMs. Bingo and other gambling modes follow a similar pattern
where the outlying areas are unrepresented.
Nelson Mandela Bay Metropolitan Municipality
Nelson Mandela Bay Metropolitan Municipality encompasses the nodes of Port Elizabeth, Uitenhage,
KwaNobuhle Despatch, Bethelsdorp, KwaDwesi, KwaZakele, New Brighton, Zwide, Motherwell and
their surrounding agricultural areas.
The map below illustrates the geographical distribution of LPMs in the Nelson Mandela Bay.
Figure 4.2: Distribution of LPM Sites in Nelson Mandela Bay Metropolitan Municipality
Adapted from: (ECGB, 2020)
As indicated in the map above, the majority of LPMs are located in the densely populated areas of
Port Elizabeth, Uitenhage, and Despatch. Areas such as KwaNobuhle, Motherwell, KwaDwesi,20 | EASTERN CAPE GAMBLING BOARD LPM DISTRIBUTION STUDY – FINAL REPORT
KwaZakele, New Brighton and Zwide have no LPMs present, while Bethelsdorp has two locations for
LPMs. This unequal distribution of LPMs follows a similar pattern for other gambling modes such as
bingo and horse/sports betting outlets. This image thus indicates that while there is a large supply of
LPMs they are only servicing a limited portion of the total population of Nelson Mandela Bay.
Kouga LM
Kouga LM encompasses the nodes of Jeffrey’s Bay, Humansdorp, St Francis Bay, Cape St Francis,
Hankey and Patensie as well as smaller hamlets and their surrounding agricultural areas. The map
below illustrates the geographical distribution of LPMs in Nelson Mandela Bay.
Figure 4.3: Distribution of LPM Sites in Kouga LM
Adapted from: (ECGB, 2020)
As indicated in the above map, the majority of LPMs are located in the more densely populated areas
of Jeffrey’s Bay and Humansdorp. Areas such as Hankey and St Francis Bay / Cape St Francis have no
LPMs present. The areas of Patensie and Thornhill each have one establishment where LPMs are
located.21 | EASTERN CAPE GAMBLING BOARD LPM DISTRIBUTION STUDY – FINAL REPORT
Gambling Distribution in the Eastern Cape
The map below highlights the distribution of all gambling mode locations (casinos, bingo, LPMs,
bookmakers, racecourses, and totalisators) in the different nodes across the Province.
Figure 4.4: Gambling Mode Distribution at a Provincial Level
Source: (Urban-Econ GIS Unit, 2020)
As depicted in the map above, there is a very high density of gambling modes in the metropolitan
areas of Buffalo City and Nelson Mandela Bay with the Port Elizabeth node having the highest density
of between 1 001 modes per km2 to 1 900 modes per km2 followed by Buffalo City where East London
has a gambling mode density of between 751 and 1 000 modes/km 2 and 1 000 modes/km2.
In addition, the nodes of Uitenhage, King William’s Town/Bhisho, Humansdorp, Jefferey’s Bay, Komani,
Gcuwa, and Mthatha have a medium density of gambling modes ranging between 101-250
modes/km2 concentration of gambling modes whereas the remainder of the nodes in the Province
have a low concentration of gambling modes, implying that they have the capacity to accommodate
additional modes of gambling.22 | EASTERN CAPE GAMBLING BOARD LPM DISTRIBUTION STUDY – FINAL REPORT
LPM Site Closures
For the development of such a study, it is also important to note the number of LPM sites that
previously closed around the Province. The table below indicates that 51 site closures have occurred
between 2015/16 and 2017/18. The majority of these closures occurred in 2015/16 with only nine
closures in 2017/18. The majority of closures occurred in Nelson Mandela bay (24) while nine occurred
in Buffalo City. The remainder of the closures occurred in Chris Hani (five), OR Tambo (five), Sarah
Baartman (four), Joe Gqabi (three) and Amathole (one). No site closures have occurred in Alfred Nzo.
Table 4.1: Eastern Cape LPM Site Closures between 2015 and 2018
Location 2015/16 Site 2016/17 Site 2017/18 Site Total
Closures Closures Closures
NMBM 15 4 5 24
BCM 7 1 1 9
Chris Hani 1 2 2 5
OR Tambo 2 2 1 5
Sarah Baartman 2 2 0 4
Joe Gqabi 2 1 0 3
Amathole 0 1 0 1
Total 29 13 9 51
Source: (Adapted from ECGB, Site Closure List, 2020)
Additionally, the major licence types that have closed include:
• 45 type A licences
• 2 type B licences
• 1 type C licence
• 3 unknown licence types
The predominant reasoning for site closures is, as of yet, unknown.23 | EASTERN CAPE GAMBLING BOARD LPM DISTRIBUTION STUDY – FINAL REPORT
5. LPM CONCENTRATION ANALYSIS
The following section outlines the results of the modelling process that was informed by the socio-economic indicators in the previous section. As previously
stated, this was achieved by determining the total potential GGR (demand) in the local areas, then comparing this to the existing GGR and number of LPMs in
the areas (supply). This comparison could then determine if a gap existed between the total potential GGR and actual GGR generated in the areas.
The tables below outline the municipal areas and the nodes that were examined. For each node, the total potential GGR demand (low, medium, and high) and
potential number of LPM demand (low, medium, and high) are presented. The current supply of LPMs, LPM GGR and total number of licences are presented.
When compared to each other, the total gap between the LPMs in play and total licences granted can be determined. In some cases, there exists a difference
between the number of LPMs in play and the number of LPM licences granted in a municipality. Only representing the one value does not reflect the reality of
the LPMs in the Province. It was thus determined to include the gap between LPM demand and LPMs in play (Operational LPM Gap) and the gap between
LPM demand and licences granted in an area (LPM Licensed Gap). The following tables outline the GGR and LPM gap for each LM and metropolitan
municipality.
Alfred Nzo District LPM Concentration Analysis
Table 5.1: Alfred Nzo District’s LM and Nodal LPM Concentration
GGR Scenarios LPM Scenarios
LM Node
Low Medium High Low Medium High
Matatiele Demand R2 735 791 R3 137 952 R3 540 114 6 7 7
Maloti Demand R1 545 715 R1 772 936 R2 000 156 4 4 5
Matatiele
Matatiele LM Remainder Demand R9 739 580 R11 171 298 R12 603 016 80 92 104
Total Potential LPM GGR & LPM Demand R14 021 087 R16 082 186 R18 143 285 90 103 116
Total Current LPM GGR & LPM Supply R0 024 | EASTERN CAPE GAMBLING BOARD LPM DISTRIBUTION STUDY – FINAL REPORT
GGR Scenarios LPM Scenarios
LM Node
Low Medium High Low Medium High
Total LPM Licences Granted 0
Total Current GGR & Operational LPM Gap R14 021 087 R16 082 186 R18 143 285 90 103 116
Licensed LPM Gap 90 103 116
MaXesibeni Demand R905 248 R1 038 319 R1 171 391 5 6 7
KwaBhaca Demand R968 295 R1 110 634 R1 252 973 6 6 7
Umzimvubu Remainder Demand R9 398 616 R10 780 212 R12 161 808 54 62 70
Umzimvubu
Total Potential LPM GGR & LPM Demand R11 272 159 R12 929 165 R14 586 172 65 75 84
Total Current LPM GGR & LPM Supply R1 427 816 40
Total LPM Licences Granted 40
Total Current GGR & Operational LPM Gap R9 844 343 R11 501 350 R13 158 357 25 35 44
Licensed LPM Gap 25 35 44
Tabankulu Demand R496 052 R568 971 R641 891 3 3 4
Ntabankulu Remainder Demand R4 394 077 R5 040 006 R5 685 936 25 29 33
Total Potential LPM GGR & LPM Demand
Ntabankulu
R4 890 129 R5 608 978 R6 327 826 28 32 37
Total Current LPM GGR & LPM Supply 0 0
Total LPM Licences Granted 0
Total Current GGR & Operational LPM Gap R4 890 129 R5 608 978 R6 327 826 28 32 37
Licensed LPM Gap 28 32 37
Bizana Demand R1 133 837 R1 300 511 R1 467 185 6 7 8
Mbizana Remainder Demand R4 516 782 R6 397 207 R8 277 633 26 37 48
Mbizana
Total Potential LPM GGR & LPM Demand R5 650 619 R7 697 718 R9 744 817 32 44 56
Total Current LPM GGR & LPM Supply R7 220 650 40
Total LPM Licences Granted 40
Total Current GGR & Operational LPM Gap -R1 570 031 R477 068 R2 524 168 -8 4 1625 | EASTERN CAPE GAMBLING BOARD LPM DISTRIBUTION STUDY – FINAL REPORT
GGR Scenarios LPM Scenarios
LM Node
Low Medium High Low Medium High
Licensed LPM Gap -8 4 16
Amathole District LPM Concentration Analysis
Table 5.2: Amathole Nzo District’s LM and Nodal Concentration
GGR Scenarios LPM Scenarios
LM Node
Low Medium High Low Medium High
Dutywa Demand R1 180 336 R1 353 845 R1 527 355 5 6 7
Mbashe LM Remainder Demand R13 020 805 R14 934 863 R16 848 921 60 69 78
Total Potential LPM GGR & LPM Demand R14 201 141 R16 288 708 R18 376 275 66 75 85
Mbashe
Total Current LPM GGR & LPM Supply R0 0
Total LPM Licences Granted 0
Total Current GGR & Operational LPM Gap R14 201 141 R16 288 708 R18 376 275 66 75 85
Licensed LPM Gap 66 75 85
Gcuwa Demand R3 338 515 R4 308 726 R5 278 937 15 20 24
Mnquma Remainder Demand R10 408 458 R11 938 501 R13 468 544 48 55 62
Total Potential LPM GGR & LPM Demand R13 746 973 R16 247 227 R18 747 481 64 75 87
Mquma
Total Current LPM GGR & LPM Supply R4 570 544 43
Total LPM Licences Granted 45
Total Current GGR & Operational LPM Gap R9 176 429 R11 676 683 R14 176 937 21 32 44
Licensed LPM Gap 19 30 42
Qumrha Demand R610 878 R700 678 R790 477 3 3 4
Grea
t Kei
Great Kei Remainder Demand R2 380 472 R2 730 402 R3 080 331 11 13 1426 | EASTERN CAPE GAMBLING BOARD LPM DISTRIBUTION STUDY – FINAL REPORT
GGR Scenarios LPM Scenarios
LM Node
Low Medium High Low Medium High
Total Potential LPM GGR & LPM Demand R2 991 351 R3 431 079 R3 870 808 14 16 18
Total Current LPM GGR & LPM Supply R0 0
Total LPM Licences Granted 0
Total Current GGR & Operational LPM Gap R2 991 351 R3 431 079 R3 870 808 14 16 18
Licensed LPM Gap R0 14 16 18
Stutterheim Demand R2 975 148 R3 412 494 R3 849 841 14 16 18
Cathcart Demand R220 812 R253 271 R285 731 1 1 1
Amahlathi Remainder Demand R4 776 739 R5 478 920 R6 181 100 22 25 29
Amahlathi
Total Potential LPM GGR & LPM Demand R7 972 699 R9 144 685 R10 316 671 23 27 30
Total Current LPM GGR & LPM Supply R599 931 5
Total LPM Licences Granted R0 5
Total Current GGR & Operational LPM Gap R7 372 768 R8 544 755 R9 716 741 18 22 25
Licensed LPM Gap 18 22 25
Alice Demand R1 746 953 R2 003 755 R2 260 557 8 9 10
Fort Beaufort Demand R2 798 016 R3 209 324 R3 620 632 13 15 17
Adelaide Demand R1 453 115 R1 666 723 R1 880 331 7 8 9
Raymond Mhlaba
Bedford Demand R621 884 R713 301 R804 718 3 3 4
Raymond Mhlaba LM Remainder Demand R5 034 222 R5 774 252 R6 514 283 23 27 30
Total Potential LPM GGR & LPM Demand R11 654 191 R13 367 356 R15 080 522 54 62 70
Total Current LPM GGR & LPM Supply R2 915 228 20
Total LPM Licences Granted 40
Total Current GGR & Operational LPM Gap R11 032 306 R12 745 472 R14 458 637 34 42 50
Licensed LPM Gap 14 22 30
Peddie Demand R403 280 R462 562 R521 844 2 2 2
w
N
g
q
u
h
a
s27 | EASTERN CAPE GAMBLING BOARD LPM DISTRIBUTION STUDY – FINAL REPORT
GGR Scenarios LPM Scenarios
LM Node
Low Medium High Low Medium High
Ngqushwa Remainder Demand R3 767 202 R4 320 980 R4 874 759 17 20 23
Total Potential LPM GGR & LPM Demand R4 170 481 R4 783 542 R5 396 602 19 22 25
Total Current LPM GGR & LPM Supply R0 0
Total LPM Licences Granted 0
Total Current GGR & Operational LPM Gap R4 170 481 R4 783 542 R5 396 602 19 22 25
Licensed LPM Gap 19 22 25
Chris Hani District LPM Concentration Analysis
Table 5.3: Chris Hani District’s LM and Nodal Concentration
GGR Scenarios LPM Scenarios
LM Node
Low Medium High Low Medium High
Ngcobo Demand R716 919 R942 634 R1 168 348 3 4 5
Engcobo Remainder Demand R7 199 483 R8 257 807 R9 316 131 33 38 43
Total Potential LPM GGR & LPM Demand R7 916 403 R9 200 441 R10 484 479 37 43 48
Engcobo
Total Current LPM GGR & LPM Supply R1 476 240 30
Total LPM Licences Granted R0 40
Total Current GGR & Operational LPM Gap R6 440 162 R7 724 201 R9 008 239 7 13 18
Licensed LPM Gap -3 3 8
Khowa Demand R1 583 867 R1 816 695 R2 049 524 7 8 9
Cala Demand R1 746 084 R2 002 758 R2 259 432 8 9 10
Sakhisizwe
Sakhisizwe Remainder Demand R1 797 999 R2 062 304 R2 326 610 8 10 11
Total Potential LPM GGR & LPM Demand R5 127 949 R5 881 758 R6 635 566 24 27 31
Total Current LPM GGR & LPM Supply R0 028 | EASTERN CAPE GAMBLING BOARD LPM DISTRIBUTION STUDY – FINAL REPORT
GGR Scenarios LPM Scenarios
LM Node
Low Medium High Low Medium High
Total LPM Licences Granted 0
Total Current GGR & Operational LPM Gap R5 127 949 R5 881 758 R6 635 566 24 27 31
Licensed LPM Gap
24 27 31
Cofimvaba Demand R1 097 339 R1 258 648 R1 419 956 5 6 7
Tsolo Demand R417 990 R479 434 R540 878 2 2 3
Intsika Yethu Remainder Demand R6 581 541 R7 549 027 R8 516 513 30 35 39
Intsika Yethu
Total Potential LPM GGR & LPM Demand R8 096 869 R9 287 109 R10 477 348 37 43 48
Total Current LPM GGR & LPM Supply R0 0
Total LPM Licences Granted 0
Total Current GGR & Operational LPM Gap R8 096 869 R9 287 109 R10 477 348 37 43 48
Licensed LPM Gap 37 43 48
Cradock Demand R3 892 308 R4 877 009 R5 861 711 18 23 27
Middelburg Demand R1 918 223 R2 200 201 R2 482 180 7 8 9
Inxuba Yethemba
Inxuba Yethemba Remainder Demand R1 674 574 R1 920 736 R2 166 898 8 9 10
Total Potential LPM GGR & LPM Demand R7 485 104 R8 997 947 R10 510 789 33 39 46
Total Current LPM GGR & LPM Supply R5 691 764 45
Total LPM Licences Granted 45
Total Current GGR & Operational LPM Gap R1 793 340 R3 306 182 R4 819 025 -12 -6 1
Licensed LPM Gap -12 -6 1
Dordrecht Demand R1 260 185 R1 445 432 R1 630 679 6 7 8
Emalah
leni
Indwe Demand R576 422 R661 156 R745 890 3 3 3
Emalahleni Remainder Demand R5 436 580 R6 235 757 R7 034 934 25 29 3329 | EASTERN CAPE GAMBLING BOARD LPM DISTRIBUTION STUDY – FINAL REPORT
GGR Scenarios LPM Scenarios
LM Node
Low Medium High Low Medium High
Total Potential LPM GGR & LPM Demand R7 273 187 R8 342 345 R9 411 503 34 39 44
Total Current LPM GGR & LPM Supply R0 0
Total LPM Licences Granted 0
Total Current GGR & Operational LPM Gap R7 273 187 R8 342 345 R9 411 503 34 39 44
Licensed LPM Gap
34 39 44
Komani Demand R5 296 261 R7 092 237 R8 888 213 24 33 41
Thornhill Demand R545 219 R625 366 R705 513 3 3 3
Tarkastad Demand R1 051 974 R1 206 614 R1 361 254 5 6 6
Enoch Mgijima
Enoch Mgijima Remainder Demand R15 978 767 R18 327 645 R20 676 523 74 85 96
Total Potential LPM GGR & LPM Demand R22 872 221 R27 251 863 R31 631 504 106 126 146
Total Current LPM GGR & LPM Supply R10 397 644 63
Total LPM Licences Granted 65
Total Current GGR & Operational LPM Gap R12 474 578 R16 854 219 R21 233 861 43 63 83
Licensed LPM Gap 41 61 81
Joe Gqabi District LPM Concentration Analysis
Table 5.4: Joe Gqabi District’s LM and Nodal Concentration
GGR Scenarios LPM Scenarios
LM Node
Low Medium High Low Medium High
Maletswai Demand R3 603 301 R4 132 986 R4 662 671 17 19 22
Walter Sisulu
Burgersdorp Demand R1 419 823 R1 628 537 R1 837 250 7 8 8
Steynsberg Demand R545 805 R626 038 R706 271 3 3 3
Walter Sisulu Remainder Demand R5 640 164 R6 469 268 R7 298 372 26 30 3430 | EASTERN CAPE GAMBLING BOARD LPM DISTRIBUTION STUDY – FINAL REPORT
Total Potential LPM GGR & LPM Demand R11 209 092 R12 856 829 R14 504 565 52 59 67
Total Current LPM GGR & LPM Supply R3 448 214 30
Total LPM Licences Granted 40
Total Current GGR & Operational LPM Gap R7 760 878 R9 408 615 R11 056 351 22 29 37
Licensed LPM Gap 12 19 27
Sterkspruit Demand R3 335 409 R3 825 714 R4 316 019 15 18 20
Lady Grey Demand R1 594 629 R1 829 039 R2 063 449 7 8 10
Barkley East Demand R847 493 R972 075 R1 096 656 4 4 5
Senqu Remainder Demand R6 307 357 R7 234 538 R8 161 719 29 33 38
Senqu
Total Potential LPM GGR & LPM Demand R12 084 888 R13 861 367 R15 637 845 56 64 72
Total Current LPM GGR & LPM Supply R2 501 780 40
Total LPM Licences Granted 40
Total Current GGR & Operational LPM Gap R9 583 108 R11 359 587 R13 136 065 16 24 32
Licensed LPM Gap 16 24 32
Ugie Demand R1 367 921 R1 569 005 R1 770 090 6 7 8
Maclear Demand R1 008 484 R1 156 731 R1 304 978 5 5 6
Mount Fletcher Demand R1 642 559 R1 884 015 R2 125 471 8 9 10
Elundini Remainder Demand R4 885 722 R5 603 923 R6 322 124 23 26 29
Elundini
Total Potential LPM GGR & LPM Demand R8 904 686 R10 213 674 R11 522 663 41 47 53
Total Current LPM GGR & LPM Supply R0 0
Total LPM Licences Granted 0
Total Current GGR & Operational LPM Gap R8 904 686 R10 213 674 R11 522 663 41 47 53
Licensed LPM Gap 41 47 5331 | EASTERN CAPE GAMBLING BOARD LPM DISTRIBUTION STUDY – FINAL REPORT
OR Tambo District LPM Concentration Analysis
Table 5.5: OR Tambo District’s LM and Nodal Concentration
GGR Scenarios LPM Scenarios
LM Node
Low Medium High Low Medium High
Lusikisiki Demand R74 413 R210 725 R347 038 0 1 2
Flagstaff Demand R586 867 R673 137 R759 406 3 4 4
Ingquza Hill Remainder Demand R13 119 686 R15 048 279 R16 976 873 76 87 98
Ngquza Hill
Total Potential LPM GGR & LPM Demand R13 780 966 R15 932 141 R18 083 317 80 92 105
Total Current LPM GGR & LPM Supply R1 472 475 20
Total LPM Licences Granted 60
Total Current GGR & Operational LPM Gap R12 308 492 R14 459 667 R16 610 842 60 72 85
Licensed LPM Gap 20 32 45
Port St John's Demand R918 051 R1 053 005 R1 187 958 4 6 6
Port St John's Remainder Demand R6 190 536 R7 100 545 R8 010 553 36 41 46
Port St John’ s
Total Potential LPM GGR & LPM Demand R7 108 588 R8 153 550 R9 198 512 40 47 53
Total Current LPM GGR & LPM Supply R0 0
Total LPM Licences Granted 40
Total Current GGR & Operational LPM Gap R7 108 588 R8 153 550 R9 198 512 40 47 53
Licensed LPM Gap 0 7 13
Tsolo Demand
M
R840 511 R964 066 R1 087 621 5 6 6
o
o
n
h
t
l
l32 | EASTERN CAPE GAMBLING BOARD LPM DISTRIBUTION STUDY – FINAL REPORT
GGR Scenarios LPM Scenarios
LM Node
Low Medium High Low Medium High
Qumbu Demand R643 603 R738 212 R832 822 4 4 5
Mhlonthlo Remainder Demand R7 614 758 R8 734 127 R9 853 496 44 50 57
Total Potential LPM GGR & LPM Demand R9 098 872 R10 436 405 R11 773 939 53 60 68
Total Current LPM GGR & LPM Supply R0 0
Total LPM Licences Granted 0
Total Current GGR & Operational LPM Gap R9 098 872 R10 436 405 R11 773 939 53 60 68
Licensed LPM Gap 53 60 68
Libode Demand R420 303 R482 088 R543 873 2 3 3
Nyandeni Remainder Demand R14 113 286 R16 187 938 R18 262 590 82 94 106
Total Potential LPM GGR & LPM Demand R14 533 589 R16 670 026 R18 806 463 84 96 109
Nyandeni
Total Current LPM GGR & LPM Supply R0 0
Total LPM Licences Granted 0
Total Current GGR & Operational LPM Gap R14 533 589 R16 670 026 R18 806 463 84 96 109
Licensed LPM Gap 84 96 109
Mthatha Demand R7 401 617 R10 704 966 R14 008 316 43 62 81
King Sabata Dalindyebo Remainder Demand R19 541 216 R22 413 773 R25 286 331 113 130 146
Total Potential LPM GGR & LPM Demand R26 942 833 R33 118 740 R39 294 647 156 191 227
Total Current LPM GGR & LPM Supply R11 988 724 75
KSD
Total LPM Licences Granted 115
Total Current GGR & Operational LPM Gap R14 954 109 R21 130 016 R27 305 923 81 116 152
Licensed LPM Gap 41 76 11233 | EASTERN CAPE GAMBLING BOARD LPM DISTRIBUTION STUDY – FINAL REPORT
Sarah Baartman District LPM Concentration Analysis
Table 5.6: Sarah Baartman District’s LM and Nodal Concentration
GGR Scenarios LPM Scenarios
LM Node
Low Medium High Low Medium High
Joubertina Demand R1 115 584 R1 279 575 R1 443 566 5 6 7
Kareedouw Demand R745 346 R854 911 R964 477 3 4 4
Kou-Kamma Remainder Demand R2 677 055 R3 070 581 R3 464 108 12 14 16
Kou-Kamma
Total Potential LPM GGR & LPM Demand R4 537 985 R5 205 068 R5 872 152 21 24 27
Total Current LPM GGR & LPM Supply R0 0
Total LPM Licences Granted 0
Total Current GGR & Operational LPM Gap R4 537 985 R5 205 068 R5 872 152 21 24 27
Licensed LPM Gap 21 24 27
Humansdorp Demand R5 417 392 R6 213 749 R7 010 105 25 29 32
Jeffrey's Bay Demand R6 384 801 R7 694 902 R9 005 002 25 30 35
Hankey Demand R1 056 419 R1 211 713 R1 367 006 5 6 6
Patensie Demand R706 767 R810 662 R914 556 3 4 4
Kouga
St Francis Bay / Cape St Francis Demand R1 825 131 R2 093 425 R2 361 719 8 10 11
Kouga Remainder Demand R2 633 864 R3 021 041 R3 408 219 12 14 16
Total Potential LPM GGR & LPM Demand R18 024 374 R21 045 492 R24 066 609 78 91 104
Total Current LPM GGR & LPM Supply R27 191 640 11034 | EASTERN CAPE GAMBLING BOARD LPM DISTRIBUTION STUDY – FINAL REPORT
GGR Scenarios LPM Scenarios
LM Node
Low Medium High Low Medium High
Total LPM Licences Granted 110
Total Current GGR & Operational LPM Gap -R9 167 266 -R6 146 149 -R3 125 031 -32 -19 -6
Licensed LPM Gap -32 -19 -6
Kirkwood / Moses Mabida Demand R4 037 635 R4 631 168 R5 224 700 21 24 27
Addo / Nomathamasanqa Demand R1 275 917 R1 463 477 R1 651 037 6 7 8
SRV Remainder Demand R2 724 090 R3 124 531 R3 524 972 13 14 16
Total Potential LPM GGR & LPM Demand R8 037 642 R9 219 175 R10 400 708 39 45 51
SRV
Total Current LPM GGR & LPM Supply R962 177 5
Total LPM Licences Granted 5
Total Current GGR & Operational LPM Gap R7 075 465 R8 256 998 R9 438 531 34 40 46
Licensed LPM Gap 34 40 46
Port Alfred Demand R8 155 876 R9 354 790 R10 553 703 45 51 58
Kenton-on-Sea / Bushmans River Mouth Demand R1 227 321 R1 407 737 R1 588 153 5 6 7
Alexandria Demand R646 638 R741 694 R836 750 3 3 4
Bathurst Demand R266 812 R306 033 R345 255 1 1 2
Ndlambe
Ndlambe Remainder Demand R818 113 R938 375 R1 058 638 4 4 5
Total Potential LPM GGR & LPM Demand R11 114 760 R12 748 629 R14 382 499 58 66 75
Total Current LPM GGR & LPM Supply R11 385 325 60
Total LPM Licences Granted 65
Total Current GGR & Operational LPM Gap -R270 565 R1 363 304 R2 997 174 -2 6 15
Licensed LPM Gap -7 1 10
Makhanda Demand R12 169 548 R13 689 601 R15 209 655 52 59 65
Makana
Makana Remainder Demand R1 607 295 R1 843 567 R2 079 839 7 9 10
Total Potential LPM GGR & LPM Demand R13 776 843 R15 533 168 R17 289 494 60 67 7535 | EASTERN CAPE GAMBLING BOARD LPM DISTRIBUTION STUDY – FINAL REPORT
GGR Scenarios LPM Scenarios
LM Node
Low Medium High Low Medium High
Total Current LPM GGR & LPM Supply R9 294 362 40
Total LPM Licences Granted 40
Total Current GGR & Operational LPM Gap R4 482 480 R6 238 806 R7 995 132 20 27 35
Licensed LPM Gap
20 27 35
Somerset East Demand R2 363 637 R2 711 091 R3 058 546 10 11 13
Cookhouse Demand R388 212 R445 279 R502 346 2 2 2
Pearston Demand R233 443 R267 760 R302 076 1 1 1
Blue Crane Route
BCR Remainder Demand R702 795 R806 106 R909 416 3 4 4
Total Potential LPM GGR & LPM Demand R3 688 087 R4 230 236 R4 772 384 16 18 21
Total Current LPM GGR & LPM Supply R4 795 950 20
Total LPM Licences Granted 20
Total Current GGR & Operational LPM Gap -R1 107 863 -R565 714 -R23 566 -4 -2 1
Licensed LPM Gap -4 -2 1
Graaff-Reinet Demand R5 502 238 R6 311 066 R7 119 895 25 29 33
Aberdeen Demand R686 665 R787 604 R888 544 3 4 4
Steytlerville Demand R459 089 R526 575 R594 061 2 2 3
Willowmore Demand R459 089 R526 575 R594 061 3 3 4
Beyers Naude
Jansenville Demand R603 033 R691 679 R780 325 3 3 4
Beyers Naude Remainder Demand R1 220 131 R1 399 490 R1 578 849 7 8 9
Total Potential LPM GGR & LPM Demand R8 930 245 R10 242 990 R11 555 736 43 50 56
Total Current LPM GGR & LPM Supply R1 722 812 5
Total LPM Licences Granted 5
Total Current GGR & Operational LPM Gap R7 207 433 R8 520 178 R9 832 924 38 45 51You can also read