Recruiting and Retaining Youth and Young Adults in the Policy and Communication Evaluation (PACE) Vermont Study: Randomized Controlled Trial of ...
←
→
Page content transcription
If your browser does not render page correctly, please read the page content below
JOURNAL OF MEDICAL INTERNET RESEARCH                                                                                                         Villanti et al

     Original Paper

     Recruiting and Retaining Youth and Young Adults in the Policy
     and Communication Evaluation (PACE) Vermont Study:
     Randomized Controlled Trial of Participant Compensation

     Andrea C Villanti1, PhD, MPH; Christie P Vallencourt2, MPA; Julia C West1, BA; Catherine Peasley-Miklus1, PhD;
     S Elisha LePine1, BA; Caitlin McCluskey1, BS; Elias Klemperer1, PhD; Jeffrey S Priest3, PhD; Alison Logan4, MA;
     Bill Patton4, MBA; Nancy Erickson5; Jennifer Hicks6, MA; Kathleen Horton5, BS; Shayla Livingston7, MPH; Maria
     Roemhildt6, PhD; Erin Singer2, PhD; Megan Trutor8, BA; Rhonda Williams2, MES
     1
      Department of Psychiatry, Vermont Center on Behavior and Health, University of Vermont Larner College of Medicine, Burlington, VT, United States
     2
      Health Promotion & Disease Prevention, Vermont Department of Health, Burlington, VT, United States
     3
      Biomedical Statistics Research Core, University of Vermont, Burlington, VT, United States
     4
      Hark Inc, Burlington, VT, United States
     5
      Communication, Vermont Department of Health, Burlington, VT, United States
     6
      Health Surveillance, Vermont Department of Health, Burlington, VT, United States
     7
      Public Health Policy, Vermont Department of Health, Burlington, VT, United States
     8
      Alcohol & Drug Abuse Programs, Vermont Department of Health, Burlington, VT, United States

     Corresponding Author:
     Andrea C Villanti, PhD, MPH
     Department of Psychiatry
     Vermont Center on Behavior and Health
     University of Vermont Larner College of Medicine
     1 South Prospect Street, MS 482
     Burlington, VT, 05401
     United States
     Phone: 1 8026561187
     Email: avillant@uvm.edu

     Abstract
     Background: The standard approach for evaluating the effects of population-level substance use prevention efforts on youth
     and young adult perceptions and behaviors has been to compare outcomes across states using national surveillance data. Novel
     surveillance methods that follow individuals over shorter time intervals and capture awareness of substance use prevention policy
     and communication efforts may provide a stronger basis for their evaluation than annual cross-sectional studies.
     Objective: This study aimed to identify a combination of strategies to recruit a sample of youth and young adults sufficiently
     representative of the Vermont population and determine how best to retain a web-based panel of youth and young adults over a
     6-month period.
     Methods: Eligible participants were Vermont residents aged 12 to 25 years who were willing to complete three 10 to 15-minute
     web-based surveys over a 6-month period. Recruitment was conducted via the following three main mechanisms: (1) web-based
     recruitment (paid and unpaid), (2) community-based recruitment through partners, and (3) participant referrals via a personalized
     link. Upon completion of the baseline survey, participants were randomly assigned to one of the following three retention incentive
     conditions: (1) guaranteed incentive (US $10), (2) lottery incentive (US $50 weekly lottery drawing), and (3) preferred method
     (guaranteed or lottery). Analyses examined cost per survey start by recruitment source, distribution of demographic characteristics
     across incentive conditions, and retention by study condition at 3-month and 6-month follow-ups.
     Results: Over a 10-week period in 2019, we recruited 480 eligible youth (aged 12-17 years) and 1037 eligible young adults
     (aged 18-25 years) to the Policy and Communication Evaluation (PACE) Vermont Study. Facebook and Instagram advertising
     produced the greatest number of survey starts (n=2013), followed by posts to a state-wide web-based neighborhood forum (n=822)
     and Google advertisements (n=749). Retention was 78.11% (1185/1517) at 3 months and 72.18% (1095/1517) at 6 months.
     Retention was equivalent across all incentive study conditions at both waves, despite a strong stated preference among study

     http://www.jmir.org/2020/7/e18446/                                                                    J Med Internet Res 2020 | vol. 22 | iss. 7 | e18446 | p. 1
                                                                                                                         (page number not for citation purposes)
XSL• FO
RenderX
JOURNAL OF MEDICAL INTERNET RESEARCH Villanti et al
participants for the guaranteed payment at baseline. Youth had greater retention than young adults at both waves (wave 2: 395/480,
82.3% vs 790/1037, 76.18%; wave 3: 366/480, 76.3% vs 729/1037, 70.30%). Substance use prevalence in this cohort was similar
to national and state-level surveillance estimates for young adults, but was lower than state-level surveillance estimates for youth.
Most participants retained at wave 3 provided positive qualitative feedback on their experience.
Conclusions: Our study supports the feasibility of recruiting a web-based cohort of youth and young adults with representation
across an entire state to evaluate substance use prevention efforts. Findings suggest that a guaranteed payment immediately upon
survey completion coupled with a bonus for completing all survey waves and weekly survey reminders may facilitate retention
in a cohort of youth and young adults.
(J Med Internet Res 2020;22(7):e18446) doi: 10.2196/18446
KEYWORDS
recruitment; retention; adolescents; young adults; prevention
may be implemented or experienced differently than in settings
Introduction with greater population density.
Adolescence and young adulthood are defined by developmental In 2018, researchers and program staff at the University of
processes that mark increased susceptibility to risk-taking Vermont and the Vermont Department of Health began
behaviors, including substance use [1-4]. In tobacco control, discussing the development of a longitudinal cohort study of
prevention efforts have shifted from individual and group-level youth and young adults to evaluate responses to changes in
interventions to population-based approaches, including policy tobacco, alcohol, and other substance use policies,
and mass media efforts to reduce the appeal and accessibility communication, and interventions at the state level. The Policy
of tobacco products to young people [5]. Concurrently, and Communication Evaluation (PACE) Vermont Study was
state-level cannabis policies in the United States have aimed to designed to complement existing evaluation efforts that rely on
liberalize the accessibility of cannabis products, though there a combination of state-level surveillance and smaller
have been few state-level prevention campaigns. Using national convenience samples [18] The PACE Vermont Study uses
surveillance data across states has been the standard approach web-based data collection in a large sample of youth and young
to evaluate the effects of these policies on youth and young adults, with surveys at shorter intervals to capture changes over
adult perceptions and behaviors [6,7]. These evaluations, which time. The survey instrument was also designed to be flexible,
use cross-sectional data over time, may mask more nuanced allowing for assessment of emerging issues and communication
trends in individual-level changes in harm perceptions and outcomes (eg, knowledge, attitudes, and beliefs) not typically
behavior and have largely failed to address spillover effects on captured in state surveillance systems.
other substance use. Novel surveillance methods that follow
individuals over time and capture awareness of substance use Web-based data collection was proposed to reduce barriers to
prevention policy and communication efforts may provide a participation in research among rural people from Vermont,
stronger basis for their evaluation. given that as of 2018, 98% of young adults aged 18 to 29 years
use the internet, as do 78% of adults who live in rural
Vermont represents a unique test case for the evaluation of communities [19]. Similarly, 94% of young adults aged 18 to
population-level interventions for substance use for three 29 years and 65% of adults in rural communities own a
reasons. First, the prevalence of substance use in young people smartphone [20]. Adoption of web-based surveys for data
from Vermont is higher than national estimates [8-10]. Second, collection is likely to appeal to young people, who grew up with
Vermont has implemented a number of new policies related to computers and use them in virtually all aspects of their lives,
substance use in the past 5 years, including a state-wide opioid while reducing transportation and other costs that serve as
drug disposal program, stronger prescribing guidelines, and barriers to engaging in traditional clinical trials [21-24]. With
requirements in the Vermont Prescription Monitoring System respect to retaining young people in longitudinal studies, there
(2016); legalized possession of cannabis for adults aged 21 was no clear recommendation on incentives to maximize
years or above [11] (2018); a ban on the web-based sale of retention, as previous studies had identified multiple means,
e-cigarettes [12] and a 92% tax on e-cigarettes [13] (2019); and including increasing participant payments, conducting
an increase in the legal age of tobacco sale to 21 years [14] sweepstakes, providing bonuses, and sending reminder postcards
(2019). In addition to policy efforts, the Governor’s 2018 Opioid [25-28].
Coordination Council Report recommended development and
implementation of school-based primary prevention programs This study had the following two primary goals: (1) to identify
for opioid use and a comprehensive drug prevention messaging the combination of recruitment strategies that would provide a
campaign [15]. Third, while Vermont has a relatively sample of youth and young adults sufficiently representative of
homogeneous population in terms of race/ethnicity, it is the the Vermont population and (2) to determine how best to retain
second most rural state in the country [16], with between 60% a web-based panel of youth and young adults to be able to
and 100% of the area classified as rural depending on the attribute changes in knowledge, attitudes, beliefs, and behaviors
definition [17]. Thus, policy and communication interventions to specific interventions. Specifically, this study experimentally
compared the effects of a lottery payment, a guaranteed
http://www.jmir.org/2020/7/e18446/ J Med Internet Res 2020 | vol. 22 | iss. 7 | e18446 | p. 2
(page number not for citation purposes)
XSL• FO
RenderXJOURNAL OF MEDICAL INTERNET RESEARCH Villanti et al
payment, and participant preference for a particular completion display advertisements, delivered content to the following three
incentive on retention at 3-month and 6-month follow-ups. Our Vermont-based segments: youth (aged 12-17 years), young
a priori hypothesis was that retention would be higher in the adults (aged 18-25 years), and parents (aged ≥18 years). In
participant preference incentive condition than in the lottery or addition to age and geography, Google and Facebook’s interest
guaranteed payment incentive condition, as providing choice and lifestyle-based targeting enabled specific targeting of
for some study-related decisions has been described as a means parents. Prior to recruitment, the PACE team integrated Google
to improve retention in studies involving young adults [29]. and Facebook advertisements with the study landing page and
its web analytics tool. Google and Facebook campaigns for the
Methods PACE Vermont Study were set to optimize their targeting
algorithms and advertisement variations to achieve a maximum
Study Overview number of survey starts rather than clicks or page views. The
The study consisted of three web-based surveys conducted from initial structure of both the Facebook and Google advertisement
March 2019 through October 2019 and was approved by the campaigns mirrored the audience segments (youth, young adults,
Institutional Review Boards of the University of Vermont and and parents). Advertisements for each segment featured visual
Vermont Department of Health. This research also received a assets (ie, photographs, illustrations, and graphics) and text in
Certificate of Confidentiality from the National Institutes of the form of headlines, posts, email body, and call-to-action
Health. buttons. Advertisements directed at youth and young adults
used the following message themes: (1) earn cash rewards and
Recruitment and Enrollment buy the things you really want and (2) be a leader in your
Eligible participants were Vermont residents aged 12 to 25 years community and share your opinion on important topics.
who were willing to complete three 10- to 15-minute web-based Advertisement visuals took the following two approaches: (1)
surveys over a 6-month period. Youth participants aged 12 to photographs of youth and young adults smiling and holding a
17 years also had to report being a US citizen or permanent mobile phone or gift card and (2) eye-catching illustrations and
resident. Recruitment was conducted by Hark, a Vermont-based graphics with action-oriented phrases like “We want to hear
digital design and marketing firm [30], over a 10-week period from you.” Advertisements directed at parents were designed
(March 26-June 4, 2019). Participants were recruited via the to motivate parents to encourage their children to join the study.
following three main mechanisms: (1) web-based recruitment Parent-focused messages used the following themes: (1) your
including both paid and unpaid advertising, (2) community family can help improve the health of Vermont’s youth for years
recruitment through partner organizations, and (3) participant to come and (2) your teen’s participation will help Vermont
referrals via a personalized link. Each recruitment type contained create substance-abuse resources for other families.
a unique link to the study website to be automatically tracked Advertisement visuals took the following two approaches: (1)
via Google Analytics. Web-based recruitment occurred through humorous photography of toddlers and young children making
paid Facebook, Instagram, and Google display and Gmail messes and (2) sentimental photography of parents embracing
advertisements; free Craigslist Vermont advertisements; posts their babies and young children. A separate wave of Facebook
on PACE Vermont’s social media accounts (Facebook, and Google advertisements ran close to the end of the
Instagram, and Twitter); paid posts on a state-wide online recruitment window and highlighted the urgency of participation
neighborhood forum (Front Porch Forum) [31]; and paid with messages like “Don’t miss out on PACE VT” and “Time
placement of advertisements in local web-based and print is running out.” Other promotional channels like Front Porch
newspapers with relevant news stories. Community recruitment Forum and Craigslist primarily targeted parents and older young
occurred through outreach from engaged partners to their adults. Because these channels do not allow for advanced
constituents and via news media on the PACE Vermont Study. targeting beyond geography, promotional messages mirrored
Partner organizations received a recruitment toolkit, with a those of parents in our paid campaigns.
tailored newsletter blurb, flyers, sample email language, and
All study advertisements and links directed participants to the
sample social media posts for print and digital promotion of the
PACE Vermont website, where there was a brief study
study, as well as a timeline for distribution of recruitment
description and link to an open web-based screener. In addition
material to their networks. Participant referrals were requested
to direct advertising to youth, parents of eligible youth were
at the end of baseline survey completion via a thank you email
also targeted via promotional efforts. They were asked to review
with a personalized referral link, a request to share the survey
an information sheet and provide informed consent prior to
link with friends on social networks, and a direct link to the
youth providing assent to complete the screener. Youth who
PACE Vermont Facebook page. Parents of youth participants
initiated the screening survey without parental consent were
were able to opt in to be considered for a small study incentive
asked to provide parent contact information, which triggered
(US $5) for referring another eligible family to the study using
an email to the parents. Upon parental consent, youth received
their unique link. The PACE research team met weekly to
a unique link to the screener to provide assent. Youth and young
monitor representation by age, race, ethnicity, and county, and
adults underwent an electronic informed consent process and
promotional strategies during this period were adjusted to focus
received an email link to contact study personnel to ask
on underrepresented areas of the state or sociodemographic
questions about the study. Eligible consenting youth and young
groups.
adults were automatically forwarded to the baseline survey,
Digital advertising channels, including Google display where they completed demographic information and questions
advertisements, Google Gmail advertisements, and Facebook on substance use knowledge, attitudes, beliefs, and behaviors.
http://www.jmir.org/2020/7/e18446/ J Med Internet Res 2020 | vol. 22 | iss. 7 | e18446 | p. 3
(page number not for citation purposes)
XSL• FO
RenderXJOURNAL OF MEDICAL INTERNET RESEARCH Villanti et al
These included measures of ever and past 30-day use of Follow-up surveys were launched approximately 3 months (June
cigarettes, alcohol, and marijuana, which served as benchmarks 27-July 31, 2019) and 6 months (September 17-October 15,
for comparison to prevalence estimates from state and national 2019) after the baseline survey. Each survey was distributed
surveillance on substance use data. Participants were then initially via email or text message, based on participant
automatically forwarded to a web-based version of the preference, with a message that notified participants about the
University of Vermont participant payment form required for dates of data collection, including the 1-month window during
internal tracking of study payments. All surveys were voluntary, which the follow-up survey would be open for completion.
deployed via Qualtrics [31], and optimized for completion via Weekly reminder messages were sent to youth and young adults
a computer or mobile phone. who had not completed the survey via both email and text
message throughout the 1-month window, with additional
During baseline data collection, we revised our survey delivery
reminders in the last 2 days of each window via email, text
to ensure the eligibility of participants and the validity of study
message, and social media. Incentive payments at each
responses in several ways as follows: (1) adding automatic
follow-up were dictated by the study condition, with those in
screening within our survey platform, Qualtrics [32], to exclude
the guaranteed condition automatically linked to Rybbon to
participants with an IP address outside Vermont; (2) conducting
confirm their email address and receive their US $10 gift card
consistency checks between age and date of birth, as well as
immediately. As in the baseline survey, lottery drawings (US
state of residence and location of IP address; (3) adding a
$50) were conducted each week during data collection for the
CAPTCHA item in the screener to ensure that respondents were
two follow-up surveys and winners were notified by email. At
human and not bots; (4) conducting additional screening of
the completion of the final follow-up survey, participants who
respondents with suspicious email addresses (eg, common e-mail
had completed all three waves received their bonus payment
format across surveys completed within minutes of each other
immediately via Rybbon.
and email addresses including names that did not correspond
to contact information) and out-of-state phone numbers; and Participant Feedback
(5) using information from the screening and payment forms At the end of the final survey, participants were asked the
(eg, consistency of name across forms and location of participant following two questions about their experience in the PACE
address) to verify eligibility. Potentially fraudulent participants Vermont Study: “What was your favorite part of participating
were flagged and received an email from the study team offering in the PACE Vermont Research Study?” and “What could we
an opportunity to confirm their contact information and remain improve in the PACE Vermont Research Study to make it easier
in the study. Respondents who did not confirm that they were for you to participate?” Responses were open-ended. Two coders
valid participants were removed from the study. (SEL and CM) reviewed the responses and created in vivo
Intervention and Retention inductive categories from themes that arose during the course
of data analysis, as described by Miles and Huberman [34].
At the end of the baseline survey, participants were asked
Responses for each question were then coded in NVivo software
“Which of the following would you like to receive for
(QSR International) independently by each coder, and responses
completing other web-based surveys like this?” with the
were allowed to fall into more than one category. Reliability of
following two response choices: “Receive a $10 online gift
the coders for each category ranged from a kappa value of 0.47
card” or “Be entered into a lottery to receive $50.” After
to 0.97, representing moderate to almost perfect agreement. For
responding to this question, participants were randomly assigned
the question “What was your favorite part of participating in
within the Qualtrics survey system to one of the following three
the PACE Vermont Research Study?” the coding category with
study conditions: (1) guaranteed incentive (US $10), (2) lottery
the lowest level of agreement was “other” (κ=0.47) and the
incentive (US $50 weekly lottery drawing), and (3) preferred
category with the highest level of agreement was
method (guaranteed or lottery, based on the response to the
“compensation” (κ=0.97). For the question “What could we
question). Participants were informed of their study condition,
improve in the PACE Vermont Research Study to make it easier
and those in the guaranteed condition were automatically
for you to participate?” the coding category with the lowest
directed to a web interface [33] to confirm their email address
level of agreement was “learning” (κ=0.54) and the category
and receive their US $10 electronic gift card (wave 1 study
with the highest level of agreement was “compensation”
payment). Gift cards were emailed to wave 1 participants once
(κ=0.88).
they were confirmed as participants with valid completion.
Lottery drawings were conducted among those who had Statistical Analysis
completed the survey in a given week (n=3 youth and n=3 young This study used the following two sources of data: advertising
adult winners selected each week during each survey wave), metrics, and enrollment and follow-up data from our surveys.
and winners were notified by email. Participants were told that First, we estimated the cost per survey start according to the
they would receive a bonus payment for completing all three recruitment source by dividing the total amount spent on each
surveys (lottery payment group: US $50 bonus; guaranteed source by the number of survey starts. Second, we developed
payment group: US $20 bonus in addition to US $10 per a CONSORT diagram to track participants from enrollment
completed survey). Thus, all participants received US $50 upon through the three survey waves and estimated differences in
completing all three surveys and lottery participant winners retention by the intervention condition at each stage using
could receive more. chi-square tests. We conducted additional analyses to test
whether retention differed by concordance between preference
http://www.jmir.org/2020/7/e18446/ J Med Internet Res 2020 | vol. 22 | iss. 7 | e18446 | p. 4
(page number not for citation purposes)
XSL• FO
RenderXJOURNAL OF MEDICAL INTERNET RESEARCH Villanti et al
and the intervention condition (ie, lottery vs guaranteed were excluded, the cost per conversion to a survey start was US
compensation). We also examined the distribution of $11. Only four parents received the US $5 referral incentive.
sociodemographic characteristics (ie, county, sex, race/ethnicity,
The best performing Google advertisements were Gmail
and employment status) and substance use (ever and past 30-day
advertisements run close to the end of the recruitment window
cigarette, alcohol, and marijuana use) by age and the intervention
highlighting the urgency of participation for parents, youth, and
condition using chi-square tests and t tests and the differences
young adults; the top Facebook posts for youth and young adults
in these characteristics among those retained at all three waves
highlighted urgency and the importance of youth and young
versus those lost to follow-up. Survey weights were developed
adult feedback (“We want to hear from you.”) The top
post-hoc from population estimates of females and males
performing Facebook post for parents cited how findings from
between the ages of 12 and 25 years (year by year) residing in
the PACE Vermont Study would be used to guide resources for
each of Vermont’s 14 counties in 2017 [35]. The goal of survey
substance use prevention in Vermont. While advertisements
weighting was to determine how closely the convenience sample
targeting youth ran for the duration of the recruitment period,
matched other state surveillance, as well as correct for the higher
advertisements targeting parents were more effective at
response by females and those residing in Chittenden County.
recruiting youth than youth-specific advertisements.
Each cell of the table was divided by the total number of
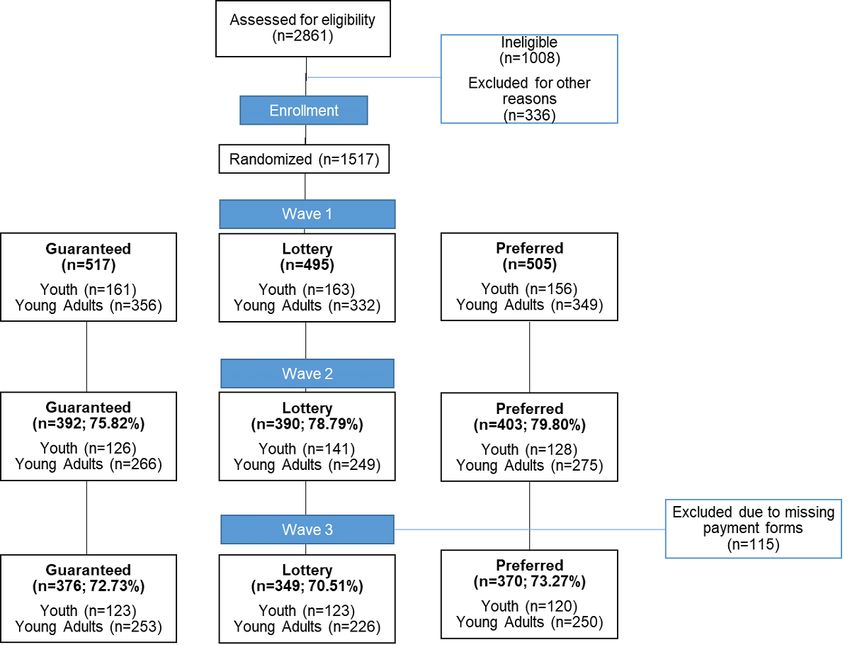
individuals between the ages of 12 and 25 years residing in the In addition to the 2723 youth and young adult survey starts from
14 counties (n=116,407) to generate population-based the study advertisements, participants referred others to the
proportions. A comparable table of survey respondents was study, resulting in 2861 completed screenings (Figure 1). Of
created, totaling the number of individuals who completed the those assessed for eligibility, 1008 were deemed ineligible (eg,
baseline survey by sex, age, and county of residence. Each not aged 12-25 years and not Vermont residents) and 336 were
subtotal was divided by the total number of respondents excluded for other reasons, including being flagged as
(n=1517) to generate sample-based proportions. Survey weights potentially fraudulent.
were then calculated by dividing population proportions by
Overall, there were 480 youth respondents and 1037 young
sample proportions, again by sex, age, and county. We compared
adult respondents included in the PACE Vermont Study sample
the weighted prevalence of ever and past 30-day use of
(Table 2). The recruitment cost per eligible enrolled participant
cigarettes, alcohol, and marijuana in our sample to national and
was US $29 (US $44,111/1517 participants). Participants
state-level surveillance estimates from the National Survey on
represented each of the 14 counties in the state, with the
Drug Use and Health (NSDUH) [10,36]. Finally, we assessed
distribution by county generally reflecting 2017 population
the major categories of responses to two participant feedback
estimates for Vermont youth and young adults [35]. The
items from qualitative coding.
majority of the sample was female (1071/1517, 70.60%), was
white (1318/1517, 86.88%), and reported working either
Results part-time or full-time (898/1517, 59.20%).
Recruitment and Enrollment Table 3 presents the number of responses and weighted
Table 1 presents information on new visitors to the study prevalences of cigarette, alcohol, and marijuana use by age
website; survey starts for parents, youth, and young adults; and group in the PACE Vermont Study compared with estimates
cost per survey start by recruitment source. Survey starts by for the same measures in the NSDUH. Ever use estimates for
recruitment source were tracked using Google Analytics on the each substance were provided in the 2018 NSDUH national
PACE Vermont study website. Survey completions by report [36] and past 30-day measures were drawn from the
recruitment source could not be captured as surveys were 2016-2017 state-level report [10]. Prevalence of ever cigarette,
conducted within Qualtrics. Overall, there were 9975 new alcohol, and marijuana use in PACE Vermont Study youth
visitors to the study website, with Facebook and Instagram participants was generally similar to national estimates from
advertisements accounting for 54.55% (5441/9975) of web the NSDUH, although past 30-day use estimates tended to be
traffic, with 2013 survey starts. Google display and Gmail lower in PACE Vermont youth compared with state-level
advertisements accounted for 35.10% (3501/9975) of web traffic estimates from the NSDUH. Ever and past 30-day use in young
and 749 survey starts. Three postings in an email digest with adult PACE Vermont participants tracked closely with NSDUH
state-wide coverage (Front Porch Forum) generated 9.75% estimates, with the following three exceptions: past 30-day
(973/9975) of web traffic and 939 survey starts. Partner referrals, cigarette use was lower in the PACE Vermont sample compared
newspaper print advertisements, and Craigslist advertisements with the NSDUH estimate (18.78% vs 33.38%), and the PACE
produced smaller numbers of new users and survey starts. The Vermont sample showed higher ever alcohol use (PACE vs
cost per conversion to a survey start was US $382 considering NSDUH: 89.52% vs 79.70%) and ever marijuana use (70.57%
all recruitment sources; when newspaper print advertisements vs 51.50%).
http://www.jmir.org/2020/7/e18446/ J Med Internet Res 2020 | vol. 22 | iss. 7 | e18446 | p. 5
(page number not for citation purposes)
XSL• FO
RenderXJOURNAL OF MEDICAL INTERNET RESEARCH Villanti et al
Table 1. Recruitment sources, costs, and conversions in the PACE Vermont Study 2019.
Source Cost (total: US New users Conversions, n Cost per conver-
$44,110.71) (N=10,250) siona
Parent Young adult Youth Total survey
survey starts survey starts survey starts starts
(N=1026) (N=1772) (N=951) (N=3749)
Facebook & Instagram advertis- US $23,676.42 5441 443 1247 323 2013 US $11.76
ing
Google display & Gmail advertis- US $9213.78 3501 331 233 185 749 US $12.30
ing
Front Porch Forum US $4950.00 223 37 26 54 117 US $42.31
(paid post, partial state coverage)
Front Porch Forum (two spon- US $3666.00 1025 199 248 375 822 US $4.46
sored posts, state wideb)
Newspaper print advertisements US $2604.51 1 1 0 0 1 US $2604.51
Craigslist US $0.00 8 1 4 0 5 US $0.00
Partner sources US $0.00 51 14 14 14 42 US $0.00
a
Average cost per conversion was US $381.55, and average cost per conversion, excluding print advertisements, was US $11.06.
b
Sponsored posts available to the Vermont Department of Health for outreach activities.
Figure 1. CONSORT flow diagram of participants in the Policy and Communication Evaluation (PACE) Vermont Study, 2019.
http://www.jmir.org/2020/7/e18446/ J Med Internet Res 2020 | vol. 22 | iss. 7 | e18446 | p. 6
(page number not for citation purposes)
XSL• FO
RenderXJOURNAL OF MEDICAL INTERNET RESEARCH Villanti et al
Table 2. Participant characteristics by incentive condition in the PACE Vermont Study 2019.
Characteristica Incentive condition Total P value
(N=1517), n (%)
Guaranteed Lottery Preference
(N=517), n (%) (N=495), n (%) (N=505), n (%)
Age group (years) .75
12-17 161 (31.14) 163 (32.93) 156 (30.89) 480 (31.64)
18-25 356 (68.86) 332 (67.07) 349 (69.11) 1037 (68.36)
County of residence .42
Addison 41 (7.93) 33 (6.67) 40 (7.92) 114 (7.51)
Bennington 20 (3.87) 18 (3.64) 16 (3.17) 54 (3.56)
Caledonia 16 (3.09) 23 (4.65) 21 (4.16) 60 (3.96)
Chittenden 228 (44.10) 225 (45.45) 203 (40.20) 656 (43.24)
Essex —b — 8 (1.58) 14 (0.92)
Franklin 33 (6.38) 25 (5.05) 25 (5.95) 83 (5.47)
Grand Isle 6 (1.16) 5 (1.01) — 15 (0.99)
Lamoille 10 (1.93) 19 (3.84) 25 (4.95) 54 (3.56)
Not sure 9 (1.74) 10 (2.02) 12 (2.38) 31 (2.04)
Orange 14 (2.71) 20 (4.04) 12 (2.38) 46 (3.03)
Orleans 10 (1.93) 8 (1.62) 11 (2.18) 29 (1.91)
Rutland 22 (4.25) 24 (4.85) 37 (7.33) 83 (5.47)
Washington 68 (13.15) 51 (10.30) 62 (12.28) 181 (11.93)
Windham 18 (3.48) 18 (3.64) 18 (3.56) 54 (3.56)
Windsor 19 (3.68) 12 (2.42) 11 (2.18) 42 (2.77)
Sex .16
Female 356 (68.86) 361 (72.93) 354 (70.10) 1071 (70.60)
Male 161 (31.14) 132 (26.67) 151 (29.90) 444 (29.27)
Race/ethnicity .21
White 442 (85.49) 444 (89.70) 432 (85.54) 1318 (86.88)
Nonwhite/other/multiple race 45 (8.70) 34 (6.87) 45 (8.91) 124 (8.17)
Hispanic 30 (5.80) 16 (3.23) 28 (5.54) 74 (4.88)
Employment status .33
Do not currently work for pay 222 (42.94) 207 (41.82) 189 (37.43) 618 (40.74)
Work part-time 101 (19.54) 80 (16.16) 106 (20.99) 287 (18.92)
(JOURNAL OF MEDICAL INTERNET RESEARCH Villanti et al
Table 3. Comparison of substance use prevalence by age group in the PACE Vermont sample and the National Survey on Drug Use and Health.
Characteristic Youth (aged 12-17 years) Young adults (aged 18-25 years)
Value, n Weighted % (95% CI) NSDUHa estimate Value, n Weighted % (95% CI) NSDUH estimate
Cigarette use
Ever 42 9.1% (6.3-12.9) 9.6% [36]b 487 47.4% (43.4-51.4) 45.9% [36]b
Past 30 days 11 2.2% (1.1-4.4) 5.8% [10] (4.5-7.3) 178 18.8% (15.9-22.1) 33.4% [10] (28.9-
38.2)
Alcohol use
Ever 141 29.4% (24.5-34.7) 26.3% [36]b 935 89.5% (86.9-91.7) 79.7% [36]b
Past 30 days 43 9.3% (6.6-12.9) 13.6% [10] (11.3-16.3) 743 70.8% (66.9-74.3) 70.9% [10] (66.7-
74.8)
Binge alcohol use, 13 3.1% (1.6-5.8) 7.2% [10] (5.7-9.0) 484 48.3% (44.3-52.3) 49.3% [10] (44.8-
past 30 days 53.7)
Marijuana use
Ever 80 16.3% (12.8-20.7) 15.4% [36]b 742 70.6% (66.7-74.1) 51.3% [36]b
Past 30 days 47 8.7% (6.3-12.1) 10.8% [10] (8.7-13.2) 412 41.3% (37.4-45.3) 38.8% [10] (34.2-
43.7)
a
NSDUH: National Survey on Drug Use and Health.
b
95% CI not provided for NSDUH national estimates of ever use.
concordant preference and an incentive condition compared
Intervention and Retention with 78.4% (380/485) in the nonconcordant group (P=.87).
Randomization of the 1517 eligible participants was generally Proportions were also similar at wave 3 (concordant: 751/1031,
equal across study conditions, with 34.08% (517/1517) allocated 72.84%; nonconcordant: 343/485, 70.7%; P=.39). Retention
to the “guaranteed” incentive, 32.63% (495/1517) to the across all three waves did not differ by county, sex,
“lottery” incentive, and 33.29% (505/1517) to the “preferred” race/ethnicity, or employment status. Retention was lower,
incentive. Proportions were similar when looking at youth and however, among participants who had ever used a cigarette
young adult subgroups separately. There were no differences (P=.005) and those who reported past 30-day use of marijuana
in the distribution of participants to the study condition by age, (P=.001; data available upon request).
county of residence, sex, race, ethnicity, or employment status
(Table 2). Response to the question about incentives for Participant Feedback
completing similar web-based surveys indicated a strong Of the 1095 respondents in the wave 3 survey, 86.58%
preference for the guaranteed incentive (1304/1517, 85.96%), (948/1095) provided a response to the question regarding their
and 67.96% (1031/1517) of participants were assigned to an favorite part of the survey and 81.55% (893/1095) provided a
incentive condition concordant with their preference. response to the question regarding potential improvements to
the survey. Table 4 presents coded responses to each item. With
At wave 2, 78.11% (1185/1517) of the full sample completed
some responses categorized into more than one code, there were
the survey. Youth retention at wave 2 was 82.3% (395/480),
1049 responses to the item on the favorite part of participating
while young adult retention was 76.18% (790/1037; P=.007).
in the study, with 28.60% (300/1049) noting financial
At wave 3, 72.18% (1095/1517) of the full sample completed
compensation as their favorite part, followed by learning
the survey; again, youth had higher retention (366/480, 76.3%)
something new (192/1049, 18.30%) and making a meaningful
than young adults (729/1037, 70.30%; P=.02). Overall, 70.20%
contribution to science or to the community (184/1049, 17.54%).
(1,065/1517) completed all three waves of the study (74.0%
There were 910 responses to the item on potential improvements
[355/480] of youth and 68.47% [710/1037] of young adults;
to the study, with the majority noting no changes needed
P=.03).
(496/910, 54.5%), followed by specific recommendations related
Retention did not differ by incentive condition at wave 2 (P=.28) to ease of use (302/910, 33.2%). Recommendations included
or wave 3 (P=.59). Retention was also similar when examining suggestions for improvements to survey structure, survey timing,
concordance between preference and the intervention condition, and survey wording.
with 77.98% (804/1031) retention at wave 2 among those with
http://www.jmir.org/2020/7/e18446/ J Med Internet Res 2020 | vol. 22 | iss. 7 | e18446 | p. 8
(page number not for citation purposes)
XSL• FO
RenderXJOURNAL OF MEDICAL INTERNET RESEARCH Villanti et al
Table 4. Participant feedback at the end of the PACE Vermont Study.
Question, code, and subcode Value, n (%)
What was your favorite part of participating in the PACEa Vermont Research Study? (1049 responses)
Survey task (κ=0.50) 162 (15.4)
Favorite part was the survey task itself.
Learning (κ=0.57) 192 (18.3)
Favorite part was learning something new.
Learning: self (κ=0.91) 85 (8.1)
Enjoyed learning something about themselves or having an opportunity to self-reflect.
Learning: other (κ=0.72) 89 (8.5)
Enjoyed learning new information about policies, organizations, or substances.
Ease of use (κ=0.80) 110 (10.5)
Favorite part was the ease of use and accessibility of the surveys.
Contribution (κ=0.83) 184 (17.5)
Favorite part was making a meaningful contribution to something (eg, science and the community).
Compensation (κ=0.97) 300 (28.6)
Favorite part was the financial compensation.
Other (κ=0.47) 80 (7.6)
Response not otherwise categorized.
None (κ=0.71) 21 (2.0)
Did not generate a response (eg, “I did not have a favorite part”).
What could we improve in the PACE Vermont Research Study to make it easier for you to participate? (910
responses)
Learning (κ=0.54) 16 (1.8)
Requested more resources or opportunities to learn.
Ease of use (κ=0.88) 302 (33.2)
Suggested improving survey’s ease of use.
Survey design (κ=0.81) 119 (13.1)
Suggested improvement to survey structure or design.
Reminders & timing (κ=0.87) 43 (4.7)
Suggested improvement to timing of surveys or the reminder system.
Question improvement (κ=0.84) 140 (15.4)
Suggested improvement to wording or content of survey questions.
Compensation (κ=0.88) 53 (5.8)
Suggested improvement to the compensation system.
Other (κ=0.58) 43 (4.7)
Not otherwise categorized.
None (κ=0.78) 496 (54.5)
No response generated (eg, “nothing”).
None: positive (κ=0.83) 244 (26.8)
Response generated was wholly positive.
a
PACE: Policy and Communication Evaluation.
tested the effect of three incentive conditions (guaranteed,
Discussion lottery, and preferred) on retention over a 6-month period. Over
Principal Findings a 10-week period in 2019, we were able to recruit 480 eligible
youth and 1037 eligible young adults to the PACE Vermont
This study identified successful recruitment strategies for a Study. Findings from this study indicated that Facebook and
web-based cohort study of youth and young adults to inform Instagram advertising produced the greatest number of survey
and evaluate state-level substance use prevention efforts. It also starts, followed by posts to a state-wide online neighborhood
http://www.jmir.org/2020/7/e18446/ J Med Internet Res 2020 | vol. 22 | iss. 7 | e18446 | p. 9
(page number not for citation purposes)
XSL• FO
RenderXJOURNAL OF MEDICAL INTERNET RESEARCH Villanti et al
forum in Vermont (Front Porch Forum) and Google participate, thus attracting a lower risk pool of youth, or the
advertisements (display and Gmail). The integration of Google smaller sample size of youth than young adults. Additional
and Facebook advertisements with the study landing page and attrition by ever cigarette users and past 30-day marijuana users
its web analytics tool was critical to evaluating survey starts as may have produced a sample with fewer risk behaviors at
the advertising metric of interest in support of PACE’s follow-up. Given the randomized nature of the incentive
recruitment efforts. Validation of study responses was achieved condition and balance in demographic characteristics across
through multiple methods, in line with other web-based studies conditions, findings related to retention are likely to be
[37]. Data collected on county supported the distribution of generalizable to other web-based survey studies of youth and
responses across the state, in line with the distribution of youth young adults.
and young adults in the population. The success of the local
online neighborhood forum in driving traffic to the study website
Comparison With Prior Work
highlights the potential importance of these venues in Similar to other web-based studies [28,38], Facebook and
recruitment. While community partner sources did not drive Instagram advertisements provided the greatest reach and lowest
the same level of traffic to the site, advertisement of the study cost per survey start when considering parent, youth, and young
via these community organizations and through the local adult screener surveys; these were followed by Google
web-based digest may have lent credibility to the study and advertisements via display and Gmail. The success of these
increased awareness that improved recruitment. Substance use strategies may have been related to consistency with
prevalence estimates in PACE Vermont youth and young adults recommendations for Facebook recruitment, including having
generally tracked national estimates from the NSDUH, although an attractive website [18] and existing social media accounts
youth reported lower prevalence of current cigarette, alcohol, (@pace_vt) that identified the partner organizations involved
and marijuana use than estimates from NSDUH’s state-level in the study (ie, University of Vermont and Vermont Department
surveillance. of Health) and supported the credibility of the study [34].
Retention was 78.11% (1185/1517) at 3 months and 72.18% Retention in our cohort of youth and young adults was higher
(1095/1517) at 6 months. Contrary to our hypothesis, retention at 6 months (72.18%) compared with a national cohort of young
was equivalent across all incentive study conditions. This may adults aged 15 to 21 years who also completed web-based
have been due to a strong stated preference among study surveys (63%) [27]. Our randomized experiment regarding
participants for the guaranteed payment and assignment of incentive conditions showed, similar to previous studies [37-40],
approximately two-thirds of participants to an incentive that multiple means of compensation produce equal retention
condition that was concordant with their preference. Youth when combined with providing completion bonuses and sending
participants at both waves had greater retention than young multiple reminders. However, our baseline item regarding
adult participants. Participants retained at all three waves were incentive preference suggests that the majority of youth and
less likely to be ever cigarette users or past 30-day marijuana young adults prefer a small guaranteed payment for responding
users compared with those lost to follow-up. The majority of to a web-based survey. Thus, providing guaranteed
participants retained at wave 3 provided feedback on their compensation could help to improve recruitment of youth and
experience of the study, with largely positive comments about young adults in future studies. Our ongoing retention efforts
compensation, learning something new, and making a difference. draw on expertise gathered from in-person cohort studies of
Participants also provided specific feedback to improve future youth and young adults [25,29]; we send birthday postcards to
surveys, such as requests for more resources or opportunities participants at the start of each month and continue to post on
to learn and suggestions to improve timing and reminders for our social media accounts to retain awareness of and engagement
surveys. in the study.
Limitations Conclusions
The PACE Vermont Study was limited to a small largely rural Findings from the PACE Vermont Study demonstrated the
state, and thus, successful recruitment strategies may not be feasibility of using traditional web-based advertising strategies
generalizable to other study contexts. Additionally, while the (eg, Facebook and Google), in addition to web-based outreach
sample was generally aligned with population distribution by through local community forums and organizations, to recruit
county, there were imbalances by sex in the study sample, with a cohort of 1517 Vermont youth and young adults for a
the majority of the sample being female (1071/1517, 70.60%) web-based study to evaluate state-level substance use prevention
in contrast to 48% of the state population of youth and young efforts. Participants were well distributed by age and county
adults. There was also one county (Chittenden) with a higher according to state population estimates and reported substance
response than expected according to population distribution, use prevalence comparable to national estimates in these age
but this county is both the most populous and home to the groups. Youth participants generally reported lower prevalence
University of Vermont with the largest population of of risk behaviors compared with state-level estimates [10]. The
undergraduates in the state who would have been eligible for higher proportion of female participants enrolled in the PACE
the study. Lower prevalence of past 30-day cigarette, alcohol, Vermont Study is consistent with other studies, documenting
and marijuana use in the PACE Vermont youth compared with higher recruitment of women to health studies via web-based
state estimates suggests that youth enrolled in this study may advertising [38,40,41]. Retention in this web-based cohort study
represent a lower risk sample. This may be due to the was over 70% at a 6-month follow-up and did not differ by the
recruitment process for youth that required parental consent to incentive condition, as seen in other studies of young adults
http://www.jmir.org/2020/7/e18446/ J Med Internet Res 2020 | vol. 22 | iss. 7 | e18446 | p. 10
(page number not for citation purposes)
XSL• FO
RenderXJOURNAL OF MEDICAL INTERNET RESEARCH Villanti et al
[27]. Participant feedback on the study experience was positive. means of retaining participants, including ongoing cohort
Results from our study suggest that providing a guaranteed engagement via regular contact (eg, birthday postcards and
payment immediately upon survey completion coupled with a social media posts), ongoing community engagement (eg,
bonus for completing all survey waves and weekly survey reporting to community partners on PACE Vermont Study
reminders may facilitate retention in a cohort of youth and young outcomes), and nonfinancial incentives (eg, lottery for
adults. Future work in our cohort will assess the impact of other PACE-branded items).
Acknowledgments
The PACE Vermont Study was funded by the Vermont Department of Health, the University of Vermont Cancer Center, and the
University of Vermont Larner College of Medicine. The effort of the author ACV was supported by the National Institute of
General Medical Sciences of the National Institutes of Health under award number P20GM103644. Although this work was
funded in whole or in part with monies provided by or through the State of Vermont, the State does not necessarily endorse the
researchers' findings and/or conclusions. The findings and/or conclusions may be inconsistent with the State's policies, programs,
and objectives. Additionally, the content is solely the responsibility of the authors and does not necessarily represent the official
views of the National Institutes of Health.
Conflicts of Interest
None declared.
Editorial Notice
This randomized study was not registered as the authors state that it is a pilot study to determine best practices in recruitment and
retention for other trials, which have been registered. The editor granted an exception. However, readers are advised to carefully
assess the validity of any potential explicit or implicit claims related to primary outcomes or effectiveness, as retrospective
registration does not prevent authors from changing their outcome measures retrospectively.
References
1. Erikson E. Identity: Youth and crisis. New York, NY: WW Norton & Company; 1968.
2. Oetting ER, Donnermeyer JF. Primary socialization theory: the etiology of drug use and deviance. I. Subst Use Misuse
1998 Mar;33(4):995-1026. [doi: 10.3109/10826089809056252] [Medline: 9548633]
3. Sussman S, Arnett JJ. Emerging Adulthood: Developmental Period Facilitative of the Addictions. Eval Health Prof 2014
Jun;37(2):147-155. [doi: 10.1177/0163278714521812] [Medline: 24492245]
4. Arnett JJ. Emerging adulthood. A theory of development from the late teens through the twenties. Am Psychol 2000
May;55(5):469-480. [Medline: 10842426]
5. Aldrich MC, Hidalgo B, Widome R, Briss P, Brownson RC, Teutsch SM. The role of epidemiology in evidence-based
policy making: a case study of tobacco use in youth. Ann Epidemiol 2015 May;25(5):360-365 [FREE Full text] [doi:
10.1016/j.annepidem.2014.03.005] [Medline: 24875267]
6. Johnson RM, Guttmannova K. Marijuana Use among Adolescents and Emerging Adults in the Midst of Policy Change:
Introduction to the Special Issue. Prev Sci 2019 Feb;20(2):179-184. [doi: 10.1007/s11121-019-0989-7] [Medline: 30701394]
7. Friedman AS, Wu RJ. Do Local Tobacco-21 Laws Reduce Smoking among 18 to 20 Year-Olds? Nicotine Tob Res 2020
Jun 12;22(7):1195-1201. [doi: 10.1093/ntr/ntz123] [Medline: 31348515]
8. Moss JL, Liu B, Zhu L. State Prevalence and Ranks of Adolescent Substance Use: Implications for Cancer Prevention.
Prev Chronic Dis 2018 May 31;15:E69 [FREE Full text] [doi: 10.5888/pcd15.170345] [Medline: 29862962]
9. 2015-2016 National Survey on Drug Use and Health National Maps of Prevalence Estimates, by State. Substance Abuse
and Mental Health Services Administration, Center for Behavioral Health Statistics and Quality. URL: https://www.
samhsa.gov/data/sites/default/files/NSDUHsaeMaps2016/NSDUHsaeMaps2016.pdf [accessed 2018-10-14]
10. 2016-2017 NSDUH State Prevalence Estimates. Substance Abuse and Mental Health Services Administration. 2018 Nov
28. URL: https://www.samhsa.gov/data/report/2016-2017-nsduh-state-prevalence-estimates [accessed 2019-09-27]
11. Zezima K. Vermont is the first state to legalize marijuana through legislature. Washington Post. 2018. URL: https://www.
washingtonpost.com/news/post-nation/wp/2018/01/23/vermont-is-the-first-state-to-legalize-marijuana-through-legislature/
[accessed 2019-09-24]
12. H.26 (Act 22): An act relating to restricting retail and Internet sales of electronic cigarettes, liquid nicotine, and tobacco
paraphernalia in Vermont. Vermont State House of Representatives. URL: https://legislature.vermont.gov/bill/status/2020/
H.26 [accessed 2019-09-27]
13. H.47 (Act 28): An act relating to the taxation of electronic cigarettes. Vermont State House of Representatives. URL: https:/
/legislature.vermont.gov/bill/status/2020/H.47 [accessed 2019-09-27]
http://www.jmir.org/2020/7/e18446/ J Med Internet Res 2020 | vol. 22 | iss. 7 | e18446 | p. 11
(page number not for citation purposes)
XSL• FO
RenderXJOURNAL OF MEDICAL INTERNET RESEARCH Villanti et al
14. S.86: An act relating to increasing the legal age for buying and using cigarettes, electronic cigarettes, and other tobacco
products from 18 to 21 years of age. Vermont State Senate. 2019. URL: https://legislature.vermont.gov/bill/status/2020/S.
86 [accessed 2019-05-08]
15. Summary of Initial Report of Recommended Strategies to Governor Phil Scott. Vermont Opioid Coordination Council.
2018 Jan. URL: http://www.healthvermont.gov/sites/default/files/documents/pdf/OCC%20Report%20Summary%202-page.
pdf [accessed 2018-04-26]
16. Lisa A. States with the biggest rural populations. Stacker. 2019 Apr 08. URL: https://thestacker.com/stories/2779/
states-biggest-rural-populations#50 [accessed 2020-01-12]
17. Vermont - Rural Definitions: State-Level Maps. United States Department of Agriculture, Economic Research Service.
2018. URL: https://www.ers.usda.gov/webdocs/DataFiles/53180/25600_VT.pdf?v=0 [accessed 2020-01-12]
18. Policy and Communication Evaluation (PACE Vermont). URL: https://www.pacevt.org [accessed 2019-09-27]
19. Internet/Broadband Fact Sheet. Pew Research Center. 2018 Feb 05. URL: http://www.pewinternet.org/fact-sheet/
internet-broadband/ [accessed 2018-10-15]
20. Mobile Fact Sheet. Pew Research Center. 2018 Feb 05. URL: http://www.pewinternet.org/fact-sheet/mobile/ [accessed
2018-10-15]
21. Young L, Montgomery M, Barnason S, Schmidt C, Do V. A Conceptual Framework for Barriers to the Recruitment and
Retention of Rural CVD Participants in Behavior Intervention Trials. GSTF J Nurs Health Care 2015 Aug;2(2):19-24
[FREE Full text] [doi: 10.5176/2010-4804_2.2.71] [Medline: 28580381]
22. Young L, Barnason S, Do V. Conducting Behavioral Intervention Research in Rural Communities: Barriers and Strategies
to Recruiting and Retaining Heart Failure Patients in Studies. Nurs Health Care (Winfield) 2016;1(1):101 [FREE Full text]
[Medline: 29215663]
23. Young L, Barnason S. Review Strategies to Recruit and Retain Rural Patient Participating Self-management Behavioral
Trials. Online J Rural Res Policy 2015;10(2):1-12 [FREE Full text] [doi: 10.4148/1936-0487.1070] [Medline: 28580049]
24. Tanner A, Kim S, Friedman DB, Foster C, Bergeron CD. Barriers to medical research participation as perceived by clinical
trial investigators: communicating with rural and african american communities. J Health Commun 2015;20(1):88-96. [doi:
10.1080/10810730.2014.908985] [Medline: 25204763]
25. Diviak KR, Wahl SK, O'Keefe JJ, Mermelstein RJ, Flay BR. Recruitment and retention of adolescents in a smoking trajectory
study: who participates and lessons learned. Subst Use Misuse 2006;41(2):175-182. [doi: 10.1080/10826080500391704]
[Medline: 16393741]
26. Cantrell J, Hair EC, Smith A, Bennett M, Rath JM, Thomas RK, et al. Recruiting and retaining youth and young adults:
challenges and opportunities in survey research for tobacco control. Tob Control 2018 Mar;27(2):147-154. [doi:
10.1136/tobaccocontrol-2016-053504] [Medline: 28432211]
27. Cantrell J, Bennett M, Thomas RK, Rath J, Hair E, Vallone D. It’s Getting Late: Improving Completion Rates in a
Hard-to-Reach Sample. Surv Pract 2017 Dec 28;11(2). [doi: 10.29115/sp-2018-0019]
28. Watson NL, Mull KE, Heffner JL, McClure JB, Bricker JB. Participant Recruitment and Retention in Remote eHealth
Intervention Trials: Methods and Lessons Learned From a Large Randomized Controlled Trial of Two Web-Based Smoking
Interventions. J Med Internet Res 2018 Aug 24;20(8):e10351 [FREE Full text] [doi: 10.2196/10351] [Medline: 30143479]
29. Hanna KM, Scott LL, Schmidt KK. Retention strategies in longitudinal studies with emerging adults. Clin Nurse Spec
2014;28(1):41-45 [FREE Full text] [doi: 10.1097/NUR.0000000000000020] [Medline: 24309576]
30. Hark, Inc. URL: https://www.hark.bz [accessed 2019-09-27]
31. Front Porch Forum, Inc. URL: https://frontporchforum.com/ [accessed 2019-09-27]
32. Qualtrics International, Inc. URL: https://www.qualtrics.com [accessed 2019-09-27]
33. Rybbon, Inc. URL: https://www.rybbon.net [accessed 2019-09-27]
34. Miles M, Huberman A. Qualitative data analysis: An expanded sourcebook. Thousand Oaks, CA: Sage Publications; 1994.
35. Population of Vermont Counties by Single Year of Age and Sex, 2017. Vermont Department of Health. 2018 Dec 17. URL:
https://www.healthvermont.gov/sites/default/files/documents/xls/
HS_STAT_Population_of_Vermont_Counties_by_single_year_of_age_and_sex_2017.xls [accessed 2020-01-12]
36. 2018 NSDUH Detailed Tables. Substance Abuse and Mental Health Services Administration. 2019 Aug 20. URL: https:/
/www.samhsa.gov/data/report/2018-nsduh-detailed-tables [accessed 2020-01-20]
37. Godinho A, Schell C, Cunningham JA. Out damn bot, out: Recruiting real people into substance use studies on the internet.
Subst Abus 2020;41(1):3-5. [doi: 10.1080/08897077.2019.1691131] [Medline: 31821108]
38. Christensen T, Riis AH, Hatch EE, Wise LA, Nielsen MG, Rothman KJ, et al. Costs and Efficiency of Online and Offline
Recruitment Methods: A Web-Based Cohort Study. J Med Internet Res 2017 Mar 01;19(3):e58 [FREE Full text] [doi:
10.2196/jmir.6716] [Medline: 28249833]
39. Akers L, Gordon JS. Using Facebook for Large-Scale Online Randomized Clinical Trial Recruitment: Effective Advertising
Strategies. J Med Internet Res 2018 Nov 08;20(11):e290 [FREE Full text] [doi: 10.2196/jmir.9372] [Medline: 30409765]
40. Byaruhanga J, Tzelepis F, Paul C, Wiggers J, Byrnes E, Lecathelinais C. Cost Per Participant Recruited From Rural and
Remote Areas Into a Smoking Cessation Trial Via Online or Traditional Strategies: Observational Study. J Med Internet
Res 2019 Nov 12;21(11):e14911 [FREE Full text] [doi: 10.2196/14911] [Medline: 31714253]
http://www.jmir.org/2020/7/e18446/ J Med Internet Res 2020 | vol. 22 | iss. 7 | e18446 | p. 12
(page number not for citation purposes)
XSL• FO
RenderXYou can also read