2018 Community Needs Assessment - Greater Prince William - People ...
←
→
Page content transcription
If your browser does not render page correctly, please read the page content below

2018   Community Needs Assessment
             Greater Prince William
Table of Contents
 Executive Summary ........................................................................................................ 1
 I.   Methodology .............................................................................................................. 2
         Surveys ................................................................................................................. 2
         Focus Groups ........................................................................................................ 3
         Secondary Data..................................................................................................... 3
 II. Overview of People Incorporated Region ................................................................ 4
 III. Jobs, the Economy, and Financial Growth.............................................................. 7
         Employment .......................................................................................................... 7
         Poverty ................................................................................................................. 9
         Transportation ....................................................................................................... 11
 IV. Housing ..................................................................................................................... 12
         Housing Quality and Quantity ................................................................................ 12
         Affordable Housing ................................................................................................ 13
         Mobility .................................................................................................................. 14
         Homelessness ....................................................................................................... 15
 V. Education................................................................................................................... 16
         Educational Attainment .......................................................................................... 16
 VI. Children and Youth ................................................................................................... 17
         Kindergarten Readiness ........................................................................................ 17
         Childcare ............................................................................................................... 18
         Head Start Supplemental Info................................................................................ 20
 VII. Nutrition, Health, and Wellness ................................................................................ 22
         Substance Abuse and Mental Health ..................................................................... 22
         Affordable Health and Dental Care ........................................................................ 24
         Nutrition ................................................................................................................. 25
 VIII. Other Key Findings .................................................................................................. 26

 Appendices ..................................................................................................................... 27
    Appendix A: Demographic Statistics by County ........................................................... 27
    Appendix B: Armed Forces and Veterans Characteristics by County .......................... 28
    Appendix C: Unemployment Rate by County .............................................................. 29
    Appendix D: Employment and Wages by Industry ....................................................... 30
    Appendix E: Poverty by County ................................................................................... 32
    Appendix F: Living Wage by County and Family Type ................................................. 33
    Appendix G: Transportation Characteristics by County ............................................... 34
    Appendix H: Housing Characteristics by County ......................................................... 35
    Appendix I: Educational Attainment by County ............................................................ 36
    Appendix J: Head Start Eligibility Estimate Methodology ............................................. 37
    Appendix K: Childcare Characteristics by County ........................................................ 38
    Appendix L: Mental Health and Substance Abuse Indicators by County ...................... 39
    Appendix M: Health Characteristics by county............................................................. 40
    Appendix N: Staff Survey Summary ............................................................................ 41
    Appendix O: Board Survey Summary .......................................................................... 42
    Appendix P: Partners Survey Summary ...................................................................... 43
    Appendix Q: Community Member Survey Summary.................................................... 44
Executive Summary
People Incorporated is a Community Action Agency serving 13 counties and 3 cities in Virginia.
As part of its mandate, and in order to provide the best and most comprehensive anti-poverty
services, the agency undertakes a major triennial Community Needs Assessment. The findings
from this assessment are used to inform the agency’s selection and delivery of services in each
community it serves. In addition to a comprehensive report, People Incorporated has prepared
regional sub-reports to ensure that each community receives the most helpful information and
that services are tailored to the unique needs of people in the Greater Prince William region.
People Incorporated hopes that the information in this report can also be used throughout the
region by other non-profits and local governments to best serve the most disadvantaged
members of our community.
Drawing from a wide variety of data sources including surveys, focus groups, and public data,
the staff and board of People Incorporated identified the following as the top needs for 2018 in
the Greater Prince William area:

Top Needs for 2018
   1. Transportation – Residents of this region have some of the longest average commute
      times among the localities served by People Incorporated at almost 40 minutes. Many
      residents commute to other cities in the DC metro area, but public transit service only
      serves part of the county. Finally, funding for the current level of transportation services
      is dwindling as tax revenues from fuel purchase decrease.
   2. Veterans Support Services – 12.4% of residents in the region are veterans. The US
      Census estimates 43,000 veterans from a wide a variety of service periods live in the
      region. Close proximity to many military facilities also means that many active duty
      military live in the region.
   3. Affordable Housing – Rates of housing-cost burden are highest in GPW for both
      renters and homeowners when compared to other regions. Over the past five years, the
      vacancy rate in the region has dropped from 6.2% to 4.5%. Affordable housing is difficult
      to find for middle income families and almost nonexistent for families living below the
      federal poverty level.
   4. Job Training – The unemployment rate in Greater Prince William (3.6%) is well below
      the state, and the region has seen steady job growth. Yet GPW faces is the issue of a
      mismatch between the skills of low-income residents and skills needed by higher-paying,
      growing industries. Stakeholders in the region identified a need for workforce training to
      ensure that low-income individuals can access higher paying jobs and move up the
      economic ladder.

Full Needs Assessment
The data in this report come from the three localities that comprise People Incorporated’s
Greater Prince William service area: Prince William County, Manassas, and Manassas Park.
The full 2018 Community Needs Assessment and regional reports for the Southwest Virginia,
Northern Piedmont, and Northern Shenandoah Valley regions are available on the People
Incorporated website, or by calling People Inc. at 276-623-9000.

                                                1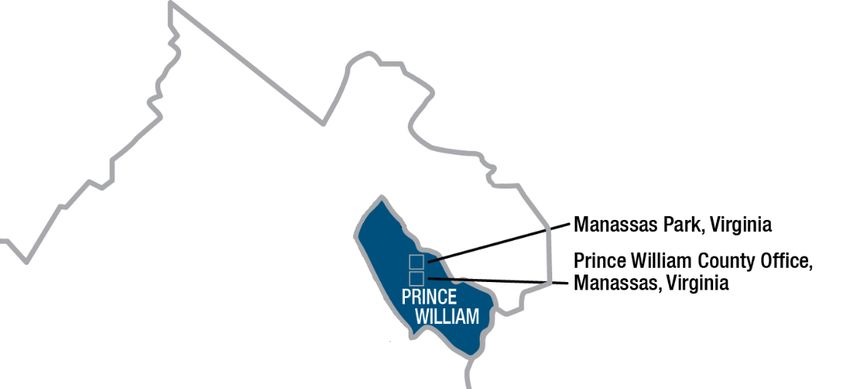
I. Methodology
People Incorporated serves thirteen counties and three cities throughout Virginia, providing 29
different programs. The data collection and analysis process used for this assessment ensured
that data was collected from a variety of sources in each of these localities.

Surveys
People Incorporated staff administered surveys to four distinct groups in the fall of 2017 to
gather data for the needs assessment.
Staff Survey
All employees at People Incorporated were given the opportunity to provide input through a
short, electronic survey in September 2017. Of the approximately 225 staff, 98 responded
(response rate of 44%). For this region report, only responses from staff who work in Greater
Prince William have been included (6 responses).
Board Survey
Similar to the staff survey, a short electronic survey was administered to the People
Incorporated Board of Directors in September 2017. Of the 42 board members, 20 completed
the survey (response rate of 48%). Even with only about half of the board members responding,
all of the People Incorporated service areas were represented. For this regional report, only
responses from board members who represent Greater Prince William have been included (4
responses).
Partner Survey
Collecting input from others who work with the low-income community throughout People
Incorporated’s service area was an important strategy for developing a comprehensive picture
of current community needs. People Incorporated staff compiled a list of over 350 partners to
survey. The survey was directly emailed to these individuals from People Incorporated staff.
Additionally, the survey link was shared at meetings with other human services organizations
during September and October 2017. A total of 301 partner surveys were completed with
substantial representation from all of the People Incorporated services areas. For this regional
report, only responses from partners who work in Greater Prince William have been included
(64 responses).
Community Survey
The most important informant group for the Community Needs Assessment was individual
members of the community. The community member survey was the longest of the surveys,
and administered on paper rather than electronically. In an effort gather feedback from low-
income community members, People Incorporated used a convenience sample. People Inc.
partnered with other organizations including food pantries, medical missions, head start
providers, and housing agencies to administer the survey. Additionally, program staff
administered the survey to current clients in conjunction with People Incorporated’s semi-annual
customer satisfaction survey. A total of 127 surveys were returned from Greater Prince William

                                                 2
residents. Nine percent of these survey respondents indicated that they had previously
received services from People Incorporated.
Focus Groups
To better understand how each need manifests in the community and individuals’ lives, People
Incorporated conducted four focus groups in Greater Prince William. This included three focus
groups with representatives of partner organizations and one focus group with the People
Incorporated board of directors. Focus groups ranged in size from 7 to 40, with an average size
of 16. Focus groups allowed us to dig in and get a better understanding of how needs are
interrelated and the unique effects they have in a community.
Secondary Data
Primary data collected by People Incorporated is supplemented with publicly available
secondary data throughout the report. Data from the US Census, Bureau of Labor Statistics,
Kids Count, Virginia Department of Education, and many other sources support our
understanding of how local needs fit into larger trends, and offer a comparison to state and
national issues. All sources of secondary data are cited within the report.
3II. Overview of People Incorporated
Greater Prince William Service Area
People Incorporated’s Greater Prince William region includes Prince William County and the
cities of Manassas and Manassas Park. This region is the most populous and urban of People
Incorporated’s service area. The large and fast growing population mirror similar trends in other
localities surrounding Washington D.C.
Figure 1. Population Trend by County1
455,210 Prince William
406,385
38,266 41,483 Manassas
14,439 15,915 Manassas Park
2010 2011 2012 2013 2014 2015 2016
The population of Prince William County is the largest in People Incorporated’s service area.
The population of Prince William County has seen rapid growth, increasing by 12% since
2010. While much smaller, Manassas and Manassas Park have also both grown (8% and
10% respectively).1
1 US Census Bureau. American Community Survey Annual Population Estimates. 2016. Table PEPAGESEX.
4Figure 2. Racial Composition by County2
Manassas 70% 14% 5% 4% 7%
Manassas Park 67% 13% 10% 4% 6%
Prince William 60% 21% 8% 5% 6%
White Black or African American Asian Two or more Race Other
All of the Greater Prince William localities are predominantly white, with Prince William County
having the most racial diversity and Manassas the least. Similarly, each region has a different
ethnic makeup. Manassas Park has the largest proportion of Hispanic residents, and Prince
William County has the least. 2 Community members and partners indicated that services for
immigrants, including ESL classes, translators, and bilingual assistance, were top needs in the
Greater Prince William community.
Figure 3. Hispanic Ethnicity by County2
Manassas Park 37% 64%
Manassas 34% 66%
Prince William 22% 78%
Hispanic Non-Hispanic
2 US Census Bureau. American Community Survey. 2012-2016 5-Year Estimates. Table B03002
5Figure 4. Population Pyramid by County3
Prince William Manassas Manassas Park
85+ 85+ 85+
80-84 80-84 80-84
75-79 75-79 75-79
70-74 70-74 70-74
65-69 65-69 65-69
60-64 60-64 60-64
55-59 55-59 55-59
50-54 50-54 50-54
45-49 45-49 45-49
40-44 40-44 40-44
35-39 35-39 35-39
30-34 30-34 30-34
25-29 25-29 25-29
20-24 20-24 20-24
15-19 15-19 15-19
10-14 10-14 10-14
5-9 5-9 5-9
Under 5 Female Male Under 5 Female Male Under 5 Female Male
The age distribution also shows a similar demographic among GPW localities.3 The median age
ranges only slightly from 33.1 in Manassas Park to 34.4 in Prince William County.4 The Greater
Prince William region has an age distribution that is much younger than any of People
Incorporated’s other regions. A region with a large and growing population of children and
young adults has needs that differ greatly from regions with an aging baby-boomer population.
Figure 5. Veteran Population by County5
7.9% 7.5%
13.0%
Prince William Manassas Park Manassas
Veterans comprise a large proportion of the population in Prince William County. The most
common period of service for veterans in the Greater Prince William region is the gulf war of the
1990s (47.3%), followed closely by post 9/11 veterans (35.86%). Over 43,000 veterans live in
the region5. The Marine Corps base at Quantico is located in Prince William County, contributing
to the almost 6,000 active duty military living in the region. 6
3 US Census Bureau. American Community Survey. 2016 Population Estimates. Table PEPAGESEX.
4 US Census Bureau. American Community Survey. 2012-2016 5-Year Estimates. Table DP05.
5 US Census Bureau. American Community Survey. 2012-2016 5-year Estimates. Table S2101.
6 US Census Bureau. American Community Survey. 2012-2016 5-year Estimates. Table DP03.
6III. Jobs, the Economy, and Financial
Growth
Employment
The unemployment rate in the Greater Prince William region has continued to decline post-
recession and remains below state and national averages in each county.7
Figure 6. Unemployment Rate7
6%
Manassas
Prince William
5% & Manassas Park
4%
3%
2%
1%
0%
2012 2013 2014 2015 2016
Even though unemployment has decreased in the last five years, partners and community
members in the Greater Prince William region identified the quantity and quality of jobs when
asked to list the top need in their community. Underemployment remains a cause and condition
of poverty throughout People Incorporated’s service area.
Among survey respondents who have had issues with getting or
29% of community
keeping a job, the largest concern was lack of transportation.
member survey
Focus group participants discussed the impacts of underemployment
respondents in the
on housing, food and nutrition, transportation, and health.
Greater Prince William
Larger, regional and national economic trends are influencing these region indicated that
employment changes. Greater Prince William localities benefit from getting or keeping a
job growth in the Washington D.C. metro area. Board members from job had been a
the Greater Prince William region discussed that many good, high problem for them in
paying jobs are available, but low-income individuals may not have the the last 12 months.
skills needed to pursue these positions. The unemployment rate for
those below the poverty level in the Greater Prince William region is
about 4 times higher than for those above the federal poverty level.8
7 Virginia LMI. Labor Force, Employment, and Unemployment Data. Annual Averages.
8 US Census Bureau. American Community Survey. 2012-2016 5-Year Estimates. Table S2301.
7Over the last ten years, Greater Figure 7. Top Industry Trends
Prince William’s fastest growing
industries were Healthcare & 24,617
Social Assistance and Retail Trade 23,249
Accommodation & Food Service.
Accommodation and Food
Service added over 5,000 jobs,
but this is the region’s lowest 19,170
paying industry. At the same time,
industries like construction that Construction 17,749 17,439
16,601
require less education while still Educational 16,408 16,556
maintaining high wages have lost Services
jobs9
Low-income persons often remain
Accommodation and Food Service 11,903 12,366
stuck in low-wage positions and Healthcare and Social Assistance 11,527
need to work multiple jobs to Professional, Scientific, and 11,084
Technical Services
make ends meet for their families.
The table below displays the
average “living wage” needed to pay for necessities in each county. A living wage is based on
the income needed to afford minimum basic needs including food, childcare, health insurance,
housing, transportation, and other necessities without budgeting for things that many Americans
enjoy like entertainment, meals at restaurants, or vacation.
Figure 8. Living Wage by Family Type10
Prince William, Manassas, and Manassas Park
One Adult One Adult One Adult One Adult Two Adults Two Adults Two Adults
One Child Two Children Three Children One Child Two Children Three Children
$15.70/hour $28.37/hour $33.03/hour $40.78/hour $15.76/hour $17.81/hour $20.76/hour
Full-time Full-time Full-time Full-time Full-time both adults Full-time both adults Full-time both adults
Achievement of employment that provides a living wage often comes with increased education
and technical knowledge. The development of skills and experience needed for higher paying
jobs was a concern voiced by all stakeholder groups we surveyed. In Virginia, an adult with a
high school diploma or equivalent has median annual earnings or $29,730, while an individual
with a bachelor’s degree earns $55,856.11
While this difference is stark, it does not take into account higher quality jobs that could be
available to low-income individuals with a certification or credential that may be quicker and
easier to attain than a formal degree. Board members at a Greater Prince William focus groups
discussed a need to prepare individuals for industries that are projected to grow in the near
future so they can meet the demand of upcoming jobs.
9 Virginia Employment Commission. Quarterly Census of Employment and Wages. 2 nd Quarter 2017.
10 MIT Living Wage Calculator. 2017
11 US Census Bureau. American Community Survey. 2012-2016 5-Year Estimates. Table B20004.
8Poverty
Figure 9. Poverty Rate by County
Compared with other regions in People
Incorporated’s service area, all localities in the
Greater Prince William region have low poverty
Prince William
rates. The proportion of the population below
the federal poverty threshold was below the
Total Population
– 455,210 state (11.4%) in all three localities. While the
rate is low, the large populations in the region
Population at or below mean that almost 36,000 people in the
federal poverty level–
7.0% Greater Prince William area are living in
poverty, with about 14,000 of them
children.12 Accordingly, the poverty rate
among children is higher than that for adults in
every locality.
Manassas
In line with state and national trends, racial
Total Population minorities are more likely to live in poverty than
– 41,483 white individuals in the Greater Prince William
region. Poverty rates are also higher for
Population at or below
federal poverty level–
females than males in all three localities.13
8.7%
Standardized federal poverty levels determine
eligibility for many state and federal assistance
programs including Medicaid, Affordable
Housing Vouchers, Head Start, Supplemental
Manassas Park Nutrition Assistance Program (SNAP), free and
reduced school lunch, and weatherization
Total Population - assistance.
15,915
For 2018, the federal poverty levels (FPL) by
Population at or below
federal poverty level– household size are:
8.7%
1 Person $12,060
2 People $16,240
3 People $20,420
4 People $24,600
More Add $4,180 each
These levels are far below the living wage levels indicated in the previous section, meaning that
individuals and families who live above the federal poverty level but below a living wage may be
in desperate need of assistance but ineligible for safety net programs.
12 US Census Bureau. American Community Survey. 2012-2016 5-Year Estimates. Table DP03.
13 US Census Bureau. American Community Survey. 2012-2016 5-Year Estimates. Table S1707.
9The United Way has spearheaded research on these individuals, which they label “ALICE” –
asset limited, income constrained, employed. While 11% of Virginians fell below the federal
poverty threshold in 2015, 39% fell below the ALICE threshold.14
Figure 10. ALICE Households by County
Prince William 6% 29% 65%
Manassas
6% 41% 53%
Park
Manassas 8% 43% 49%
Using the FPL can be misleading when over one-third of families are struggling to get by in
People Incorporated’s Greater Prince William service area.
Another way to look at income distribution is through median annual household income The
median income varies greatly across region at $98,546 in the county, and much lower in the
cities of Manassas ($74,371) and Manassas Park ($75,027). Median income in Prince William
County is among the top 10% in the state.15
Figure 11. Median Annual Household Income by County
$74,371 $75,027 $98,546
$70,000 $75,000 $80,000 $85,000 $90,000 $95,000 $100,000
14 United Ways of Virginia. 2017. “ALICE: Asset Limited, Income Constrained, Employed. Virginia.”
15 US Census Bureau. American Community Survey. 2012-2016 5-Year Estimates. Table DP03.
10Transportation
Transportation came out as a top issue in survey and focus group data for the Greater Prince
William region. According to focus group feedback, the current public transportation system isn’t
meeting the population’s need. Lack of bus service west of Manassas means that many
residents do not have access to public transit. Additionally, funding for public transit is
decreasing because of reduced revenue from motor fuel taxes. Partners serving the homeless
population also asserted that transportation is an obstacle clients face in obtaining and
maintaining employment.
Twenty-eight percent of community survey respondents in the Greater Prince William
area said they did not have reliable transportation. Reliable transportation is crucial to
maintaining stable employment, but also effects the ability to attend regular medical
appointments.
For many Prince William are residents, a personal vehicle is the only available means of
transportation for work, medical appoints, and basic errands. Across the region, about 4,500
households have no vehicle available.16
For those who do have access to transportation, commute times in Greater Prince William are
some of the highest in People Incorporated’s service areas, being only a minute shorter on
average than the Northern Piedmont region.17 Long commute times may just seem like an
inconvenience, but a recent Harvard study shows that the longer an average commute time in a
given county, the less likely it is that a low-income family will experience upward economic
mobility.18
Figure 12. Average Commute Time in Minutes
Manassas Park 39.6
Prince William 39.3
Manassas 34.2
0 10 20 30 40 50 60
16 US Census Bureau. American Community Survey. 2012-2016 5-Year Estimates. Table B08201.
17 US Census Bureau. American Community Survey. 2012-2016 5-Year Estimates. Table DP03
18 Chetty, Raj, Nathaniel Hendren, Patrick Kline, and Emmanuel Saez. 2014. “Where is the Land of Opportunity? The
Geography of Intergenerational Mobility in the United States.”
11IV. Housing
Housing was the top individual and community need listed by community members in the
Greater Prince William region. Housing was, by far, the top community need identified by
partners as well; twice as many partners identified housing as the greatest community need as
any other issue. Former Governor McAuliffe’s issuance of Executive Order 32 in 2014, to
“identify and implement actions to enable quality, affordable housing,” further underlines the
need across the commonwealth.19
Housing Quality and Quantity
During focus groups, partners and board members from the Greater Prince William region
discussed the limited quantity of housing for rapidly growing population. The limited housing
stock means that the lowest-income individuals and families often end up in the cheapest and
lowest quality housing units. Across the region, renter occupied units tend to be older than
owner occupied units.20 This means that renters, who are often lower income, are more likely to
face issues that come with old houses, like inadequate weatherization or electrical and plumbing
that are not up to current code. Low-income renters often also have fewer options in their price
range, and those that are affordable may be low-quality or even unsafe.
Reflecting the growing population,
Figure 13. Vacancy Rates20 vacancy rates in all three localities
have steadily decreased over the last
Manassas
Park
12.2% five years.20
Low vacancy rates can impact low-
income families in many ways. When
fewer homes are available in a growing
Manassas8.5% geographic area, costs often rise,
decreasing the number of affordable
7.1% homes. Similarly, when few homes are
available, families with better credit or
Prince 5.8%
rental histories will likely win out over
William
those with less stable finances. These
4.3% factors may force economically
3.3% disadvantaged families to live further
from economic centers to find affordable
housing. Migration out of urban centers
because of housing cost increases
commute times and increases demand
for public transportation in suburban
2012 2016
communities like many of those in Prince
William County.
19 Virginia Coalition of Housing and Economic Development Researchers. 2017. “Addressing the Impact of Housing
for Virginia’s Economy: A Report for Virginia’s Housing Policy Advisory Council.”
20 US Census Bureau. American Community Survey.2012-2016 5-Year Estimates. Table DP04.
12Affordable Housing
Twenty-eight percent of survey respondents in the GPW region affirmed that they had
chosen between paying for housing and paying for other basic needs in the past year.
When housing costs are too high, families must make the difficult choice of which needs are
most important and what needs won’t be met that month. A 2017 report to the Virginia Housing
Policy Advisory Council found that Virginia has a shortage of affordable housing, and this has
major implication for state policy priorities like workforce development, transportation, education,
and health.21
Partners and board members discussed that the development of affordable housing has not
been able to keep up with demand. The waiting list for Housing Choice Vouchers in Prince
William County is over 5 years. Almost no options exist for families making below 30% of Area
Median Income.
One-third of households in
Figure 14. Housing Cost Burdened Households by the Northern Piedmont are
Type24 housing cost burdened22.
However, over 50% of
Renter renters are housing cost
52.6% 54.0% burdened. For families living
below, or even a little above,
45.6% the poverty threshold,
housing comprises a much
36.3% larger proportion of monthly
Homeowner income.
25.2% 25.1% Housing cost-burdened
adults are less able to spend
their limited funds on
necessary medical costs like
prescriptions or health
insurance. For children,
Prince William Manassas Manassas Park being cost burdened means
that a family is less likely to
spend their income on child enrichment, which affects economic potential into adulthood. When
families are forced to settle for housing that is affordable to them, they may also lose access to
other social and cultural resources. High cost communities and neighborhoods often have
higher quality K-12 schools. More affordable housing is often in less desirable locations that
may be farther from community goods and services like supermarkets, banks, and social
service providers.
21 Virginia Coalition of Housing and Economic Development Researchers. 2017. “Addressing the Impact of Housing
for Virginia’s Economy: A Report for Virginia’s Housing Policy Advisory Council.”
22 US Census Bureau. American Community Survey. 2012-2016 5-Year Estimates. TableDP04. For this report,
Housing Cost Burdened is defined as spending 30% or more of a household’s income on housing.
13Partners in the Greater Prince
Figure 15. Housing demand in Northern Piedmont23
William region emphasized that the
demand for affordable housing is
much greater than the supply. The 162,591
gap between the number of 7,329 unit
households living the region and gap
155,262
the number of housing units
151,708
available has been steadily
23 10,891 unit
decreasing in recent years.
gap
Development of housing is not
keeping up with population growth. 140,817
This relationship puts a squeeze on
the market, driving up the cost of
housing for both renting and 2010 2012 2014 2016
purchasing a home. The large
demand and small supply of affordable housing means there are waiting lists for these
properties.
Mobility
Low-income individuals also move residences at a higher rate than their higher income
counterparts. In the Greater Prince William region, like most of the People Incorporated service
area, individuals living below the federal poverty level are almost twice as likely to have moved
in the past year as those living above the FPL.24
When families move due to increasing housing costs, children often move schools, negatively
affecting academic performance and social development.25
Figure 16. Percentage of Individuals Moved in the Last Year by Poverty Status
Above FPL Below FPL
Manassas Park 15.8% 39.1%
Manassas 13.2% 33.4%
Prince William 13.8% 23.6%
23 US Census Bureau. American Community Survey. 2012-2016 5-Year Estimates. TableDP04
24 US Census Bureau. American Community Survey. 2012-2016 5-Year Estimates. Table B07012.
25 Roy, Joydeep, Melissa Maynard, and Elaine Weiss. 2008. “The Hidden Costs of the Housing Crisis.” The
Partnership for America’s Economic Success.
14Homelessness
Measuring the number and characteristics of homeless individuals in a community is a difficult
process. The data here represent the Point-in-Time (PIT) count method used by the Department
of Housing and Urban Development. For the PIT method, service provider work to count the
literally homeless individuals in emergency shelter, transitional housing, or unsheltered.
Over the past five years, the PIT count has shown a decrease in the number of homeless
persons living in Prince William County, Manassas, and Manassas Park. 26
Figure 17. Homeless Individuals in Greater Prince William
447 445
409
400 400
2013 2014 2015 2016 2017
The Prince William Continuum of Care identified 400 homeless individuals in the 2017 PIT.
Thirty-three percent (131) of these individuals were children.
While the point-in-time count does capture a portion of
“There are many people
households who do not have permanent housing, it misses
living in the homes of others
individuals and families that might staying with friends until they
because they cannot afford
can afford a deposit on their own place or those who are living in
their own home. Rent is too
week to week hotel rooms. Twenty-nine percent of Greater
expensive.”
Prince William respondents to the community member
- Manassas survey had shared housing with another household to avoid
Community Member being homeless in the past year.
Board members and partners also discussed needs related to
homelessness at focus groups. They identified a need for more transitional and permanent
supportive housing. Homeless individuals and families need a lot of support to make a
successful transition into their own permanent housing. Giving them time to get on their feet
while living in transitional or supportive housing can make this transition more gradual and more
successful.
26Metropolitan Washington Council of Governments. May 2017. “Homelessness in Metropolitan Washington: Results
and Analysis from the Annual Point-in Time (PIT) County of Persons Experiencing Homelessness.”
15V. Education
Survey and focus group respondents mentioned the need for education in various ways.
Primary was the need for technical and workforce education targeted to higher paying
jobs. Partners and board members recognized the importance of workforce and technical
education as a path to greater earnings for low-income individuals.
Educational Attainment
Educational attainment in the Greater Prince William region is the highest of any of People
Incorporated’s service regions. Residents in this region are more likely to have both a high
school diploma and a bachelor’s degree.27
Figure 18. Educational Attainment27
Prince William Manassas Manassas Park
High School High School
Diploma or Higher Diploma or Higher High School
89.0% 81.5% Diploma or Higher
82.5%
Bachelor’s or Bachelor’s or Bachelor’s
Higher Higher or Higher
39.4% 30.0% 30.4%
Graduating from high school on time has a large
Figure 19. On-time Graduation Rate impact for both the individual’s lifetime earning
potential and for the economy. In Prince William
County, median annual earnings for someone
who did not graduate high school are $27,604 and
Manassas Park
90.6% $33,184 for someone with a high school
diploma.28 Similarly, the unemployment rate for
dropouts in Virginia is 1.5 times higher than that
Manassas Prince William
for high school graduates. On time high school
78.4% 91.8%
graduation rates range from a low of 78.4% in
Manassas City to 91.8% in Prince William
County.29
27 US Census Bureau. American Community Survey. 2012-2016 5-Year Estimates. Table S1501.
28 US Census Bureau. American Community Survey. 2012-2016 5-year estimates. Table S1501
29 Virginia Department of Education. State Level Cohort 4-Year Report 2017
16VI. Children and Youth
Almost 140,000 children live in People Incorporated’s Greater Prince William service area.30
The population of children is expected to grow by over 43,000 by 2040.31
Figure 20. Population growth for children under 15
152,005
Prince William 111,512
Manassas 10,631 12,161
Manassas Park 3,882 5,180
2020 2040
Kindergarten Readiness
Entering school ready to learn can have significant long-term benefits for children on education,
employment, earnings, marriage, and health.32 For the 2017-2018 academic year, 84% of
children in Virginia entered
kindergarten with appropriate Figure 21. 2017 Kindergarten Readiness Rates
reading levels. Readiness
varied among counties, with
Virginia, 84%
Manassas having the smallest
percentage of ready children 81%
and Prince William County the
largest.33
64% 66%
Manassas Manassas Park Prince William
30 US Census Bureau. American Community Survey. Annual Population Estimates. 2016. Table PEPAGESEX.
31 Demographics Research Group of the Weldon Cooper Center for Public Services. June 2017.
32 Heckman, James, Rodrigo Pinto, and Peter Svelyev. 2013. “Understanding the Mechanisms Through Which an
Influential Early Childhood Program Boosted Adult Outcomes.” American Economic Review 103(6).
33 Virginia Department of Education. PALS-K for fall 2018 kindergarten entry.
17Childcare
According to board and partner focus groups, affordable childcare and early childhood
education are important needs in the region. Top concerns related to childcare fall in to the
following categories:
Affordability of care
While the Virginia Department of Social Services does provide subsidies for childcare to low-
income families, issues remain with the number of centers who are willing to accept the
vouchers and for families that make too much to qualify for subsidies, but too little to afford
quality childcare. In some areas, families who may qualify still cannot get subsidies because of
the waitlist. During a focus group, partners shared that about 200 households are currently on
the waiting for childcare subsidies in Prince William County.
In Virginia, center-based
As of February 2018, only 46% of the registered childcare providers in childcare costs an
the Greater Prince William region provide subsidies, and only 29%
average of $12,792 a
provide full time care and accept subsidies. 34 The average cost of
year for one infant.
childcare in Virginia is 43% of the median earnings for someone with a
high school diploma.35 Spending almost half of one’s income on For an infant and a 4-
childcare leaves little left to pay for housing, food, and other basic needs year old, the cost jumps
to $22,360 a year.35
Availability of care
Availability of childcare is an issue in many cities across the country
experiencing population growth. In the Greater Prince William area, 54% of registered providers
offer full-time licensed care. However, there are even less care providers for newborns less than
one-year old. Only 47% of providers offer licensed newborn care.
Title I preschool and the Virginia Preschool Initiative have greatly expanded care for four-year-
olds across the state. In the fall of 2017, 1,821 children under five were enrolled in preschool
programs at public schools across the region.36 Publicly available preschool at no cost to
parents is a step in the right direction to addressing the affordability and availability needs
related to childcare and early childhood education.
Even with existing efforts at improving childcare access, a large gap still remains between the
number of children that may need care and the number of available childcare slots with qualified
providers. According to 2016 US Census Bureau estimates, about 38,000 children under age
five live in the Greater Prince William service area.37 If all 26,358 registered provider slots are
filled, and an additional 1,828 children are in public preschool, that still leaves almost 10,000
children without registered care in the Greater Prince William service area. Some of
these families may not have their children in center by choice, while others may rely on friends
or family, or use unregulated and unregistered providers because it’s the only affordable option.
34 Virginia Department of Social Services. Child Day Care. Searched February 2018.
35 US Census Bureau. American Community Survey. 2012-2016 5-Year Estimates. Table S1501.
Childcare Aware of America. “Parent and the High Cost of Child Care: 2017 Report.”
36 Virginia Department of Education. Fall 2017 Membership Data.
37 US Census Bureau. American Community Survey 2016 Annual Population Estimates. Table PEPAGESEX.
18 Conflict between care schedules and employment schedules
Focus group and survey respondents commented on the lack of childcare for individuals
who work other than traditional work hours. This may include manufacturing workers or
healthcare professionals who work nights, or those who work retail or restaurant jobs that might
have evening shifts. When extended childcare hours are available, they often cost more than
standard daytime hours.
Licensing and quality of care
In the Greater Prince William area, 72% of providers registered with the Department of
Social Services are licensed.38 Of all People Incorporated’s service regions, Prince William
has both the largest number and largest proportion of licensed providers. One common provider
of unlicensed care is religious institutions that are classified as “religious exempt.” These
centers are not subject to the same regulation and inspection standards as licensed facilities.
Recent federal legislation expanded requirements for religious exempt centers that receive
subsidies in an attempt to improve quality and accountability. Partners discussed that meeting
these standards can sometimes be cost prohibitive for churches. Board members commented
on the need for more support to help centers become licensed and for providers to become
better trained.
Figure 22. Proportion of Registered Child Day Care Providers with a License
Prince William Manassas Manassas Park
71% 78% 100%
licensed licensed licensed
Virginia has implemented multiple initiatives and programs with the goal of improving the quality
of child care and early childhood education in the state. The Virginia Quality program is a
voluntary quality rating and improvement system that provides support to all types of providers
that seek to improve that quality of care. Families can use the Virginia Quality website to explore
the quality of participating providers in the domains of basic health and safety, education and
qualifications, curriculum and assessment, and environment and interactions.39 The Virginia
Department of Social Services and The Virginia Early Childhood Foundation jointly administer
the Virginia Quality program.
The Virginia Early Childhood Foundation also heads the statewide Smart Beginnings network.
Smart Beginnings works to build partnerships and systems change to increase capacity to
38 Virginia Department of Social Services. Child Day Care. Searched February 2018.
39 Virginia Quality. Virginia Department of Social Services. www.virgininaquality.com
19provide quality early childhood development at the local level. Smart Beginnings programs exist
in all localities served by People Incorporated.
Even with these, and other, initiatives, access to care that is both high quality and affordable
remains a barrier to many families.
Head Start Supplemental Info
Eligibility Estimates
As a Head Start and Early Head Start grantee, People Incorporated reports on data specific to
the needs of low-income children and families in our service area related to child care and early
childhood education. This section specifically outlines those data points as specified by the
Head Start Program Performance Standards.
For each locality, estimates of eligible Head Start and Early Head Start children are presented
as a range, based on free-lunch methodology. 40
Figure 23. Estimated Number of Head Start Eligible Children
Manassas Park
198 283
Manassas
573 819
Prince William
4,105 5,864
Figure 24. Estimated Number of Early Head Start Eligible Children
Manassas Park
297 424
Manassas
860 1,229
Prince William
7,308 10,440
40The authors of this report used the Free Lunch Method to estimate the number of children eligible for Head Start
and Early Head Start services. Details on this method are found in Appendix J.
20Foster Care
In the Greater Prince William region, 116 children were in foster care as of January 1, 2018.
Of all of People Incorporated’s regions, Greater Prince William has the smallest proportion of its
children in foster care.
Figure 25. Children in Foster Care as
of January 1, 2018
96
17
3
Manassas Park Manassas Prince William
21VII. Nutrition, Health, and Wellness
Substance Abuse and Mental Health
Partners identified substance abuse and mental health services as important needs in their
community.
In just the past few years, opioid abuse has come to the top of concerns for communities
because of its direct impact on health, employment, child development, homelessness, and
overall financial wellbeing. For Americans under 50, drug overdose is now the leading
cause of death41. Based on the feedback we received, mental health services and substance
abuse services are joint needs that must be addressed simultaneously.
Since 2012, the rate of Narcan administration by EMS has risen substantially in both
Manassas and Manassas Park, but remains low in Prince William County.42
Figure 26. EMS Narcan Administration Rate42
108.1 Manassas Park
86.2 Manassas
18.9
19.7
4.7 5.3 Prince William
2012 2013 2014 2015 2016
41 National Institutes of Health. Initiative to Help End the Opioid Crisis. www.nih.gov/opioid-crisis. Accessed Feb
2018.
42 Virginia Department of Health. Opioid Addiction Indicators Dashboard.
22Focus group participants in Greater Prince William discussed the shortage of substance abuse
and mental health services and providers to meet the growing need. Partners also noted that
the local Community Services Board is having difficulty recruiting staff to provide these services.
The number of residents per mental health
Figure 27. Ratio of Residents per Mental providers is 968:1 in the Greater Prince William
Health Provider
region, which is higher than the state rate.
Individuals recovering from substance abuse need
Prince William
intensive care and support. Assistance with housing,
1:1,065 food, and life skills are essential to continuing
sobriety. This is especially true for special
populations including those recently incarcerated,
those with physical disabilities, and those with
Manassas
concurrent medical and mental health illness. While
1:409 about half of individuals with substance abuse
issues participate in treatment programs while in
prison, only one-quarter are still receiving those
services eight to ten months after release.43
Virginia Individuals with physical and sensory disabilities
1:730 may have difficulty getting treatment because of
facility accessibility or lack of staff who are trained to
work with visually or hearing impaired clients.44
It is also important to note that mental health care for children and youth is an aspect of this
need. Of survey respondents who had children, 22% said they’d experienced emotional
and behavioral problems with their children in the last 12 months.
43 Mallik-Kane, Kamala and Christy Visher. 2008. “Health and Prisoner Reentry: How Physical, Mental, and
Substance Abuse Conditions Shape the Process of Reintegration.” Urban Institute Justice Policy Center.
44 Substance Abuse and Mental Health Services Administration. 2011. “Substance Use Disorders in People with
Physical and Sensory Disabilities.” In Brief (6):1.
23Affordable Health and Dental Care
When asked to score the importance of almost 30 needs, Greater Prince William community
members scored affordable health and dental care as third highest, and partners scored it with
highest importance.
Access to affordable healthcare is especially important for those who are not covered by safety
net programs and cannot access or afford insurance coverage through their employer or the
marketplace.
Rates of insurance coverage are much lower among households making less than
$25,000 a year.45
Figure 28. Insurance Coverate Rates
Income >
Manassas Park 64.9% 78.9% $25,000/year
Income < $25,000/year Income > $25,000/year
Manassas 70.7% 82.0%
Prince William 73.8% 88.4%
50.0% 55.0% 60.0% 65.0% 70.0% 75.0% 80.0% 85.0% 90.0%
Focus group participants illuminate multiple facets of how this need affects low income families
across the region:
Many individuals do not have dental coverage
Healthcare options that do exist are not affordable
Finding affordable transportation to access healthcare resources is a major hurdle
Accessing health services becomes low priority when low-income families are trying to
balance work, children, transportation, etc.
45 US Census Bureau. American Community Survey. 2012-2016 5-Year Estimates. Table S2701.
24Nutrition
Eighteen percent of respondents to the community member survey said they have gone
hungry in the past 12 months, despite the fact that 57% receive Supplemental Nutrition
Assistance (SNAP) and 38% have used food banks or pantries.
26,300 individuals in the Greater Prince
Figure 29. Food Insecurity Rate by Locality William area are food insecure46, including
over 9,800 households who receive SNAP
benefits.47 Food insecure families lack access
to enough food for active, healthy lifestyles and
have limited availability of nutritionally
Manassas Park adequate food.
3.6%
Access to affordable, healthy food has health
impacts. Obesity rates across the United
States have a close relationship with poverty,
though it varies greatly by race and gender.48In
Prince William the United States, women who live below
Manassas 6.0% 130% of the federal poverty level are
5.0%
significantly more likely to be obese than those
who are less poor. A similar relationship exists
for children and adolescents. According to data
from the CDC, “low income children and
adolescents are more likely to be obese than
their higher income counterparts.”4950
Figure 29. Adult Obesity Rates50
Focus group participants also expressed
concern around increasing rates of
diabetes in their communities. They 28.7% 28.3%
suggested a need for improved nutrition 25.5%
education and better access to healthy
foods. They identified a need to encourage
use of SNAP benefits at local farmer’s
markets and acknowledged the link
between nutritious food and the ability to
work.
Manassas Manassas Park Prince William
46 Feeding America. Map the Meal. 2015 Data.
47 US Census Bureau. American Community Survey. 2012-2016 5-Year Estimates. Table DP03.
48 Desilver, Drew. 2013. “Obesity and poverty don’t always go together.” Pew Research Center .
49 Ogden, Cynthia, Molly Lamb, Margaret Carroll, and Katherine Flegal. 2010. “Obesity and Socioeconomic Status in
Children and Adolescents: United States 2005-2008.” NCHS Data Brief No. 51.
50 Centers for Disease Control and Prevention. Diabetes Atlas. 2013 Data
25VIII. Other Key Findings
Coordination, Collaboration, and Community
Community members, partner organizations, and board members also aligned on needs that
don’t fit into a specific service category. These need to improved coordination and collaboration
among service providers and improvement in the overall sense of support in the community
influence all of the needs discussed thus far.
The need for better coordination and collaboration was particularly important to partners we
heard from. They discussed the difficulty of navigating the many organizations that provide
assistance to low-income individuals. Moving someone out of poverty takes a wide variety of
services and supports, which are often provided by a variety of organizations. Greater
coordination among these providers could create a strategic approach to serving an individual
or family, ensuring that they are connected with each service they need.
While partners were concerned with the logistics of providing coordinated services, community
members identified a need for a stronger sense of community. Greater Prince William
community members want more positive ways for the community to interact, ways they can
support each other.
Stakeholders from all levels are looking for a better way to work together so that people in need
receive help.
26Appendices
Appendix A. Demographic Statistics by County
Manassas Greater Prince
Manassas Park Prince William William Total
Total Population 41,483 15,915 455,210 459,090
Percent White Alone 69.63% 66.55% 60.41% 61.37%
Percent Black/African
Racial and Ethnic Distribution
13.75% 12.98% 20.64% 19.83%
American Alone
Percent Native American
0.81% 0.13% 0.34% 0.38%
Alone
Percent Asian Alone 5.33% 9.95% 7.95% 7.79%
Percent Hawaiian/Pacific
0.25% 0.08% 0.13% 0.14%
Islander Alone
Percent Other Race Alone 6.14% 5.92% 5.16% 5.26%
Percent Two or More Races 4.08% 4.38% 5.37% 5.24%
Percent Hispanic of Latino
34.10% 36.53% 21.89% 23.36%
(of any race)
Sex
Percent Female 50.29% 47.01% 50.18% 50.09%
Age
Median Age 34.4 33.4 33.1
Source: American Community Survey: 2016 5-year Estimates. U.S. Census Bureau
27Appendix B. Armed Forces and Veterans
Characteristics by County
Prince Greater Prince William
Manassas Manassas Park
William Total
Active Duty
28 41 5,900 5,969
Military
Gulf War (2001
Veteran Period of Service
21.9% 34.1% 36.7% 35.9%
or later)
Gulf War (1990-
28.7% 37.8% 48.6% 47.4%
2001)
Vietnam Era 43.1% 30.3% 24.3% 25.4%
Korean Era 5.8% 1.5% 3.5% 3.6%
WWII Era 1.9% 0% 1.5% 1.5%
Veterans as a
Percent of Total 7.5% 7.9% 13.0% 12.4%
Population
Poverty Rate for
6.7% 2.8% 2.1% 2.3%
Veterans
Unemployment
7.4% 2.2% 2.7%
Rate for Veterans
Source: US Census Bureau. American Community Survey. 2012-2016 5-Year Estimates.
Tables DP03 and S2101.
28Appendix C. Unemployment Rate by County
Greater Prince William
Manassas Manassas Park Prince William Total
2012 5.6% 5.3% 5.3% 5.3%
2013 5.4% 5.1% 5.2% 5.2%
2014 5.0% 4.8% 4.9% 4.9%
2015 4.2% 4.2% 4.1% 4.1%
2016 3.6% 3.5% 3.6% 3.6%
Source: Virginia Employment Commission: Local Area Unemployment Statistics
29Appendix D. Employment and Wages by Industry
Manassas Prince Greater Prince William
Manassas Park William Total
# of
employees
2,186 79 14,336 16,601
Accommodation and
Avg.
Food Service Weekly $340 $436 $344 $344
Wage
Admin, and Support # 1,616 350 6,589 8,555
and Waste Avg.
Management Weekly $697 $658 $746 $745
Wage
# 0 0 83 83
Agriculture, Forestry, Avg.
Fishing, and Hunting Weekly N/A N/A $762 $762
Wage
# 237 * 4,722 *
Arts, Entertainment, Avg.
and Recreation Weekly $442 * $496 *
Wage
# 1,674 1,204 13,678 16,556
Construction Avg.
Weekly $1,082 $951 $1,086 $1,076
Wage
# 1,524 552 17,094 19,170
Educational Services Avg.
Weekly $920 $903 $883 $887
Wage
# 406 23 2,132 2,561
Finance and Insurance Avg.
Weekly $1,225 $600 $1,337 $1,313
Wage
# 3,922 25 13,492 17,439
Healthcare and Social
Assistance Avg.
Weekly $1,054 $563 $864 $906
Wage
# 57 16 1,538 1,611
Information Avg.
Weekly $1,559 $780 $1,198 $1,207
Wage
Management of # 130 * 770 *
Companies and Avg.
Enterprises Weekly $1,209 * $1,513 *
Wage
Source: Virginia Employment Commission. Quarterly Census of Employment and Wages. 2 nd Quarter 2017.
30Appendix D. Employment and Wages by Industry
continued
Manassas Prince Greater Prince William
Manassas Park William Total
# 1,945 167 2,054 4,166
Manufacturing Avg.
Weekly $1,735 $706 $1,199 $1,429
Wage
# * 0 89 *
Mining, Quarrying, Avg.
Oil and Gas Weekly * N/A $1,401 *
Wage
# 903 171 4,573 5,647
Other Services Avg.
Weekly $868 $790 $665 $701
Wage
# 3,153 115 9,098 12,366
Professional,
Scientific, and Avg.
Technical Services Weekly $1,934 $1,330 $1,584 $1,671
Wage
# 1,219 324 7,513 9,056
Public Administration Avg.
Weekly $1,523 $204 $1,657 $1,587
Wage
# 245 79 1,747 2,071
Real Estate and Avg.
Rental and Leasing Weekly $1,098 $808 $930 $945
Wage
# 2,067 182 22,368 24,617
Retail Trade Avg.
Weekly $743 $762 $547 $565
Wage
# 460 * 2,521 *
Transportation and
Warehousing Avg.
Weekly $1,123 * $995 *
Wage
# * 0 728 *
Utilities Avg.
Weekly * N/A $1,585 *
Wage
# 394 225 2,988 3,607
Wholesale Trade Avg.
Weekly $1,316 $1,647 $1,139 $1,190
Wage
Source: Virginia Employment Commission. Quarterly Census of Employment and Wages. 2 nd Quarter 2017.
* Value is reported by VEC as confidential because of low number of employment in the industry
31You can also read