Haringey at a glance State of the Borough - April 2021 - Haringey Council

Page created by Steven Reed
 
CONTINUE READING
Haringey at a glance State of the Borough - April 2021 - Haringey Council
Haringey at a glance
State of the Borough

April 2021
Haringey at a glance State of the Borough - April 2021 - Haringey Council
Contents
1.    User Guide…………………………………………………………………………………………………….3
2.    Haringey Snapshot……………………………………......…………………………………………………4
3.    COVID-19……………………………………………………………………………………………………..5
4.    Housing…………………………………………………………...................……………………………….9
5.    People: Adults…………………………………………………...................……………………………….15
6.    People: Children & Young People……………………………...................………………………………29
7.    Place…………………………………………………………...................…………………………………41
8.    Local Economy…………………………………………………………...................…………………...…54
9.    Key Groups…………………………………………………………...................………………………….63
10.   Appendix A: Explaining the Data…………………………………………………………........................67
11.   Appendix B: Sources…………………………………………………………...................…………….…69
Haringey at a glance State of the Borough - April 2021 - Haringey Council
State of the Borough Profile

The State of the Borough Profile has been put together to provide all Haringey’s stakeholders – from
Officers and Councillors to Residents – with access to the data they need to understand the borough.
Only the most up-to-date and reliable data and sources have been included here, in order to provide
an in-depth look at key areas of the Council’s work and remit, which often also includes the work and
 remit of our key partners. This single point of reference will be updated regularly, and used to drive
  the Council’s work, ensuring that our work is driven by the highest quality and most robust data.
   Additional information on the data, sources and methodologies we’ve used to put together this
   profile can be found in the Appendix at the end. If you have questions about this profile please
            contact our Business Intelligence team: business.intelligence@haringey.gov.uk.
Haringey at a glance State of the Borough - April 2021 - Haringey Council
Haringey Snapshot

                            HOUSING                                                                     PEOPLE
 • In terms of tenure, the proportion of Haringey residents that    •     Haringey is a highly diverse borough. 38% of residents are from BAME
   are renting from a private landlord has increased since 2011           groups and 26% identify as “white other”. 180+ languages are spoken.
       (now 34%), while the proportion renting from LA has          •     Deprivation levels are high, particularly in the northeast of the borough.
                        decreased (now 20%).                         •    GCSE attainment has improved comparative to England, but is below
• Haringey has the third highest rate of households in Temporary                        London, there are notable attainment gaps.
  Accommodation in London, and the population outnumbers the             • Life expectancy in the borough is in line with the London average,
      availability of housing by approximately 12,000 people.                   though there are stark differences among different groups.
                                                                     •    Haringey residents report higher levels of life satisfaction than SNs or
                                                                             London, though there are higher rates of serious mental illness.

                                PLACE                                                       LOCAL ECONOMY
 • Facilities are good, with a range of cultural events and good    • Jobs density in Haringey is relatively low, although the unemployment
     transport links. Haringey also now has 25 Green Flag Parks.             rate has improved to be just above the London average.
  • The rate of knife crime with injury is the highest in London.    • Wages in Haringey are lower than average, and there are a larger
    • 78% of residents say they have good friendships and/or              number of JSA and ESA claimants than the London average.
        associations in their local area, while 83% say relations     • 5.5% of residents have no qualifications, lower than the London
     between different ethnic and religious communities are good.                                    average
   • Haringey has reduced its carbon emissions by 36% since          • Median hourly pay in Haringey is now only 2.2% below the London
        2005, and emissions are below London and UK levels.             average; we also have the second largest proportion of residents
                                                                       earning below the London Living Wage of all Inner London boroughs
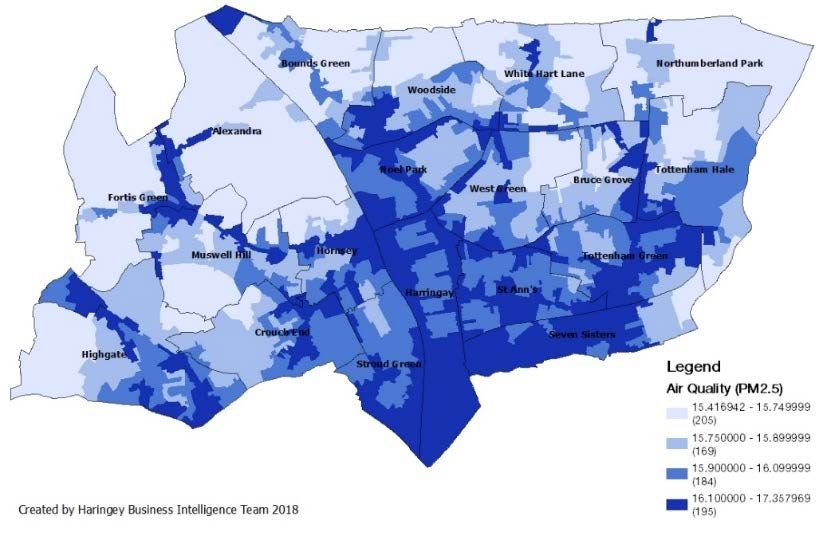
Haringey at a glance State of the Borough - April 2021 - Haringey Council
COVID-19
Haringey at a glance State of the Borough - April 2021 - Haringey Council
COVID-19: General Information

•   Over 10,000 residents in NHS extremely vulnerable ‘Shielded Group’ in Haringey in 2021. Over 4,400 of these have
    registered through Gov. website for support.

•   Over 10,000 people had contacted the Connected Communities helpline already by mid-July 2020, and have been spoken to
    and offered information, advice, guidance and direct support (excluding Shielders).

•   Older people, BAME communities, people with disabilities, and people from disadvantaged socio-economic background have
    been more affected by the covid-19 virus in terms of illness and deaths

•   Significant gender inequalities have emerged during the lockdown. While men have been more likely to die from covid-19,
    women have been disadvantaged in areas including childcare and employment. Women from BAME communities have been
    disadvantaged to a greater extent

•   Children and young people have been disadvantaged to a greater extent than others in terms of mental health, access to
    education, and employment

•   The local economy will be severely impacted in terms of (un)employment and business viability, and Poverty will increase,
    though the full extent of the increase is not yet known
Haringey at a glance State of the Borough - April 2021 - Haringey Council
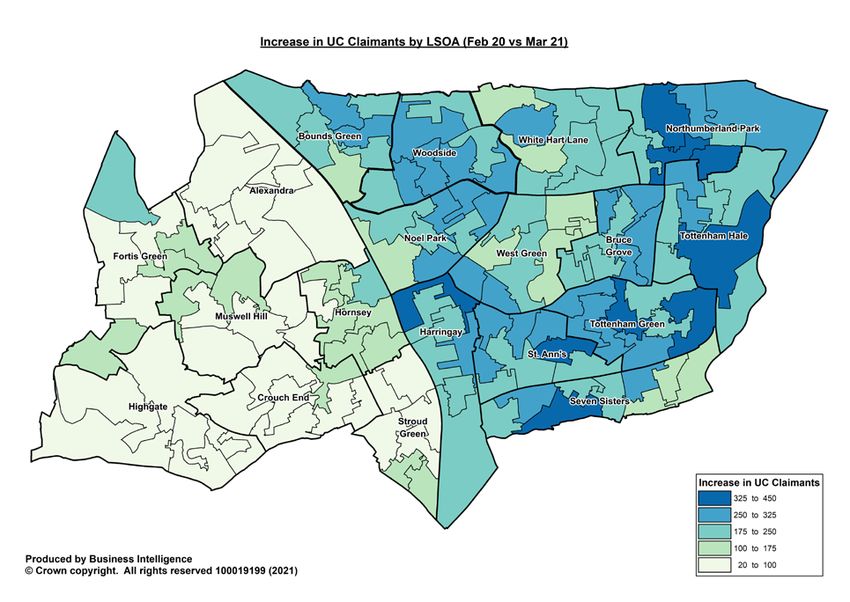
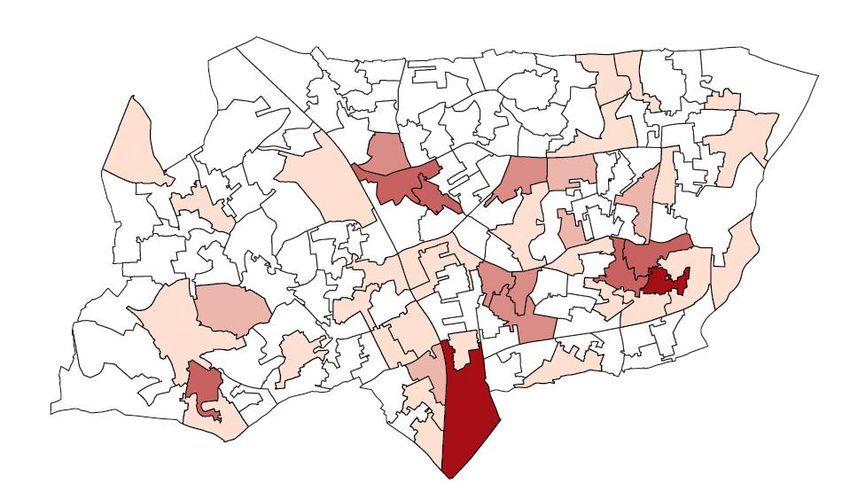
COVID-19: Effect on Universal Credit
    The latest DWP local data shows a huge increase in Universal
    Credit declarations/ claims being made and individual
    claimants due to COVID-19. This increase was sharpest at
    the start of the pandemic, with the majority of the increase
    happening between March and May 2020, however there has
    been a steady rise in the number of claimants ever since.

    The number of individuals claiming universal credit has
    increased in every LSOA (hence every ward).

    The overall number of UC claimants has increased by 27,900
    (+192%) from Feb 20 to Mar 21.

    The Wards in Haringey with the largest increases in claims
    are: Tottenham Green (2,295), Northumberland Park (2,245),
    and Tottenham Hale (2,126)

    The majority of UC claimants are still in the East part of the
    Borough with the wards with the highest number of claimants
    overall being; Northumberland Park (3,863 claimants),
    Tottenham Green (3,463), Tottenham Hale (3,293), Bruce
    Grove (3,150) and Seven Sisters (3,037) accounting for 39%
    of all claimants.
Haringey at a glance State of the Borough - April 2021 - Haringey Council
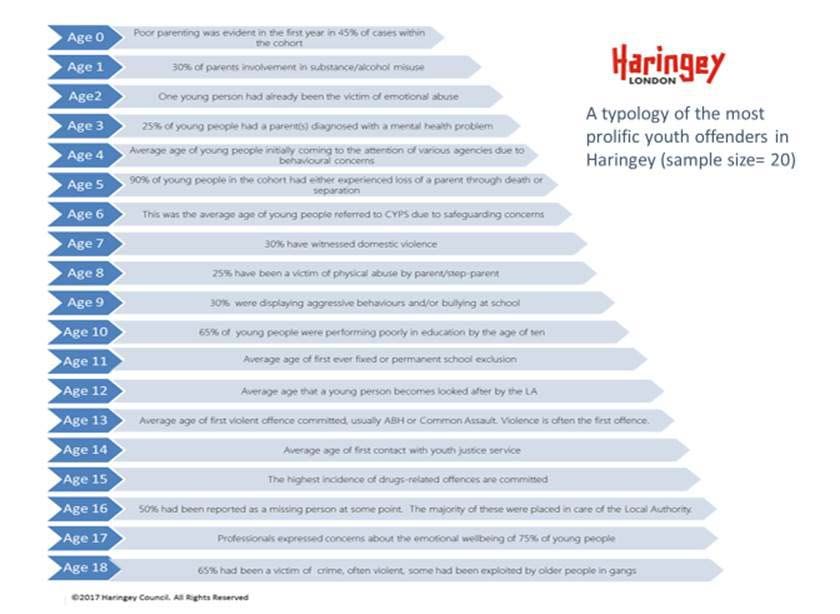
COVID-19: Vaccination Uptake (Service Users)

           As of 31st March there are 777 service users who have not
           been vaccinated (out of approximately 3,500 long term care
           service users). 163 of these (21%) declined the first dose of
           the vaccine.

           Unvaccinated service users is highest amongst the 50-54
           year olds with 41% unvaccinated.

           The group with the highest number of unvaccinated service
           users however is 80+ year olds (196 unvaccinated, 23% of all
           service users). This is also the group with the highest
           proportion of declined vaccinations (80 declines being 41%
           of the total unvaccinated service users).
Haringey at a glance State of the Borough - April 2021 - Haringey Council
Housing
Haringey at a glance State of the Borough - April 2021 - Haringey Council
Housing: Tenure
In 2018, 34% of Haringey residents rent from a private landlord, with only 20% renting from the LA or HA
(25,500 fewer individuals). While most residents are happy with their home, happiness is lowest among
social renters.

                                                  • Haringey residents are most likely to rent from a private landlord
                                                    (34%). The proportion renting from the LA or Housing Association
                                                    has fallen from 31% in 2015 to just 20% in 2018, or 25,500
                                                    individuals fewer. The proportion buying with a mortgage fell in the
                                                    early half of the decade, but has been stable since 2015.
                                                  • Tenure follows clear deprivation lines across the borough – eastern
                                                    wards like Northumberland Park are least likely to own their home
  Source: Annual Population Survey, ONS 2018
                                                    and most likely to be social renting while in western wards like
                                                    Alexandra this trend is reversed.
                                                  • The 2018 Haringey Residents Survey found that the vast majority of
                                                    residents (90%) say they are happy with the home they live in.
                                                    Happiness with one’s home is highest among owner occupiers
                                                    (96%), and lowest among social renters (79%).
                                                  • The 2018-19 English Housing Survey showed that while levels of
                                                    non-decent homes have seen annual falls over time, the reductions
                                                    have levelled off in the last 2 years. Private Rented homes are most
                                                    likely to be non decent (25% of homes in 2018), compared to LA or
         Source: Haringey Residents Survey 2018     Housing Association Homes (10-15% of homes in 2018)
Housing: Household composition

32% of households in Haringey are one person households. 49% of households in Haringey are working
households and 16% are workless.

           Haringey Households by Household                                                                                                                                       Households by combined economic • Haringey has diverse household
                                                                                                                                                                                      activity status, Haringey     composition. 32% of households are
                      composition                                                                                                                                                                                               one person households. 16% of
          50%                                                                                                                                                                        Working households    Mixed households
          45%
                                                                                                                                                                                     Workless households
                                                                                                                                                                                                                                households are couples with
          40%
          35%
                                                                                                                                                                                                                                dependent children, and 11% are
                                                                                                                                                                                                                                households with a lone parent with
Percent

          30%
          25%
                                                                                                                                                                                          16%                                   dependent children
          20%
          15%                                                                                                                                                                                                                 • 59% of Haringey residents live in a
          10%                                                                                                                                                                                              49%                  flat, maisonette, or apartment with
                                                                                                                                                                                                                                the remaining 41% living in a whole
          5%
          0%
                                                                                                                                                                                                                                house or bungalow.
                                                              Couple with dependent

                                                                                                                                                     Other household types with
                                                                                                                        Lone parent with dependent
                                       All other one family

                                                                                      students and all aged 65 and
                One person household

                                                                                                                                                                                      36%
                                                                                       Other (including all full-time
                                            households

                                                                                                                                                        dependent children
                                                                     children

                                                                                                                                 children
                                                                                                   over)

                                                                                                                                                                                  Source: 2011 Census

Source: 2011 Census, Table LC4104EW
Housing: Availability & Cost
Between 2011 and 2019, Haringey’s population grew at a slightly faster rate than the number of households.
Haringey has the third highest rate of households in TA in London.
                                                                         • Between 2011 and 2019 Haringey’s number of households grew at a slightly
                                                                           slower rate than the population (5.5% vs. 5.3%). The housing growth rate
                                                                           has been relatively consistent, being 0.8% from 2015 to 2018, but fell in the
                                                                           last year to 0.4%. Population growth fell significantly in 2016 and 2017, but
                                                                           returned to a 1.1% growth last year.
                                                                         • The median monthly private rent in Haringey is £1,500 (12 month rolling
                                                                           period to Q2 20-21). This was previously £70 less than the London average
                                                                           but is now £65 above it. The mean private rent is now £1,644 a week. This
                                                                           was previously £200 less than the London average but is now equal to it.
     Source: DCLG Household Projections and GLA Population Projections
                                                                           Median weekly LA rents on the other hand are £103.72, a reduction for the
                                                                           4th year in a row, and remaining just under the London median (£105.33).
                                                                         • Median private rent has increased by 17.4% in the last 4 years, a higher rate
                                                                           than local authority rents (5.5%) and London private rent (10.3%).
                                                                         • Just more than 3,000 households in Haringey (25 per 1,000 households) are
                                                                           living in temporary accommodation (statutory homeless). This is the third
                                                                           highest rate in London, and despite decreasing, it is 80% higher than the
                                                                           London level (14 per 1,000). 40% of residents accepted as statutory
                                                                           homeless are black, while 25% of youth homeless are LGBT, an over-
 Source: MHCLG 2018
                                                                           representation compared to the wider borough population.
Rough Sleeping and Homelessness
Local Authorities in England use a count or estimate to find out how many people are sleeping rough in their area. Since March 2020 Haringey has
seen a 74% decrease in rough sleeping. The ‘everyone in’ initiative, and the rapid mobilisation of new services in response to COVID-19 have
contributed to this reduction. The Counts and Estimates methodology produces a snapshot figure of how many people sleep rough on a typical
night, with figures available at local, regional and national levels. The data does not include people who are homeless but do not fall within the rough
sleeping definition, such as those who are in temporary accommodation or are staying with friends or family.

                               Haringey Bi-Monthly Street Count Figures
 45             41   42
                                              40
 40                                 38

 35   32   33             32             32        33
                               30
 30

 25                                                                       22
                                                        18   19
 20

 15
                                                                  9   9        8
 10
                                                                                   4   5
  5

  0

In Haringey people are generally seen bedded down in the Finsbury Park, Wood Green and
Tottenham areas. The shown map represents volume of contacts rather than individuals,
and some people may have been seen on multiple occasions within a given area. In
Haringey the vast majority are new rough sleepers with no second night out. A small
number of people rough sleeping in the borough are classed as living on the streets (LOS),
these people are very well known to our Outreach Team.
Rough Sleeping and Homelessness
Official MHCLG figures show that the majority of people rough sleeping are men aged over 25 and from an EU country outside the UK. This is also
true in Haringey. Women are often hidden in rough sleeping statistics because they seek protection from gender-based harm on the streets by
sleeping in squats, buses and sex-working for accommodation. In Haringey, only 15% of people identified as rough sleeping are women. The
average age of death for women who experience rough sleeping is lower than for men who sleep rough: 42 years for women compared to 44 years
for men. A significant number of people who rough sleep experience drug or alcohol dependence. People who are dependent on drugs or alcohol
may struggle to retain accommodation due to financial difficulties, problems with behaviour or family relationship breakdown. Homelessness can
also be the route to substance dependence as a coping mechanism.

More information on the demographics of people rough sleeping in Haringey can be found here.

                               UK national,
              Not known /        15.79%
              prefer not to
                disclose,
                 26.32%

          Non-EU
          national,              EU national
           10.53%              (excluding UK),
                                   47.37%
People: Adults
People: Population Structure

 Haringey has a young, ethnically diverse population. The total resident population in Haringey is 271,222
 and BME or Other White ethnic groups account for 67% of the resident population.
             Haringey Population Pyramid - 2020 Projection                                                                                             • The population pyramid demonstrates a
                                                                                                                                                         gender split of males 50.7% to females
80-84
                                                                                                                                                         49.3%.
70-74                                                                                                                                                       − This is similar to London (an exact 50/50
60-64
                                                                                                                                                              split) but differs from England in that the
                                                                                                                                                              Haringey population is younger with a
50-54                                                                                                                                                         higher proportion of younger working
40-44                                                                                                                                                         age population (25 – 44 years),
30-34
                                                                                                                                                              particularly males.
20-24                                                                                                                                                  • There are 56,718 children in Haringey
10-14                                                                                                                                                    aged 0-17 years, representing 21% of
  0-4
                                                                                                                                                         the population.
        6%            4%          2%           0%                2%         4%            6%                                                                − Haringey has 28,632 residents aged 65+
                                                                                                                                                              (11%).
             Haringey Males     Haringey Females           London Males     London Females

        Source: GLA Housing Led Population projections (2018 based)                                                                                    • 67.1% of the Haringey population are
                                                                                                                                                         from a BME group or Other White ethnic
                             Age Breakdown (2020 Proj.)                                                                                                  groups compared to 60.7% in London.
 100,000
                                   27%
                                                                                                                                                       • Around 16.5% of residents in Haringey
                                                   25%
                     21%
                                                                      17%
                                                                                                                                                         are from Black ethnic groups and one in
   50,000
                                 72,807        68,257
                                                                                 11%                                                                     ten are Asian (10.3%).
                    56,718                                        44,807         28,632
         -
                                                                                               Source: GLA Ethnic group Population projections (2016
                    0-17          18-34            35-49           50-64          65+
                                                                                               based – No 2018 base available yet)
People: Language and Religion

Over 180 languages are spoken by Haringey residents, and 30% of Haringey residents do not speak English
as their main language.

                                                                                     • 30% of Haringey residents do not speak
                                                                                       English as their main language. This is the
             Proportion of Residents whose main language is not English                6th highest rate in London and is above the
   60%
                                   Boroughs   Statistical Neighbours   London          statistical neighbour and London averages.
                                                                                     • Of those whose main language is not
   40%                                                                                 English in Haringey, one in four (24%) either
                                                                                       do not speak English well or do not speak it
   20%                                                                                 at all. This is the third largest proportion of
                                                                                       all London boroughs, and is above the
   0%                                                                                  statistical neighbour and London levels.
                                                                                     • The proportion of Haringey residents saying
                                                                                       they are Christian (45%) is in line with
                                                                                       statistical neighbour boroughs (46%), and is
                                                                                       slightly below London (48%), while Haringey
         Source: ONS Census 2011                                                       residents are more likely to identify as
                                                                                       having no religion (25% compared to 21%
                                                                                       among both statistical neighbours and
                                                                                       London).
People: Population Change

Haringey’s population is expected to increase by 5% by 2030, to 284,989, with the largest percentage
growth in older age groups (65+), Other ethnic groups and Other White ethnic groups.

      Population Projections for                                                                                                                                                                                                                                                                                                                                      • By 2028, the ethnic groups with the
     Haringey (2020, 2025, 2030)                                                                                                                                                                                                                                                                                                                                        highest expected growth are expected
          0-4     5-19    20-64       65-84    85+                                                                                                                                                                                                                                                                                                                      to have been the Other ethnic group
350,000                                                                                                                                                                                                                                                                                                                                                                 and Other White, growing by 10% each,
                               5%                                                                                    Percentage change in proportions of ethnic groups, 2018 to 2028                                                                                                                                                                                    while Black Caribbean and Bangladeshi
300,000                                               Percentage change over 10 years   35%
                                                                                                                                                                                                                                                                                                                                                                        groups are expected to decrease by
                                                                                        25%
                                                                                                                                                                                                                                                                                                                                                                        12% and 8% respectively.
250,000                                                                                 15%                       10%                                              9%                                                                                                                                                         9%                 10%
                                                                                                  7%                                                                                                                                                          6%
                                                                                         5%                                     1%                                               2%
                                                                                                                                                                                                             5%
                                                                                                                                                                                                                           -2%
                                                                                                                                                                                                                                    -6%                                               0%
                                                                                                                                                                                                                                                                                                                                                                      • The White British group will remain the
200,000                                                                                 -5%                                                                                                    -1%                                                                                                    -1%                                                               largest population overall, followed by
                                                                                                                                                                                                                                                                                                                                     -6%
                                                                                        -15%                                                    -12%
                                                                                                                                                                                                                                                                        -8%                                                                                             Other White and Black African.
                                                                                                  White British

                                                                                                                                                                                                                                                                                                                              Arab
                                                                                                                                                                                                                                                                                                      White & Black African

                                                                                                                                                                                                                                                                                                                                     Pakistani
                                                                                                                                                                                                                           Indian

                                                                                                                                                                                                                                                                        Bangladeshi
                                                                                                                                                                   Other Asian

                                                                                                                                                                                               Other Black

                                                                                                                                                                                                                                                                                                                                                 Other Ethnic Group
                                                                                                                  Other White

                                                                                                                                                                                 White Irish

                                                                                                                                                                                                                                                              Chinese
                                                                                                                                                 Black Caribbean

                                                                                                                                                                                                             Other Mixed
                                                                                                                                Black African

                                                                                                                                                                                                                                                                                      White & Asian
                                                                                                                                                                                                                                    White & Black Caribbean
150,000
                                                                                                                                                                                                                                                                                                                                                                      • The highest expected growth in the
                                                                                                                                                                                                                                                                                                                                                                        2018-based population projections (to
100,000
                                                                                                                                                                                                                                                                                                                                                                        2030) is in the 65+ groups, with 65-84
                                                                                                                                                                                                                                                                                                                                                                        year old population growing from 25,348
 50,000
                                                                                                                                                                                                                                                                                                                                                                        to 33,076 (+30%), and 85+ growing
     0
                                                                                               Source, GLA 2016-based population projections (2018-based Ethnicity projections unavailable)                                                                                                                                                                             from 3,285 to 3,897 (+18.5%)
                2020           2025            2030

      Source, GLA 2018-based population projections
                                                                                                                                                                                                                                                                                                                                                                      • The working age population will remain
                                                                                                                                                                                                                                                                                                                                                                        the largest population overall.
People: Population Change, by Age and Ethnic Group

The greatest proportional population increase will be among older people in BAME ethnic groups.

                                  Percentage Change from 2018 to 2028 by Age
                                                                                                                                      Percentage Change from 2018 to 2028 by Age          • Overall, the proportion of the
                                                                                                                                          Group, Other Ethnic Group Ethnicity
                                          Group, Other White Ethnicity
                                                                                                                                                   Haringey     All Ages
                                                                                                                                                                                            population whose ethnicity is Other
                                                Haringey      All Ages
                                                                                                              100%
                                                                                                                                                                                            White and Other ethnic groups will
                            40%
                                                                                                                                                                                            increase by 10% respectively, while
  Percentage Change

                                                                                                                         80%

                                                                                       Percentage Change
                            20%
                                                                                                                         60%
                                                                                                                                                                                            Black Caribbean and Bangladeshi
                                                 5-19       20-64    65-84       85+                                     40%
                                                                                                                                                                                            ethnic groups will decrease as a
                                  0%
                                         0-4
                                                                                                                         20%
                                                                                                                                                                                            proportion of the overall Haringey
                                                                                                                                                                                            population (-12% and -8%
                                                                                                                                                               20-64
                      -20%                                                                                                               0-4       5-19                    65-84    85+
                                                                                                                               0%

                                                                                                                   -20%
                                                                                                                                                                                            respectively) between 2018 and
                      -40%
                                                                                                                                                                                            2028.
                                                                                                                                                                                          • The largest increase by age groups
                                    Percentage Change from 2018 to 2028 by Age                                                         Percentage Change from 2018 to 2028 by Age
                                         Group, Black Caribbean Ethnicity                                                                      Group, Bangladeshi Ethnicity
                                                 Haringey     All Ages                                                                              Haringey    All Ages                    is found in older people among:
                                  60%                                                                                          140%                                                           − Other white aged 65-85 (+36%, from
                                                                                                                               120%                                                             3,994 to 5,436 people)
                                  40%
              Percentage Change

                                                                                                                               100%
                                                                                                           Percentage Change

                                                                                                                               80%                                                            − Other Ethnic groups aged 85 plus (+91%,
                                  20%
                                                                                                                               60%                                                              from 379 to 731 people)
                                   0%
                                                                         65-84   85+                                           40%                                                            − Black Caribbean aged 85 plus (+47%,
                                          0-4     5-19      20-64                                                              20%                  5-19       20-64
                                                                                                                                                                           65-84    85+         from 498 to 731 people)
                                  -20%                                                                                          0%
                                                                                                                               -20%
                                                                                                                                           0-4                                                − Bangladeshi aged 85 plus (+132%, from
                                  -40%                                                                                         -40%                                                             22 to 51 people)
People: Population Spread

 The over 65+ population will see increased concentration in the West of the Borough, while the proportion of
 residents aged under 18 is not expected to change substantially.

                     2020                            2030                  • The percentage of the population that
                                                                             is under 18 is not expected to change
                                                                             significantly, although will fall slightly
Residents Under 18

                                                                             around the Alexandra ward. It will
                                                                             remain most concentrated in the East
                                                                             of the Borough.

                                                                           • Despite the large percent increase,
Residents Over 65

                                                                             the population over 65 is projected to
                                                                             account for only 13% of Haringey’s
                                                                             population in 2030, a total of 36,973
                                                                             residents. The 65+ population is more
                                                                             concentrated in the West, where
                                                                             almost all areas have over 14% of the
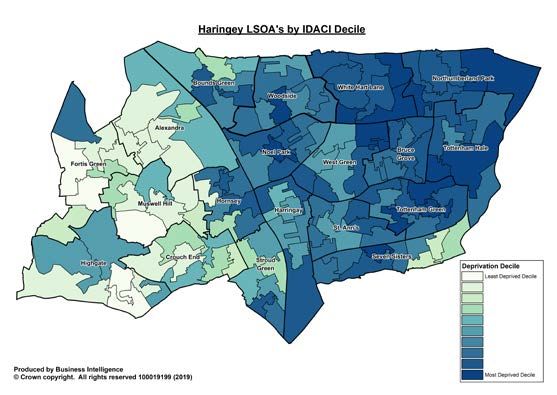
                                                                             population 65+.
People: Deprivation

Haringey is the 4th most deprived borough in London, with deprivation more concentrated in the north east.
Relative deprivation has reduced since 2015, though Haringey’s London ranking has not shifted significantly.

                                                                           • Haringey is ranked 49 out of the 317 local authorities in England
                                                                             with respect to deprivation, and is the 4th most deprived in
                                                                             London as measured by the IMD score 2019 (where 1 = most
                                                                             deprived). The Index takes into account a range of deprivation
                                                                             types, including income, employment, education, health, crime,
                                                                             barriers to housing and services and living environment.
                                                                           • The most deprived LSOAs (Lower Super Output Areas or small
                                                                             neighbourhood areas) are more heavily concentrated in the east
                                                                             of the borough, where more than half of the LSOAs fall into the
                                                                             20% most deprived in the country. By comparison, in the west a
                                                                             very small proportion of LSOAs fall into that category, and in the
                                                                             westernmost wards – Highgate, Fortis Green, Muswell Hill,
                                                                             Alexandra and Crouch End – there are none.
                                                                                          • Although Haringey’s overall IMD score has improved since 2015
                                                                                            (where it was ranked 30th in England), improvements have been
                                                                                            seen across London meaning that Haringey still ranks among the
A lower percentile represents a higher level of deprivation. Those in the 10th percentile
                                                                                            most deprived boroughs in the capital (ranked 6th in London in
(and shaded darkest) are among the 10% most deprived LSOAs in England.                      2015)
People: Life Expectancy

Life expectancy in Haringey is now closer to the London average (previously higher), and there is still
inequality in life expectancy across the social gradient and between genders.

                                                                            • In Haringey, both male and female life
Average Life                                                                  expectancy are in line with the London
Average Life Expectancy
             Expectancyat
                        atBirth
                          birth (2017-19)
                                (2014-16)
                                                                              averages (+/-0.2 years), but greater than
    Haringey          London     England                                      the England average – just under a year
           80.7
          80.1              80.9
                           80.4        79.8
                                       79.5                                   greater for male life expectancy and just
                                                                              under 1.5 years greater for female life
                                                                              expectancy.

               84.8
               84.6          84.7
                             84.2            83.4
                                            83.1                            • In Haringey, men have greater inequality
                                                                              in life expectancy than women across
                                                                              the social gradient (7.4 vs 3.5 fewer
                                                                              years for those living in the most
                                                                              deprived areas than those living in the
Source, PHOF, 2020                                                            least deprived areas). Inequality in life
                                                                              expectancy amongst men reduced from
                                                    PHOF, 2020
                                                                              8 to 7.4 in the last year, the first
                                                                              decrease for 4 years, whilst inequality in
                                                                              women increased for the first time in 4
                                                                              years from 3.2 to 3.5 years.
People: Healthy Life Expectancy

There are significant gaps in healthy life expectancy between populations in Haringey: the gap in healthy
years of life between richest and poorest deciles is 15 years for men and 17 years for women.

                                                                           • The gap in healthy life expectancy
                                                      Life                   (years lived in good health) in
                                                      expectancy             Haringey is much larger than the gap
                                                                             in life expectancy itself.
                                                      Healthy life         • Haringey residents spend on average
                                                      expectancy
                                                                             the last 20 years of life in poor health.

                                                                           • Male healthy life expectancy (65.3) in
                                                                             Haringey is a year higher than
                                                                             London and England, whilst female
                   Most deprived     Least deprived                          healthy life expectancy (66.3) is two
                                                                             years higher than London and
                                                                             England.

                                                                           • While women in Haringey live longer
                                                                             than their male counterparts, on
                                                                             average, their last 19 years are spent
                                                                             in poor health compared to the last 15
                                                                             years spent in poor health among
                                                                             men.
   Source, PHOF, 2020
People: Mortality & Risk Factors
Cancer, cardiovascular disease and lung disease are the main causes of early death (deaths under the age of 75) in
Haringey. The most common habits associated with long-term conditions, poor health and early death in Haringey
are poor diet, smoking and high blood pressure.
                                      Main causes of early death in Haringey                   • One in 5 adults in Haringey have high
                                                                                                 blood pressure and a third of our
                                                                                                 residents are not getting enough
                                                                                                 physical exercise

                                                                                               • Overall smoking rates are falling
                                                                                                 nationally and locally but it remains
                                                                                                 one of the biggest drivers of the life
        Top 5 risk factors for long-term conditions, poor health and early death in Haringey     expectancy/healthy life expectancy
                                                                                                 gaps in Haringey. Rates remain
                                                                                                 persistently high in certain groups
                                                                                                 including people working in manual
                                                                                                 jobs, people with mental illness and
                                                                                                 people homeless.

Source: PHE Longer Lives Tool, 2016
People: Wellbeing & Optimism

Haringey residents reported higher levels of life satisfaction and day to day happiness than the prior year, as
well as reduced anxiety levels. Overall improvements in all measurements levels since 2011/12
                                                                                                                    • Haringey Life satisfaction scores rose to their highest
        Self-reported wellbeing levels in Haringey, Statistical Neighbours & London                                   levels ever, bouncing back from last years significant
                       Life Satisfaction         Worthwhile                     Happiness           Anxiety
                                                                                                                      fall. Other categories remained relatively steady, with a
                       Mean      Change       Mean          Change           Mean      Change    Mean      Change     slight fall in feeling worthwhile only
                       Score      Since       Score          Since           Score      Since    Score      Since
                      2019/20   2011/12      2019/20       2011/12          2019/20   2011/12   2019/20   2011/12
                                                                                                                    • Life satisfaction score rose 4.2% from last year, feeling
     Haringey          7.66        8%          7.71           5%             7.28       3%       3.04      -8%        worthwhile fell 0.1%, day to day happiness rose 0.2%,
                                                                                                                      and anxiety fell 1%
    SN Average         7.51        5%          7.73           4%             7.39       4%       3.22      -9%

 London Average        7.54        4%          7.74           3%             7.38       2%       3.17      -7%
                                                                                                                    • More recently in our Residents’ survey two thirds of
                                                                                                                      residents said they’d been feeling optimistic about the
*In relation to anxiety, a lower score represents lower levels of anxiety and is therefore more positive              future often or all of the time (66%). There was, however,
                                                                                                                      substantial variation among different groups, as seen
                                   Source: Annual Population Survey, ONS 2018
                                                                                                                      opposite.
        Two thirds of residents say they’ve been feeling optimistic about the future often
                                      or all of the time (66%)
                                                                                                                    • A UK-wide study found that all minority ethnic groups
               •    Optimism is higher among younger residents than older residents                                   have lower life satisfaction than those of white ethnicity,
             •   Optimism is lower among unemployed and permanently sick/disabled
                                              residents
                                                                                                                      linked to socio-economic status and levels of
         •     Optimism is highest among those who private rent, and lowest among those                               deprivation. (Source: ISER).
                                            who social rent
                                           Source: Residents’ Survey 2018
People: Mental Health

Haringey CCG is now one with NCL, therefore data is not fully comparable with historical. Previously Haringey had
similar rates of depression (7.7%) compared to London but higher rates of serious mental illness (1.37%).

                                                                                          •   Around 19,900 people in Haringey or 7.7% of
                                                                                              the GP registered population are diagnosed
                                                                                              with depression (2018/19), not significantly
                                                                                              different to London. This is estimated to be only
                                                                                              a third of people living with common mental
                                                                                              illness in Haringey. Latest data shows NCL with
                                                                                              a rate of 9.2%.
                                                                                          •   4,400 people have been diagnosed with severe
                                                                                              mental illness in Haringey (1.37%), significantly
                                                                                              higher than the London average of 1.1%
                                                                                              (2018/19). Latest NCL figure for 2019/20 is
    Data Source: QOF 2019/20               Data Source: QOF 2019/20                           1.27% with London at 1.13%
                                                                                          •   Suicide rates in Haringey have significantly
                                        The percentage of adults in receipt of                decreased over the last ten years, with Haringey
                                        secondary mental health services living in            now in line with the London average
                                        stable and appropriate accommodation has          •   Central and East Haringey exhibit high levels of
                                        fallen slightly in the last year, with the Male       risk factors for poor mental health, such as
                                        figure being below London average:                    deprivation, unemployment and homelessness,
                                                                                              and many people have experienced trauma.

                                             68% 61%
                                                                                              These are more concentrated in the East of the
                                                                                              borough.

                                                Among women           Among men
Data Source: PHOF 2020
People: Sexual Health
The rate of newly diagnosed HIV in Haringey has reduced in recent years but is still above England rates. Late
diagnoses of HIV and teenage pregnancy rates have markedly declined in recent years. STI infections however
have risen consistently since 2016 at a faster rate than London and England

                                                                                  • The rate of new diagnoses of STIs
                                                                                    (excluding chlamydia in those aged
                                                                                    under 25) was 2,419 per 100,000

                                             35.6%                                  compared with 1,939 for London & 900
                                                                                    for England (2019). This is an increase of
                                                                                    35% since 2016, compared to 25% for
                                             of HIV is diagnosed at late stage      London and 12.5% for England
                                             in those aged 15+ in Haringey.
                                             This is a marked reduction over      • STI and HIV rates are highest in NE
                                             the past 4 years and is similar to     Tottenham and SE Tottenham localities,
                                             London (33.9%) & below England         particularly Northumberland Park, Seven
                                                                                    Sisters and Tottenham Hale
                                             (40.2%).
                                                                                  • Teenage pregnancy rates in Haringey
                                                                                    have seen a marked decline and are not
                                                                                    statistically different to London, although
                                                                                    are still a greater value (15.2 per 1,000
                                                                                    versus 13.9) (2018)
People: Substance Misuse

While the proportion of people smoking in Haringey has reduced over the years, there are marked
inequalities in smoking rates amongst some groups.
                                                                                                 • 9% of young people of White or Mixed
14.9%                of adults in Haringey are smokers, a decrease from 2018 (17.7%)
                                                                                                   Ethnicity are regular or occasional smokers
                                                                                                   at the age of 15, compared to 3% of those
                                                                                                   of Black ethnicity and 2% of those of Asian
Those with depression, schizophrenia and who are homeless are                                      ethnicity.
significantly more likely to be smokers, compared to the general population.                     • Haringey sells the most litres of alcohol per
                                                                                                   adult in all of London, 35% more than the
Although there has been a decrease in overall smoking prevalence, it is higher in                  London average;
more deprived parts of the borough. Those with depression,                                       • The high level of sales points to high levels
schizophrenia or who are homeless are also more likely to be smokers.                              of unsafe drinking, as Haringey also has a
                                                                                                   rate of alcohol-related hospital admissions
                                                                                                   significantly higher than the London
             Average litres of alcohol sold per adult through the off-trade: all alcohol
                                                                                                   average.
       7.5                         sales, London boroughs, 2014                        England
   8
   6                                                                                             • Overall there has been a reduction in young
   4
   2
                                                                                                   people’s alcohol and drug use, demand for
   0                                                                                               our young people’s service remains stable
                                                                                                   and more present with use of very potent
                                                                                                   new psychoactive substances. Drug related
                                                                                                   deaths are peaking, with problematic
                    Source: Public Health England (PHE)                                            substance misuse linked to deprivation.
People: Children & Young People
People: Children’s Physical Health
Haringey has a similar proportion of babies with low birth weight compared to London, although the rate has
fallen while London and England increased. The rate of asthma-related hospital admissions among under-19 year
olds is lower than the London average and has fallen over time since 2017

80.9%               of eligible children in Haringey (2 year olds) have received one dose of the MMR vaccine
                    in 2019/20, which is lower than both London (83.6%) and England (90.6%), although is an
                    improvement on last year (77.8%)                                                               • In 2019, the percentage of babies
                                                                                                                     with low birth weight in Haringey fell
77.0%               of children in care in Haringey (228 in total) were up to date with their immunisations in
                    2020, a significant fall from previous years (93-99%), and is now below the London
                    average of 79.7%
                                                                                                                     to 2.78%, lower than both London
                                                                                                                     (which rose to 3.2%), and England
                    per 100,000 children (75 children in total) under 19 were admitted to hospital for asthma in     (which rose to 2.9%).
 120                Haringey in 2019/20. This is lower than both London (167 per 100,000) and England (161
                    per 100,000), and is a further improvement from last year                                      • There is a lower percentage of
                                                                                                                     asthma-related hospital admissions
                                                                                                                     among children under 19 years old
                                                                                                                     compared to the London average
                                                                                                                     (120 per 100,000 vs 167 per
                                                                                                                     100,000).

     Source: PHOF 2020
People: School Readiness
19/20 Data for Readiness was cancelled due to COVID-19. In 2018/19 boys (68%) were less likely to reach a good
level of development at the end of reception compared to Girls (81%). This is the same gap as the previous year,
however overall attainment has fallen 1% for Haringey.

                                                                                                                                                                                                   • In 2018/19, 74.6% of 5 year olds in
                                                                                                                                                                                                     Haringey were reaching a ‘good level
                                                                                                                                                                                                     of development’ at the end of
                                                                                                                                                                                                     reception, similar to the London
                                                                                                                                                                                                     average (74.1%).
                                                                                                                                                                                                   • The proportion of 5 year olds reaching
                                                                                                                                                                                                     a good level of development has
                                                                                                                                                                                                     increased over time, as have the
                                                                                                                                                                                                     national and London trends, however
                                                                                                                                                                                                     in the last year Haringey’s
                                                                                                                                                                                                     performance dropped by 1% for the
                                                                                                                                                                                                     first time, although it remains above
                                                                                                                                                                                                     the London and England averages.
                                                                                                                                                                                                   • Boys (68%) are less likely to reach a
                                                                                                                                                                                                     good level of development at the end
Source: Department for Education (DfE), EYFS Profile: EYFS Profile Statistical Series 2018/19   Source: Department for Education (DfE), EYFS Profile: EYFS Profile Statistical Series 2018/19
                                                                                                                                                                                                     of reception, compared to the
                                                                                                                                                                                                     Haringey average (74.6%). Both Boys
                                                                                                                                                                                                     and Girls saw their percentages fall
                                                                                                                                                                                                     from last year, although Girls fell by a
                                                                                                                                                                                                     greater amount (1.9%)
People: School Attainment
 Due to the COVID-19 pandemic, the summer exam series was cancelled in 2020. Pupils scheduled to sit GCSE and A/AS level exams in
 2020 were awarded either a centre assessment grade (based on what the school or college believed the student would most likely have
 achieved had exams gone ahead) or their calculated grade using a model developed by Ofqual - whichever was the higher of the two

                                                                                                                                 • Comparison with previous years is not
                                                                                                                                   suggested due to how this years results were
  Haringey ranks 24th in                                                                                                           awarded. Haringey’s relative performance
  London (out of 32 local                                                                                                          within London however appears to have
   authorities) for GCSE                                                                                                           fallen, as it is now ranked 24th for both pupils
   attainment (% pupils                                                                                                            achieving a standard 9-4 pass, and pupils
 achieving strong 9-5 pass                                                                                                         achieving a strong 9-5 pass.
  in English and Maths).
          Source: DfE 2019/20                                                                                                    • Girls performed stronger than Boys, with
                                                                                                                                   75.2% achieving a standard pass compared
                                                 Source: DfE 2019/20
                                                                                                                                   to 68.9% of Boys, and 56.4% achieving a
                                                                                                                                   strong pass compared to 45.8% of Boys.

                                                                                                                                 • In previous years Haringey pupils show
                                                                                                                                   positive signs of improvement in their
                                                                                                                                   education, with a higher than average
                                                                                                                                   Progress 8 score (+0.24), although this was
                                                                                                                                   also true of SN’s and London as a whole who
                                                                                                                                   have the same score. Progress 8 was not
         Source: DfE 2018/19                                                                                                       recorded for 2019/20
The Progress 8 score aims to capture the progress a pupil makes from the end of primary school to the end of secondary school. The measure compares pupils’ key stage 4 results to those of other pupils
nationally with similar prior attainment, providing an evaluation of their comparative progression.
People: Attainment Gaps
Attainment at this level was not available for 2019/20. Attainment varies substantially both Geographically
and by Gender and Ethnicity. Attainment is particularly low among black boys and in the Eastern half of the
Borough

                                                     • There is significant variation in attainment across Haringey’s
                                                       wards, with only 44% of students attaining 9-4 in English
                                                       and Maths in Tottenham Green, but 89% in Alexandra and
                                                       Fortis Green.

                                                     • There are substantial attainment gaps between different
                                                       demographic groups. Black boys have the lowest
                                                       attainment of all ethnic and gender groups – 52% attained
                                                       9-4 in English and Maths, compared to Mixed Ethnicity
                                                       Females who have the highest attainment with 80%
                                                       achieving 9-4 in English and Maths. Boys have lower
                                                       attainment scores in every Ethnic Group and all wards with
                                                       the exception of Crouch End, Highgate and Muswell Hill.

                                                     • These gaps are also mirrored in Attainment 8 scores as well

    Source: DfE 2018/19
People: Post-16 & Post-18 Outcomes

Post-KS5, Haringey pupils are less likely to go on to HE institutions than pupils among SNs and London boroughs.
Pupils leaving KS4 and KS5 are also less likely than those in SNs and London to take on an apprenticeship.

                                                            • After completing KS4, Haringey pupils are more likely to go to a 6th form
                                                              college or FE college (or other FE provider) than the average, and less
                                                              likely to go to a state-funded school 6th form.
                                                            • After completing KS5, Haringey pupils are less likely than average to go to
                                                              HE institutions (62%, compared to 64% among SNs and London), and
                                                              more likely to go to FE colleges or other FE providers (5%, vs. 4% among
                                                              SNs and London).
                                                            • Although Haringey has fewer pupils going into HE generally, the
                                                              proportion going to Top Third most selective HEI’s is in line with SN’s and
                                                              London (Haringey: 26%, SN’s: 24%, London: 27%).
                                                            • Haringey pupils from state-funded mainstream schools are less likely than
                                                              average to take up an apprenticeship. This is evident among KS4 leavers,
                                                              and more marked among KS5 leavers (see left).

                                                            • While the proportion of NEET 16 and 17 year olds in Haringey (1.6%) is in
                                                              line with SNs and London (1.8%), Haringey has a larger proportion of
                                                              Mixed Race and Black or Black British 16-17 year olds who are NEET
                                                              compared to the SN and London averages. It’s worth noting that Haringey
                                                              has a larger proportion of 16-17 year olds whose activity is not known
                                                              (10.2%, compared to just over 3% among SNs and London), suggesting
Source: DfE 2018/19                  Source: DfE 2018/19      there may be a larger proportion who are NEET in the borough.
People: Disabilities among Children & Young People
Compared to London, Haringey has a similar proportion of young people that have a learning disability (LD),
but a slightly higher rate of pupils with autism.

                                                                             • LD – 2020 saw the end of the downwards
                                                                               trend in LD rates, with Haringey, London and
                                                                               England all rising. Haringey (24.9%) remains
                                                                               slightly above the London rate (22.9%)
                                                                             • In 2020, a rate of 22.9 children per 1,000
                                                                               pupils in Haringey were known by schools to
                                                                               have Autism, a higher rate than the London
                                                                               average (20.4 per 1,000 pupils) and England
                                                                               (18 per 1,000).
                                                                             • The percentage of all school age pupils with
Source: fingertips.phe.org.uk                                                  special educational needs (SEN) in Haringey
                                                                               has a downward trend over time, but is still
                                                                               slightly higher than the London and England
                                                                               averages (15.1% compared to 14.6% and
                                                                               14.9% respectively).
                                                                             • Of all London boroughs, Haringey has the
                                                                               10th largest proportion of secondary school
                                                                               pupils with special education needs
                                                                               (compared to 19th at primary).
                                Source: DfE 2020
People: Autism & Learning Disabilities

An estimated 5,700 Haringey residents aged 14 and over are estimated to have a learning disability, and
around 2,100 residents are estimated to have autism.

                                                                                       • It is estimated that
                                                                                         5718 Haringey
                                                                                         residents aged 14
                                                                                         and over have a
                                                                                         learning disability,
                                                                                         including 1,111
                                                                                         residents aged 14-
                                                                                         25.
                                                                                       • Of these residents,
                                                                                         around 1,260 are
                                                                                         estimated to have a
                                                                                         moderate or severe
                                                                                         learning disability
                                                                                         and hence are likely
                                                                                         to be in receipt of
         Around   2,100 Haringey residents aged 14 and over are estimated                services.
                  to have autism, including   680 residents aged 14-25.
People: Child Obesity
In Haringey in 2019/20, 17% of all Reception year students and 35.3% of all Year 6 students were recorded as
overweight or obese. This is a significant reduction on previous years, although this years data should be taken
with caution as there were a reduced number of measurements taken due to COVID-19

                                                                                                    • In 2019/20 the measured prevalence
                                                                                                      of overweight (including obese)
                                                                                                      reduced by 6 percentage points in
                                                                                                      Reception, and 3.1 percentage points
                                                                                                      in Year 6. This years results were
                                                                                                      published with the note of “fit for
                                                                                                      publication but interpret with caution”
                                                                                                      as there were a reduced number of
                                                                                                      measurements taken due to COVID-
                                                                                                      19 and schools closing early in the
                                                                                                      year.
Source: National Child Measurement Programme (NCMP) 2019/20
                                                                                                    • Inequalities from Sex and Ethnicity
                                                              and lower than the Haringey average     are only available at England level,
The prevalence of overweight/obesity among Year 6                                                     but these show continued differences
students was significantly higher than the Haringey           among White ethnic groups:
                                                                                                      – with Males being more likely to be
average among pupils from Black ethnic groups:                                                        overweight (Y6: 37.7% vs 32.5%),

       44%                         students from Black
                                   ethnic groups were
                                                                      34%
                                                                    among students from
                                                                                                      Reception 23.3% vs 22.7%), and in
                                                                                                      both age groups Asians backgrounds
                                                                                                      having the lowest levels of
                                   overweight or obese.             White ethnic groups.
                                                                                                      overweight, whilst Black
                                                                                                      backgrounds have the highest levels.
People: Mental Health among Children & Young People

The proportion of pupils with Social, Emotional and Mental health needs in Haringey is higher than the
average London and England rates.

                                                                       • In 2020 the proportion of pupils of all
                                                                         ages with social, emotional and
                                                   Haringey:             mental health needs in Haringey was
                                                                         2.77%. This is higher than both the
                                                   2.77%                 London Average (2.49%) and the
                                                                         England Average (2.7%)

                                                                       • In 2017, 39% of boys and 29% of girls
                                                   London:               in Year 6 had high self-esteem scores
 Source: PHE 2020                                  2.49%                 in Haringey. Among Year 8 and 10
                                                                         students, 31% of pupils had high self-
                                                   England:              esteem scores.
                                                   2.7%                • The rate of hospital admissions for
                                                                         self harm in 10-24 year olds was 211
                                                                         per 100,000, a decrease on last year
                                                                         (252 per 100,000), but remaining
                                                                         above the London average (196 per
                                                                         100,000).
 Source: PHE 2018/19
People: Youth crime
Haringey has the second highest rate of drug use (excluding Cannabis) among 15 year olds of all London
boroughs. There is also a higher than average rate of young people cautioned or sentenced in the borough.

                Proportion (%) aged 15 who have taken drugs in the last month
                                (excluding Cannabis), 2014/15                                                                                                  • 2.4% of 15 year olds in Haringey say
                                                      Series1              Series2             Series3                                                           they have taken drugs in the last month
 3.00
 2.50                                                                                                                                                            (excluding Cannabis). This is more than
 2.00
 1.50
                                                                                                                                                                 double the SN and London rates, and
 1.00                                                                                                                                                            is the second highest of all London
  .50
  .00
        1   2   3   4   5   6   7   8   9   10   11   12   13   14   15   16   17   18   19   20   21   22   23   24   25   26   27   28   29   30   31   32
                                                                                                                                                                 boroughs.

   Source: What About Youth? Survey, Public Health England 2014/15

                                                                                                                                                               • The rate of young people being
                                                                                                                                                                 sentenced or cautioned in Haringey is
                                                                                                                                                                 above SN and London averages for 15-
                                                                                                                                                                 17 year olds, but has fallen below the
                                                                                                                                                                 SN average for 10-14 year olds.
                                                                                                                                                                 Haringey has the 6th highest rate in
                                                                                                                                                                 London for 15-17 year olds, and the
                                                                                                                                                                 14th highest for 10-14 year olds.

   Source: MPS 2019/20
People: Youth Offenders
Among Haringey’s most prolific youth offenders, signs of poor parenting was evident in the first year of life in 45%
of cases; 90% had experienced loss of a parent through death or separation by the age of 5; and 30% had
witnessed domestic violence by the age of 7.

                                                                           • In their early years, there are a number of
                                                                             events and circumstances that are
                                                                             common to Haringey’s 20 most prolific
                                                                             youth offenders.
                                                                           • Poor parenting is evident in the first year
                                                                             of life in 45% of cases; parental
                                                                             involvement in substance or alcohol
                                                                             misuse is evident in 30% of cases by the
                                                                             age of 1; and 90% have either
                                                                             experienced loss of a parent through
                                                                             death or separation by the age of 5.
                                                                           • Among the 20 most prolific youth
                                                                             offenders, the average age at which they
                                                                             initially came to the attention of an
                                                                             agency due to behavioural concerns is 4
                                                                             years old.
Place
Place: Character

 Haringey is made up predominantly of residential properties. Commercial centres can be found in a number
 of locations across the borough, with Wood Green and Tottenham High Roads being the biggest.
                Character Types of Haringey

                                                                             • Haringey is mostly residential,
                                                                               with urban terrace and villa /
                                                                               townhouse residences being
                                                                               most common.
                                                                             • By contrast, industrial and
                                                                               business properties are less
                                                                               common in the borough.
                                                                             • The main commercial centre is
                                                                               around Wood Green High Road,
                                                                               while there are smaller town
Town Centres & Local Shopping Centres                                          centres in Crouch End, Green
                                        Source: Haringey Council, 2015         Lanes, Muswell Hill and
                                                                               Tottenham Hale, among others.
Place: Perceptions of the Local Area
52% of Haringey residents agree that police do a good job in the local area – the lowest level of all London
boroughs. In some neighbourhoods as many as half of residents say they feel unsafe after dark.

                   % of residents who agree that 'police do a good job' in local area, Q3 2018/19                                                                                                     • 52% of Haringey residents agree the

                                                                                                                                                                                                77%
                                                                                                                                                                                    76%
                                                                                                                                                                                          76%
                                                                                                                                                                              75%
                                                                                                                                                                                                        police do a good job in the local area,

                                                                                                                                                                        74%
                                                                                                                                                                  73%
                                                                                                                                                      72%
                                                                                                                                                            72%
                                                                                                                                                70%
                                                                                                                                    69%
                                                                                                                                          69%
                                                                                                                              68%
                                                                                                                  67%
                                                                                                                        67%
                                                                                                66%
                                                                                                      66%
                                                                                                            66%
75%

                                                                                          65%
                                                                                                                                                                                                        compared to an average of 66% across

                                                                                    64%
                                                                        62%
                                                                              62%
                                                61%
                                                      61%
                                                            61%
                                                                  61%
                                          59%
                                    58%
                        56%
                              56%

65%
                  54%

                                                                                                                                                                                                        London. This is the lowest level in London.
      52%
            52%

55%
45%                                                                                                                                                                                                     Confidence in all areas of policing tested
35%                                                                                                                                                                                                     had come down every year since 2014.
25%
                                                                                                                                                                                                      • 15% of Haringey residents feel unsafe in
                                                                                                                                                                                                        their local area after dark. Those in North
                                                                                                                                                                                                        Tottenham and West Green & Bruce
                                                                                                                                                                                                        Grove are most likely to say they feel
                                                                                                                                                                                                        unsafe, while those in Crouch End and
                                                                                                                                                                                                        Muswell Hill are least likely to say they feel
  15% of residents say they feel unsafe when
     outside in their local area after dark.                                                                             78% of residents say they have                                                 unsafe.
                                                                                                                            good friendships and/or                                                   • Despite this, residents’ sense of place and
 Residents of North Tottenham (49%) and West                                                                             associations in their local area
 Green & Bruce Grove (24%) are most likely to                                                                                                                                                           community in Haringey appears to be
       say they feel unsafe after dark.                                                                                                                                                                 strong. Three quarters say they have good
                         Source: Haringey Residents Survey 2018
                                                                                                                         83% say there are good relations                                               friendships and/or other associations in
                                                                                                                            between different ethnic and                                                their local area, and over four in five say
  11% of Year 8 and 10 students in Haringey
                                                                                                                        religious communities in their local                                            there are good relations between different
   report having been a victim of violence or
                                                                                                                                       area                                                             ethnic and religious communities.
aggression in the area where they live in the last
                  12 months.
                    Source: Health Related Behaviour Survey 2017
Place: Violent Offences
Haringey has the fifth highest rate of domestic abuse with injury in London, and the highest rate of Knife
Crime with Injury in London.

                                                                               • Between April 2019 and Mar
                                                                                 2021 Haringey registered the
                                                                                 highest rate of knife crime with
                                                                                 injury in London, at 11.4 incidents
                                                                                 per 10,000 people
                                                                               • Although Haringey’s number of
                                                                                 incidences of Domestic Abuse
                                                                                 with Injury was only 12th in
                                                                                 London, the rate per 10,000 is 5th
                                                                                 highest (62.1 per 10,000), and is
                                                                                 higher than both the statistical
                                                                                 neighbour average (52.8), and
                                                                                 London’s statistic (52).

Source: MPS 2021
Place: Hate crime

Haringey saw a 13% decrease in overall hate crime between 2019/20 and 2020/21, with particular decreases
in Islamophobic and Homophobic hate crimes. There were however increases in the number of Anti-Semitic,
Disability and Transgender Hate Crimes.

                                                                       • There was a substantial decreases in the
                                                                         number of Homophobic Hate Crimes, from
                          Haringey   Haringey    Haringey    London      149 to 110 (26% reduction)
                          2020/21    2019/20    Change %    Change %   • In all types of hate crime Haringey’s
                                                                         increases and decreases differed from the
                                                                         overall figures for London. Most notably
                                                                         Haringey’s large reduction in Homophobic
                                                                         hate crime is in contrast to London’s 5%
Overall Hate Crime          286        327       -13%         -6%        increase.
                                                                       • The largest increase in Anti Semitic hate
Islamophobic Hate Crime     32         39         -18%       -26%        crime, which saw 4 additional crimes
Anti-Semitic Hate Crime     35         31         13%         0%         recorded, a 13% increase. London’s 611
Homophobic Hate Crime       110        149        -26%        5%         overall instances was a 0% increase on last
                                                                         years.
   Faith Hate Crime         81         83         -2%        -14%
 Disability Hate Crime      17         15         13%         9%
Transgender Hate Crime      11         10         10%         -1%
   Source: MPS 2021
Place: Events & Culture
Haringey has over 120 venues where cultural activity takes place, and over 70 events occurring annually.
There is a good spread of cultural venues across the borough.

                                                                              •   Haringey has over 120 venues where
                                                                                  cultural activity takes place, and over 70
      Haringey Cultural Infrastructure,   Haringey Cultural Infrastructure,
               January 2019                        January 2019
                                                                                  events occurring annually – from
                                                                                  community theatre to large scale music
                                                                                  events.
                                                                              •   While there are clear clusters of activity
                                                                                  (for example around Alexandra and
                                                                                  Finsbury Parks, Noel Park, Crouch End
                                                                                  and Tottenham Green), cultural venues
                                                                                  are well spread across the borough,
                                                                                  meaning that there is good access to
                                                                                  culture for residents.
                                                                              •   There are over 2,700 creative and
                                                                                  cultural industry (CCI) enterprises in
                                                                                  Haringey, which are estimated to employ
                                                                                  over 5,220 people and deliver nearly
                                                                                  £211m of GVA. There is a larger
                                                                                  concentration of creative and CCI
                                                                                  enterprises in the west of the borough.
Place: Open Space

  Just over a quarter (27.8%) of Haringey is made up of open space, compared to a borough average of 33%
  for London. Access to nature varies substantially between different wards.

                                                                                        % of homes with   •    Just over a quarter (27.8%) of Haringey is made up of
                                                                     Haringey Ward      good access to         open space*. Although below the borough average for
                                                                                             nature
                                                                   Alexandra                  100              London (33%), Haringey has many public parks and open
                                                                   Bounds Green               100              spaces, including most notably Alexandra Park in the
                                                                   Crouch End                 100
                                                                   Fortis Green               100              middle of the borough, and Finsbury Park in the south.
                                                                   Harringay                  100
                                                                   Highgate                   100         •    There is substantial variation in the amount of open space
                   Alexandra
                                                                   Muswell Hill
                                                                   Seven Sisters
                                                                                              100
                                                                                              100
                                                                                                               in different wards. For example, while all homes in
                                                                                                               Alexandra and Bounds Green have good access to
                      Park
                                                                   Hornsey                     99
                                                                   Tottenham Hale
                                                                   Stroud Green
                                                                                               99
                                                                                               98
                                                                                                               nature, just two fifths of homes in West Green (38%) and
                                                                   Northumberland                              Noel Park (41%) do. Broadly speaking, access to
                                                                   Park                         93
                                                                   White Hart Lane              87
                                                                                                               metropolitan parks in Haringey is very good, while access
                                                                   St. Ann's                    58             to local, small or pocket parks and district parks is less
                                                                   Bruce Grove                  52
                                                                                                               good.
                                 Finsbury
                                 Park
                                                                   Tottenham Green              51
                                                                   Woodside                     46
                                                                   Noel Park                    41        •    Haringey now has 25 Green Flag Parks (judged to be
                                                                   West Green                   38             welcoming, safe and well managed with active community
                                                                     Source: Greenspace Information for
                                                                      Greater London (GiGL), GLA 2014
                                                                                                               involvement). Three new flags were appointed in 2017
                                                                                                               (Highgate Wood, Alexandra Park and Tottenham Marshes).
*In accordance with the GiGL database, the category of ‘open space’ includes areas where 'restricted' or no information is designated, while areas with homes with ‘good access to nature’ constitute
those that have access to public open green space.
Place: Vibrant Economy Index
According to the Vibrant Economy Index Haringey is below the English average, ranking 205 th out of 324 LAs. Nationally,
Haringey ranks in the top tercile on Community Trust & Belonging.

•   Grant Thornton’s Vibrant Economy Index provides a different way of evaluating the local economy, by looking beyond traditional measures of
    economic success and incorporating measures on health, happiness, equality, environmental resilience, community and opportunity.
•   Haringey’s position on this index has fell from 166th to 205th out of 324 local authorities between 2017 and 2018. Nationally Haringey in the
    lowest terciles for prosperity, inclusion & equality, and health, wellbeing & happiness.

                                                                                                                                                Community,
                                             Dynamism &               Inclusion &         Health, Wellbeing &          Resilience &                          OVERALL
                           Prosperity                                                                                                            Trust &
                                             Opportunity                Equality              Happiness                Sustainability                        RANKING
                                                                                                                                                Belonging

         Camden                4                    7                       176                     283                       49                      4         3
          Barnet              86                    57                      158                     141                        7                     23        39
         Islington             3                    11                      253                     261                      170                     13        15
         Haringey             230                  157                      286                     211                      178                     41        205
      Waltham Forest          257                  232                      270                     156                       51                     74        179
          Enfield             149                  216                      285                     224                       87                     110       199
         Hackney              45                    54                      317                     264                       91                     285       232

                             Numbers show the borough’s rank ing out of 324 English local authorities; the lower the number the better the performance.
                                Colour coding represents: top tercile performance; second tercile performance; bottom tercile performance.
Place: Carbon Emissions
Haringey has reduced its carbon emissions by 44.4% since 2005, and per capita emissions are now below
the level seen among most neighbouring boroughs, the London average and the UK.
                                                                                                   • Haringey has the third lowest carbon emissions per
                                                                                                     capita among its neighbouring boroughs, just above
                                                                                                     Waltham Forest with 2.5 tons of CO2. This is
                                                                                                     substantially below the Greater London (3.3) and England
                                                                                                     levels (4.5).
                                                                                                   • The latest figures, from 2017, show that Haringey has
                                                                                                     reduced its overall carbon emissions by 44.4% since
                                                                                                     2005. This is a sharper reduction than the national level
                                                                                                     (39.2% decrease), though it slightly lower than the
                                                                                                     London average (46.8%)
   Carbon dioxide emissions per capita for Haringey and neighbouring boroughs (t CO2 per person)
                                                                                                • The largest proportion of Haringey’s carbon emissions
                                                                                                  come from the domestic sector (50%). Haringey was the
                                                                            Haringey’s 2020       11th best performing London borough in 2017, seeing a
                                                                           Target is 624.8Kt of   reduction of 6.7% in domestic emissions. Since 2005,
                                                                          CO2. 2017 emissions     domestic emissions have decreased by 38.4%, which is
                                                                             were 667.7Kt,        better than the UK average, London and our
                                                                              meaning that        neighbouring boroughs.
                                                                          Haringey is currently
                                                                          on target to achieve     • Haringey also saw reductions in carbon emissions from
                                                                             this ambition           the industrial and commercial sector (down 7.7%) and
                                                                                                     the transport sector (down 2.9%) between 2016-17
Place: Climate Emergency

Haringey Council announced a Climate Emergency in March 2019, reflecting a renewed desire to set
ambitious targets for the future.
Contributions from the                                                                                             • Since setting the 40:20 ambition in
community:                                                                                                           2009, the Council looks on track to
•   Haringey is home to lots of active                                                                               achieve the goal of reducing carbon
    community groups that help                                                                                       emissions in the borough by 40% by
    reduce carbon emissions, air                                                                                     2020.
    pollution and improve health in                                                                                • This has been achieved by great work
    the borough.                                                                                                     from the Council and the community –
•   From En10ergy installing solar                                                                                   such as achieving a 51% reduction in
    panels across the borough to the                                                                                 annual CO2 emissions on the Council’s
    Wolves Lane Centre’s inclusive                                                                                   estate since 2014.
    community growing – residents                                                                                  • The next goal will be to set out a road
    are actively working to create a                                                                                 map of how we plan to become a zero
    greener borough.                                                                                                 carbon borough at the earliest possible
•   The Muswell Hill Sustainability                                                                                  date.
    Group engage in global climate
                                                                                                                   • These efforts are supported by events
    change campaigning, run talks        Children receiving cycle maintenance training – enabling more residents     such as the annual Saddle and Sole
    and shows for the community          to get active and reduce their carbon footprint.                            Festival of Walking and Cycling and the
    and organise open home events                                                                                    Cycling Maintenance Project to get
    for people to see how                                                                                            more people active in the borough.
    sustainability can be achieved
    within your home.
Place: Air Pollution

Air pollution in Haringey is in line with London, as is the fraction of mortality attributable to particulate air
pollution. This is, however, higher than the England rate and has a particularly negative impact on children.

 Air Pollution in Haringey (PM2.5), 2013                         • Haringey has similar levels of air pollution to the London
                                                                   average (the average PM2.5 level is 15.95 across all
                                                                   Haringey neighbourhoods, compared to 16 in London).
                                                                   However, there are pockets where pollution is particularly
                                                                   high (e.g. Harringay).
                                                                 • The fraction of mortality attributable to particulate air
                                                                   pollution is 6.6%. This is in line with London (6.4%), but
                                                                   substantially higher than England (5.1%).
                                                                 • Young people are a particular focus for the London Mayor’s
                                                                   air pollution strategy, due to the increased impact. 0-5 year
                                           Source: PHE 2020        olds make up three times as many admissions for asthma
                                                                   in NCL as 6-18 year olds. NCL’s admissions rate for
                                                                   Asthma however is lower than England’s average by 20-
                                                                   25% over the last 4 years
                                                                 •    24% of the capital’s primary schools are in areas that
                                                                     breach the legal limit for NO2, according to the Greater
                                                                     London Authority. Three of Haringey’s primary schools
                                                                     were part of the Mayor’s audit on air pollution affecting
                                                                     primary schools, and will receive extra funding.

           Source: PHE 2020
You can also read