Child poverty in Kensington & Chelsea A briefing for London's councillors - Autumn 2018 - Child Poverty Action Group
←
→
Page content transcription
If your browser does not render page correctly, please read the page content below
Child poverty in Kensington & Chelsea
A briefing for London’s councillors

Autumn 2018
Contents

Introduction ............................................................................................................................................ 3

Rates of child poverty .............................................................................................................................. 5

Low pay ................................................................................................................................................. 11

Employment .......................................................................................................................................... 14

Housing ................................................................................................................................................. 16

Crisis prevention and support ............................................................................................................... 20

Council tax and recouping costs ............................................................................................................ 24

Early years and childcare ....................................................................................................................... 27

Education, schools and life chances ...................................................................................................... 30

Sources of support for your constituents .............................................................................................. 34

Staying in touch ..................................................................................................................................... 35

                                                                                                                                                          2
Introduction
There were 4.1 million children living in poverty in the UK in 2015‐16.i That’s 30 per cent of children,
or 9 in a classroom of 30. Projections indicate that under current policies this is likely to rise to 5.2
million by 2021‐22.ii

When kids grow up poor they miss out – and so do the rest of us. They miss out on the things most
children take for granted: warm clothes, school trips, having friends over for tea. They do less well at
school and earn less as adults.

Different regions face differing child poverty rates, related to differences in labour market
characteristics and the cost of housing. London has the highest child poverty rate of all UK regions and
this is expected to remain the case over the coming years. However some other regions are expected
to see more rapid increases.

Child poverty rates by region, actual and projected to 2019‐21

         Region                    2006‐2008                    2013‐2015                    2019‐2021

     North East                       34.5%                       28.2%                        39.7%
     North West                       33.2%                       30.3%                        38.2%
 Yorkshire & Humber                   31.6%                       29.2%                        37.0%
    East Midlands                     29.3%                       28.6%                        36.2%
   West Midlands                      35.4%                       32.8%                        40.8%
   East of England                    26.2%                       25.1%                        31.8%
       London                         40.2%                       36.5%                        41.5%
     South East                       26.4%                       24.8%                        28.9%
     South West                       26.3%                       25.9%                        31.6%
        Wales                         32.1%                       29.7%                        39.2%
      Scotland                        24.6%                       23.2%                        29.0%
  Northern Ireland                    24.8%                       25.7%                        34.6%
          UK                          30.8%                       28.8%                        35.6%
Source: Institute for Fiscal Studies, Living standards, poverty and inequality in the UK: 2017‐18 to 2021‐22
(2017); taken from CPAG, Child Poverty in London Westminster Hall debate: Parliamentary Briefing (February
2018)

Poverty in London has its own particular characteristics. Economically, London is a wealthy city but
that wealth is not shared by all. While the richest 10% of London’s households own 50% of the
capital’s wealth, the poorest 50% of Londoners own just 5% of the city’s wealth.

London’s children are more likely to grow up in poverty than contemporaries elsewhere in the UK –
indeed, 37% of London’s children (that’s 700,000) live in poverty after housing costs are taken into
account.iii London has the highest rate of child poverty of any English region – and there are as many
poor children in London as in all of Scotland and Wales.iv There is often an assumption that work is a
guaranteed route out of poverty but, because of low pay, high costs of childcare and insecure work,
two thirds of children living in poverty live in a household where at least one parent works.

Child poverty is a problem for society, not just because of the human costs. A child living in poverty
will, on average, develop slower than contemporaries, do less well at school, have poorer physical and

                                                                                                               3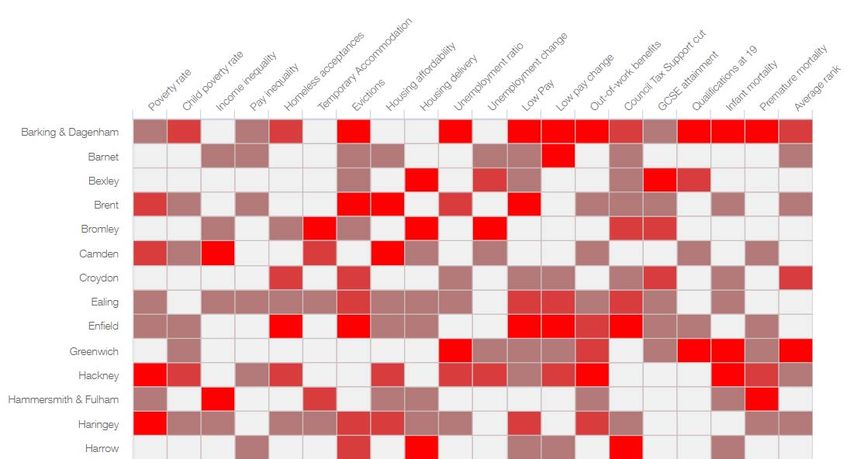
mental health, and will generally have reduced life chances than wealthier contemporaries, including
reduced earning power over their lifetime. We all love and want the best for our children, but living
on a low income makes it more difficult for families to provide everything their children need to
succeed. Research at the London School of Economics has robustly demonstrated a causal link
between low income and worse child outcomes – it is poverty itself which damages children’s life
chances; conversely, when families’ incomes increase, children do better.v

Poverty is damaging. It damages childhoods; it damages life chances; and it damages communities. In
2013 it was estimated that child poverty costs the UK at least £29 billion each year, in services and in
wasted potential.vi Conversely, investing in children is one of the best investments we could make as a
country.

The link between child poverty and ill health is well‐established. Views From The Frontline, a joint CPAG
and Royal College of Paediatrics and Child Health report published in May 2017, found that
paediatricians are seeing the effects of poverty on children’s health every day in their practices, and
that they believe it is getting worse. Indeed, in 2013, it was estimated that child poverty costs the
country £1.5billion each year through the increased need for acute healthcare.vii

Trust for London has shown that 58% of Londoners in poverty live in a working family, where at least
one person works. This equates to 1.3 million people ‐ a 50% increase over the last decade.

In London, wages have flat‐lined and failed to keep pace with the capital’s soaring cost of living. On
top of this there is a shortage of family‐friendly jobs and affordable, high quality flexible childcare.

At the same time, around £27bn a year has been taken out of social security spending since 2010,
which means less money in the pockets of low‐income families and less being spent in local
economies. Most benefits for working‐age families have been frozen, drastically reducing families’
real incomes, and cuts to universal credit mean that it will not deliver on its promise to make work
pay or reduce child poverty. In fact, child benefit, a lifeline for families, is set to lose 23 per cent of its
value this decade.viii

Trust for London has made it clear that the cost of housing is the main factor explaining London’s
higher poverty rates compared with other parts of the country. London’s housing costs are soaring,
and more and more children across the capital are becoming homeless as too many of London’s
families (both in and out of work) do not have access to affordable, secure, quality housing. More
people in poverty live in the private rented sector than any other housing tenure and the number of
children living in poverty in private rented accommodation has tripled in the last decade.
Furthermore, seven in ten households in temporary accommodation in England are in London. Over
80% of these households include children.ix

This briefing pack provides an overview of child poverty and related issues and you will also find a
breakdown of the child poverty rate in your ward, and how it compares to the rest of the borough, and
the rest of London. We hope this pack proves useful for your work supporting low income families and
children in your area.

                                                                                                             4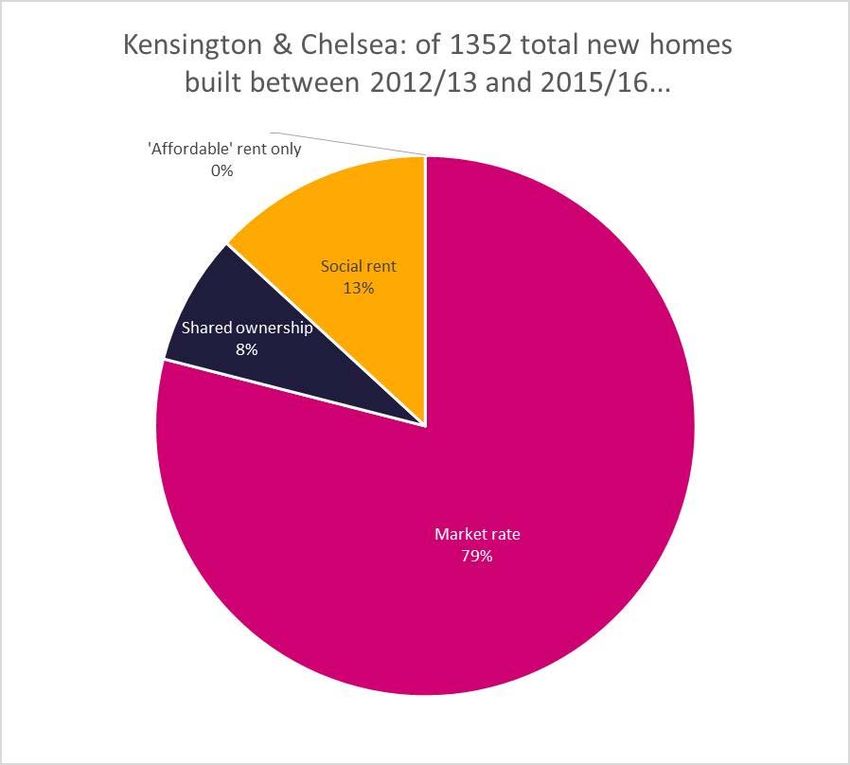
Rates of child poverty
A child is living in relative poverty if living in a household with below 60 per cent of contemporary
median income, according to government measurements.

End Child Poverty statistics

The following information for your borough has been calculated by the University of Loughborough
and published by the End Child Poverty (ECP) coalition in 2018, after housing costs have been taken in
to account: http://www.endchildpoverty.org.uk/poverty‐in‐your‐area‐2018/

       Percentage of children in poverty, July‐Sept 2017                   AFTER HOUSING COSTS
                                    Local Authority and wards     Number of children          %

                                      Kensington and Chelsea            6,123                   30.49%

                                                   Abingdon              224                    21.42%
                                                   Brompton              121                    16.76%
                                                   Campden               57                     7.32%
                                                      Colville           422                    35.18%
                                                   Courtfield            77                     10.60%
                                                   Cremorne              525                    43.17%
                                                 Earl's Court            264                    27.64%
                                                    Golborne             926                    48.49%
                                                 Hans Town               197                    27.13%
                                                     Holland             260                    22.18%
                                                     Norland             388                    28.51%
                                               Notting Barns             957                    43.90%
                                                  Pembridge              121                    17.38%
                                               Queen's Gate              32                     3.87%
                                                    Redcliffe            135                    13.16%
                                               Royal Hospital            118                    16.33%
                                                   St Charles            855                    42.94%
                                                      Stanley            195                    23.39%

The End Child Poverty coalition, 2018 release ‐ http://www.endchildpoverty.org.uk/poverty‐in‐your‐area‐2018/

NB – this information is based on HMRC ward data which is out of date. A new version (with up to date ward
boundaries) is currently being developed by the End Child Poverty coalition.

                                                                                                             5
Consider how these percentages and numbers compare to those across London, according to the two
maps below, also compiled using ECP data.
Data from End Child Poverty coalition, 2018: http://www.endchildpoverty.org.uk/poverty‐in‐your‐area‐2018/
6Data from End Child Poverty coalition, 2018: http://www.endchildpoverty.org.uk/poverty‐in‐your‐area‐2018/
7Other poverty‐related indicators
Trust for London’s ‘London Poverty Profile’, compiled with the New Policy Institute also provides a
wealth of information, from over one hundred indicators, revealing patterns in poverty and inequality
from across the capital. This overview map provides a sense of the extent of inequality across London.
Source: taken from Trust for London and NPI, London’s Poverty Profile (2017)
https://www.trustforlondon.org.uk/data/boroughs/overview‐of‐london‐boroughs/
8Below are just a few examples on low pay and evictions, both of which will be explored in more detail
later on in the briefing. You can find more by visiting: https://www.trustforlondon.org.uk/data/
Low‐paid jobs by borough
Source: taken from Trust for London and NPI, London’s Poverty Profile (2017)
9Evictions by borough
Source: taken from Trust for London and NPI, London’s Poverty Profile (2017)
10Low pay
Two thirds of children living in poverty in London live in a household where at least one parent is in
work. Many Londoners work long hours, but are not paid enough to make ends meet or to give their
children the quality of life they would like to give them.
There is a big difference between the “London Living Wage” (£10.20 p/h for over‐18s), which is
accredited by the Living Wage Foundation and calculated to reflect the real cost of living in the
capital, and the legal minimum hourly “National Living Wage” (£7.83 for over‐25s, £7.38 for ages 21‐
24, and £5.90 for 18‐20). 1 in 5 jobs in London is paid less than the real London Living Wage.x
As of Living Wage Foundation data from October 2018, there are only 1,391 London Living Wage
accredited organisations in the capital (based on those organisations with headquarters in each
borough, and therefore not including individual branches of accredited organisations), and only
around half of London’s Local Authorities are London Living Wage employers.xi However, the Living
Wage Foundation has found that paying the real Living Wage has had a huge positive impact on
businesses, improving reputation, motivation and retention.
Cuts to the universal credit work allowance in July 2015 also means that this new benefit will not
provide such a strong incentive to work as it was originally designed to do, with recipients able to
keep less of what they earn before their universal credit is withdrawn.
Living Wage accredited councils
Source: CPAG & Living Wage Foundation, Moving to the London Living Wage (June, 2017)
11Pay across boroughs
Number of Living Percentage of
Living Wage Wage accredited low‐paid Income Pay inequality
accredited? organisations – as residents by inequality* by borough*
of Oct 2018* borough
Barking and Dagenham N 6 32% 116% 2.61
Barnet N 12 25% 135% 2.56
Bexley N 5 23% 120% 2.43
Brent Y 31 32% 123% 2.64
Bromley N 7 16% 128% 2.41
Camden Y 141 17% 155% 2.49
Croydon Y 33 24% 122% 2.29
Ealing Y 23 26% 127% 2.59
Enfield Y 8 29% 125% 2.49
Greenwich Y 75 23% 126% 2.52
Hackney Y 84 23% 121% 2.55
Hammersmith and Fulham Y 19 13% 144% 2.49
Haringey N 23 26% 129% 2.35
Harrow N 4 23% 126% 2.62
Havering N 1 21% 121% 2.36
Hillingdon N 3 24% 121% 2.56
Hounslow Y 14 25% 126% 2.88
Islington Y 139 14% 138% 2.53
Kensington and Chelsea N 21 16% 209% 2.45
Kingston upon Thames N 4 18% 130% 2.36
Lambeth Y 86 20% 126% 2.44
Lewisham Y 45 21% 121% 2.45
Merton N 9 20% 136% 2.31
Newham N 15 36% 119% 2.63
Redbridge N 6 20% 123% 2.51
Richmond upon Thames N 10 12% 143% 2.42
Southwark Y 126 21% 129% 2.39
Sutton N 7 21% 123% 2.53
Tower Hamlets Y 92 20% 131% 3.33
Waltham Forest Y 17 28% 119% 2.41
Wandsworth N 18 12% 139% 2.33
Westminster N 171 15% 170% 2.76
1391 as of October 21% average
16 accredited
2018 across London London wide 2.37 London
The London‐wide picture Living Wage
(20% in Inner; avg of 128% average
boroughs
23% in Outer)
Sources: CPAG and Living Wage Foundation, Moving to the London Living Wage: A Guide for Local Authorities in London
(June 2017), and Trust for London & NPI, London Poverty Profile (2017) and Living Wage Foundation data from Oct 2018
*Descriptions:
12‐ Number of Living Wage accredited organisations – as of Oct 2018: This is the number of accredited organisation in each
borough based on those organisations with headquarters in each borough, and as such does not include individual branches
of accredited organisations
‐ Income inequality: mean household income (including earnings and other income) as a proportion of median income
‐ Pay inequality by borough: comparing the ratio of top and bottom pay: gross hourly pay for the top 20% vs bottom 20%
As can be seen from the above comparison table, only 15 of London’s 32 boroughs (not including the
City of London) are accredited Living Wage employers, meaning they pay the Living Wage right the way
through their supply chains, including contractors.
Furthermore, accredited Living Wage employers are very much concentrated in Inner London, and
there are far fewer accredited organisations (or indeed accredited councils) in Outer London.
It is significant to note that while 21% of all London’s residents are low paid (earning less than the
London Living Wage), residents in Outer London are more likely to be low paid than those in Inner
London – further demonstrating the need for more Outer London councils to consider accreditation.
In no London Borough does median income (the income of the ‘person in the middle’) match mean
income (the income all households would have if everyone’s incomes were added up and shared
equally) – meaning there is significant income inequality across all London Boroughs. Kensington &
Chelsea has the worst levels of income inequality (where mean income is more than double median
income) while Barking & Dagenham and Waltham Forest are more equitable.
Finally, across London, residents are paid significantly different per hour rates, with the average
Londoner in the highest 20% being paid 2.4 times more than a resident in the lowest 20%.
Councils paying the London Living Wage and setting an example
The Living Wage Foundation has found that paying the real Living Wage has had a huge positive
impact on businesses, improving reputation, motivation and retention
By signing up as an accredited Living Wage employer, local authorities are not only improving the
lives of employees; their leadership has a ripple effect in improving the lives of people who live
and work in the local area
There is a difference between paying the Living Wage to direct members of staff but not
contractors etc, which is why it is important that Local Authorities commit to accreditation,
assuring the Living Wage is paid throughout the supply chain.
See:
CPAG and Living Wage Foundation, Moving to the London Living Wage (2017)
Resolution Foundation, Calculating a Living Wage for London and the rest of the UK (2017)
Cardiff University, Living Wage Foundation & Citizens UK, The Living Wage Employer Experience (2017)
Trust for London and Resolution Foundation, London Stalling: Half a Century of Living Standards in London (2018)
13Employment
London has some of the lowest rates of maternal employment in the UK – which is significant, given
that a family’s likelihood of living in poverty is dependent on the employment of the ‘second earner’
(usually the mother). The Mayor of London’s Early Years in London 2018 paper found that only 65% of
mothers with dependent children are in paid work, compared with 74% in the rest of the UK. The
same paper found that there is a gap of 17 percentage points between the employment rate for
white mothers and for Asian mothers.xii
As of CPAG’s Childcare and Maternal Employment in London 2013 report on this issue, there was a 9%
gap between the number of lone parents working in London and the UK average, and a 14 % gap
between mothers in couples in work in London and the UK average. A number of factors may be
contributing to this, including both the lack of quality part‐time jobs within the capital, and the high
cost of childcare.
Interestingly, CPAG and NPI’s 2015 Trends in Parental Employment in London report noted:
‘Measuring from 2008 (thus before the main employment impact of the recession) to 2014, the main
contribution to falling worklessness among households with children has come from single parents.
There has been no change in the employment rate for mothers or fathers in couples. However, the
percentage of couple households which are completely without employment has fallen, suggesting
that employment is less concentrated in dual‐earner households. The employment rate for single
parents in London is now very close to the national rate, while the employment rate for mothers in
couples in London remains far below the national rate.
Latest government figures (the DWP’s ‘Households Below Average Income’ data) show that the risk of
poverty for children reduces significantly when both parents work, especially if both work full time. In
households with one or both parents working part‐time, 63% of children are in poverty. Where one
parent is in full‐time work this falls to 13%. When both parents work full time this falls to just 5%.xiii This
demonstrates the impact of access to enough work (and also access to sufficient, flexible and
affordable childcare) in reducing the risk of a child living in poverty.
This is particularly critical for children from lone parent families, who are almost twice as likely to live
in poverty as their couple family counterparts: 49% of children from lone parent families and 25% of
children from couple families live in poverty.xiv However, various factors can hold parents back from
working the hours they would like to, including a lack of quality part‐time jobs within the capital
(especially those compatible with school or nursery hours); the availability and cost of childcare,
particularly for people with ‘anti‐social’ or irregular working hours; childcare for older children; and
gaps in childcare before/after school and during school holidays. The government has recently made
thirty hours free childcare per week available for working parents of three and four year olds, but
parents who are studying or who have older or younger children are not eligible. These hours are
often only available during term time, and may only be available during daytime and weekday hours.
This situation leaves many mothers (in particular) limited to part‐time jobs during nursery or school
hours, which often offer low pay and poorer prospects for progression.
The conditionality criteria presented by UC will make this an ever more pressing problem as the main
carers of children aged three or above are now required to look for work.
14There are no publicly available breakdowns of maternal employment rates by London borough, but
below is a breakdown for maternal employment rates (within couples) in London compared to the
rest of the UK from 2014, from CPAG and NPI, Trends in Parental Employment in London (2015). This
shows that while the proportion of mothers in couples in London and the rest of the UK is about the
same, there is a significantly higher percentage of mothers in couples not in work in London when
compared to the rest of the UK, and a significantly lower percentage of mothers in couples in part‐
time work in London when compared to the rest of the UK.
Employment rates of mothers in couples with a dependent child…
in London in the rest of the UK
Source: CPAG and NPI, Trends in parental employment in London (2015)
Practical recommendations:
Targeted employment schemes for mothers in the local area – which could involve
commissioning a survey to find out exactly what the maternal employment rates are in your
borough, and an examination of the reasons for this locally
Providing bespoke support to parents (especially mothers) looking to access employment,
offering advice on training, volunteering, childcare and financial options, and negotiating
working hours.
All job vacancies within London Local Authorities and associated arms‐length organisations
should be advertised with flexibility as the norm. Employers can make use of the freely
available Happy to Talk Flexible Working strapline. A variety of tools and accreditation
systems are available to provide routes for all councils to open up jobs to flexible working,
within their organisation and in the local labour market
See childcare and extended schools recommendations below.
See:
CPAG, Childcare and Maternal Employment in London (2013)
CPAG and NPI, Trends in Parental Employment in London (2015)
15Housing
The cost of housing in much of London is extremely high, and the capital is facing shortages of all
tenures that are genuinely affordable. As Trust for London states in its 2017 Poverty Profile, ‘Housing
costs push many Londoners into poverty and are a significant contribution to the fact that London's
poverty rate is higher than in the rest of England.’
It used to be that a child living in poverty in London would be more likely to live in council or social
housing – but these days they are more likely to live in private rented sector accommodation. Private
rented sector accommodation in London is extremely expensive: for instance, the average rent for a
two‐bedroom private rented house in London is £1,730 compared with £820 across England. Two‐
bedroom homes to rent in London at the bottom quarter of the market are £1,250 a month – more
than twice the average for England at £500.xv
Private rented sector accommodation is also more insecure than council or social housing, and private
rented sector tenants do not have the same protections as those in council or social housing. In
addition, Universal Credit is increasing the risk of homelessness due to rent arrears arising from
delays, waiting periods, and non‐payment direct to landlords.
A lot of private rented accommodation in London is of poor quality, with damp being a particular
problem, and closely linked to some children’s respiratory illnesses. Many low income families live in
overcrowded properties, with children sharing bedrooms, or parents sleeping in living rooms.
Homelessness is also a major problem in London. There are 45,000 families with children in London
living in temporary accommodation, a quarter of which have been moved out of borough. Temporary
accommodation is often inadequate, sometimes unsafe and usually overcrowded –most temporary
accommodation is not appropriate for raising children. Moving out‐of‐borough can mean moving
families away from their support networks (which can mean losing informal help with childcare that
enables parents to work) and disrupt children’s schooling. At the beginning of 2017, more than one in
three of total households placed in temporary accommodation were placed outside of their home
borough. Temporary accommodation should, by its definition, be short term: but according to Trust
for London, as at the beginning of 2017, 58% of families had been in temporary accommodation for
longer than a year, and 12% had remained for five years or longer.
According to the Trust for London statistics below, there are a number of London boroughs that have
built a relatively high proportion of ‘affordable’ housing, broadly defined. Definitions of ‘affordable’
housing in this table include shared ownership, ‘affordable’ rents and ‘social’ rents, there are
significant differences in the genuine affordability of each of these options. By requiring some upfront
costs, shared ownership properties remain out of reach for the poorest families, while ‘affordable’
rents can mean anything up to 80% of market rate rents (essentially prohibitive in much of London,
especially inner London). In contrast, ‘social’ rents are based on the government’s rent policy, and are
usually 50%‐60% of market rates. For the poorest families, it is ‘social’ rented properties (or genuinely
affordable ‘affordable’ rents) that are of most importance and value.
The overview table below provides an overall percentage of ‘affordable’ completions (i.e. new homes
built (including shared ownership, ‘affordable’ rent and ‘social’ rent) between 2012/13 to 2015/16 as
a proportion of total completions.
16Housing across boroughs
New In
‘affordable’ as Rent as a % of Homeless‐
Possession Cost of Lower temporary
a proportion of lower quartile ness % outside
orders quartile monthly accommoda
total new monthly gross acceptances borough
landlords* rent tion*
housing earnings by borough
completions*
Barking and
28.8 43% £950 52% 543 1,844 26%
Dagenham
Barnet 17.2 20% £1,257 66% 640 2,757 35%
Bexley 20.3 1% £900 47% 508 1,017 35%
Brent 26.6 30% £1,350 77% 556 2,915 4%
Bromley 15.5 5% £1,047 49% 831 1,439 54%
Camden 5.4 22% £1,842 85% 66 390 52%
Croydon 24.5 25% £1,050 55% 1,042 2,449 17%
Ealing 22.5 18% £1,300 70% 734 2,233 40%
Enfield 30.5 20% £1,200 64% 1,096 3,244 23%
Greenwich 14.3 40% £1,100 56% 546 520 31%
Hackney 13.3 29% £1,517 73% 803 2,900 30%
Hammersmith
10.4 19% £1,600 71% 365 1,264 53%
and Fulham
Haringey 23.6 36% £1,350 76% 683 3,147 41%
Harrow 21.7 2% £1,200 60% 449 758 23%
Havering 22.6 41% £860 45% 317 738 9%
Hillingdon 16.7 11% £1,100 56% 279 660 13%
Hounslow 14.1 29% £1,275 68% 376 853 18%
Islington 7.6 25% £1,668 74% 393 806 37%
Kensington and
9.3 21% £2,438 107% 482 1,849 72%
Chelsea
Kingston upon
9.3 19% £1,250 59% 239 671 21%
Thames
Lambeth 11.2 21% £1,430 71% 516 1,992 59%
Lewisham 19.7 22% £1,192 60% 768 1,864 24%
Merton 12.3 19% £1,300 63% 115 186 48%
Newham 22.1 28% £1,200 72% 1,206 4,457 38%
Redbridge 25.2 7% £1,050 55% 464 2,308 45%
Richmond upon
7.3 18% £1,350 59% 192 259 8%
Thames
Southwark 10.4 17% £1,352 67% 918 1,805 33%
Sutton 13.7 19% £1,075 53% 316 534 45%
Tower Hamlets 8.5 29% £1,582 76% 450 2,114 51%
Waltham Forest 21.3 47% £1,150 62% 820 2,299 55%
Wandsworth 10.9 19% £1,517 63% 798 1,490 34%
Westminster 9.7 12% £2,145 91% 534 2,503 51%
London Inner ‐ £1,500 Inner ‐ 72%
London‐wide London
average ‐ Outer ‐ £1,175 Outer ‐ 61% 18,045 54,265 36%
averages average ‐ 24%
16.5 England ‐ £495 England ‐ 29%
Source: Trust for London, London Poverty Profile (2017)
17*Descriptions:
‐ Possession orders landlords (outright possession orders per 1,000 renting households Q4 2015‐Q3
2016);
‐ New ‘affordable’ as a proportion of total new housing completions (‘affordable’ defined as including
affordable rent, social rent and shared ownership; net housing completions 2012/13 to 2015/16) NB see
further breakdown below;
‐ Cost of Lower quartile monthly rent (2 bedroom)
‐ Rent as a proportion of lower quartile monthly gross earnings
‐ Homelessness acceptances by borough (2016/2017)
‐ In temporary accommodation (as of Jan‐March 2017)
New homes built breakdown
The chart below details the breakdown of new homes built in your borough.
Source: Trust for London, London Poverty Profile (2017)
When it comes to child poverty, it is important to consider both the private rented sector and social
and council housing, given that a child living in poverty in London is more likely to live in private rented
sector accommodation than any other type of housing.xvi
18As can be seen on the table above, rates of possession orders (evictions) differ significantly across
boroughs, with Camden and Islington among the lowest, and Enfield higher than any other.
In no London borough have ‘affordable’ completions outweighed market rate completions. Four
boroughs (Bexley, Harrow, Redbridge and Waltham Forest) saw a net loss of social rented properties,
through demolition (not related to loss of stock through right to buy). Across London the average
proportion that ‘affordable’ completions made up of the total between 2012/13 and 2015/16 was just
22%. In four boroughs (Bexley, Bromley, Harrow and Redbridge) ‘affordable’ new completions made
up less than 10% of all completions.
It will come as no surprise that average rents in London are out of proportion with wages. The table
above charts the average monthly lower‐quartile (i.e. within the cheapest 25% of the market) cost of
a two‐bedroom property in each borough. It is worth comparing this to England’s lower quartile
average, which is £495 per month. There’s also a significant difference between these rents in inner
and outer London (£1500 and £1175 respectively).
In 2014/15, there were 250,000 households in London that were overcrowded by the ‘bedroom
standard’ which assesses the number of bedrooms needed according to the size and composition of
households, and levels of overcrowding in London are more than twice as high as the rest of England
across tenures – partly as a result of the inadequacy of social and affordable housebuilding to match
demand in London.xvii
Finally, homelessness in London is a very serious issue, partly as a result of evictions from private
rented accommodation, partly because of the unaffordable and unstable nature of renting in London,
and partly due to the decline in appropriate social housing. At the beginning of 2017, there were
19,700 households in temporary accommodation located outside their home borough, more than one
in three of total households placed in temporary accommodation.
Practical recommendations:
Use new responsibilities under the Homelessness Reduction Act as a chance to invest in
quality local housing advice and support services (particularly around the process of private
sector evictions) to ensure more low income families are able to stay in their homes.
Review and develop new licencing powers to enforce a decent minimum standard of private
rented sector conditions in the borough.
Engage honestly with constituents about planning decisions locally, especially whether
affordable housing will be included, and the nature of this affordable housing. This could
include engaging with the local population about how genuinely affordable the proposed
housing is (for instance, shared ownership properties are less likely to help the lowest
income families locally than affordable or social rented properties), and the percentage
available.
See:
Crisis, The Homelessness Monitor: England 2018 (2018)
Mayor of London, London, London Housing Strategy (2018)
London Councils, Temporary Accommodation in London: Local Authorities under Pressure (2016)
CPAG & Royal College of Paediatrics and Child Health, Poverty and child health: views from the frontline (2017)
19Crisis prevention and support
Destitution in London is increasing, as well as food bank usage. In many cases the trigger which tips a
family or person from being poor (but managing) into a crisis is a problem with their benefits. Access
to welfare rights advice, to help resolve problems with benefits early, is therefore key to prevent
crises and reduce the risk of destitution and people falling into problem debt. The roll out of universal
credit is a major change which is also increasing demands on advice services as people adjust to the
new benefit. Local Welfare Assistance schemes are also a vital part of the safety net, which help
families who find themselves in crisis or who are faced with sudden unexpected costs. Together these
help to prevent the worst crises and enable families to get back on their feet faster when something
goes wrong. However in the current funding environment many local authorities have scaled back
investment in advice provision and local welfare assistance.
Preventing crisis: Welfare rights advice
Many of the most vulnerable families are not getting all of the support that they are legitimately
entitled to in their benefits, either because they don’t realise what they can claim or because they are
facing a problem or delay which they cannot resolve.
With the resources of Citizens Advice Bureau and other voluntary services stretched, there is a real
need for good quality, Local Authority funded welfare rights advice in public spaces. When families
receive the financial support they are entitled to, not only do they benefit but the local economy
benefits from their trade. When families miss out, on the other hand, there is less money in the local
economy and resulting problems such as homelessness can end up costing a Local Authority a great
deal more.
In 2013, the then Office of Public Management concluded that for every £1 invested in Macmillan's
welfare rights service, there was over £20 return in benefits claims, compensation and financial
reward. Indeed, CPAG’s advice workers in the First Love Foundation foodbank in Tower Hamlets were
able to deliver £11,000 in entitlements for families for every hour of benefits advice provided by
CPAG.xviii In the last 12 months of the project the team recovered just over one million pounds in
unpaid benefit to fully‐eligible clients, money which will go back into the local economy.
Had these clients been able to access welfare rights advice earlier, many would have been able to
resolve problems with their benefits before reaching a crisis. This would have avoided significant
hardship, debt and negative health consequences.
Supporting people in crisis: Local Welfare Assistance Schemes and Discretionary Housing Payments
A local welfare assistance scheme can help a family if they are in urgent need following an emergency
or unforeseen event and have no other source of help. The schemes are run by local councils since
the national ‘social fund’ was decentralised in 2013, and they vary. Some councils offer vouchers to
pay for food, fuel or clothing or bigger basic living items such as beds, cookers and fridges. Others
offer grants or loans with various conditions attached. These schemes operate on a discretionary
20basis, and every borough uses them differently. Overall, due to budget cuts, provision has generally
been cut back since these funds were localised to councils. Most councils are underspending on their
local welfare assistance provisions, not advertising schemes, or tightening eligibility, because of
budgeting concerns. CPAG research has found that, as a result, vulnerable people are slipping through
the net.
Discretionary Housing Payments (DHPs) have existed since 2001, but their funding and prominence
have increased following cuts to housing benefit, mostly in the Welfare Reform Act 2012. They are
extra payments that can be made by local authorities for residents who need extra help meeting their
housing costs. Demand for DHPs has increased significantly since 2013, as more households are
subject to the ‘benefit cap’ and face a shortfall between their housing benefit and their rent.
Good practice case study: Islington’s Resident Support Scheme, taken from Children’s Society &
Church of England, Not Making Ends Meet (2018)
Co‐delivered by the Cripplegate Foundation (a large borough‐wide charitable foundation) and
Islington. Most of the funding comes from the council, although the Foundation part funds
the scheme’s Development Officer and merged its individual grant scheme budget into the
Resident Support Scheme (RSS) as an outward demonstration of the commitment to joint
working.
The RSS offers grants for furniture and white goods (up to a value of £1,000) and smaller crisis
awards. There are no residency criteria and no limit on the number of applications for crisis
awards, although the scheme only allows one application a year for household items.
Applications are assessed by the Council’s RSS team, whilst Cripplegate is responsible for
training and liaising with around 50 participating voluntary and statutory organisations who
make referrals on behalf of their clients who are in crisis. Self‐referrals are not permitted.
The scheme is not promoted to the general public, because Islington’s intention is to target
resources to those most in need, so their efforts are focused on raising awareness among
community outreach services and other local advice agencies who have the best reach into
the communities who need the support.
Applications are monitored closely, by comparing their data with the Housing Benefit data to
ensure that their clients are representative of the target population that they are trying to
reach.
21Discretionary Housing Payments (DHPs) and Local Welfare Assistance Schemes (LWAS)
DISCRETIONARY HOUSING
SOCIAL FUND / LWAS
PAYMENTS
Change in actual Change in
Actual spend spend on DHPs 2012/13 spent on 2012/13 social
2016/17
on DHPs between relevant parts of fund spent and
Budgeted
2015/16 2013/14 and social fund 2016/17
2015/16 budgeted
Barking and Dagenham £736,777 ‐43% £781,400 £0 ‐100%
Provision made
Barnet £1,099,279 ‐10% £599,800 from reserve to ?
meet demand
Bexley £409,757 ‐24% £480,700 £0 ‐100%
Brent £2,651,625 ‐45% £804,500 £500,000 ‐38%
Bromley £509,475 ‐28% £733,500 £100,000 ‐86%
Camden £856,556 ‐27% £882,000 £400,000 ‐55%
Croydon ? ? £1,149,100 £586,000 ‐49%
Ealing £1,899,538 ‐41% £712,900 £350,000 ‐51%
£122,717 (spent
Enfield £1,871,270 ‐42% £843,600 ‐85%
by May 17)
Greenwich £1,151,557 ‐15% £1,056,100 £508,482 ‐52%
Hackney £1,756,075 ‐24% £1,535,700 £560,000 ‐64%
Hammersmith & Fulham £787,958 ‐42% £589,200 £751,000 27%
Haringey £1,572,149 ‐41% £1,066,400 £0 ‐100%
Harrow £733,413 ‐40% £344,600 £270,000 ‐22%
Havering £371,987 ‐7% £633,400 £38,077 ‐94%
Hillingdon £673,230 ‐45% £660,900 £0 ‐100%
Hounslow £714,666 ‐36% £566,100 £300,000 ‐47%
Islington £1,100,368 ‐40% £1,366,400 £2,395,751 75%
Kensington & Chelsea £1,376,423 ‐37% £511,700 £350,000 ‐32%
Kingston upon Thames £300,470 ‐31% £254,000 £25,000 ‐90%
Lambeth £1,266,189 ‐30% £1,318,300 £440,000 ‐67%
Lewisham £1,219,022 ‐12% £1,422,600 Not yet agreed ?
Merton £436,805 ‐2% £371,500 £90,000 ‐76%
Newham £1,261,107 ‐49% £967,300 No fixed budget ?
Redbridge £894,286 ‐42% £525,600 £212,000 ‐60%
Richmond upon Thames £187,232 ‐26% £252,400 £230,000 ‐9%
Southwark £1,017,624 ‐54% £1,275,000 £525,000 ‐59%
Sutton £292,005 ‐28% £358,300 £70,000 ‐80%
Tower Hamlets £2,118,336 ‐28% £1,153,900 £288,000 ‐75%
Waltham Forest £955,474 ‐38% £899,000 £200,000 ‐78%
Wandsworth £896,404 ‐35% £842,100 £260,000 ‐69%
Westminster £2,568,048 ‐45% £681,500 £510,000 ‐25%
TOTALS £33,711,023 ‐39% £25,644,600 £9,984,310 ‐61%
Source: FOI requests made by CPAG, 2017
22As we can see from the table above, where data is available, every single London borough has
reduced the amount of Discretionary Housing Payments issued between 2013 and 2016, some by
almost half. Across London, there has been an almost 40% reduction in DHPs, representing a
reduction of £21,535,494 across the capital of money previously invested in low‐income families in
need.
Spending on Local Welfare Assistance Schemes, replacing the old social fund, has also dropped
significantly, by 61% across London, as of last year’s data. In fact, it seems that at least four boroughs
(Barking & Dagenham, Bexley, Haringey and Hillingdon) had no LWAS scheme whatsoever as of last
year.
Practical recommendations
Invest in welfare rights advice to support the transition to universal credit and to reach more
residents. For instance, CPAG’s work with just one food bank in London, providing benefits
advice and support, has recouped £4.2m for residents in payments they were legally entitled
to since the project started in 2010
Review Local Welfare Assistance Schemes to ensure that these are targeted to those in most
need, do not come with very limiting conditions, and where possible are available in the
form of cash grants which people can use to meet immediate needs rather than loans
(which create debt) or vouchers (which do not allow necessary flexibility)
Advertise Local Welfare Assistance Schemes widely, with clear information on eligibility and
how to claim (online and through local charities, libraries, council offices, schools, children’s
centres etc).
See:
CPAG, previously unpublished FOI requests from CPAG Localisation in London report, as of April 2017
CPAG, CofE, Oxfam, The Trussell Trust, Emergency Use Only: Understanding and reducing the use of food banks
in the UK (2014)
Citizens Advice, The Impact of Welfare Benefits Advice (2013)
Trust for London and New Policy Institute, forthcoming research on LWAS spending (Autumn 2018)
Children’s Society & Church of England, Not Making Ends Meet (2018)
23Council tax and recouping costs
In April 2013 the government abolished council tax benefit and replaced it with locally run council tax
support schemes, accompanied by a 10% cut in funding for local authorities.
Since then, council tax arrears have risen as increasing numbers of claimants are being charged
council tax for the first time, and many are being charged court costs on top of arrears, as more and
more councils use bailiffs and harsh enforcement tactics to go after often unpayable council tax
debts.
Such tactics are usually counter‐productive; evidence suggests that councils with higher minimum
payments and greater use of bailiffs to recover debts do not necessarily gain financially, as the cost of
recouping costs from families who simply cannot afford payments often offsets any financial gain.
Money Advice Trust research in 2015 found 'no correlation between higher bailiff use and higher
collection rates for council tax arrears...the heaviest users of bailiffs for council tax collection had less
success, on average, in collecting arrears from previous years.'
Good practice case study: Haringey’s reinstatement of Council Tax Support for low‐income
households, August 2018 – taken from Z2K blog https://www.z2k.org/Blog/haringey‐reinstates‐
support‐for‐low‐income‐households
In CPAG and Z2K’s research, Haringey had previously consistently been flagged as having a
particularly bad Council Tax Reduction Scheme. While disabled people are exempt, other
working‐age households are required to pay a 19.8% Minimum Payment – equal to around
£250 a year for a low‐income family
In 2015/16, over 6,000 CTRS claimants were in arrears and the authority served a court
summons on nearly 5,000 of those. It then instructed bailiffs against 949 of those claimants.
It refused to tell CPAG and Z2K how many residents were affected in 2016/17 or 2017/18.
However, as of August 2018, Haringey council have formally proposed reinstating 100%
support for the poorest residents
In the report seeking authorisation for the change, the cabinet states: ‘As councillors it is our
duty not just to take account of the realities we as a council face but also the situation our
residents find themselves in, offering support where we can and taking account of the social
impact of all we do.’
24Council tax and costs, 2016/17
Minimum Payment ‐ Summons issued Charged costs Bailiffs
council tax 2016/2017 2016/2017 2016/2017 2016/2017
Barking and Dagenham 25% Not held Not held Not held
Barnet 20% 3,170 2,626 756
Bexley 20% 4,059 1,958 2,660
Brent 20% 5,083 3,956 0
Bromley 25% 3,765 3,765 2,125
Camden None 2,841 2,257 51
Croydon 15% 3,837 3,452 1,588
Ealing 25% 4,078 4,076 591
Enfield 27% 6,477 6,477 3,736
Greenwich 15% 6,272 6,272 1,118
Hackney 15% 5,206 5,206 870
Hammersmith & Fulham None Not Held Not Held Not Held
19.8%‐ proposal of zero
Haringey Not Held Not Held Not Held
from April 2019
Harrow 30% Refused Refused Refused
Havering 15% Refused Refused Refused
Hillingdon 25% 2,579 2,579 269
Hounslow 8.5% 2,356 2,356 1,264
Islington 8.5% 8,620 0 0
Kensington & Chelsea None 618 563 230
Kingston upon Thames None 1,426 793 21
Lambeth 15.86% 5,607 5,555 385
Lewisham 14.84% 5,126 3,892 Not held
Merton None Refused Refused Refused
Newham 20% 4,874 4,407 1,452
Redbridge 15% 3,362 2,971 417
Richmond upon Thames 15% 739 722 101
Southwark 15% 3,047 3,047 0
Sutton £3.75 1,421 1,421 475
Tower Hamlets None Not held Not held Not held
Waltham Forest 24% 6,575 2,562 495
Wandsworth 30% 816 816 256
Westminster None Not held Not held Not held
London‐wide averages 89,390 67,973 18,864
Source: FOI requests from CPAG and Z2K, Still too poor to pay: update 2017
252016/17 spending on Hardship Funds, where still in use by Local Authority
Z2K and CPAG’s council tax support 2017 update also noted that just 9 out of London’s 32 boroughs
still had a hardship fund, as a further safety net support, for residents unable to pay council tax.
Budget Expenditure Applications Successful applicants
Bexley £18,000 £15,663 Not Held 61
Bromley £100,000 £22,217 Not Held 99
Ealing £150,000 £312,661 1,321 438
Enfield £300,000 £177,275 808 677
Hackney Unknown £2,965 70 39
Islington £25,000 £7,243 77 77
Redbridge £125,000 £70,047 1,535 288
Sutton £25,000 £9,659 86 52
Waltham Forest Unknown £110,800 Not Held 424
CPAG and Z2K, Still too poor to pay: update 2017
CPAG and Z2K’s FOI based research has demonstrated that over the past four years since the
abolition of council tax benefit: 408,344 summonses for non‐payment of Council Tax have been
issued to council tax support claimants, 317,052 claimants have been charged £34.7 million in court
costs, and 67,712 claimants have had their debts referred to bailiffs for enforcement.xix
As can be seen from the figures above, a number of councils have retained or introduced 100%
support for the poorest claimants, including Westminster, Tower Hamlets, and Kingston upon
Thames, and others, including Haringey, have planned to introduce 100% support in the near future.
In contrast, only Brent, Islington and Southwark do not use bailiffs on principle. Others who have
previously not used bailiffs have reversed their position: Hounslow and Lambeth. Councils including
Enfield and Greenwich all referred more claimants to bailiffs in 2016/17 than the year before.
It is significant to note the number of councils that were unable to provide data on the impact of their
schemes, suggesting an increasing number of local authorities are failing to monitor the impact of
their schemes on residents, as noted in CPAG and Z2K’s research. NB: these facts and figures relate to
2016/17 – an update from CPAG and Z2K is due in Autumn 2018.
Practical recommendations:
Commit to ending bailiff use on principle and adopt collection practices that seek to maximise
collection in a sustainable way, engaging with debtors and understanding difficulties faced
Reinstate / keep 100 per cent support for the poorest residents
Introduce or broaden exemptions, to include the most vulnerable families
Reduce or keep minimum payments under 10 per cent – or abolish altogether
Where necessary, adopt early intervention in debt collection, and design affordable and
sustainable repayment schedules. Identify vulnerable families, and follow good practice
guidelines around mental health
See:
CPAG and Z2K, Still Too Poor to Pay: Three Years of Localised Council Tax Support in London (2016), Update on
council tax support (2017) – and forthcoming Autumn 2018 update
Money Advice Trust, Stop the Knock: Local Authorities and Enforcement Action (2015)
26Early years and childcare
Childcare is expensive (particularly in London): costs are rising and are often prohibitive of parents
entering or returning to work, especially mothers. According to a GLA Economics paper from 2018,
the cost of childcare in London persistently higher and is rising faster in London than nationally.xx
Mainstream childcare is largely accommodating of ‘ordinary’ working hours – causing problems for
parents working weekends or evenings.
According to the London Child Poverty Alliance 2018 manifesto, less than half of local authorities in
London have enough childcare, and childcare providers are concerned that funding rates for free
childcare for three and four year olds could cause shortages to get worse. Local authorities have a
responsibility under the Childcare Act 2006 to ensure there is sufficient childcare for every family that
needs it. Yet, London’s childcare sufficiency is poor compared to the rest of the country.xxi Even where
childcare is available, families may struggle to afford London’s high costs. There is a particular
shortage of childcare for older children.
Unfortunately, there isn’t a great deal of borough‐level data on the provision, quality, sufficiency,
flexibility or affordability of childcare – which highlights the need for information to be collected
locally.
Government free childcare entitlements often don’t target those that need help the most. For
example, the additional 15 hours for 3 and 4 year olds goes only to those in paid work, thus many of
the children who would most benefit from its child development advantages will not qualify – and
there are problems around take up of the free childcare offer for disadvantaged 2 year olds, as
evidenced in the data below.
On a pan‐London level, we can highlight the following:xxii
Uptake of the free early education entitlement in London has risen by 12 percentage points
since 2015
The uptake of 2‐year‐old free early education entitlement across London (58%) is much lower
than the uptake across the rest of England (71%), indicating how much work there is to do to
incentivise uptake
There is a gap of 51 percentage points between the local authorities with the highest and
lowest uptake.
There is a considerable difference in the proportion of children eligible for the free
entitlement in different local authorities – it varies between 12 per cent and 55 per cent
In general, local authorities with a lower proportion of eligible children have a higher uptake
rate
The table below provides breakdowns of take up of the 2 year old childcare offer amongst those who
are entitled to it. NB: there is also a significant gap in childcare provision for school‐age children – see
next section for more information.
Good practice example: Bromley council (taken from the LCPA 2018 manifesto)
In order to make or renew a funding agreement with the council, Bromley Council requested all early
years settings submit their admission policies to ensure they had all stated a fair free and free only
offer that was inclusive and accessible for low‐income families.
27Early years and support in London
Total number of
Uptake of 2‐year‐old Average child element
families receiving
free early education tax credit award (£) –
childcare element in tax
entitlement, Jan 2017 per week
credits
Barking and Dagenham 77% 1,700 £81.10
Barnet 46% 1,700 £77.97
Bexley 64% 1,300 £73.11
Brent 59% 1,900 £82.06
Bromley 62% 1,400 £62.56
Camden 59% 700 £68.01
Croydon 66% 3,000 £74.05
Ealing 59% 1,400 £73.47
Enfield 54% 2,300 £75.52
Greenwich 52% 1,800 £83.59
Hackney 61% 2,500 £103.88
Hammersmith and Fulham 66% 700 £71.72
Haringey 49% 1,700 £85.46
Harrow 55% 800 £67.79
Havering 60% 1,300 £64.03
Hillingdon 45% 1,300 £75.21
Hounslow 72% 900 £67.17
Islington 68% 1,100 £64.44
Kensington and Chelsea 62% 300 £68.11
Kingston upon Thames 79% 500 £60.96
Lambeth 59% 2,500 £75.90
Lewisham 60% 2,700 £80.50
Merton 55% 900 £71.58
Newham 43% 1,900 £84.76
Redbridge 52% 1,100 £75.67
Richmond upon Thames 90% 500 £61.72
Southwark 71% 2,200 £82.25
Sutton 76% 900 £60.93
Tower Hamlets 39% 700 £73.25
Waltham Forest 53% 1,800 £69.85
Wandsworth 45% 1,200 £73.82
Westminster 64% 500 £71.38
London avg ‐ 58%
London‐wide averages London average ‐ 1442
England avg – 71%
Source: Mayor of London, Early Years in London: Baseline and Consultation (March 2018) and HMRC Personal
tax credits: finalised award statistics ‐ geographical statistics 2016 to 2017 (published June 2018)
28Practical recommendations:
Expand hours during which free childcare is provided to 3 and 4 year olds to include
‘atypical’ working hours
Provide bespoke support to parents looking to access employment, offering advice on
training, volunteering, childcare and financial options, and negotiating working hours
Review current childcare support and, where possible, prioritise childcare support for
parents wishing to undertake an employment‐focused course
Prioritise extending the provision of before‐ and after‐school childcare at an affordable rate
(e.g. £1 an hour) to working parents whose children attend local schools (see
recommendations under ‘Education, Schools and Life Chances’ below)
Include childcare in local industrial or economic strategies in order to make sure there is
enough childcare available, including planning for flexible childcare to meet the needs of the
local workforce
Ensure there is enough affordable childcare for low income families.
Consider innovations to help families with short‐term childcare needs (e.g. to attend job
interviews) or with variable needs (e.g. working variable hours), such as maintaining a
register of childminders willing to work at short notice or outside standard hours, as
Newham council have done
See:
London Child Poverty Alliance, Doing better for London's Families (2018)
IPPR, The Future of Childcare in London (2017)
Family and Childcare Trust, Annual Childcare Survey (2018)
CPAG, Cost of a Child (2018)
29Education, schools and life chances
Unfortunately, poverty can have a noticeable impact on a child’s development at as early as 22
months old. A good education alone will not iron out the differences between children who live in
poverty and those who do not. However, a good education is important, and intervention by schools
and other partners can improve the lives of low income families and their children.
Kitty Stewart, Associate Professor of Social Policy at LSE, puts it best in her essay in CPAG’s Improving
Children's Life Chances (2016):
'Poverty at home has been recognised for many years as being the strongest statistical
predictor of how well a child will achieve at school... schools can and do still make some
difference, however…
Although children's home lives are probably the greatest influence on their educational
attainment, schools can do a great deal to ensure that children are not held back by poverty'.
Here we highlight two school‐based interventions that can make a difference. The first, the provision
of so‐called 'extended' schools, can ensure schools assist with parental employment and childcare
challenges that the local community is facing as well as directly raising the attainment of
disadvantaged children. The second relates to practical steps schools can take internally to assist their
students on a low‐income to take full advantage of the educational opportunities in front of them.
The table below provides some relevant indicators for child poverty in the context of schools and
education, covering the number of families receiving the childcare element in tax credits and their
average award, pupils known to be eligible for Free School Meals (FSMs ‐ a useful indicator of
deprivation) and a comparison of average ‘8 score’ attainment (which have replaced GCSEs) between
pupils eligible for FSMs and those not.
30You can also read