Socioeconomic status as a proxy for input quality in bilingual children?
←
→
Page content transcription
If your browser does not render page correctly, please read the page content below

Applied Psycholinguistics (2021), 42, 301–324
        doi:10.1017/S014271642000079X

        ORIGINAL ARTICLE

        Socioeconomic status as a proxy for input
        quality in bilingual children?
        Cécile De Cat
        University of Leeds
        Corresponding author. E-mail: C.DeCat@leeds.ac.uk

        (Received 13 February 2020; revised 01 October 2020; accepted 03 October 2020; first published online 25
        January 2021)

           Abstract
           This study investigates the effect of socioeconomic status (SES) as a proxy for input quality, in
           predicting language proficiency. Different operationalizations of SES are compared, includ-
           ing simple measures (parental education and parental occupation) and complex measures
           combining two dimensions (among parental education, parental occupation, and depriva-
           tion risk). All significantly predict overall English proficiency scores in a diverse group of
           5- to 7-year-olds acquiring English and another language. The most informative SES measure
           in that respect is shown to be a complex measure combining parental education and parental
           occupation. That measure is used in a second set of analyses showing that different aspects of
           language are affected differently by variations in SES and in language exposure.

        Keywords: bilingualism; individual differences; language exposure; socioeconomic status; timing of
        acquisition

        It has become uncontroversial that bilingual children’s proficiency in each language
        is influenced by the amount of exposure they experience in each language (Paradis,
        2017; Unsworth, 2017). A growing body of research is now turning to the impact of
        qualitative aspects of language exposure (see, e.g., the double Special Issue dedicated
        to this topic by the Journal of Child Language; Blom & Soderstrom, 2020).
            Qualitative aspects of the language environment can manifest themselves along
        several dimensions. Language “richness” has been taken to encompass structural
        complexity, lexical diversity, and the use of different registers (e.g., during literacy
        activities; see, e.g., Hart & Risley, 1995; Hoff, 2006; Paradis, 2011a; Rowe, 2008;
        Scheele, Leseman, & Mayo, 2010). Another dimension is the diversity of the lan-
        guage experience, indexed by the diversity of contexts of language interaction, or
        the number of conversation partners in each language (Place & Hoff, 2011).1
        Non-native input can be a factor too, depending on the proficiency level of the inter-
        locutors (Hoff, Core, & Shanks, 2020; Paradis, 2011b; Unsworth, Brouwer, de Bree,
        & Verhagen, 2019) and on the type of interlocutor (e.g., second language input from
        older siblings has been shown to correlate with better language outcome measures in
        © The Author(s), 2021. Published by Cambridge University Press. This is an Open Access article, distributed under the
        terms of the Creative Commons Attribution licence (http://creativecommons.org/licenses/by/4.0/), which permits unre-
        stricted re-use, distribution, and reproduction in any medium, provided the original work is properly cited.

Downloaded from https://www.cambridge.org/core. 16 Jul 2021 at 00:15:25, subject to the Cambridge Core terms of use.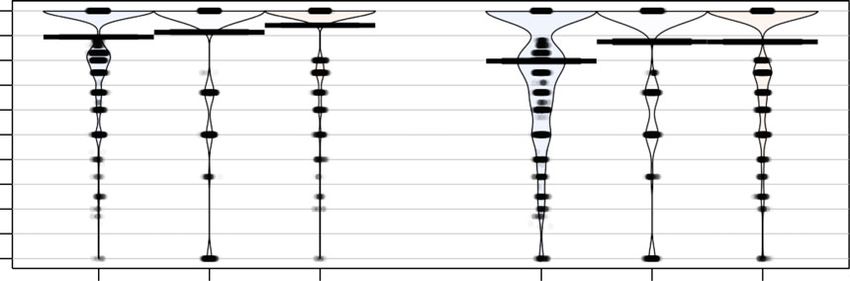
302        De Cat: Socioeconomic status as a proxy for input quality

          bilingual children; Sorenson-Duncan & Paradis, 2020). In sum, optimal input is
          likely to result from sufficient time spent with the relevant interlocutors and suffi-
          cient density, diversity and complexity of the actual language used during that time.2
              In this paper, I adopt a broad definition of input quality, taking into account any
          aspect of the linguistic environment that goes beyond input quantity as it is tradi-
          tionally operationalized (i.e., as “time spent with interlocutors X, Y, Z,” which in fact
          only measures the opportunity for language interaction with those interlocutors,
          whether it is realized or not). Under this broad definition, input quality can include
          quantitative aspects of language exposure, such as the actual amount of linguistic
          interaction (e.g., caregivers’ verbal responsiveness; Hoff, 2006), density of language
          use (e.g., lexical or clausal density; Huttenlocher, Haight, Bryk, Seltzer, & Lyons,
          1991), and other distributional properties of the input.
              Socioeconomic status (SES) is often used as a proxy for the quality of language
          exposure. In the language acquisition literature, SES has been operationalized as
          parental education (most often maternal education), household affluence (estimated
          from parental occupation, entitlement to free school meals, or estimated from postc-
          odes), or indices of deprivation. Most studies use a single measure of SES, but com-
          bined measures have been argued to be more informative, as they capture several
          aspects of the child’s environment (Gatt, Baldacchino, & Dodd, 2020). Low SES has
          a robust impact on cognitive development and language outcomes. In their review,
          Perkins, Finegood, and Swain (2013) highlight two potentially explanatory dimen-
          sions, stemming from the well-documented association between low SES and (a)
          high chronic stress (which impacts the cognitive control system underpinning lan-
          guage development) as well as (b) lower quality of the home environment in terms
          of literacy practices, parental language, and parenting styles (all of which have an
          impact on children’s language development).
              In bilingual children, the presumed association between SES and language “rich-
          ness” is likely to be mediated by parental education. The language in which parents
          have obtained a higher education diploma does itself correlate with their child’s
          development in that language (Hoff, Burridge, Ribot, & Giguere, 2017). High
          SES might also confer an indirect advantage through better quality of the child’s
          environment (e.g., better nutrition and medical care, reduced exposure to toxins
          and noise; Meir & Armon-Lotem, 2017; Perkins et al., 2013). It could also be asso-
          ciated with differences in social practices and attitudes toward education (Scheele
          et al., 2010) or degree of assimilation in the “majority” culture (which can lead to
          more opportunities for literacy and language-rich activities in the “majority” lan-
          guage; Pearson, 2007).
              SES has been shown to correlate with bilingual children’s vocabulary size (Gatt
          et al., 2020; Gathercole, Kennedy, & Môn Thomas, 2016; Hoff, 2006), morphosyntax
          (Chiat & Polišenská, 2016; Meir & Armon-Lotem, 2017), and receptive grammar
          skills (Gathercole et al., 2016). The impact of SES is, however, varied. Using a com-
          posite measure of parental education and parental occupation, Gathercole et al.
          (2016) found differences across age groups: in the younger participants (preschool),
          the receptive language scores were more strongly correlated with quantitative
          aspects of language exposure, while in older participants (teens and older), SES
          had a stronger impact. Unsworth et al. (2019) also observed a differential impact
          of SES within preschoolers, depending on the aspect of language considered:

Downloaded from https://www.cambridge.org/core. 16 Jul 2021 at 00:15:25, subject to the Cambridge Core terms of use.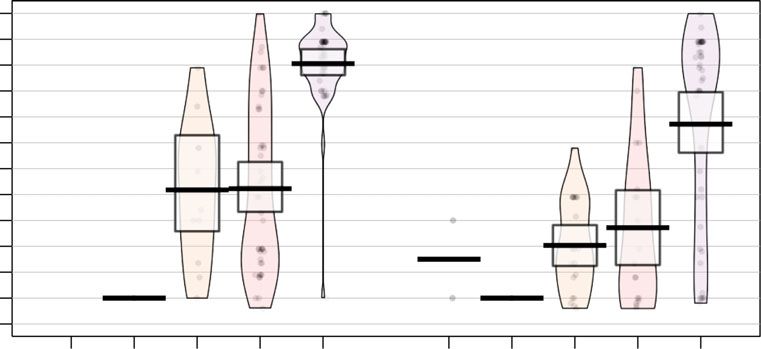
Applied Psycholinguistics             303

        maternal education predicted receptive vocabulary scores but not morphosyntax,
        semantic fluency, or sentence repetition. Another type of differential impact of
        SES was observed by De Cat (2020). Here, the relationship between parental occu-
        pation and proficiency in the language of schooling was modulated by the amount
        of cumulative exposure to that language in 5- to 7-year-olds: the more cumulative
        exposure to the school language, the stronger the correlation between SES and
        sentence repetition score.
            From this body of research, it appears SES interacts in complex ways with quan-
        titative aspects of language exposure and with different aspects of language compe-
        tence. Is it possible to predict which aspect(s) of language competence might be
        affected by SES-related properties of the child’s language environment? This will
        depend on whether certain aspects of language are more sensitive to input. For
        instance, Tsimpli (2014) argues that aspects of language that involve grammar-
        external components (such as pragmatics, lexical knowledge, or working memory)
        develop beyond the age of 5 in monolinguals, and are sensitive to input effects in
        bilinguals. By contrast, language-internal phenomena (defined in terms of syntax
        and semantics) are generally acquired by monolinguals before the age of 5, and sen-
        sitive to age of onset effects in bilinguals (rather than input effects). Although
        Tsimpli defines input effects in terms of quantity of exposure, it is reasonable to
        assume that qualitative aspects will also have an impact.
            How “input effects” are defined might itself have an impact, however. Is it fre-
        quency of current exposure, or cumulative exposure? In bilingual children, cumu-
        lative exposure to a language depends both on age of onset and on frequency of
        exposure. In their study of gender marking in Greek versus in Dutch by 5- to
        10-year-old bilinguals (whose other language is English), Unsworth et al. (2014)
        demonstrated that age of onset was not sufficient to account for the different pat-
        terns of acquisition of Greek versus Dutch gender: the effect of age of onset was
        modulated by the cumulative quantity of exposure. By extension, simultaneous
        bilinguals might not turn out more proficient than successive bilinguals in language
        X if the amount of exposure to that language has been low. Unless one of the two
        dimensions is controlled (i.e., operationalized as a group-level factor with minimal
        variation within group), it is impossible to measure the effect of input versus age of
        onset separately.
            The aim of this study is to probe the role of SES as a hypothetical proxy for input
        quality in bilingual children, and to explore its interplay with input quantity (oper-
        ationalized as cumulative exposure, as justified above). I will focus on 5- to 7-year
        old children with English as an additional language who are in monolingual English
        education in the United Kingdom, and who vary in terms of age of onset of English
        exposure, amount of English exposure, as well as SES.
            The paper is articulated around two sets of questions:

            1. What is the relationship between SES and quantity of exposure, as predictors
               of proficiency in the school language? Does it vary depending on how SES is
               operationalized?
            2. Does the effect of language exposure and SES vary across different aspects of
               language proficiency? Is the effect of SES only detectable where language
               exposure has a significant impact?

Downloaded from https://www.cambridge.org/core. 16 Jul 2021 at 00:15:25, subject to the Cambridge Core terms of use.
304 De Cat: Socioeconomic status as a proxy for input quality
The first set of questions will be investigated in three stages. First, the relationship
between different operationalizations of SES will be explored, comparing bilinguals
and monolinguals recruited from the same schools. This will allow us to identify
associations and potential sociocultural confounds, and thereby inform the inter-
pretation of any differences across SES operationalizations as predictors of language
proficiency (later in the paper). Second, I will test the robustness of the non-linear
interaction between SES and cumulative language exposure (which had been
observed in the same children using sentence repetition as outcome measure,
and parental occupation as the SES measure): is this result replicated with different
SES measures, using global proficiency as outcome variable? The alternative SES
measures will be derived through different combinations of parental education,
parental occupation, and indices of deprivation. Third, I will compare the informa-
tivity of alternative SES measures (as predictors of school language proficiency), to
determine what the optimal measure is for the present data set, that is, in case of
high diversity.
The second set of questions will be explored through an item analysis of sentence
repetition data. The respective impact of SES and cumulative language exposure will
be probed across syntactic structures and across error types (i.e., lexical, inflectional
or functional).3 I will leave the robust evaluation of Tsimpli’s hypothesis for future
research.
Based on the literature reviewed above, the hypotheses are as follows:
1. If SES indexes input quality, parental education should be a significant dimen-
sion of SES as a predictor of the child’s language proficiency.
a. Parental education alone might be the most informative predictor.
b. An SES measure that gives a stronger weight to parental education should
be a more informative predictor than other measures.
2. The influence of input quality will be necessarily modulated by input quantity.
SES is expected to have an impact only on those aspects of language profi-
ciency that are affected by cumulative language exposure in the age group
under consideration.
Method
This study is based on the secondary analysis of data which were collected as part of
an investigation of the relationship between executive function skills (cognitive flex-
ibility, inhibitory control, and working memory) and language experience in young
bilingual children with unbalanced exposure to two languages, probing these child-
ren’s ability to make referential choices appropriate to their listener’s information
needs (see Serratrice & De Cat, 2020). In this section, I describe the population sam-
ple and the measures from the original study that are relevant for the present
purpose.
Downloaded from https://www.cambridge.org/core. 16 Jul 2021 at 00:15:25, subject to the Cambridge Core terms of use.Applied Psycholinguistics 305
Table 1. Participant distribution in gender and age (in months)
Gender Min. Max. Mean SD
Bilinguals F (n = 44) 5;1 6;9 5;10 0;5
(n = 87) M (n = 43) 5;1 7;0 5;10 0;6
Monolinguals F (n = 52) 5;0 7;0 6;0 0;7
(n = 87) M (n = 35) 5;0 7;0 6;0 0;7
Participants
Ethical approval was obtained from the University of Leeds (Ref. PVAR 12-007) and
parental consent was obtained prior to data collection. One hundred and seventy
four children between the ages of 5 and 7 participated in the study. The school lan-
guage was exclusively English for all the children. Half of the children (N = 87) were
also exposed to an additional language at home in varying degrees. There was a total
of 28 home languages in our sample: Arabic (9%), Bengali, Cantonese, Catalan,
Dutch, Farsi, French (8%), Greek, Hindi, Italian, Kurdish, Mandarin, Marathi,
Mirpuri, Nepalese, Pashto, Polish, Portuguese, Punjabi (21%), Shona, Somali,
Spanish (6%), Swedish, Tamil, Telugu, Thai, Tigrinya, and Urdu (17%).4
Bilingual and monolingual children were recruited from the same schools (in the
North of England) for maximum comparability. None of the children were
excluded.
Table 1 summarizes the distribution of the two groups in gender and age. For
ease of presentation, children with any amount of exposure to a language other than
English are referred to as “bilinguals”; children who had no exposure to a language
other than English are referred to as “monolinguals”. All children were reported by
the school to be developing typically and did not have any known hearing deficits.
Environmental variables
Estimates of the amount of exposure to English were calculated on the basis of infor-
mation gathered via parental questionnaires (through a simplified version of the
BiLEC; Unsworth, 2013). Current exposure to English was calculated as a propor-
tion of their total interaction time (assumed to equate to waking hours). The total
number of hours of interaction with each interlocutor was multiplied by the pro-
portion of the time English was used with that interlocutor. These proportions
across interlocutors were added up, and the sum was divided by the total number
of hours of potential interaction time. Cumulative exposure to English was esti-
mated as the number of months since onset of exposure to English, multiplied
by the proportion of current exposure to English. Cumulative exposure to
English therefore equates to the total number of months-equivalent of full-time
English exposure. We also collected self-reported estimates of parental proficiency
in English (on a 5-point Likert scale).
The SES of the children’s families was estimated on the basis of information gath-
ered via a parental questionnaire. Three types of measures were collected.
Downloaded from https://www.cambridge.org/core. 16 Jul 2021 at 00:15:25, subject to the Cambridge Core terms of use.306 De Cat: Socioeconomic status as a proxy for input quality
(a) Parental occupation data was scored using the reduced method of the
National Statistics Socioeconomic Classification of professional occupation (NS-
SEC). The score obtained ranged from 2 (for the highest SES) to 13 in our data
set. We reversed it for ease of interpretability (so that a higher score reflected a more
privileged background). The distribution will be shown in Figure 3 later in the
paper. (b) Parental education was documented on a 5-point scale (1 = no education,
2 = primary school, 3 = secondary school, 4 = further education, and 5 = university).
(c) The index of deprivation risk was based on 5 indicators:
(1) a. Child entitlement to free school meals (1 if yes)
b. Housing precarity (0 if own the home; 1 otherwise)
c. Current unemployment (0 if currently employed, even part-time)
d. History of unemployment (1 if has never worked; 0 otherwise)
e. Low levels of education (1 if not beyond secondary school)
If there were two parents in the household, the score was calculated for each par-
ent, and the lowest risk among the two was retained. In our population sample, very
few families had a low-SES risk of 4 (n = 4) or 5 (n = 2), so we collapsed them into
Risk Level 3 (n = 11).
English proficiency tests
Several measures of English language proficiency were collected to assess different
aspects of language competence. The tests included (a) the LITMUS sentence repe-
tition task5 to probe morpho-syntax, (b) four lexical–semantic tests of the
Diagnostic Evaluation of Language Variation: the verb and preposition contrasts,
real verb mapping, novel verb mapping (Seymour, Roeper, & de Villiers, 2005),
and (c) a discourse–semantic test: the Diagnostic Evaluation of Language
Variation articles task. The distribution of proficiency scores is shown for each test
in Figure 1. The results of the monolingual children are included for reference.
A composite measure of English proficiency was derived through a principal
component analysis (PCA) of the three proficiency scores (sentence repetition, lex-
ical semantics, and discourse semantics). PCA is a standard method of dimension-
ality reduction, which allows the three proficiency scores to be mapped linearly into
a lower dimension space that maximizes the variance in the data. In the bilingual
children, the three proficiency scores were strongly correlated (as shown in
Figure 2), indicating good potential for reduction to a single dimension.6
Cognitive variables
Two cognitive measures were included as control variables, in an attempt to account
for the cognitive demands of the proficiency tasks. The Forward Digit Span measure
was used as a proxy for children’s short-term memory capacity (Wechsler
Intelligence Scale for Children III; Wechsler, 1991). Cognitive flexibility was indexed
by performance in the Dimensional Change Card Sort task, which was administered
and scored following the protocol described in Zelazo (2006).
Downloaded from https://www.cambridge.org/core. 16 Jul 2021 at 00:15:25, subject to the Cambridge Core terms of use.Applied Psycholinguistics 307
Sentence repetition Lexical semantics Discourse semantics
1 1 1
0.9 0.9 0.9
0.8 0.8 0.8
0.7 0.7 0.7
Mean scores (%)
Mean scores (%)
Mean scores (%)
0.6 0.6 0.6
0.5 0.5 0.5
0.4 0.4 0.4
0.3 0.3 0.3
0.2 0.2 0.2
0.1 0.1 0.1
0 0 0
Monolingual Bilingual Monolingual Bilingual Monolingual Bilingual
Group Group Group
Figure 1 (color online). Pirate plots for individual mean scores across proficiency tests: the Sentence
Repetition (left), the four Lexical Semantics tests (middle), and the Discourse Semantics test (right).
Each plot shows group mean (thick line), confidence intervals (lighter area around the mean), and
10% and 90% quantiles (whiskers).
Lex.Sem Disc.Sem
1
SRep *** ***
0
Lex.Sem ***
−1
Figure 2 (color online). Correlation matrix for the three measures of English proficiency (in bilingual chil-
dren): sentence repetition (SRep), lexical semantics (Lex. Sem), and discourse semantics (Disc. Sem). The
colors and pie charts indicate the direction and strength of the correlation. Significance is indicated by
stars in the pie charts (*** in all three cases).
Which aspects of SES best predict school language proficiency
I now turn to the first set of research questions, starting with a comparison of dif-
ferent SES operationalizations.
Operationalizations of SES
SES can be operationalized in different ways, either as a simple or a composite mea-
sure. From the three simple measures listed above, composite measures were
derived to encompass two dimensions at once.
Downloaded from https://www.cambridge.org/core. 16 Jul 2021 at 00:15:25, subject to the Cambridge Core terms of use.308 De Cat: Socioeconomic status as a proxy for input quality
−2
−3
−4
−5
Parental occupation
−6
−7
−8
−9
−10
−11
−12
−13
−14
Parental.education 0 1 2 3 4 0 1 2 3 4
Group Monolingual Bilingual
Figure 3 (color online). Pirate plots showing parental education and parental occupation in monolingual
versus bilingual households. Education levels: 0 = no education, 1 = primary school, 2 = secondary school,
3 = further education, and 4 = university degree. Occupation is expressed as reversed NS-SEC scores (with
–2 as the highest occupation in this population sample).
Comparison between monolingual and bilingual children from the same schools
reveals some interesting patterns of interaction between SES measures (both simple
and complex). Within the bilingual group, we will see that SES is also associated
with sociocultural characteristics.
Simple measures
Figure 3 shows the distribution of our population sample according to two simple
SES measures: parental occupation and parental education. A notable difference
between bilinguals and monolinguals in this data set is that, while parental educa-
tion and parental occupation are strongly correlated in both groups (linear regres-
sion: β = 3.14, p < .0001), higher levels of education tend to be less predictive
occupation level in the bilingual households (β = –1.06, p = .045). Among those
without higher education, higher occupation levels appear more accessible to
parents from monolingual households than those from bilingual households. SES
was also significantly higher in monolinguals than bilinguals at group level (occu-
pation: t = 3.56, p = .0005; education: t = 3.52, p = .0006), in spite of having
recruited children from the same schools.
Composite SES measures
Composite measures of SES were derived by combining two simple measures. The
aim was to obtain measures with no more than eight levels, to maximize the chance
of a sufficiently even distribution of children across categories, while allowing
(hopefully) sufficient granularity to test for a nonlinear interaction with English
exposure.
The first composite measure combines parental occupation with parental educa-
tion. Occupation was operationalized by reducing the NS-SEC score to a four-level
variable as shown in (2).
Downloaded from https://www.cambridge.org/core. 16 Jul 2021 at 00:15:25, subject to the Cambridge Core terms of use.Applied Psycholinguistics 309
Table 2. Order of the two alternative measures of SES combining parental education and occupation
Order Education × Occupation Occupation × Education
1 Occ.0 Ed.1 Occ.0 Ed.1
2 Occ.1 Ed.1 Occ.0 Ed.2
3 Occ.2 Ed.1 Occ.1 Ed.1
4 Occ.0 Ed.2 Occ.1 Ed.2
5 Occ.1 Ed.2 Occ.2 Ed.1
6 Occ.2 Ed.2 Occ.2 Ed.2
7 Occ.3 Ed.2 Occ.3 Ed.2
(2) a. No occupation
b. NS-SEC score between –9 and –14: elementary trades and services,
skilled trades, sales, and so on.
c. NS-SEC score between –4 and –9: noncorporate managers, health and
science- associated professionals, and so on.
d. NS-SEC score between –4 and –1: corporate directors, health and
science professionals, and so on.
The two variables were crossed into an ordered factor nesting education into
occupation, yielding the levels listed in Table 2 by ascending SES level. Parental edu-
cation was simplified into a binary factor (higher education vs. no higher educa-
tion). In this population sample, there were no families with low education and
an NS-SEC score between –4 and –1, so that level was removed. The resulting levels
are listed in column Education × Occupation in the table. As an alternative, the two
variables were also crossed into an ordered factor nesting occupation into education,
yielding the levels listed in column Occupation × Education.
The second set of composite measures of SES combined the index of deprivation
risk and parental occupation. The deprivation risk index was crossed with a binary
indicator of the level of occupation (with a threshold of 6 on the NS-SEC scale,
which corresponds to occupations characterized by semiroutine or routine opera-
tions, without a significant technical or supervisory component).
The crossing of these two factors resulted in 8 categories (risk 0 to 3 in “higher”
vs. “lower” professions). Two categories were not represented in our population
sample: those corresponding to higher employment with low-SES risk score of 2
or 3. These were therefore removed from the levels of the composite variable.
An alternative measure was obtained by nesting the risk index within occupation.
The different resulting order of levels is shown in Table 3.
Figure 4 shows the distribution of our population sample according to two of the
composite SES measures. It reveals a greater proportion of monolinguals in the
high-SES groups, consistent from the fourth SES level upward in the left-hand figure
(where SES is operationalized as Occupation × Education). The disparity is less dis-
tributed across SES levels in the Risk × Occupation operationalization, which gives
much less weight to education. Consistent with the pattern detected from the simple
Downloaded from https://www.cambridge.org/core. 16 Jul 2021 at 00:15:25, subject to the Cambridge Core terms of use.310 De Cat: Socioeconomic status as a proxy for input quality
Table 3. Order of the two alternative measures of SES combining parental occupation
and deprivation risk
Order Risk × Occupation Occupation × Risk
1 Risk.3 Occ.low Risk.3 Occ.low
2 Risk.2 Occ.low Risk.2 Occ.low
3 Risk.1 Occ.low Risk.1 Occ.low
4 Risk.0 Occ.low Risk 1 Occ.high
5 Risk.1 Occ.high Risk.0 Occ.low
6 Risk.0 Occ.high Risk.0 Occ.high
80 80
60 60
Group
count
count
40 40 Monolingual
Bilingual
20 20
0 0
O0E1 O0E2 O1E1 O1E2 O2E1 O2E2 O3E2 3.Low 2.Low 1.Low 0.Low 1.High 0.High
SES: occupation x education SES: deprivation x occupation
Figure 4 (color online). Distribution of monolingual versus bilingual children according to two composite
SES measures: Occupation × Education (left) and Deprivation Risk × Occupation (right).
measures in Figure 3, education seems to be a less robust predictor of professional
occupation in parents from multilingual households.
Furthermore, the family’s SES was significantly higher if one of the parents was a
native speaker of English (ordinal regression: β = 1.5, p = .001). There was also a
modest but significant association between SES (operationalized as Occupation ×
Education) and self-reported maternal proficiency in English (Spearman’s rank cor-
relation ρ = 0.25, p = .02). However, there was also a significant correlation between
maternal English proficiency and frequency of English use by the mother when
addressing her child (Pearson’s product–moment correlation r = .38, p =
.0003). Children in this population sample were therefore not very likely to have
been exposed to a substantial amount of “poor” English at home. Maternal profi-
ciency in English was never a significant predictor of children’s English proficiency
in this study.7
Another noteworthy association is that between SES and ethnicity (Figure 5),
which was significant whether ethnicity was operationalized as home language
Downloaded from https://www.cambridge.org/core. 16 Jul 2021 at 00:15:25, subject to the Cambridge Core terms of use.Applied Psycholinguistics 311
1.0
O0E1
O0E2
0.8
SES: Occupation x Education
O1E1
0.6
O1E2
0.4
O2E1
O2E2
0.2
O3E2
0.0
African Asian European
Ethnicity
Figure 5. Association between ethnic categories and SES (Occupation × Education) in the bilingual
families. The width of the bars represents the proportion of each group in the sample.
(Pearson’s chi- squared test with simulated p value [based on 2,000 replicates]
= 272.71, p = .002) or as ethnic category8 (Pearson’s chi-squared test with simulated
p value [based on 2,000 replicate] = 37.39, p = .01).
Testing the interaction between cumulative language exposure and SES
The original analysis reported in De Cat (2020) identified a nonlinear interaction
between cumulative English exposure and SES (operationalized as parental occupa-
tion on a fine-grained scale), as predictors of English proficiency (indexed by the
LITMUS sentence repetition test). This was demonstrated through an item-analysis,
using a general additive mixed model (GAMM; Wood, 2006) with the R-package
“mgcv” (version 1.8–28). GAMMs model linear effects (through parametric terms)
as well as nonlinear effects (through smooth terms). The nonlinear interaction is
shown in Figure 6: at low levels of cumulative English exposure, high SES does
not confer an advantage; the higher the cumulative English exposure, the stronger
the SES advantage.
To ascertain the robustness of this original finding, the analysis is reproduced
here on the same group of children, but using a global measure of English profi-
ciency as outcome variable, and (in turn) each of the alternative SES measures
derived for the present population sample. As there is a single proficiency score
for each child, we fitted a GAMM without random effects for participant or item.
All predictors were scaled and treated as numeric. To identify the optimal model, a
bottom-up procedure was adopted: starting from the simplest model including only
Downloaded from https://www.cambridge.org/core. 16 Jul 2021 at 00:15:25, subject to the Cambridge Core terms of use.312 De Cat: Socioeconomic status as a proxy for input quality
Lexical accuracy Functional accuracy
1.0 1.013 0.944
1.0
4
0.8 1
0.922 0.813
SES: Education x Occupation (scaled)
SES: Education x Occupation (scaled)
0.7
0.5
0.5
6 0.9
8
0.8
0.832 0.682
2
0.9
0.7
6 0.94
0.0
0.0
4
0.7
0.92
0.94
−0.5
−0.5
0.76
8 0.8
0.8 8
0.86 0.9
0.92 0.84
0.78
0.9
−1.0
−1.0
0.82
0.8
fitted values, excl. random
fitted values, excl. random
0.9
−1.5
−1.5
8
0. 0.78
0.88
−2.0
−2.0
0.9
2 0.86
0.76
−2.0 −1.5 −1.0 −0.5 0.0 0.5 −2.0 −1.5 −1.0 −0.5 0.0 0.5
Cumulative English Exposure (scaled) Cumulative English Exposure (scaled)
Figure 6. Nonlinear interaction between cumulative English exposure and SES as predictors of bilingual
children’s accuracy in the sentence repetition (SRep) task, estimated through a generalized additive
mixed model. Average SRep performance corresponds to 0 on the color gradient. All measures were
scaled.
gender as a control variable, potential predictors were added one by one, and only
those predictors that significantly enhanced the model fit (assessed through fREML
comparison) were retained.
This method was used to evaluate the effect of cumulative exposure to English,
and of the different operationalizations of SES defined above, as well as age (in
months) and cognitive abilities. The cognitive demands of the other two proficiency
tests used to derive the global measure are greater than those of the sentence repeti-
tion test. In addition to short-term memory and working memory, I therefore tested
for the effect of cognitive flexibility, operationalized as task switching (DCCS score).
As a final step, a nonlinear interaction between SES and cumulative English expo-
sure was included in the model.
Among the cognitive variables, only task switching was found to improve the
model fit. Memory was therefore not included in the final model.9 Age and cumu-
lative English exposure are significantly correlated (Pearson’s product–moment cor-
relation: r = .25, p = .02). The model excluding age had a better fit (fREML
difference: 6) and was therefore preferred.
This first model (summarized in Table 4) confirms that SES, operationalized as a
fine-grained measure of parental occupation, is a significant predictor of a general
measure of English proficiency. Crucially, it also confirms the non-linear interaction
between SE and cumulative English exposure as an additive effect.
Next, models using the same formula were fitted using each of the alternative SES
measures in turn, to ascertain whether these results are robust across the different
operationalizations of SES. Table 5 shows that, across its different operationaliza-
tions, SES has a significant impact on English proficiency, both as a linear term
(except in Models 2 and 3) and in nonlinear interaction with cumulative English
exposure (including in Models 2 and 3).
Which of the alternative SES measures should be preferred? This can be esti-
mated by comparing their informativity in the model of interest.
Downloaded from https://www.cambridge.org/core. 16 Jul 2021 at 00:15:25, subject to the Cambridge Core terms of use.Applied Psycholinguistics 313
Table 4. Summary of the general additive model fitted to the bilingual children’s overall English
proficiency score (derived by PCA)
Parametric coefficients Estimate SE t value p value
(Intercept) 0.0797 0.0408 1.9540 .0542
Cognitive flexibility (DCCS) 0.1142 0.0288 3.9676 .0002
SES: Occupation 0.2061 0.0616 3.3438 .0013
Gender (M) –0.0500 0.0528 –0.9463 .3468
Smooth term edf Ref.df F p value
Cumulative English Exposure × SES 2.0000 2.0000 7.0258 .0015
Note: Parametric terms include cumulative exposure to English (in months-equivalent), SES (as parental occupation), and
cognitive flexibility (task switching score). Gender is included as a control variable. The smooth (nonlinear) term
corresponds to the interaction of cumulative exposure to English and SES.
Table 5. Summary of the impact of SES on English proficiency, across six alternative operationalizations
of SES
SES operationalization Parametric estimate p value Smooth estimate p value
1 Occupation 0.20609 .00125 7.02578 .00151
2 Education 0.00146 .96643 7.37419 .00019
3 Occupation × Education 0.07431 .24580 8.42115 .00046
4 Education × Occupation 0.21129 .00001 11.11665 .00005
5 Occupation × Risk 0.17093 .00017 7.73076 .00083
6 Risk × Occupation 0.30151 .00005 6.53292 .00231
Note: The parametric effect of SES is shown in columns 3–4, and the effect of its nonlinear interaction with cumulative
English exposure is shown in columns 5–6.
Comparing the informativity of SES measures
As expected, the six alternative measures of SES are strongly (and positively) corre-
lated, which implies that there is substantial overlap in the information they each
encapsulate. This is shown in Figure 7.
To assess the informativity of alternative predictors, the information-theoretic
method described in Burnham and Anderson (2003) will be used. The Akaike
weight of a model is based on the Akaike information criterion (AIC), which is
an indicator of the trade-off between the accuracy and the complexity of a given
model (i.e., a measure of the relative goodness of fit of the model to reality).
AIC weights indicate the strength of the evidence in favor of a model in a particular
set of competing models. The model with the highest AIC weight is taken as the one
that best approximates the “true” process underlying the phenomenon under study,
and the other models are evaluated in relation to that optimal model. The evaluation
is based on delta values, which correspond to the difference in AIC between the best
model in the set and a particular competitor model.
Downloaded from https://www.cambridge.org/core. 16 Jul 2021 at 00:15:25, subject to the Cambridge Core terms of use.314 De Cat: Socioeconomic status as a proxy for input quality
Ed Occ.ed Ed.occ Occ.risk Risk.occ
1
Occ
*
Ed
*
Occ.ed 0
Ed.occ
Occ.risk
* −1
Figure 7 (color online). Correlation matrix for the alternative SES measures (based on their numeric var-
iants). The colors and pie charts indicate the strength of the correlation.
This method can be used for variable selection, that is, to determine which predic-
tor variable has the greatest influence, among a set of competitors (Burnham &
Anderson, 2003). This is done by summing the Akaike weights of variables across
all the models where the variables occur. The competing variables are then ranked
using these sums. The larger this sum of weights, the more important the variable is.
As shown in Table 6, the model in which SES is operationalized as Education ×
Occupation has a 70% chance of being the best in the set. We can conclude that the
most informative SES measure, as a predictor of English proficiency, is the one that
gives the greatest weight to parental education.
This confirms the first hypothesis: if SES indexes input quality, parental educa-
tion should be a significant dimension. Hypothesis 1a is however not supported: the
single- component SES measure based on parental education was not the most
informative as a predictor of English proficiency. Hypothesis 1b is supported:
the composite measure assigning the greatest weight to parental education was
the most informative as a predictor of English proficiency.
There was no significant effect of maternal or paternal proficiency in English on
children’s English proficiency scores. This was the case whether SES is taken into
account (β = 0.04, p = .24) or excluded from the model (β = 0.06, p = .13). Given
the significant association between maternal proficiency in English and SES
(Occupation × Education) reported above, the effect of suboptimal English input at
home is likely to be have been captured by the SES measure. However, it seems rea-
sonable to conclude that parental English proficiency only had an indirect effect, if any.
Which aspects of language proficiency are affected by SES?
The second set of questions I will address is (a) whether SES affects different aspects
of bilingual language acquisition differently, and (b) whether the effect of SES is only
detectable where language exposure has a significant impact.
Downloaded from https://www.cambridge.org/core. 16 Jul 2021 at 00:15:25, subject to the Cambridge Core terms of use.Applied Psycholinguistics 315
Table 6. Model statistics for the effect of alternative measures of SES (listed
in column 1) on bilingual children’s language proficiency (global score) fit to
87 observations
Resid. Df Resid. Dev dAIC Weight
1 81.00 4.78 5.30 0.05
2 80.00 4.72 6.20 0.03
3 81.00 4.74 4.60 0.07
4 81.00 4.50 0.00 0.70
5 81.00 4.75 4.70 0.07
6 81.00 4.72 4.20 0.09
Note: The weight indicates the probability that the model is the best one in the set. Delta
is the AIC difference of a model compared with the best one.
Table 7. Sentence structures by level of difficulty in the SRep test
Level Structure Example
1 Declarative with one auxiliary or modal The boy must sweep the floor in the kitchen.
Short actional passive The children were taken to the office.
Object wh-question with what/who What did the princess buy last month?
Coordinated clauses; complement His sister ran and his father walked.
clause
2 Declarative with two auxiliaries The kitten could have hit the ball down the
Long actional passive stairs.
Object wh-question with She was seen by the doctor in the morning.
which Which picture did he paint at home yesterday?
Complement clause; temporal clause He will feed the cow before he waters the
plants.
3 Conditional clause If the kids behave, we will go into the garden.
Object relative clause The bee that the man swallowed had hurt him.
The design of the LITMUS Sentence Repetition test (SRep) lends itself well to the
investigation of these questions (Marinis & Armon-Lotem, 2015). First, it comprises
three levels of language difficulty, operationalized as syntactic complexity (such as
embedding and syntactic movement) and semantic complexity (e.g., conditionals
and negation). The levels are illustrated in Table 7. They correspond to three blocks
in Experiment 1. I used the LITMUS scoring method, which focuses on the accuracy
in reproduction of the target structure. This makes it possible to isolate the effect of
structural complexity from other aspects of the task. Across levels, items are con-
trolled for lexical complexity (in terms of word frequency and age of acquisition)
and word length (except that Level 3 includes some slightly longer items). The levels
are also comparable in terms of the number of full noun phrases and pronouns
within each sentence type.
Downloaded from https://www.cambridge.org/core. 16 Jul 2021 at 00:15:25, subject to the Cambridge Core terms of use.316 De Cat: Socioeconomic status as a proxy for input quality
1
0.9
0.8
0.7
Accuracy
0.6
0.5
0.4
0.3
0.2
0.1
0
Domain Functional Inflectional Lexical Functional Inflectional Lexical
Group Monolinguals Bilinguals
Figure 8. Accuracy in the SRep test by language domain in bilinguals and monolinguals.
Second, errors are also coded independently of target structure accuracy. They
focus on three domains: lexical, functional, and inflectional. Each word in each test
item is classified as either lexical or functional. Lexical items include: nouns, verbs,
adverbs, and adjectives. Functional items include: determiners, pronouns, wh-
words, auxiliaries, modals, prepositions, complementizers, and conjunctions.
Some words also feature inflectional morphemes, including: tense, finiteness, aspect
(progressive), voice (participle –ed), and number. A single word can therefore be
coded for two different aspects: selection accuracy (of the correct lexical or func-
tional item) and inflection accuracy (if applicable). For each of the three domains
above (lexical, functional, and inflectional), what counts as an error is any omission,
substitution, or addition. The errors in (3)–(4) each highlight one of the domains
(underlined), although some also feature other errors too.
(3) Target: The mum bakes the meal that the children are eating.
The mum makes food for the children. (Lexical error)
(4) Target: The children were taken to the office.
The children taked to the office.10 (Inflectional error)
(5) Target: He will feed the cow before he waters the plants.
He will feed the cow and before he watered the plants. (Functional error)
Performance on SRep items is therefore measured as accuracy of repetition of the
target structure (scoring 0 or 1), and proportional accuracy in each of three
domains: lexical, functional, and inflectional. Figure 8 shows the distribution of
accuracy scores according to each of these domains in bilinguals and monolinguals.
A GAMM was fitted to bilingual children’s SRep target-structure-accuracy data.
The model was built bottom-up, using model comparison (fREML) to identify the
best fitting model at each step. The optimal model is summarized in Table 8. There
was no statistical support for an interaction between difficulty level and cumulative
English exposure.11 There was a significant nonlinear interaction of SES and cumu-
lative English exposure.
The same model was fitted to the accuracy scores in the lexical, functional, and
inflectional domains. A summary of the relevant effects is provided in Table 9,12
Downloaded from https://www.cambridge.org/core. 16 Jul 2021 at 00:15:25, subject to the Cambridge Core terms of use.Applied Psycholinguistics 317
Table 8. Parametric coefficients and smooth terms of a generalized additive mixed effect model fitted to
the accuracy data of target structure repetition)
A. Parametric coefficients Estimate SE t value p value
(Intercept) 3.2991 0.4424 7.4575318 De Cat: Socioeconomic status as a proxy for input quality
compensated by a significant interaction between difficulty level and SES (observed
with respect to lexical and functional accuracy): children from higher SES house-
holds make fewer lexical and functional errors in structurally more demanding
items. There is no significant interaction between difficulty level and cumulative
English exposure. The nonlinear interaction between SES and cumulative English
exposure is the strongest in the lexical domain; it is also significant in the functional
domain, but not in the inflectional domain. The robustness of these significance
patterns was confirmed by fitting a model predicting accuracy of the target structure
repetition from accuracy scores in each domain, alongside the environmental fac-
tors and memory scores. That model is reported in the online-only Supplemental
material.
In monolingual children, there was no evidence for an interaction between SES
and age in months (as a proxy for cumulative English exposure). There was a
significant effect of difficulty level (although only detectable at Level 3), and no evi-
dence for an interaction between difficulty level and cumulative English exposure
(i.e., age in months). SES was not significant as a main effect (β = 0.39, p = .07), but
a significant interaction was detected between difficulty level and SES (albeit only
between Level 1 and Level 2; β = 0.48, p =.017).
Discussion
The first part of the paper investigated the interaction between cumulative English
exposure (as a proxy for input quantity) and SES (as a proxy for input quality) as
predictors of proficiency in the school language in a socioeconomically diverse
group of 5- to 7-year-old bilinguals schooled in English.
Hypothesis 1 was that parental education would be an important dimension of
SES as a predictor of the child’s language proficiency (Hoff et al., 2017). Six alter-
native measures of SES were considered: two simple measures (parental occupation
and parental education) and four complex measures (two combining parental occu-
pation and education, and two combining parental occupation and deprivation
risk). All the alternative measures were shown to interact significantly with cumu-
lative English exposure as predictors of English proficiency (indexed by a global
measure derived through PCA). Out of the six alternatives, the composite measure
obtained by nesting parental occupation in parental education was shown to be the
most informative, as a predictor of English proficiency. Hypothesis 1a was not con-
firmed: a simple SES measure based on parental education is not the most informa-
tive as a predictor of English proficiency. Hypothesis 1b was confirmed: among
alternative composite SES measures, the one assigning a strong weight to parental
education was more informative as predictor of proficiency than alternative SES
measures. While parental education is significantly associated with parental occu-
pation, the two dimensions also contribute independently to predicting proficiency
scores in this population sample.
Importantly, the association between parental education and occupation was
modulated by “bilingualism” in our population sample (in spite of the fact that chil-
dren had been recruited from the same schools). This is in line with other studies,
which have found that SES is associated with ethnicity (Fairley et al., 2014), and that
Downloaded from https://www.cambridge.org/core. 16 Jul 2021 at 00:15:25, subject to the Cambridge Core terms of use.Applied Psycholinguistics 319
the language input experienced by children varies within SES groups (Schwab &
Lew-Williams, 2016). Composite measures of SES are therefore likely to be more
informative (as also advocated by Gatt et al., 2020), to the extent that they are sen-
sitive to variability in the association between dimensions of SES.
The second part of the paper explored whether the relationship between SES (as a
proxy for input quality) and cumulative English exposure (as a proxy for input
quantity) varies in relation to different language domains. This was done through
the in-depth analysis of SRep accuracy data. Accuracy was examined across four
dimensions: structural complexity of the target structure (syntax), use of functional
words (syntax/discourse-semantics), inflectional morphology, and lexical choices.
Structural complexity was operationalized as the level of difficulty of the target
structure. Cumulative English exposure and SES had a significant impact in the
bilingual children (cumulatively as main effects and in nonlinear interaction).
The effect of these environmental predictors did not vary across difficulty levels
(either individually or in interaction). Importantly, difficulty Level 3 (which featured
object relatives and conditional clauses) also remained challenging for monolinguals
in this age group, suggesting that the acquisition of these structures extends beyond
the ages investigated in this study.
Accuracy across language domains was strongly correlated with accuracy of rep-
etition of the target structure. More errors were observed in the more structurally
complex items, especially in the lexical and the functional domains. The impact of
structural complexity was significantly reduced at higher SES, but not at higher
levels of cumulative English exposure, suggesting a differential impact of these
two predictors (to which I will return below). Environmental predictors also had
a combined, global impact through a nonlinear interaction (detected in the lexical
and functional domains, but not the inflectional domain).
When treating accuracy across language domains as outcome measures, a simi-
larly varied picture emerged. Inflectional accuracy was the highest across the three
language domains. No significant interaction of cumulative exposure and SES was
observed in that language domain in the age group under study. This is in line with
Schulz and Grimm (2019), who found that at the age of 4 years 4 months, the per-
formance of bilinguals on phenomena such as subject–verb agreement and verb
meaning (in German) was already on a par with the performance of age-matched
monolinguals. The findings above suggest that the bilinguals in this age group had
in general already experienced sufficient language exposure in that respect. This
could be interpreted as a manifestation of an age of acquisition effect (which has
been found to be robust in inflectional morphology but not derivational morphol-
ogy; Veríssimo, Heyer, Jacob, & Clahsen, 2018).
Lexical accuracy remained susceptible to the influence of cumulative English
exposure and SES in this age group. Similar influences of input quantity and quality
on lexical competence have been observed in monolingual development (Fernald,
Marchman, & Weisleder, 2013; Hart & Risley, 2003) with consequences for reading
development (Merz, Maskus, Melvin, He, & Noble, 2019). In bilinguals, the impact
of SES on lexical development has been observed in relation to proficiency in the
majority language (similarly to what was found in this study; see, e.g., Buac, Gross, &
Kaushanskaya, 2014; Calvo & Bialystok, 2014). SES seems to have a more limited
impact on lexical development in the home language (Bohnacker, Lindgren, &
Downloaded from https://www.cambridge.org/core. 16 Jul 2021 at 00:15:25, subject to the Cambridge Core terms of use.320 De Cat: Socioeconomic status as a proxy for input quality
Öztekin, 2016; Leseman, 2000), except if the home language is a majority language
(Gatt et al., 2020). Such divergences in findings are likely to be explained by socio-
cultural differences across bilingual populations.
Functional accuracy remained the most challenging for the bilinguals in this
study, and it was strongly affected by the interplay between cumulative English
exposure and SES. At low levels of cumulative exposure, higher SES did not confer
any advantage; at higher levels of cumulative exposure, higher SES conferred a
strong advantage.
Hoff, Quinn, and Giguere (2018) provide evidence for “correlated but uncoupled
growth” of vocabulary and grammar in bilinguals: both are related, but neither
dimension predicts growth in the other dimension. They argue that the relation
between vocabulary and grammar development is mediated by the effect of input
properties. The results of the present study are consistent with that view, and suggest
that different aspects of grammar are affected differently by input properties.
Hypothesis 2 was that the influence of input quality (operationalized as SES) on
language proficiency would be necessarily modulated by the influence of input
quantity (operationalized as cumulative English exposure). The robust, nonlinear
interaction between cumulative English exposure and SES found across all the mod-
els in this study is consistent with that hypothesis. The impact of these two predic-
tors did however vary, depending on the aspects of language proficiency used as
outcome variable: (a) when global English proficiency was used as outcome variable,
higher SES conferred an advantage over and above its effect in interaction with
cumulative English exposure; (b) when accuracy of repetition of the LITMUS target
structure was used as outcome variable (indexing morphosyntax), SES and cumu-
lative English exposure conferred an advantage both as main effects and in interac-
tion; (c) when repetition accuracy across language domains was used as outcome
variable, both environmental predictors conferred an advantage as main effects
and in nonlinear interaction, but only SES interacted with difficulty level, and
the strength of the interaction of cumulative English exposure and SES varied across
language domains (and was absent in the inflectional domain).
This variability suggests that SES and language exposure index dissociable but
interrelated properties of the child’s language environment, reflected in a differential
effect across aspects of language competence. Further research will be necessary to
ascertain whether age of acquisition effects can be distinguished from language
exposure effects in bilinguals (as advocated by Tsimpli, 2014), and to confirm
whether language exposure effects can be reliably broken down into qualitative
and quantitative components. The robust impact of SES on selective aspects of lan-
guage proficiency reported above is promising in that respect.
A notable limitation of the present study was the impossibility to assess the qual-
ity of language exposure directly. Self-reported parental proficiency in English did
not predict their children’s proficiency, but this could have been due to the fact that
non-native speakers of English generally addressed their child in the home language,
especially if their own proficiency in English was low. It is nonetheless possible that
SES has an effect on the quality of home language use/interactions (Perkins et al.,
2013), and that this in turn has an indirect effect on English proficiency (mediated
for instance by lower levels of global language proficiency or lower levels of meta-
linguistic awareness).
Downloaded from https://www.cambridge.org/core. 16 Jul 2021 at 00:15:25, subject to the Cambridge Core terms of use.Applied Psycholinguistics 321
Finally, it was not possible to investigate whether SES is associated with different
patterns of integration of the child’s community with the wider society. This could
have a substantial effect on the quality of their language environment (e.g., depend-
ing on the frequency of interactions with native speakers of the societal language,
and on the diversity of interaction opportunities available).
Conclusion
SES has a nontrivial impact on language development in monolingual and bilingual
children, and it is often used as a proxy for input quality. Adopting a broad defini-
tion of input quality (which encompasses some quantitative aspects of language
exposure), this study has explored the interplay between SES and cumulative lan-
guage exposure as predictors of proficiency in the school language, in a diverse
group of bilingual children. The findings of this secondary data analysis point to
a related but differential impact of the two dimensions of the child’s language envi-
ronment, affecting different aspects of language differently
SES is associated with parental education, parental occupation, and ethnicity, but
more research is needed to unveil the actual SES-related dimensions that affect
children’s language development. This will allow the identification of optimally
informative predictors that remain valid across cultures and social groups.
Notes
1. Some consider the diversity of the language experience to be an index of language richness (as per the
ALEQ or PaBiQ questionnaires). Here I list them as different dimensions of input quality, but this is not
intended to be prescriptive.
2. See Carroll (2017) for an in-depth discussion of input in bilingual language acquisition.
3. Functional error types do not include inflectional morphology in this classification. The coding system
will be explained in detail later in the paper.
4. Percentages are given for those languages representing more than 5% of the sample.
5. The version we administered was the precursor version, which was labeled the School Age Sentence
Imitation Task (Marinis, Chiat, Armon-Lotem, Gibbons, & Gipps, 2010).
6. The higher the correlation between the three constructs, the higher the first eigen value of the covariance
matrix would be. This first eigen value represents the variability captured by the first component of the PCA,
which was then used as global proficiency score.
7. The same is true of paternal proficiency, although we do not report the results here.
8. These ethnic categories are based on the “main ethnic categories” used by the UK Office for National
Statistics. We assigned children to a category based on home language. Due to lack of relevant data we could
not take mixed backgrounds into account. In this sample, all families in the “Any other ethnic group” were
Arabic-speaking. In sum, the ethic categories used in our analysis are: Arabic, Asian, Black, European.
9. It is however likely memory had an indirect impact, which was captured by the DCCS score. See De Cat,
Gusnanto, & Serratrice (2018) for a detailed analysis of the cognitive measures collected for this group of
children.
10. This sentence features both a functional error (as the auxiliary is missing) and an inflectional error (as
the verb features an incorrect suffix).
11. The model without interaction had a significantly better fit (AIC difference = 6.05).
12. The full summary for each model is provided in the online supplement.
Acknowledgments and open access information. The original data was collected as part of a project
funded by the Leverhulme Trust (RPG-2012-633), which is gratefully acknowledged. Thanks to the organ-
izers of the workshop on “Capturing and Quantifying Individual Differences in Bilingualism” (Tromsø,
Downloaded from https://www.cambridge.org/core. 16 Jul 2021 at 00:15:25, subject to the Cambridge Core terms of use.You can also read