Better Births Four Years On: A review of progress - NHS England and NHS Improvement
←
→
Page content transcription
If your browser does not render page correctly, please read the page content below

Better Births Four Years On:
A review of progress

    NHS England and NHS Improvement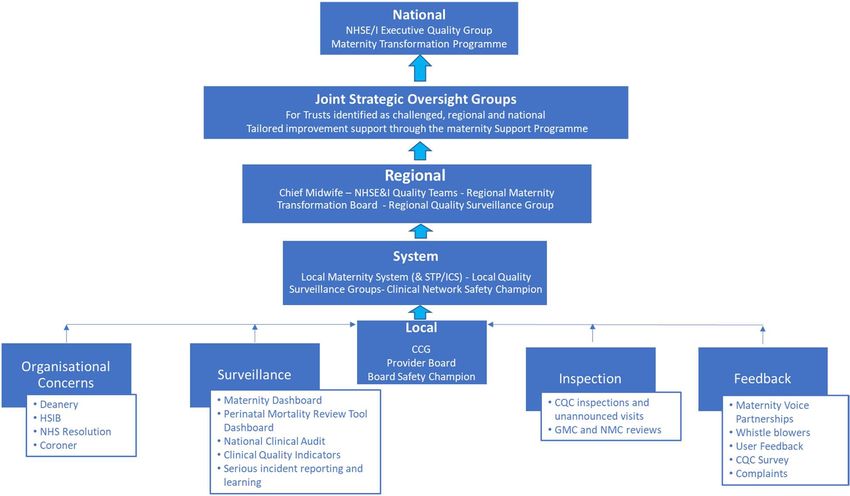
Better Births Four Years On: A review of progress

Version number: 1
First published: 04 March 2020
Prepared by: The Maternity Transformation Programme
Classification: OFFICIAL
NHS England Publications Gateway Reference: 001636

This information can be made available in
alternative formats, such as easy read, or large
print, and may be available in alternative
languages, upon request. Please call 0300
3112233 or email: england.contactus@nhs.net

                                             2
Contents

Executive Summary ................................................................................................... 4
Introduction ................................................................................................................ 7
How is care improving? .............................................................................................. 8
   Changing complexity of the women we care for...................................................... 8
   Outcomes: progress against the national safety ambition ....................................... 9
   Quality of care ....................................................................................................... 17
   Experience: what women say about the care they receive ................................... 22
   Our staff: what is our workforce telling us? ........................................................... 27
   Our staff: workforce numbers ................................................................................ 29
   New models of care .............................................................................................. 29
   Summary............................................................................................................... 31
What are we doing to improve quality and outcomes? ............................................. 32
   Making care safer ................................................................................................. 33
      Prevention ......................................................................................................... 33
      Identification and escalation .............................................................................. 36
      Response .......................................................................................................... 37
   Making care more personalised ............................................................................ 38
   Summary............................................................................................................... 41
Conclusion ............................................................................................................... 42

                                                              3
Executive Summary
Since the publication of Better Births in 2016 and of the Report of the Morecambe
Bay Investigation in 2015, the NHS and its partners have come together through the
national Maternity Transformation Programme to implement its vision for safer and
more personalised care across England and deliver the national ambition to halve
the rates of stillbirths, neonatal mortality, maternal mortality and brain injury by 2025.
As we reach the fourth anniversary, this is an opportune time to take stock of
progress, to reflect on successes and remaining challenges, and consider where
further action is needed.
The data shows that good progress is being made over time in reducing perinatal
and maternal mortality, despite an overall increase in the complexity of care.
There has been a 21% fall in the stillbirth rate between 2010-2018, meaning the
NHS in England has met the 2020 20% reduction ambition two years ahead of
schedule. There has been a reduction in the combined perinatal mortality rate of
15.1% reduction over the same period, also in line with the 2020 ambition. Maternal
deaths, which are a very rare occurrence, are also falling. There has been a 14%
reduction in the triennial maternal mortality rate up to 2015-17, which is in line with
the trajectory required to meet the 2020 ambition.
At the same time, the latest women’s experience survey shows a steady
improvement nationally in what women say about their care. Over 17,000 women
responded to the survey – of the 29 questions asked, 22 questions showed an
improvement in score at national level, while just two questions showed a
deterioration. This continues the trend we have seen since 2013 of improving
experience. Importantly, women continue to feel more confident in the safety of the
care they are receiving. 88% of women responded that they were given appropriate
advice and support at the start of their labour when they contacted a midwife or the
hospital, up by 1.5 percentage points since 2018 and 2.8 percentage points since
2013. 84% of women responded that if they raised a concern during labour or birth it
was taken seriously, up by 2.5 percentage points since 2018 and 4 percentage
points since 2013.
These improvements are being driven by the 44 Local Maternity Systems across the
country, through which commissioners, providers, clinical teams and service users
are redesigning services and delivering them to meet the needs of their
communities. 10,000 women were booked on a continuity of care pathway in March
2019 (where they will see a midwife they know before, during and after birth).
130,000 women had access to a digital maternity record by December 2019,
transforming how they access and own their information and how services can join
up around them. And the new model of community hubs, which bring a range of
4antenatal, postnatal and sometimes intrapartum care services together in one setting
closer to women’s homes, have been opened across the country, with over 100 new
hubs opening by December 2019.
Support for women with perinatal mental health problems has increased. There is
now a specialist perinatal mental health team operating in every local system across
England. 700 new specialist staff were recruited to community services between
2017 and 2019, enabling over 13,000 more women to be seen in 2018/19. At the
most specialist end, four new mother and baby units have opened in the areas of
England most in need. The number of beds in existing mother and baby units has
increased as well – nationally, including the new units, there has been a 40%
increase in capacity since 2016, with over 150 beds now available. NHS England
and Improvement is committed to further increasing the national capacity in these
specialist units.
However, the picture is complex and in some areas it lacks clarity, partly as a result
of data quality, and partly as a result of the time lag in the data. There are several
areas for further action:
To further understand the incidence of brain injuries, where a nationally
consistent definition was only agreed in 2017. This is a priority, working with
academics, clinicians, professional bodies, and organisations such as NHS
Resolution and Healthcare Safety Investigation Branch (HSIB).
Inequalities in outcomes from maternity services for women and babies must
be tackled if we are to offer families the best start in life. The NHS Long Term
Plan set out in January 2019 clear and costed plans to prioritise
improvements in maternity services for the most vulnerable groups – Black,
Asian and ethnic minority families, and those from the most deprived areas –
particularly rolling out the continuity of carer service model to 75% of this
group by March 2024. These improvements, and identifying how
transformation can reduce health inequalities across all fronts, are key
priorities for the Maternity Transformation Programme as it enters its next
phase.
Progress is being made on ambitions in relation to pre-term birth and
supporting pregnant women who smoke to give up but now needs to
accelerate.
Whilst pregnancy and childbirth have in general never been safer, there is
understandable public concern about the quality of care in a small number of
individual units. NHS England and NHS Improvement is providing dedicated,
on the ground improvement support to such units to work alongside their
5clinical teams to make immediate improvements to care, and put in place the
steps needed to transform their care in the coming months.
The change we have seen so far across England has come about as a result of the
combined energy, vision and expertise of midwives, obstetricians, paediatricians,
managers, commissioners and system leaders to implement the vision set out in
Better Births. That activity has centred on the twin aims of making care safer and
more personalised.
Improvement in safety is built around the PIER framework (prevention, identification,
escalation and response). The “prevention” element in particular has delivered a
range of universal initiatives focusing on changes to clinical practice and service
models, and the development of a safety culture in provider trusts. A refreshed
national maternity and neonatal safety improvement programme, with dedicated
practical and communications support is being launched in March and April 2020, to
ensure that themes emerging from learning nationally are turned universally into
changes to clinical practice, behaviour and service models locally.
The “identification” and “escalation” elements have been in place as part of wider
quality governance and oversight functions, and are being strengthened by the
addition of a maternity-specific lens which can support effective surveillance at local,
regional and national levels The Maternity Safety Support Programme, which forms
the “response” element, has a track record of helping provider trusts to improve the
quality of their care, and is being further developed and strengthened with additional
resource.
Improvement in personalisation, which evidence tells us will also contribute to
improving safety, is built around a number of tools and processes to support and
empower women to make decisions about their care, including continuity of carer
and personalised care and support planning. There is a particular focus on postnatal
care, where we know that there has been less focus and investment, and so several
service developments are due to be implemented in 2020.
Going forward, the programme will continue to work in partnership with national
organisations and local systems to harness the collective drive and will to change
and improve maternity care for women and families. Local Maternity Systems will
continue to be the agents for change, and national support will focus on helping them
to deliver evidence-based improvements to care rapidly and consistently.
6Introduction
1. Since the publication in 2016 of Better Births: Improving outcomes of maternity
services in England1 and in 2015 of the Report of the Morecambe Bay
Investigation,2 the NHS and its partners have come together through the national
Maternity Transformation Programme to implement its vision for safer and more
personalised care across England and deliver the national ambition to halve the
rates of stillbirths, neonatal mortality, maternal mortality and brain injury by 2025.
2. Over the last four years, we have seen clinical teams, provider organisations,
commissioners and regional and national bodies work together to design and
deliver improved maternity services across England. 44 Local Maternity
Systems have been working together to plan and implement local changes to
deliver the Better Births vision.
3. At the same time, cases in a small number of providers have come to light where
care has fallen well short of the standard that is expected, with devastating
effects on the families involved. Action is being taken with those provider
organisations to ensure that lessons are learnt from these cases, that care is
improved, and that these mistakes do not happen again, whilst ensuring that all
provider organisations have the support they need to develop the leadership and
culture which are a prerequisite for the safest care.
4. This anniversary is therefore an opportune time to take stock of progress, to
reflect on successes and where problems have arisen, and consider where
further action is needed to realise opportunities and to move further faster
towards our shared goal of securing outcomes from maternity care that are
amongst the best in the world.
5. This report provides analysis of the improvements that have been made in terms
of outcomes for women and their babies, experience of care, and overall quality
of services following the publication of Better Births. It also identifies where there
is variation and suggests why this is the case.
6. The report summarises the actions that have taken place across the country to
secure these improvements, and outlines action that will be taken in the coming
years to further improve outcomes and reduce unwarranted variation.
1
https://www.england.nhs.uk/publication/better-births-improving-outcomes-of-maternity-services-in-
england-a-five-year-forward-view-for-maternity-care/
2
https://www.gov.uk/government/publications/morecambe-bay-investigation-report
7How is care improving?
7. This chapter sets out what is known about improvements to outcomes, women’s
experience of care and what staff are telling us, and identified variation.
8. There are challenges in understanding outcomes data as it has a relatively long
time lag. For the data on service quality, a new and vastly improved Maternity
Services Dataset is being rolled out across the country, however data quality is
not yet complete and for some indicators has not been collected for long enough
to judge trends over time. Nevertheless, there is a still a significant amount of
data available about the quality and outcomes of maternity services, and this
report has focussed on key indicators where there is good data upon which we
can draw conclusions.
Changing complexity of the women we care for
9. In considering our progress in improving care, it is important to first understand
the changing nature of the health and demographics of the women and families
that maternity services are caring for. Figures suggest that a greater proportion
of pregnant women are older, overweight or have underlying health conditions
than previously.
10. This means that the complexity of the maternity care the NHS is providing has
increased. For example:
More than half of women (50.4%) with a recorded BMI at booking in 2016/17
were overweight or obese (up from 47.3% in 2015/16).3
The proportion of mothers aged 35 years or older at birth in England and
Wales has increased year on year from 19.9% in 2010 to 23.4% in 2018,
which continues a long term upward trend since the 1970s4.
The proportion of deliveries complicated by diabetes mellitus has increased
from 5% to 8% between 2013-14 and 2018-19. While this increase may be
linked to increases in maternal obesity it may also partly be an indication of
improved identification and recording of the condition during pregnancy5.
3
National Maternity and Perinatal Audit: https://maternityaudit.org.uk/pages/cr2019km
4
ONS - Births by Parents' Characteristics, England and Wales
5
NHS Maternity Statistics, England 2018-19 [PAS]
8Outcomes: progress against the national safety ambition
11. The NHS has a national ambition to halve the rates of stillbirths, neonatal deaths,
maternal deaths and brain injuries during birth by 2025, from a 2010 baseline.
This was brought forward from a previous target date of 2030. In addition, the
NHS is working towards an interim ambition of a 20% reduction by 2020.
12. The national ambitions for stillbirth rate and neonatal mortality rate are monitored
using data in the Office for National Statistics (ONS) Childhood Mortality
Statistics publication, which are based on information recorded when deaths are
certified and registered. This publication is based on an annual extract of data on
deaths occurring in the calendar year, which is taken approximately 10 to 11
months after the end of the data year to allow for late registrations. ONS
Childhood Mortality statistics are generally published around 13 to 16 months
after the data period, with the most recent data available being for 2018
(published on 20 February 2020). The NHS also tracks data prepared by the
University of Oxford’s National Perinatal Epidemiology Unit (NPEU) for its
Mothers and Babies: Reducing Risk through Audits and Confidential Enquiries
across the UK (MBRRACE-UK) reports. Annual Stillbirth and Neonatal Mortality
Rates for 2013 to 2017 are published in MBRRACE-UK’s Perinatal Mortality
Surveillance Reports. Perinatal mortality rates published by MBRRACE are
informed by ONS data on births and deaths and are therefore published later
than the ONS Childhood mortality statistics publication.
13. Between 2010 and 2018 there was a 21% fall in the stillbirth rate. This means
the NHS in England has met the 2020 20% reduction ambition two years ahead
of schedule (although the trajectory will need to improve to meet the 50%
ambition by 2025).
14. Between 2010 and 2018 the neonatal mortality rate fell by 5.1%. On the face of
it this is below the trajectory required to achieve the national ambition. However,
between 2014 and 2017 the number of very low gestational age babies (i.e.,
babies born at a gestational age of less than 23 weeks) born alive rose by 50%
(see figure 1). These babies have a very low chance of survival. It is possible
that this trend is in part due to a change in the threshold for actively assessing for
signs of life before 24 weeks’ gestation thereby converting the classification of a
pregnancy loss before 24 weeks from a miscarriage to a neonatal death.
9Figure 1. The total number of live births has reduced in recent years but the
numbers of live births at up to 22+6 weeks gestational age showed a 50%
increase from 2014 to 2017 ((Data Source: Office for National Statistics –
Child and Infant Mortality in England and Wales)
2500 679,106 live births in
2017, the lowest since 2006
Total live births
700,000
Births up to 22+6 weeks gerstation
2000 Total neonatal deaths
600,000
1,903 neonatal
1,762 500,000
Total live births
1500 deaths in 2017
neonatal
deaths in 2014 400,000
564 live births up
1000 376 live births to 22+6 weeks GA
300,000
up to 22+6 in 2017, 50% more
weeks GA in than in 2014
2014 200,000
Live births up to…
500
100,000
Neonatal deaths up to…
0 0
2010 2011 2012 2013 2014 2015 2016 2017
15. The latest ONS Childhood Mortality Statistics publication includes analysis of
neonatal mortality rates for babies born at 24 weeks’ gestational age or over. This
provides a more consistent metric against the 2010 baseline. The neonatal
mortality rate for England and Wales reduced by 20% from 2.0 to 1.6 per 1000
live births between 2010 and 2017. The improvement occurred between 2010
and 2014, since which the rate has remained at 1.6 per 1000 live births up to
2017.
16. The survival of some babies to birth may be the result of increased efforts to
reduce stillbirths. Therefore, a more accurate understanding may be obtained by
combining the stillbirth and neonatal death rate into one indicator. Figure 2
shows that the reduction in the combined perinatal mortality rate is broadly on a
trajectory to meet the ambition (a 15.1% reduction between 2010 and 2018
against the 2020 ambition trajectory of a 16.3% reduction).
10Figure 2. The combined rate of stillbirth and neonatal mortality per 1000
total births is broadly in line with the trajectory to meet a 20% reduction
since 2010 by 2020. (Data Source: Office for National Statistics – Child and
Infant Mortality in England and Wales)
9.0 8.2
8.0
7.6
8.0 7.3 7.1 7.1
7.0 6.9 6.8
7.0
Rate per 1000 total births
6.4
6.0
5.0
4.0 4.0
3.0
2.0
Trajectory to 20% and 50% reduction by 2020 and 2025
1.0
Combined stillbirth and neonatal mortality rate
0.0
2010 2011 2012 2013 2014 2015 2016 2017 2018 2019 2020 2021 2022 2023 2024 2025
17. Mortality rates remain higher for Black or Black British and Asian or Asian British
babies. Whilst stillbirth rates for these groups have reduced over the period 2015
to 2017 from 8.17 to 7.46 and from 5.88 to 5.70 per 1,000 total births
respectively, neonatal mortality rates have increased over the same period from
2.45 to 2.77 and from 2.50 to 2.86 per 1,000 live births respectively.
18. At NHS region level, MBRRACE crude (unadjusted) figures show variation in
stillbirth rate from 3.08 per 1000 births in the South West to 4.13 per 1000 births
in London; while neonatal mortality rates vary from 1.32 per 1000 live births in the
East of England to 1.92 per 1000 live births in the Midlands (See figure 3). Part of
this variation may be explained by differences in clinical risk and demographic
factors.
11Figure 3. There is variation in crude perinatal mortality rates at NHS region
level, some of which may be due to differences in clinical risk and
demographic factors (Data source: Aggregated from MBRRACE – UK
Perinatal Mortality Surveillance Report 2017)
Annual stillbirth rate per 1,000 births (MBRRACE 2017)
Annual neonatal mortality rate per 1,000 live births (MBRRACE 2017)
4.50
4.13
3.97
4.00 3.82
3.68 3.64
3.42
3.50
3.13 3.08
3.00
Rate per 1000 births
2.50
1.92
2.00 1.74 1.75 1.74
1.65
1.49 1.45
1.50 1.32
1.00
0.50
0.00
England North East North West Midlands East of London South West South East
and England
Yorkshire
NHS Region
19. There is variation between trusts in crude (unadjusted) perinatal mortality rates.
However, some caution is needed in interpreting differences in crude rates
between trusts due to small numbers and differences in case-mix. Variation
reduces significantly after adjustment for clinical risk and demographic factors
and stabilisation to account for statistical noise. For example, in trusts with 4,000
or more births at more than 24 weeks’ gestational age per annum6, there is 3.8
fold variation in crude rates of stillbirth (from 1.69 to 6.35 per 1000 births) and
11.6 fold variation in crude rates of neonatal mortality (from 0.34 and 3.93 per
1000 live births). When rates are adjusted and stabilised to account for clinical
risk, demographic factors and natural variation over time, variation is reduced to
1.1 fold for stillbirth rate and 2.3 fold for neonatal mortality rate.
6
There are 42 trusts within this group. The assessment of variation excludes four trusts for which crude rates
have been suppressed due to small numbers
12Figure 4. Variation is reduced considerably when perinatal mortality rates
are adjusted for clinical risk factors, demographic factors and stabilised to
account for natural variation (Stabilised and adjusted stillbirth rate and
neonatal mortality rate for trusts with more than 4000 births at 24+0 weeks
gestation age or greater: MBRRACE – UK Perinatal Mortality Surveillance
Report 2017)
7.0
Rate per 1000 births
6.0
Adj. Stabilised stillbirth rate Crude Stillbirth rate
5.0
4.0
3.0
2.0
1.0
0.0
Trusts within comparator group ranked by ascending crude stillbirth rate
Rate per 1000 live births
5.0
Adj. Stabilised neonatal mortality rate Crude neonatal mortality rate
4.0
3.0
2.0
1.0
0.0
Trust within comparator group ranked ascending by crude neonatal mortality rate
20. Maternal deaths are very rare, with the latest figures showing just 9.2 per
100,000 maternities. Small numbers mean the data has to be combined into a
rolling triennial rate, which is only available on a UK-wide basis (not England
only). Even when three years of data are combined, changes from one three-
year period to the next must be interpreted with caution as they may be due to
natural statistical variation. Greater reliance should therefore be placed on the
longer term trajectory. This shows a 14% reduction in the triennial maternal
mortality rate up to 2015-17, which is in line with the trajectory required to meet
the 2020 ambition.
21. The National Neonatal Research Database (NNRD) is the data source for brain
injury data, although a definition of brain injury was agreed nationally and
published only in March 2017. In addition, in 2010–2011 population coverage in
the database was incomplete, so the earliest year we have a robust national
estimate of the serious brain injury rate for is 2012. The data show the rate of
13serious brain injuries fell from 5.4 per 1000 in 2014 to 5.1 per 1000 births in 2017,
having previously increased from 4.9 in 2012. However, this trend was created
retrospectively. This means that before publication of the definition, the NHS
could not routinely and consistently monitor incidents, nor put in place properly
targeted improvements to care, although the Royal College of Obstetricians and
Gynaecologists’ (RCOG) Each Baby Counts7 reports have been providing
recommendations and findings relating to serious brain injuries at term since
2015. In addition, although good care can reduce the risk of a baby’s brain not
receiving enough oxygen during birth (hypoxic ischaemic encephalopathy), the
definition also incorporates other causes of brain injury. In short, the picture of
what is happening to rates of brain injury has been unclear, and will improve
over time as the NHS monitors progress against a common definition and takes
action to improve care. In the meantime, considerable insight has been
generated into which improvements to care are most likely to have an impact on
reducing brain injuries.
22. The national ambition for the pre-term birth rate is a reduction from 8% in 2015
to 6% by 2025. The pre-term birth rate rose steadily from 7.3% in 2010 to 8.1%
in 2017 and then fell to 8.0% in 2018. The impact of programme initiatives to
tackle pre-term birth are expected to have an impact soon, particularly the new
fifth element of the Saving Babies’ Lives care bundle (see paragraph 61).
7
https://www.rcog.org.uk/eachbabycounts
14Figure 5. Preterm Birth Rates in England have been rising steadily in recent
years but fell slightly between 2017 and 2018. A continued more rapid
reduction is required in order to meet the 2025 ambition. (Data sources:
ONS Birth Characteristics and Pregnancy and Ethnic Factors)
9
8.0 8.1 8.0
7.7 7.9
8 7.5 7.6
7.3 7.4
7
6.0
6
Rate (% of births)
5
4
3
2
1
0
2010 2011 2012 2013 2014 2015 2016 2017 2018 2019 2020 2021 2022 2023 2024 2025
Preterm Birth Yearly Rates Ambition trajectory
23. An additional national ambition comes in Smoke-free generation: tobacco control
plan for England.8 This sets an ambition for the proportion of mothers who are
smokers at the time they give birth to be 6% by the end of 2022. Maternal
smoking is strongly associated with increased risk of perinatal mortality and pre-
term birth. The number of mothers who smoke has been reducing over a long
period of time to reach 10.6% in 2018/19, but the trajectory will need to improve
to reach the 2022 target (See figure 6).
24. At NHS England Region level, maternal smoking rates range from 4.8% in
London to 14.8% in North East and Yorkshire (See figure 7). The geographical
trend in maternal smoking rates correlates with overall smoking rates.
8
https://www.gov.uk/government/publications/towards-a-smoke-free-generation-tobacco-control-plan-for-
england
15Figure 6. Rates of maternal smoking at time of delivery are on a downward
trend but the pace of reduction needs improve to meet the national ambition
(Data source: NHS Digital SATOD collection)
18%
Maternal smoking rate at delivery
16% Tobacco control plan target 6% or lower by the end of 2022
14%
12%
10%
8%
6%
4%
2%
0%
Figure 7. The proportion of women who are recorded as being a ‘smoker’ at
the time of delivery varies from 4.8% in London to 14.8% in North East and
Yorkshire (Data source: Aggregated from NHS Digital SATOD 2019/20 Quarter
1)
16% 14.8%
14% 12.6% 13.0%
12% 10.6% 11.0%
9.7% 9.6%
10%
8%
6% 4.8%
4%
2%
0%
England North East North West Midlands East of London South West South East
and England
Yorkshire
16Quality of care
25. Other clinical indicators can help to improve understanding of the picture of the
quality of care both nationally and locally, but care needs to be taken because
with some indicators there is not an optimum number and both high and low
outliers may be a cause for further investigation.
26. Best practice, as outlined in Better Births,9 is for the local NHS to use the
information to a) identify where they are outliers, b) then to investigate further
what the reasons are for being an outlier, and c) where sensible to make changes
to local clinical practice and service models. This requires a sophisticated
approach, sometimes triangulating multiple sources of data to reach a
conclusion. For example, the caesarean section rate on its own says very little
about the quality of a service, but in combination with other quantitative data,
qualitative information and service user feedback it may be possible to draw
conclusions about whether the balance between different interventions is broadly
right.
27. Analysis of clinical indicators such as the National and Maternal Perinatal Audit
(NMPA) Clinical Reports relies on the quality of data submitted. While the NMPA
reported that the quality and completeness of data submitted had improved
between the 2015/16 and 2016/17 reporting years, many trusts and boards were
excluded from one or more measures owing to poor data quality and
completeness.
28. Method of onset describes the means by which labour begins. Onset of labour
without pharmacological, mechanical, or operative intervention, is most common
as a proportion of total deliveries but has decreased from 69% in 2008-09 to 50%
in 2018-19. Induction of labour is offered to a woman if her baby is overdue or
there is a risk to her or her baby's health. The proportion of births where the
method of onset is induction increased from 20 per cent to 33 per cent in the
period 2008-09 to 2018-19 (NHS Digital 2018-19 Maternity Statistics). The NMPA
Clinical Report 2019 found that substantial variation remained in the rates of key
measures of maternity care such as induction of labour and modes of birth,
beyond what can be explained by clinical risk and demographic factors. This
suggests that there remains variation in clinical practice, decision making and
outcomes. This may in part be explained by recent research which has provided
compelling evidence that induction of labour at 39 weeks reduces the risk of
caesarean section and prolongation of pregnancy after 41 weeks is associated
with a higher stillbirth rate. This information has led to a change in practice about
when induction of labour is offered with the possibility that more women opt for
induction of labour once they have been given the material facts.
9
Better Births, paragraph 4.84
1729. Caesarean birth occurs for many reasons. Elective (planned) caesarean birth is
offered for a range of conditions. Women with previous caesareans are offered
the option of a caesarean birth. A caesarean may also be offered if the baby is
not in the cephalic (head down) position, if there are concerns about the baby’s
wellbeing or growth, or some maternal conditions including maternal mental
health needs. A small number of caesarean sections occur due to mothers
requesting this mode of birth. An emergency (unplanned) caesarean section may
be performed when there are acute concerns about the baby’s or mother’s
wellbeing or when labour is not progressing. A caesarean is a major operation
that carries a number of risks, so it is usually only carried out if it is the safest
option for the woman and her baby. Accordingly, both high and low numbers of
caesarean sections may warrant local investigation to understand the reasons.
30. Annual NHS Maternity Statistics for 2018-19 show a continuation of the increase
in emergency and elective c-sections and the corresponding reduction in
spontaneous deliveries. At the same time there has been a small decrease in the
number of instrumental births (assisted using a ventouse or forceps).
Figure 8a. The most common delivery method is spontaneous vertex,
however this shows a decreasing recent trend (Data source: NHS Digital
Annual Maternity Statistics 2018-19)
Unknown % Spontaneous vertex % Spontaneous other %
Forceps low % Forceps other % Ventouse %
Breech other % Breech extraction % Caesarean elective %
Caesarean emergency % Other %
70%
61.2% 60.9% 60.3% 59.7% 59.4% 58.8%
60% 57.9% 56.8%
Proprtion of deliveries with known delivery method
50%
40%
30%
20%
10%
0%
2011-12 2012-13 2013-14 2014-15 2015-16 2016-17 2017-18 2018-19
18Figure 8b. There have been corresponding steady increases in rates of
elective and emergency caesarean deliveries (Data source: NHS Digital
Annual Maternity Statistics 2018-19)
18% 16.9%
16.2%
15.4% 15.6% 15.7%
16% 14.8% 14.8% 15.2%
Proprtion of deliveries with known delivery
14% 13.2%
12.6%
12.1%
11.1% 11.5%
12% 10.7% 11.0%
10.2%
10%
method
8%
6%
Caesarean elective % Caesarean emergency %
4%
2%
0%
2011-12 2012-13 2013-14 2014-15 2015-16 2016-17 2017-18 2018-19
31. The increase in the number of inductions and the increase in caesarean sections
shows that in general the number of medical interventions is increasing. There
remains variation locally.
Figure 9. Emergency caesarean rates at NHS trust level range from 9.7% to
22.5%. (Data source: NHS Digital Annual Maternity Statistics 2018-19)
25%
20%
15%
10%
5%
0%
Trust Emergency caesarean rates England
1932. The number of complications recorded during labour and birth shows year on
year increases.10 The majority of the increase since 2013-14 is due to a rise in
the recorded numbers of the following three complications:
maternal care for known suspected fetal problems;
other maternal diseases classifiable elsewhere but complicating pregnancy,
childbirth and the puerperium;11 and
postpartum haemorrhage.
Figure 10. An increasing number of delivery complications against a
reduction in total deliveries is likely linked to improved detection and
recording and an increase in complexity.
(Data source: NHS Digital Annual Maternity Statistics 2018-19)
2,000,000
1,582,653 1,604,093
1,505,581 1,542,263
1,414,476
1,500,000 1,336,420 1,374,541 1,385,588
1,290,336
1,000,000
668,195 668,936 671,255 646,904 636,643 648,107 636,401 626,203 603,766
500,000
Delivery Complications Total Delivery Episodes
0
2010/11 2011/12 2012/13 2013/14 2014/15 2015/16 2016/17 2017/18 2018/19
33. The increase in these complications seems most likely to be linked to improved
detection (at delivery or earlier) and recording, prompted by policy initiatives and
clinical audit findings.
34. It is common for the perineum to tear to some extent during childbirth. For most
women, these tears are minor and heal quickly. However, for some women the
tear may be deeper. Third- or fourth- degree perineal tears extend into the
muscle that controls the anus (anal sphincter) and are described as Obstetric
Anal Sphincter Injury (OASI). Recognition and appropriate repair of OASI
reduces long-term morbidity such as incontinence. NHS maternity services will
therefore want to keep the incidence of OASI low, through interventions such as
the RCOG OASI Care Bundle, but detection rates high to ensure appropriate
management.
10
Source: Hospital Episode Statistics NHS Digital Annual Maternity Statistics Publications 2010/11 to 2018/19
11
International Classification of Diseases: https://www.icd10data.com/ICD10CM/Codes/O00-O9A/O94-
O9A/O99-
2035. In England, the adjusted rate of third or fourth degree perineal tears for term
vaginal births in 2016-17 was 3.4%. There is a higher rate of third or fourth
degree tears in primiparous women and instrumental births. (See figure 11)12
Figure 11. Rates of third or fourth degree perineal tears are highest in
primiparous women who have and instrumental birth. (Data source:
National Maternal and Perinatal Audit based on 2016-17 Hospital Episode
Statistics)
8% 7.5%
7%
6%
5.1%
5%
4.3%
4%
3%
2% 1.6%
1%
0%
Primiparous, Primiparous, instrumental Multiparous, Multiparous,
spontaneous vaginal birth birth spontaneous vaginal birth instrumental birth
36. Postpartum haemorrhage (PPH) is a major source of ill health after childbirth and
can cause serious illness for the mother or, rarely, death. NHS maternity services
will therefore want to keep their rates low. The most common cause of any PPH
is the womb not contracting down after birth. This is more likely in women who
are obese, have a multiple birth or large baby, have a prolonged labour or
caesarean section, or have had a haemorrhage before. For the purposes of
identifying outliers, a threshold of 1500ml of blood loss is used as this is
associated with longer stays in hospital, and a higher chance of needing a blood
transfusion, a further operation or intensive care. There remains variation,
beyond that which would be expected, in the proportion of women reported as
having a PPH of 1500 ml or more. This may be due to variation in the incidence
of PPH or the implementation of recommendations from MBRRACE about better
assessment of blood loss, which results in more women receiving the appropriate
care.
12
Rate for women who gave birth vaginally to a singleton baby in the cephalic position between 37+0 and
42+6 weeks gestation. The rates are adjusted for case mix.
21Figure 12. There is variation at trust level in rates of Postpartum
Haemorrhage beyond what can be explained by differences in case-mix
alone. (Data source: National Maternal and Perinatal Audit based on 2016-
17 Hospital Episode Statistics)
Experience: what women say about the care they receive
37. As well as the clinical data, how women feel about the care they receive is a vital
source of information about quality. The Care Quality Commission (CQC)
undertakes an annual survey of the users of maternity services. The latest
survey had 17,151 responses, providing a valuable source of insight and
information both nationally but also on a provider by provider basis, allowing
comparison and learning between services.
38. The 2019 survey results are positive, showing that the vast majority of women
had a good experience of maternity care. Moreover, the trend is also positive,
with statistically significant improvements seen between 2018 and 2019 across
most comparable questions, with some positive changes being relatively large
when compared with other patient experience survey results in recent years.
There are 29 questions in the survey which are scored by CQC for the purposes
of benchmarking trust performance; and for which the score is comparable
between 2018 and 2019 survey results. Of these questions 22 questions showed
an improvement in score at national level, while just two questions showed a
deterioration.
39. The 2019 results show that most women have confidence in the safety of the
care they are receiving, and that this confidence is growing. Relevant questions
which are comparable over time are:
22 88% of women responded that they were given appropriate advice and
support at the start of their labour when they contacted a midwife or the
hospital, up by 1.5 percentage points since 2018 (86%) and 2.8 percentage
points since 2013 (85%).
84% of percent of women responded that if they raised a concern during
labour or birth it was taken seriously, up by 2.5 percentage points since 2018
(82%) and 4 percentage points since 2013.
78% of women reported that they (and / or their partner or a companion) were
not left alone at all at a time when it worried them during labour, birth or
shortly after birth. This is up by 1.4 percentage points since 2018 (77%) and
4.5 percentage points since 2013 (74%).
Figure 13. An increasing proportion of women report that they have
confidence in the safety of the care they are receiving. (Data source: 2019
CQC Maternity Survey)
100%
95%
90% 87% 88%
86% 86%
85%
% Positive responses
85%
84%
80% 81% 82%
80% 81%
75% 78%
77% 77%
74% 74%
70%
65%
% Where concern was taken seriously when raised during labour
60%
% Given appropriate advice and support when contacting the midwife or hospital at
the start of labour
55% % Not left alone at a time when it worried them
50%
2013 2014 2015 2016 2017 2018 2019
40. However, there is still room for improvement in the results of questions about
midwives’ awareness of women’s medical history (see figures 14a and 14b). This
is expected to improve as continuity of carer is rolled out further (as described in
paragraph 47).
23Figure 14a. Women’s perception of midwives’ awareness of their medical
history during the antenatal care shows that there is room for improvement in
this aspect of women’s care. (Data source: 2019 CQC Maternity Survey
100%
36% 36%
90% 36% 36%
80%
% Positive responses
70%
60% 52%
49% 50% 50%
50%
40%
30% % of women reporting that midwives sometimes appeared to be
aware of their medical history during antenatal check-ups
20%
% of women reporting that midwives always appeared to be aware
10% of their medical history during antenatal check-ups
0%
2015 2016 2017 2018 2019
Survey year
Figure 14b. Women’s perception of midwives’ awareness of their medical
history during the postnatal care shows that there is also room for
improvement in this aspect of women’s care. (Data source: 2019 CQC
Maternity Survey)
100%
90%
77% 78% 77% 76% 77%
80%
70%
% Positive responses
60%
50%
40%
30%
20% % of women who reported that midwives appeared to be aware of their medical
history during postnatal care
10%
0%
2013 2014 2015 2016 2017 2018 2019
Survey year
41. There also remains significant variations in the scores received by individual
trusts, for example on whether women felt their concerns during labour were
being taken seriously, with potential lessons to be learnt by low outliers from high
outliers.
24Figure 15. There is notable trust level variation in women’s responses
about whether concerns they raised during labour and birth were taken
seriously (Data source: 2019 CQC Maternity Survey)
Trust scores Low outliers High outliers Mean trust score
10
9
8
Question score out of 10
7
6
5
4
3
2
1
0
Trusts ranked by ascending question score
42. On personalisation of care, too, there are some positive results:
82% of women responded that they were ‘always’ involved in decisions about
their care during antenatal check-ups. Only 2% of women responded that they
were not involved.
79% of women reported that they were ‘always’ given enough time to ask
questions or discuss their pregnancy during antenatal check-ups, up by 2.4
percentage points since 2018 (77%).
90% of women responded that they were ‘always’ spoken to in a way they
could understand, up by 1.3 percentage points since 2018 (88%).
97% of women responded that their partner, or someone else close to them
involved in their care, was able to be involved as much as they wanted.
89% of women responded that they were ‘always’ treated with respect and
dignity, up by 1.4 percentage points since 2018 (88%).
84% of women responded that they ‘definitely’ had confidence and trust in the
staff caring for them, up by 1.4 percentage points since 2018 (82%).
25Figure 16. There are positive results showing improvement over time in
women’s responses to questions about the personalisation of their care.
(Data source: 2019 CQC Maternity Survey)
100%
96% 97%
94%
89%
90% 88%
87%
89%
Positive responses
85%
84%
80% 82%
79%
78%
77%
74%
70%
% Always given enough time to ask questions during pregnancy
% always spoke to in a way they could understand during antenatal care
% whose partner or womeone else close to them was able to be involved as much as
60% they wanted
% who were treated with respect and dignity during labour and birth
% who had confidence and trust in staff caring for them during labour and birth
50%
2013 2014 2015 2016 2017 2018 2019
Survey year
43. The area of maternity care in which women express the lowest confidence is
postnatal care. This has been the case for some time, but some significant
improvements are now being seen. This is expected to improve further as work
to improve postnatal care continues (as described in paragraph 75).
74% of women responded that their partner or someone else close to them
could stay with them in hospital after birth as much as they wanted. This was
up by 2.9 percentage points since 2018 (71%).
85% of women felt that their decisions about how they wanted to feed their
baby were always respected by their midwives. up by 2.2 percentage point
since 2018 (83%).
69% of women responded that they were given active support and
encouragement about feeding their baby, up by 6.1 percentage points since
2018 (63%).48% of women responded that they were given a choice about
26where their postnatal care would take place, up by 5.7 percentage points
since 2018 (42%).
Figure 17. There were significant recent improvements in women feeling
supported and encouraged about feeding their baby and women being
offered a choice of where their postnatal care would take place. However,
there is significant scope for further progress. (Data source: 2019 CQC
Maternity Survey)
100%
90%
80%
69%
70% 64% 63%
% Positive responses
61% 62%
60%
48%
50%
44% 42%
40%
30%
20% % of women 'Always' given active support and encouragement about feeding their
baby
10% % of women offered a choice of where their postnatal care would take place
0%
2013 2014 2015 2016 2017 2018 2019
Our staff: what is our workforce telling us?
44. National Maternity Indicators relating to organisational culture show some
improvement in the reported experience of midwives regarding their view of their
own organisation. Feedback on the learning culture has remained relatively
stable with eight out of ten midwives feeling that their organisation takes action to
ensure errors and near misses do not happen again. However, there is notable
variation at trust level in results for both questions regarding midwives’
experience of their organisation’s culture.
27Figure 18. The majority of midwives would recommend their trust as a place to
work or receive treatment. While there have been improvements in midwives
reported experience of learning culture within their organisations in recent
years there is notable variation at trust level and scope for further
improvement. (Data source: Analysis of NHS Staff Surveys 2016 to 2018, trust
variation charts are based on 2018 data)
90%
79.2% 79.4% 79.7%
80%
70% 74.9% 76.2%
73.0%
60%
50%
40%
% who 'Agree or Strongly Agree' that they would recommend their
30% trust as a place to work or receive treatment
20%
% who ‘agree’ or ‘strongly agree’ that "When errors, near misses or
incidents are reported, my organisation takes action to ensure that
10%
they do not happen again"
0%
2016 2017 2018
100%
Trust National
80%
60%
40%
20%
0%
100%
Trust National
80%
60%
40%
20%
0%
28Our staff: workforce numbers
45. The last ten years has seen a 15.5% increase in the numbers of Full Time
Equivalent (FTE) midwives from 19,282 in October 2009 to 22,271 in October
2019. The number of FTE Consultants and SAS Doctors13 in the Obstetrics and
Gynaecology Specialty Group has risen by 46.7% and 34.7% respectively over
the same time period, however there has been a 7.7% reduction in the number of
Junior doctors working in the specialty group from 633 to 576.
Figure 19. There have been increases in numbers of midwives and senior
doctors working in Obstetrics and Gynaecology over the last ten years,
however, junior doctor numbers have fallen. (Data source: NHS Digital
Workforce Statistics October 2019)
25,000 4,000
22,271
3,500
19,282
20,000
3,000
FTE Obs. and Gynae Doctors
2,480
2,500
FTE Midwives
15,000
1,706 2,000
10,000
1,500
1,000
5,000 633 576
500
494
- 375 -
Jun-13
Apr-14
Jun-18
Apr-19
May-11
Nov-13
May-16
Nov-18
Jul-10
Jul-15
Dec-10
Oct-11
Aug-12
Dec-15
Oct-16
Aug-17
Sep-09
Feb-10
Mar-12
Jan-13
Sep-14
Feb-15
Mar-17
Jan-18
Sep-19
Axis Title
Qualified Midwives FTE Obs. and Gynae. Consultants FTE
Obs. and Gynae. SAS Doctors FTE Obs. and Gynae. Junior Doctors FTE
New models of care
46. Better Births called for new ways of providing care to help make it safer and more
personalised.
47. Continuity of carer means that women receive care from the same midwife or
small team of midwives throughout antenatal care, labour and birth, and the
postnatal period. NHS England and NHS Improvement has an ambition for most
13
Specialty doctors, associate specialist doctors and staff grade doctors
29women to be receiving this type of care by March 2021. Continuity of carer
pathways have now been implemented across nearly all provider trusts. In
March 2019, 17.3% of women (10,535) were placed on a continuity of carer
pathway. The next milestone is end March 2020, when we have a national
ambition for 35% of women to be placed on a continuity of carer pathway.
48. Better Births called for investment in electronic, interoperable maternity records to
reduce the administrative burden of information recording and sharing, and
comprehensive digital sources of information for all women, which are
personalised and accessible via a digital tool or “Maternity Digital Care
Record”. The NHS Long Term Plan commits to offering 100,000 women access
to their maternity digital care records by March 2020, expanding to all women by
March 2024. Good progress has been made. 20 pilot sites have been
established and we passed the 100,000 target in September 2019, eight months
ahead of plan. By December 129,102 women had been offered access.
49. Perinatal mental illness affects up to 20% of new and expectant mothers and
covers a wide range of conditions, such as anxiety, depression and or
postpartum psychosis. Suicide is a leading cause of maternal death in the UK up
to one year post-partum according to reports by MBRRACE-UK (most recent
information 2015-17). Untreated perinatal mental illness has been estimated to
cost the NHS and social services around £1.2 billion for each annual cohort of
births.14 A significant proportion of this relates to adverse impact on the child.
Both the Five Year Forward View for Mental Health and the NHS Long Term Plan
set strong ambitions to improve access to specialist perinatal mental health
services for women in all areas of England, both inpatient Mother and Baby Units
(MBUs) and in the community, backed by significant financial investment (more
than £900m from 19/20-23/24).
50. Five years ago, 40% of the country had no access to specialist perinatal mental
health care. Since March 2019, there has been a specialist perinatal mental
health community service in every Sustainability and Transformation Partnership
(STP) area of England. 700 new specialist staff were recruited to community
services between 2017 and 2019 and over 13,000 additional women seen in
2018/19 (exceeding the ambition of 9,000). There are four new Mother and Baby
Units opened in areas of particular need (North West, South West, South East
Coast and East of England), with overall capacity to increase by 49% by March
2021.
51. Many Local Maternity Systems are investing in community hubs, which bring a
range of antenatal, postnatal and sometimes intrapartum care services together
in one setting closer to women’s homes. Data on the number of community hubs
14
LSE and Centre for Mental Health, 2014
30is not routinely collected, but the Maternity Transformation Programme team has
identified more than 100 that had opened by December 2019.
Summary
52. In summary, the data shows that good progress is being made over time in
reducing perinatal and maternal mortality, despite an overall increase in the
complexity of care. More needs to be done to understand the position with
regard to brain injuries, and more needs to be done both to tackle pre-term birth
and support pregnant women who smoke to give up, because these trajectories
are not on track to meet the national ambition, and to reduce inequalities.
53. Looking into the other clinical indicators which are available is also illuminating.
This highlights an increased willingness on the part of women and their clinicians
to use medical interventions, such as induction and caesarean section. At the
same time, the CQC survey results show that women are more likely to feel
listened to when they raise a concern during labour, and midwives are more likely
to report faith in the quality of the care they are providing. However, attention
needs to be given to understanding whether care is configured so as to minimise
other complications of childbirth, such as third or fourth degree perineal tears and
postpartum haemorrhage.
54. At the same time there is a degree of variation between different provider trusts.
Although this is not as significant as originally appears for perinatal mortality once
clinical risk, demographics and natural statistical variation is taken into account,
there remains a need to investigate and understand this variation at local and
national levels, to ensure that improvements to maternity care are being made
universally.
55. The next section of this report explains what has been done already to improve
maternity care and what further action is planned to go further faster.
31What are we doing to improve quality and
outcomes?
56. The Maternity Transformation Programme has been in place since 2016 to
implement the vision set out in Better Births for safer and more personalised
care, alongside the Department of Health and Social Care’s Safer Maternity Care
action plan.15 Ultimately all of its activity aims to support local service users,
commissioners and providers coming together as Local Maternity Systems
(LMSs) to deliver transformation on the ground.
Figure 20. Local Maternity Systems and NHS Regions geographic footprints
57. Nationally, the Maternity Transformation Programme Board determines a
consistent set of expectations for all LMSs, supported by a number of initiatives
to guide LMSs on the best way to improve services. It brings various
organisations together in partnership, including NHS England and NHS
Improvement, the Care Quality Commission, Health Education England, HSIB,
NHS Resolution, the Department of Health and Social Care, the Royal College of
Obstetricians and Gynaecologists and the Royal College of Midwives.
58. The programme has two core themes which run throughout all of its activities:
providing safer care, and providing more personalised care to women.
Workstreams are taken forward to ensure that these twin aims are met, and that
15
https://www.gov.uk/government/publications/safer-maternity-care-progress-and-next-steps
32all actions seek to address both. Over the last four years it has become
increasingly clear that actions to deliver more personalised care will also have a
significant impact on making care safer. This interdependency is important and
one which the programme seeks to demonstrate and emphasise through all of its
activities.
Making care safer
59. The Maternity Transformation Programme uses the PIER framework to shape its
interventions to improve safety:
Prevention
Identification
Escalation
Response
60. This report therefore also uses this framework to explain progress with rollout.
Prevention
61. In order to drive improvement in outcomes, the Maternity Transformation
Programme has put a number of initiatives in place, by seeking to identify best
practice and promoting universal implementation. The first group of initiatives
involves action targeted at changes to clinical practice and service models:
The Saving Babies’ Lives Care Bundle16 helps to reduce stillbirths and
neonatal deaths by improving management of four issues where there is a link
to these outcomes:
o smoking in pregnancy;
o detecting fetal growth restriction;
o raising awareness of reduced fetal movement; and
o improving effective fetal monitoring in labour.
A fifth element on reducing pre-term birth will directly impact on the number of
pre-term births, but, given that preterm birth carries a higher risk of perinatal
mortality and intrapartum brain injury, it will also help reduce these types of
outcome.
The Atain programme17 helps to reduce avoidable admission of full term
babies to a neonatal unit. It focuses on four key areas (hypoglycaemia,
16
https://www.england.nhs.uk/publication/saving-babies-lives-version-two-a-care-bundle-for-reducing-
perinatal-mortality/
17
https://improvement.nhs.uk/resources/reducing-admission-full-term-babies-neonatal-units/
33jaundice, respiratory conditions and asphyxia (hypoxic–ischaemic
encephalopathy)) so that avoidable harm is reduced, separation of mother
and baby is minimised and that any additional neonatal care required is
provided by keeping mothers and babies together where safe to do so.
Continuity of carer is currently being rolled out to most women. Women who
receive continuity of carer are 16% less likely to lose their baby, 19% less
likely to lose their baby before 24 weeks and 24% less likely to experience
pre-term birth.
We are improving access to specialist perinatal mental health services.
As set out in paragraph 50 above, there has been a major expansion of
services, underpinned by significant investment. This will help reduce
maternal mortality given that suicide is the biggest cause between six weeks
and a year after birth.
We are taking action to increase the proportion of women at less than 27
weeks’ gestation who are giving birth in a hospital with appropriate on site
neonatal care. This will help to reduce intrapartum brain injuries and
neonatal mortality as it will ensure women and their babies get expert
obstetric and neonatal care.
62. In addition, further action targeted at change to clinical practice and service
models is in the planning stage:
Continuity of carer will be rolled out to 75% of women with a Black, Asian
and minority ethnic (BAME) background and from the most deprived
areas by 2024 on the principle of proportionate universalism, so as to reduce
inequalities in stillbirth and preterm birth rates.
The NHS Long Term Plan sets out a number of commitments to improve
access to and the quality of perinatal mental health services. These include
maternity outreach clinics, which will integrate maternity, reproductive
health and psychological therapy for women experiencing mental health
difficulties directly arising from, or related to, the maternity experience.
Networked maternal medicine will enable every woman in England with
acute and chronic medical problems to have timely access to specialist
preconceptual advice and care during and after pregnancy from 2021/22.
This will directly tackle maternal mortality, but is also likely to have an impact
on perinatal mortality and intrapartum brain injuries.
34You can also read