2021 National Impact Assessment of the Centers for Medicare & Medicaid Services (CMS) Quality Measures Report
←
→
Page content transcription
If your browser does not render page correctly, please read the page content below

2021 National Impact
                                                      Assessment of the
                                                      Centers for Medicare
                                                      & Medicaid Services
                                                      (CMS) Quality
                                                      Measures Report

                                                      June 2021

                           Confidential Material: Not for Dissemination or Disclosure – CMS Internal Use Only
2021 National Impact Assessment of CMS Quality Measures Draft Report (Draft 3.0)                                Page 1
2021 National Impact
                                                        Assessment of the
                                                        Centers for Medicare &
                                                        Medicaid Services (CMS)
                                                        Quality Measures Report

                                                        Prepared for CMS by Health Services
                                                        Advisory Group, Inc. (HSAG)

                                                        Suggested citation: Centers for Medicare & Medicaid
                                                        Services. 2021 National Impact Assessment of the Centers
                                                        for Medicare & Medicaid Services (CMS) Quality Measures
                                                        Report. Baltimore, MD: U.S. Department of Health and
                                                        Human Services; 2021. Available at:
                                                        https://www.cms.gov/Medicare/Quality-Initiatives-Patient-
                                                        Assessment-Instruments/QualityMeasures/National-Impact-
                                                        Assessment-of-the-Centers-for-Medicare-and-Medicaid-
                                                        Services-CMS-Quality-Measures-Reports

                           Confidential Material: Not for Dissemination or Disclosure – CMS Internal Use Only
2021 National Impact Assessment of CMS Quality Measures Draft Report (Draft 3.0)                                Page 2
Table of Contents
Executive Summary: Overall Results.................................................................................... 1
Introduction........................................................................................................................... 3
A Guide to the Report............................................................................................................ 4
    Analytic Terms and Methods ............................................................................................ 6
    Report Organization ......................................................................................................... 7
1.    Patient Safety.................................................................................................................. 8
      Patient Safety Measure Portfolio ....................................................................................... 8
          Impact of Patient Safety Key Indicators ....................................................................... 9
          Opportunities for Improvement.................................................................................. 10
          Addressing Gaps in Performance Measurement ......................................................... 10
2.    Person and Family Engagement ................................................................................... 11
      Person and Family Engagement Measure Portfolio ......................................................... 11
          Impact of Person and Family Engagement Key Indicators.......................................... 12
          Opportunities for Improvement.................................................................................. 13
          Addressing Gaps in Performance Measurement ......................................................... 13
3.    Communication and Care Coordination ...................................................................... 14
      Communication and Care Coordination Measure Portfolio............................................... 14
          Impact of Communication and Care Coordination Key Indicators .............................. 15
          Opportunities for Improvement.................................................................................. 16
          Addressing Gaps in Performance Measurement ......................................................... 16
4.    Effective Prevention and Treatment............................................................................. 17
      Effective Prevention and Treatment Measure Portfolio .................................................... 17
          Impact of Effective Prevention and Treatment Key Indicators..................................... 18
          Opportunities for Improvement.................................................................................. 19
          Addressing Gaps in Performance Measurement ......................................................... 20
5.    Working With Communities ........................................................................................ 21
      Working With Communities Measure Portfolio ............................................................... 21
          Working With Communities Key Indicators................................................................ 22
          Addressing Gaps in Performance Measurement ......................................................... 22
6.    Affordable Care............................................................................................................ 23
      Affordable Care Measure Portfolio.................................................................................. 23
          Impact of Affordable Care Key Indicators.................................................................. 24
          Opportunities for Improvement.................................................................................. 24
          Addressing Gaps in Performance Measurement ......................................................... 24
7.    National Provider Survey of Home Health Agencies.................................................... 26
References............................................................................................................................ 27

2021 National Impact Assessment of CMS Quality Measures Report                                                                    Page i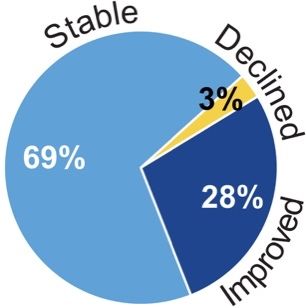
Executive Summary:                                             This report summarizes the quality and
                                                                 efficiency impacts associated with
  Overall Results                                                measures used in CMS quality programs.
The Impact Assessment examines data-driven results that support progress toward CMS
objectives for quality measurement that addresses high-impact measure areas that safeguard
public health, is meaningful to patients and providers, minimizes burden for providers, is
outcome-based whenever possible, identifies significant opportunities for improvement, and
supports a transition to population-based payment informed by all-payer data.

CMS Measure Portfolio
                26                             *316                  *357           *13                *686
      Quality Programs                 Outcome or Cost             Process       Structure      Total Measures
 *Measures in use for the 2020 performance period are counted individually based on published rules or documentation
 for each CMS program; duplicate counts can occur when multiple programs use the same measure. An internal CMS
 study using a different methodology identified 515 unique measures.1

Focus on Outcomes
Percentage of total measures that address outcomes or cost:

Measure Performance Trends
336 measures with ≥ 3 years of data from 2013 to 2018 were analyzed.
See Appendix E for analytic results for all measures.

                        91% of the analyzed measures had
                       improved or stable performance.

Reducing Burden
Selective reductions in the number of
measures can reduce reporting burden.

                                                           Digital quality measures use data from electronic
                                                           health records, health information exchanges, clinical
                                                           registries, case management systems, electronic
                                                           administrative claims systems, electronically submitted
                                                           assessments, and wearable devices.2(p. 84849)

  All-Payer Reach
  50% of all measures can be calculated using data from patients covered by any payer, not
  just from Medicare beneficiaries.

2021 National Impact Assessment of CMS Quality Measures Report                                                 Page 1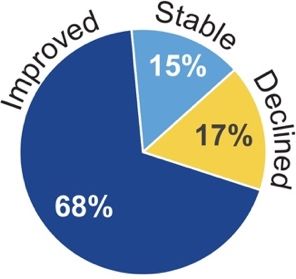
EXECUTIVE SUMMARY – OVERALL RESULTS

Key Findings
High-impact measurement in areas that safeguard public health:
•   Among 153 Key Indicator measures selected by national experts, 51% had improved
    performance between 2013 and 2018.
• Potential costs avoided, derived from the trending series, were feasible to calculate when
    beneficiary-level data and cost estimates were available; analysis of 15 Key Indicator
    measures resulted in a combined estimate of costs avoided between
    $29.6 billion and $51.9 billion in 2018 dollars.
• Among 59 Key Indicator measures with a disparity in the first year,
    34% showed improvement in at least one measure performance
    comparison. Disparities between subgroups and reference groups
    improved in comparisons based on income (9 of 34), dual eligibility (4 of 18), urban/rural
    location (8 of 20), and race/ethnicity (24 of 120).
Meaningfulness to patients and caregivers: Qualitative interviews of 21 Medicare
beneficiaries and 10 caregivers confirmed the relevance of CMS quality priorities and associated
Key Indicator topics to their personal health care experiences.3
Meaningfulness to providers: In a nationally representative survey of 1,052 home health
agencies (HHAs), 91% indicated that CMS measures are clinically important, and 86% indicated
that better measure performance reflects improvements in care.
Focus on outcomes: Nearly half (46%) of all CMS measures in 2020 were outcome measures,
and four of six health care quality priorities evaluated had an increase in the proportion of
outcome or cost measures between 2015 and 2020 performance years.
Reducing reporting burden: The number of measures in quality programs decreased by 24%
from 2015 to 2020. Digital measures, which employ less burdensome methods of data collection
or submission, made up 80% of the overall CMS measure portfolio in 2020.
Identifying areas of opportunity for improvement:
Measure trends: 9% of all measures analyzed and 5% of Key Indicator measures had declining
performance from 2013 to 2018.
                 Disparities: Disparities that were present at baseline and remained in the most
                 recent year of the trending series were found in measure performance
                 comparisons based on race/ethnicity (101 of 120), income (27 of 34), dual
                 eligibility (15 of 18), and urban/rural location (11 of 20). New disparities arose
                 in comparisons based on income (5 of 70), urban/rural location (5 of 240), and
                 race/ethnicity (36 of 252).
Home health providers: Surveyed HHAs cited challenging patient mix, staff behavior, and staff
turnover as barriers to quality improvement. A minority of HHAs (34%) reported that community
providers could receive key patient data via their electronic health record (EHR) systems.
Summary: The results in this report suggest that the use of CMS quality measures likely
contributed to improving quality and reducing health care costs while driving changes within the
national health care system with respect to six health care quality priorities. Furthermore, CMS
has taken steps to reduce reporting burden, increase the proportion of outcome measures, and
better understand patient and provider perspectives. Measures with declining performance and
indications of disparities represent key opportunities for improvement.

2021 National Impact Assessment of CMS Quality Measures Report                                 Page 2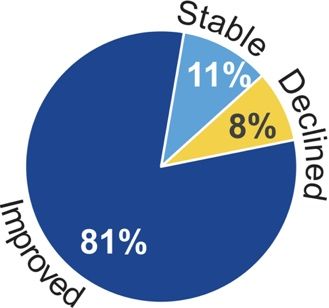
Introduction

    F
         or over 20 years, CMS has been the leader in establishing quality standards and
         programs for beneficiaries to improve health care for all Americans. As required under
         section 1890A(a)(6) of the Social Security Act, CMS assesses the quality and efficiency
         impact of endorsed measures.i Impact, for purposes of this report, means progress
toward achieving CMS objectives related to health care quality priorities. Addressing topics of
interest in a recent Government Accountability Office report,4 this report systematically assesses
measure performance at the national level, which informs decisions to develop, maintain, or
remove measures; substantiates impact of measures on clinical care; and examines measures by
priority to determine whether objectives are being addressed.
CMS seeks to maximize return on investment for beneficiaries through impactful quality
initiatives and programs and ensure a modern, sustainable Medicare program for future
generations. CMS employs quality measures to support a patient-centered health care delivery
system, grounded in accountability and value, while reducing burden for providers. Through
public reporting of measure results, CMS ensures transparency, drives improvement, and
supports patients and caregivers in making informed health care decisions. The 2021 Impact
Assessment Report comprehensively assembles and analyzes evidence to guide these efforts.
This report categorizes 686 CMS measures into six health care quality priorities: Patient Safety,
Person and Family Engagement, Communication and Care Coordination, Effective Prevention
and Treatment, Working With Communities, and Affordable Care. Of the 686 CMS measures,
153 were selected and grouped into Key Indicators to track progress in measurement areas critical
to providing high-quality care and improving outcomes. This report retains 58 of the 62 Key
Indicator measures included in the 2018 Impact Assessment Report (see Appendix B) and
designates 59 Key Indicators to represent five of the six health care quality priorities.
Importantly, sections of this report highlight direct quotes from 31 patients and caregivers
interviewed for the Impact Assessment to illustrate how consumers relate to aspects of CMS’s
                                                           measure portfolio and Key Indicators.
   Meaningful to Patients                                  Engaging patients aligns with the aim
   “Everything was in place for me to come                 of CMS and its parent agency, the U.S.
   home with support. … I’m sure that’s not the            Department of Health and Human
   case for many people. It must be terrifying to
                                                           Services (HHS), to put patients first.
   wonder what is going to happen next. Where do I go?
   Who is going to take care of me?”                       CMS includes patient experience,
                                                           engagement, and self-reported outcome
measures in its programs and seeks the input of patients, caregivers, and families throughout
measure development and implementation, as well as in the production of this report.
The Impact Assessment aligns with Meaningful Measures, a 2017 initiative focusing CMS
performance measurement and quality improvement initiatives on issues such as hospital- and
nursing home-acquired infections, behavioral health, sepsis, maternal health, and complications
of chronic disease.5 Meaningful Measures also promotes electronic exchange of information to
modernize and facilitate communication between providers and with patients. Through
interoperability of health information systems, ready access to patient records, and transparency
in public reporting of measure results, CMS supports the autonomy of patients and caregivers in
making informed health care decisions.

i
    This report assesses the quality and efficiency impact of endorsed measures and includes a limited number of non-endorsed measures.

2021 National Impact Assessment of CMS Quality Measures Report                                                                 Page 3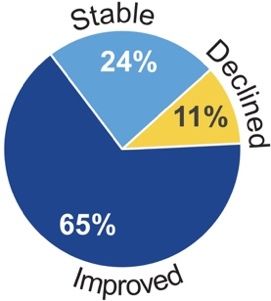
A Guide to the Report

     T
         he 2021 Impact Assessment Report organizes content by national health care quality
         priorities, examining measure performance and the following measure portfolio
         characteristics in an easy-to-read format:
Meaningful to Patients: Interviews of 21 Medicare beneficiaries and 10 caregivers were
conducted in 2018 to highlight the voice of the patient.3 Respondents are quoted throughout the
report discussing their health care experiences, quality concerns, and priorities.
Measure Portfolios: Measures for the 2020 performance period (see Appendix B), counted ii by
type (outcome, process, structure, cost) across CMS quality programs, are examined as follows:
    • Outcome measures as an increasing percentage of the measure portfolio reflect CMS
        efforts to measure what is most meaningful to patients and clinicians.
    • Measure performance trends, based on 2013–2018 data and measured on a relative
        scale, are deemed improving when the average annual percentage change (AAPC) in
        scores is greater than 1% in a favorable direction, declining when AAPC is greater than
        1% in an unfavorable direction, and stable when AAPC is less than or equal to 1%.6
    • Reducing reporting burden, a goal of the Patients Over Paperwork Initiative aimed at
        freeing providers to focus on patient care,7 has two metrics of progress: overall reduction
        of measures in CMS programs from performance periods 2015 to 2020 and the
        percentage of measures with at least one digital option for collecting or submitting data.
    • All-payer reach represents the percentage of measures for the 2020 performance period that
        can be calculated using data from patients covered by any payer, not just from Medicare
        beneficiaries, as determined by examining measure specifications. Such measures advance
        a coordinated approach of population-based payment informed by all-payer data.
Key Indicators: Each measure or group of measures designated as a Key Indicator tracks
progress critical to improving quality of care and individual outcomes across settings. Federal
agency technical experts and nationally credentialed stakeholders serving on a technical expert
panel (including four patient/caregiver representatives) provided essential input in prioritizing
Key Indicators to represent each CMS quality priority. Each Key Indicator table displays trend
results for that quality priority by setting. Table 1 identifies the programs associated with each
setting and designates which programs use measures designated as Key Indicators. Results are
summarized as improved ( ), declined ( ), stable ( ), or mixed ( ) when different results
are found for component measures or for the same measure in different settings. Appendices C
and D detail Impact Assessment Methods and results for Key Indicator measures.
Impact of Key Indicators: Each quality priority section highlights selected patient impact or
cost-avoided results reflecting improvement in measure performance over the period of trend
analysis. Selected improvement data are presented for measure trends reflecting the greatest
magnitude of relative change, based on the AAPC statistic. Disparities for subgroups of interest
that have improved since the first year of the data series are presented in measure performance
comparisons based on race/ethnicity, urban/rural, income, and dual eligibility.
Opportunities for Improvement: Findings of declining performance for Key Indicator
measures are presented along with disparities that worsened between 2013 and 2018 in
comparisons for subgroups of interest.
ii
 Measures in use for the 2020 performance period are counted individually based on published rules or documentation for each
CMS program; duplicate counts can occur when multiple programs use the same measure.

2021 National Impact Assessment of CMS Quality Measures Report                                                       Page 4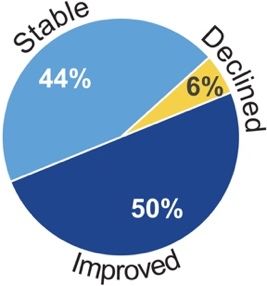
A GUIDE TO THE REPORT

Addressing Gaps in Performance                       Table 1. CMS Measurement Program Settings Included
Measurement: CMS evaluates                           in the Impact Assessment Report
gaps in high-impact areas when                        Acute Care
                                                      *Ambulatory Surgical Center Quality Reporting
considering future measure                            *Hospital-Acquired Conditions Reduction Program
initiatives. A review of reports by                   *Hospital Inpatient Quality Reporting
national stakeholder groups (e.g., the                *Hospital Outpatient Quality Reporting
National Quality Forum Measure                         Hospital Readmissions Reduction Program
Applications Partnership) and final                   *Hospital Value-Based Purchasing
rules in the Federal Register                         *Inpatient Psychiatric Facility Quality Reporting
identified topics of concern to CMS                    Medicare and Medicaid Promoting Interoperability Program
                                                      *Prospective Payment System-Exempt Cancer Hospital
that existing measures do not fully                   Quality Reporting Program
address. Other performance                            Post-Acute and Long-Term Care
measurement gaps or measures in                     . *Dialysis Facility Compare
development could exist but were not                . *End-Stage Renal Disease Quality Incentive Program
identified using the sources                        . *Home Health Quality Reporting Program
documented for this report.                         . *Hospice Quality Reporting Program
                                                    . *Inpatient Rehabilitation Facility Quality Reporting Program
Measurement gaps identified from                    . *Long-Term Care Hospital Quality Reporting Program
the key sources are omitted from the                . Skilled Nursing Facility Quality Reporting Program
gap tables in this report when                      . Skilled Nursing Facility Value-Based Purchasing Program
emerging measures (those finalized                  . *Nursing Home Quality Initiative/Nursing Home Compare
                                                      Clinician and Accountable Care Organization (ACO)
through federal rulemaking for                      . *Medicare Shared Savings Program
implementation in a CMS program                       *Merit-Based Incentive Payment System (MIPS)
for performance year 2019 or later)                   Managed Care, Private Market, and Medicaid
or measures in development could                    . Medicare Part C & D Display Measures
address the gaps. (Appendix F lists                 . *Medicare Part C & D Star Ratings
the gaps, as well as measures or                    . Medicaid Adult Core Set
                                                    . Medicaid Child Core Set
concepts in development that could
                                                    . Quality Rating System for Qualified Health Plans
fill measurement gaps.) Recently                      *Fee-f or-Service Consumer Assessment of Healthcare
implemented measures targeting                        Providers and Systems (CAHPS®)
population health issues such as the                  *The program uses measures designated as Key Indicators in the
                                                      2021 Impact Assessment Report.
opioid crisis are among those                         Notes: Fee-for-service (FFS) CAHPS fulfills a statutory requirement
identified as important emerging                      to facilitate comparisons of Medicare managed care with care in FFS
measures.                                             Medicare; therefore, the survey is included under Managed Care.
                                                      Eleven specialized facilities in the nation are designated Prospective
For information on how this report                    Payment System (PPS)-Exempt Cancer Hospitals.
                                                      “Nursing home” refers to both Medicare- and Medicaid-certified facilities.
differs from the previous Impact
Assessment, please see Impact Assessment Methods (Appendix C).
Data for this Impact Assessment were reported before the global spread of coronavirus disease;
thus, the findings represent an assessment of health care structure, process, and outcome
measures pre-pandemic. CMS will revise methods for the 2024 Impact Assessment Report to
assess the impact of measures in a post-pandemic health care system.
Attribution of the factors contributing to positive changes in measure performance rates is
beyond the scope of these analyses, but given the central role of quality measures in CMS
programs and initiatives, it is plausible that measurement has contributed to at least some of the
improvements characterized in this report.

2021 National Impact Assessment of CMS Quality Measures Report                                                            Page 5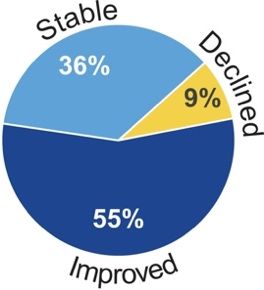
A GUIDE TO THE REPORT

Analytic Terms and Methods
The Impact Assessment Report describes national measure scores, trends, disparities, and
associated findings to present an overview of the impact of CMS quality and efficiency
measures. Refer to Impact Assessment Methods (Appendix C) for details of the analyses
discussed in this report and an explanation of their limitations.
Achievable results represent a national performance goal based on Achievable Benchmarks of
Care (ABC)®,8 calculated using the first data point of weighted mean scores among highest-
ranking providers. CMS program methodologies may produce different results.
Average annual percentage change (AAPC) is a statistic derived from log-linear regression
and used to determine trends in measure performance and disparities in relative terms.
Beneficiary-level data, whenever possible, were requested directly from CMS quality programs
and their respective contractors.
Cost-avoided analysis interprets improvement in national measure scores in terms of potential
costs avoided. Cost estimates were derived from the trending series. Per-event cost estimates from
published research and grey literature9-25 were converted into 2018 dollars26 and multiplied by the
number of additional favorable events estimated in the patient impact analysis. When multiple per-
event cost estimates were gleaned from the literature, total costs avoided were expressed as a range
of values.
Direct standardization, based on each age-sex stratum of the first year of trend data, was
employed when beneficiary-level data or stratified outcome measure scores were available. No
other adjustments were made. An exception is noted when measure scores were adjusted by the
data owner and were not available in raw form.
Disparities analyses focused on comparisons of measure performance for population subgroups
based on sex, age, race, ethnicity, region, urban/rural location, income, or dual-eligibility
(Medicare and Medicaid) status.
National provider surveys: CMS conducts nationally representative surveys to assess how
health care providers are responding to CMS quality measures and the impact of their use in
well-established quality measurement programs. Prior surveys have evaluated the hospital and
nursing home settings. For this report, CMS evaluated the home health setting.
Patient impact analysis was performed on Key Indicator measures with beneficiary-level trend
data. For each year of data, the difference between the number of observed numerator events
and the expected number if the rate had remained stable (based on the current denominator size)
was calculated. Annual impacts were summed to approximate the total number of patients
affected by a favorable change in measure scores. For rolling multi-year denominators, only the
first and last years of a data series were included to avoid double-counting.
Trends in national performance were interpreted from an analysis of measure scores using at least
three (2016–2018) and at most six (2013–2018) annual data points. The AAPC was combined
with 90% confidence intervals to characterize the precision in measure trend estimates.

2021 National Impact Assessment of CMS Quality Measures Report                                Page 6
A GUIDE TO THE REPORT

Report Organization
Chapters 1–6 present analyses of the Key Indicators and other data associated with each of the
six health care quality priorities: Patient Safety (12 Key Indicators), Person and Family
Engagement (13 Key Indicators), Communication and Care Coordination (seven Key Indicators),
Effective Prevention and Treatment (20 Key Indicators), Working With Communities (no Key
Indicators identified), and Affordable Care (seven Key Indicators). The report concludes with
Chapter 7, a summary of findings from a national provider survey and interviews of quality
leaders in the home health setting.
Appendix A acknowledges contributors to the report; Appendices B–F contain supporting material
for Chapters 1–6; Appendix G and Appendix H describe the national provider survey and
interviews highlighted in Chapter 7.

2021 National Impact Assessment of CMS Quality Measures Report                          Page 7
Reducing infections and other harm associated with the
  1. Patient Safety                          delivery of health care is essential to ensure better outcomes
                                             for patients.
                                                                        “I wish that    “My dad loves it [in the
  Meaningful to Patients                                                there were      nursing home]. He’s so
  “We all have heard of these mega-                                     better          secure. …. I’m just
  infections that antibiotics can’t seem to                             monitoring …    happy for him that he’s
  treat … People have died [when] they                                  more of a       there with staff 24/7 in
  either waited too long or weren’t treated properly.”                  presence.”      case he does fall.”

Patient Safety Measure Portfolio
                18                          *59                   *33             *0                *92
      Quality Programs                  Outcome                  Process      Structure       Total Measures
*Measures in use for the 2020 performance period are counted individually based on published rules or documentation
for each CMS program; duplicate counts can occur when multiple programs use the same measure.

Focus on Outcomes
Percentage of total Patient Safety measures that address outcomes:

Measure Performance Trends
47 Patient Safety measures with ≥ 3 years of data from 2013 to 2018
were analyzed. See Appendix E for analytic results for all measures.

              92% of the analyzed Patient Safety measures had
                   improved or stable performance.

Reducing Burden
Selective reductions in the number of
measures can reduce reporting burden.

                                                           Digital quality measures use data from electronic
                                                           health records, health information exchanges, clinical
                                                           registries, case management systems, electronic
                                                           administrative claims systems, electronically submitted
                                                           assessments, and wearable devices.2(p. 84849)

  All-Payer Reach
  86% of all Patient Safety measures can be calculated using data from patients covered by
  any payer, not just from Medicare beneficiaries.

2021 National Impact Assessment of CMS Quality Measures Report                                              Page 8
PATIENT SAFETY
Clinician/
Managed
Patient Safety Key Indicators
Acute
Acute
Post-
Trends by Setting
ACO
Care
Healthcare Harm
CT or MRI for Stroke
Fall Risk Screening
Falls With Major Injury
New or Worsened Pressure Ulcers
Restraints
THA/TKA Complications
Healthcare-Associated Infections
CAUTI
CLABSI
CDI
MRSA Infection
Procedure-Specific Surgical Site Infection
Urinary Tract Infection
Note: For a listing of component measures for each Key Indicator, see Appendix B.
Legend: = Improving = Stable = Declining = Mixed
Impact of Patient Safety Key Indicators
Corresponding to topics in the preceding table, the highlighted analytic results represent the
greatest impacts associated with improvement in Key Indicator measure scores.
• 19,829 more patients received a head computed tomography (CT) or magnetic
resonance imaging (MRI) for stroke within 45 minutes of arrival at the emergency
department (from 59.0% in 2013 to 72.0% in 2018). Disparities for this measure detected
in 2013 were no longer evident for residents of medium metro and micropolitan areas and
for middle-income beneficiaries. Disparities for American Indians/Alaska Natives, those
with low income, and residents of noncore (rural) areas narrowed.
• Long-stay nursing home residents (2013–2018) experienced
declining use of physical restraints (from 1.5% to 0.3%) and
fewer urinary tract infections (from 6.1% to 2.7%).
• Total hip/knee arthroplasty complications occurred in 6,863
fewer acute care hospital admissions than expected (from 3.3% in 2013 to 2.6% in 2018).
• Of the following healthcare-associated infections, 80,040 fewer than expected were
reported; estimated costs avoided ranged from $173.3 million to $1.5 billion, including:
o Catheter-associated urinary tract infection (CAUTI): 8,876 fewer infections
in acute care hospitals (2015–2018) and long-term care hospitals (2016–2018);
$4.6 million–$66.4 million.
o Central line–associated bloodstream infection (CLABSI): 10,640 fewer
infections in acute care hospitals (2015–2018) and long-term care hospitals
(2016–2018); $47.5 million–$284.7 million.
2021 National Impact Assessment of CMS Quality Measures Report Page 9PATIENT SAFETY
o Clostridioides difficile infection (CDI): 60,524 fewer infections in acute care
hospitals (2015–2018) as well as in inpatient rehabilitation facilities and long-
term care hospitals (2016–2018); $121.2 million–$1.2 billion.
• 3,146 fewer methicillin-resistant Staphylococcus aureus (MRSA) infections than
expected occurred in acute care hospitals, where standardized infection ratio (SIR)
decreased from 1.0 in 2015 to 0.8 in 2018, and 3,175 fewer procedure-specific surgical
site infections than expected occurred.
Opportunities for Improvement
Among Patient Safety Key Indicators, declining measure performance is noted.
• Long-stay nursing home patients experienced falls with major injury at rates increasing
on average 1.1% per year (from 3.2% in 2013 to 3.4% in 2018).
• CAUTI increased by 3.1% per year on average in inpatient rehabilitation
facilities as SIR increased from 1.1 in 2016 to 1.2 in 2018.
• No worsening disparities were identified for the two Patient Safety Key
Indicator measures with available disparities data.
Addressing Gaps in Performance Measurement
CMS evaluates gaps in high-impact areas when considering future measure initiatives. CMS is
addressing previously identified measurement gaps for this health care quality priority through
measures in development focused on maternal morbidity/mortality, healthcare-associated
infections, complications of total hip/knee arthroplasty (THA/TKA), excessive radiation for CTs,
and long-term catheter rate. These measures, once developed, can be considered for use in CMS
programs; one emerging measure addresses surgical complications for localized prostate cancer.
Table 2 summarizes newly identified measurement gaps from key sources published from
January 1, 2018, to March 31, 2020; an X indicates a gap in one or more programs within a
setting. Appendix F contains a comprehensive list of measurement gaps, emerging measures,
and measures in development.
Clinician/
Managed
Table 2. Patient Safety Measurement Gaps by Clinical Setting
Acute
Acute
Post-
ACO
Diagnostic quality and safety X X Care
HAC risk-adjusted outcomes; all-cause harm X
Harms occurring from care delivery; potentially harmful drug-drug interactions X
Hospice safety (e.g., falls, skin integrity) X
Maternal morbidity/mortality (e.g., poor birth outcomes, complications) X
Medication side effects, infections in ESRD patients X
Preventable healthcare harm (e.g., falls, hypoglycemia, pressure injury) X
Procedures in ambulatory surgery centers formerly performed in hospitals X
Saf ety planning for suicidal ideation, assaults, and violence X
Sepsis care, surgical site infections, healthcare-associated infections X X
2021 National Impact Assessment of CMS Quality Measures Report Page 10CMS encourages patients and caregivers to engage with
2. Person and Family their providers and communicate their personal
Engagement preferences and goals.
Meaningful to Patients “I no longer take the “My daughter knows
medication because it was what our final wishes
“I would like more one-on-one not giving the desired effect. are, and she knows
[time] with any doctor than I I talked that over with my that we don’t want …
see now, but I do like the care doctor, and we came to the extravagant means
I’m getting.” consensus that I could stop.” to keep us alive.”
Person and Family Engagement Measure Portfolio
20 *103 *27 *4 *134
Quality Programs Outcome Process Structure Total Measures
*Measures in use for the 2020 performance period are counted individually based on published rules or documentation
for each CMS program; duplicate counts can occur when multiple programs use the same measure.
Focus on Outcomes
Percentage of total Person and Family Engagement measures that address outcomes:
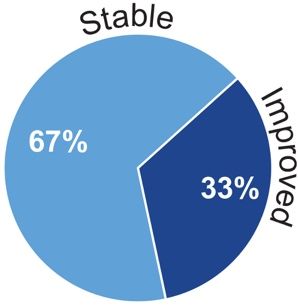
Measure Performance Trends
101 Person and Family Engagement measures with ≥ 3 years of data
from 2013 to 2018 were analyzed. See Appendix E for analytic results for
all measures.
97% of the analyzed Person and Family Engagement measures
had improved or stable performance.
Reducing Burden
Selective reductions in the number of
measures can reduce reporting burden.
Digital quality measures use data from electronic
health records, health information exchanges, clinical
registries, case management systems, electronic
administrative claims systems, electronically submitted
assessments, and wearable devices.2(p. 84849)
All-Payer Reach
45% of all Person and Family Engagement measures can be calculated using data from
patients covered by any payer, not just from Medicare beneficiaries.
2021 National Impact Assessment of CMS Quality Measures Report Page 11PERSON AND F AMILY ENGAGEMENT
Clinician/
Managed
Person and Family Engagement Key Indicators
Acute
acute
Post-
ACO
Care
Trends by Setting
End of Life Care
Comprehensive Assessment at Admission
Experience of Care
Care Coordination
Care Transition
Courtesy and Respect
Getting Needed Care and Appointments Quickly
Getting Needed Drugs
Overall Rating
Provider Communication
Responsiveness of Staff
Shared Decision-Making
Functional Status
Functional Status Assessment
Patient-Reported Functional Outcome
Provider-Reported Functional Outcome
Note: For a listing of component measures for each Key Indicator, see Appendix B.
Legend: = Improving = Stable = Declining = Mixed
Impact of Person and Family Engagement Key Indicators
Corresponding to topics in the preceding table, the highlighted analytic results represent the
greatest impacts associated with improvement in Key Indicator measure scores.
• Hospice patients increasingly received comprehensive assessment at admission from
2015 to 2018, including 118,139 more patient stays with pain screenings
than expected (from 93.7% to 98.0%) and 302,394 more clinical pain
assessments based on screening results (from 70.5% to 95.0%). An
additional 36,491 hospice patients treated with an opioid were given
a bowel regimen (from 93.5% to 97.6%). Also, 148,666 more than
expected had their beliefs/values addressed (from 92.7% to 98.1%), and disparities in
that assessment were no longer evident among multiracial patients.
• More patients treated in PPS-exempt cancer hospitals (2013–2018) gave positive ratings of
care: 10,248 more for care transitions; 24,796 more for responsiveness of staff.
• Disparities in overall rating of care for dialysis facilities and staff narrowed for Asians
and were no longer evident for Native Hawaiian/Pacific Islanders.
• Disparities in ratings of provider communication about medications narrowed for Asian
beneficiaries treated at PPS-exempt cancer hospitals and were no longer evident in
Native Hawaiian/Pacific Islanders’ ratings of nephrologists' communication and caring
within in-center hemodialysis.
• From 2013 to 2018, provider-reported functional outcomes for home health patients
showed improvement in bed transferring in 2.7 million more episodes than expected; in
2021 National Impact Assessment of CMS Quality Measures Report Page 12PERSON AND F AMILY ENGAGEMENT
ambulation-locomotion in 2.4 million more episodes; and in bathing in 1.7 million more
episodes.
• Short-stay nursing home patients also experienced improvements of 1.4% per year in
provider-reported functional outcomes (from 63.1% in 2016 to 65.0% in 2018).
Opportunities for Improvement
Declining measure performance and worsening disparities are noted.
• Among hospice patients who received comprehensive assessment at admission from
2015 to 2018, disparities in getting pain assessments worsened for Asian and Native
Hawaiian/Pacific Islander beneficiaries.
• 83.7% of traditional fee-for-service Medicare beneficiaries in 2018 reported they were
able to get needed care including care from specialists, representing a decline from
86.2% in 2013. Disparities worsened for Asian beneficiaries.
• Among Medicare Advantage (MA) beneficiaries reporting whether they
could get needed care and appointments quickly, disparities worsened
for American Indian/Alaska Native and Asian beneficiaries.
• Positive ratings of care for responsiveness of staff in PPS-exempt cancer
hospitals reflected worsening disparities for Black and Hispanic patients.
Addressing Gaps in Performance Measurement
CMS is addressing previously identified measurement gaps in high-impact areas through
measures in development and emerging measures for this health care quality priority:
• 15 measures in development focus on functional status assessment, including patient
goal-setting and achievement, patient experience for palliative care and behavioral health,
and patient-reported outcome-based measures.
• Nine emerging measures for clinicians include patient experience surveys for ACOs and
managed care, functional status assessment following surgical procedures, change in
functional status, and symptom severity assessment.
Table 3 summarizes measurement gaps newly identified from key sources published from
January 1, 2018, to March 31, 2020; an X indicates a gap in one or more programs within a
setting. Appendix F contains a comprehensive list of gaps identified from key sources. Clinician/
Managed
Table 3. Person and Family Engagement
Acute
Acute
Post-
ACO
Care
Measurement Gaps by Clinical Setting
Activities of daily living: maintenance, stabilization, or improvement X
Advance directives; patient goals aligned with care provided X X
Caregiver engagement, patient empowerment X
Follow-up instruction adherence: support for patients X
Functional outcomes: patient-reported, functional outcomes, changes in
X X
f unctional status, quality of life
Goal-setting and treatment planning, including reassessment X
Medication adherence capturing rational nonadherence and patient preference X
Medication management at the end of life X
Symptom management outcomes X
2021 National Impact Assessment of CMS Quality Measures Report Page 13Access to personal health information
3. Communication and whenever and however patients and clinicians
Care Coordination need it can lead to better patient outcomes.
“She was taking 27 “If he was in a car accident
Meaningful to Patients different medications. or something and
“I’m very impressed with the … Surely that could be I wasn’t there, it
communication between the [general a warning sign—hey, would be extremely
practitioner] and my cardiologists. Either why is this individual important [to know]
via telephone or computer, all my on 27 medications in he’s on medication and he
information is available … instantly.” one day?” can’t have this antibiotic.”
Communication and Care Coordination Measure Portfolio
22 *53 *54 *0 *107
Quality Programs Outcome Process Structure Total Measures
*Measures in use for the 2020 performance period are counted individually based on published rules or documentation
for each CMS program; duplicate counts can occur when multiple programs use the same measure.
Focus on Outcomes
Percentage of total Communication and Care Coordination measures that address outcomes:
Measure Performance Trends
54 Communication and Care Coordination measures with ≥ 3 years
of data from 2013 to 2018 were analyzed. See Appendix E for analytic
results for all measures.
83% of the analyzed Communication and Care Coordination
measures had improved or stable performance.
Reducing Burden
Selective reductions in the number of
measures can reduce reporting burden.
Digital quality measures use data from electronic
health records, health information exchanges, clinical
registries, case management systems, electronic
administrative claims systems, electronically submitted
assessments, and wearable devices.2(p. 84849)
All-Payer Reach
31% of all Communication and Care Coordination measures can be calculated using
data from patients covered by any payer, not just from Medicare beneficiaries.
2021 National Impact Assessment of CMS Quality Measures Report Page 14COMMUNICATION AND CARE COORDINATION
Clinician/
Managed
Communication and Care Coordination Key Indicators
Acute
Acute
Trends by Setting
Post-
ACO
Care
Hospitalizations
All-Cause Readmission
Hospital Admissions
Medication Management
Medication Adherence
Medication Review
Medication Therapy Management
Psychotropic Medications
Self-Management of Oral Medication
Note: For a listing of component measures for each Key Indicator, see Appendix B.
Legend: = Improving = Stable = Declining = Mixed
Impact of Communication and Care Coordination Key Indicators
Corresponding to topics in the preceding table, the highlighted analytic results represent the
greatest impacts associated with improvement in Key Indicator measure scores.
• All-cause readmission rates among MA beneficiaries declined from 12.6% in 2013 to
11.3% in 2018, translating to 53,257 fewer readmissions than
expected and an estimated $801.7 million–$859.9 million in costs
avoided.
• Disparities in all-cause readmissions were no longer evident
among Asian short-stay nursing home residents.
• Disparities in medication adherence narrowed for Black, Hispanic, and low-income MA
beneficiaries. Adherence to specific drug classes improved (2013–2018) among MA and
traditional fee-for-service Medicare beneficiaries with Part D:
o Statins: 4.0 million more beneficiaries than expected; costs avoided of
$5.4 billion–$13.7 billion.
o Diabetes medications: 893,811 more beneficiaries than expected; costs avoided
of $3.4 billion–$7.2 billion.
o Renin-angiotensin system (RAS) antagonists, including angiotensin-converting
enzyme inhibitors and angiotensin-receptor blockers: 3.0 million more
beneficiaries than expected; costs avoided of $18.2 billion–$25.7 billion.
• 3.3 million more Part D beneficiaries with complex health needs than expected (2013–
2018) received a comprehensive medication review as a part of medication therapy
management, which has been shown to improve appropriateness of and adherence to
medication.27
o Disparities detected in 2013 were no longer evident for MA beneficiaries living in
micropolitan, medium metro, small metro, and noncore (rural) areas and for those
with middle income. Disparities narrowed for those with dual-eligibility status.
o Among beneficiaries with traditional fee-for-service Medicare and Part D,
disparities detected among those with dual-eligibility status were no longer
evident. Disparities narrowed for Asian and Hispanic beneficiaries.
2021 National Impact Assessment of CMS Quality Measures Report Page 15COMMUNICATION AND CARE COORDINATION
• Supporting a concurrent CMS initiative to reduce unnecessary use of antipsychotics in nursing
homes,28 psychotropic medication (antipsychotics) use decreased from 2013 to 2018 among
short-stay (from 2.1% to 1.4%) and long-stay patients (from 20.3% to 14.2%). Use of
antianxiety or hypnotic pharmacology decreased from 23.0% in 2016 to 20.4% in 2018.
• Self-management of oral medication by home health patients improved from 51.0% in
2013 to 69.4% in 2018, a positive effect of 2.2 million more episodes than expected.
Opportunities for Improvement
Among Communication and Care Coordination Key Indicators, declining measure performance
and worsening disparities are noted.
• All-cause readmissions increased among short-stay nursing home
patients by 6.9% per year (from 16.9% in 2015 to 20.4% in 2018) and
among dialysis patients by 2.3% per year (from 26.3% in 2015 to 27.8%
in 2018).
• Disparities in all-cause readmissions worsened for Black, dual-eligible,
and low- or middle-income MA plan members and for American Indians/Alaska Natives
in traditional fee-for-service Medicare.
• Disparities in receiving medication therapy management worsened for American
Indians/Alaska Natives with traditional fee-for-service Medicare and Part D.
Addressing Gaps in Performance Measurement
CMS is addressing measurement gaps in high-impact areas through nine measures in
development focused on hospital admission rates, medication safety, communication of
laboratory results, and care coordination after emergency department visits. Thirteen
emerging measures across care settings focus on medication management, admissions
and readmissions, and transfer of health information between providers and with patients.
Table 4 summarizes newly identified measurement gaps from key sources published from
January 1, 2018, to March 31, 2020; an “X” indicates a gap in one or more programs within
a setting. Appendix F contains a comprehensive list of gaps identified from key sources.
Clinician/
Managed
Table 4. Communication and Care Coordination
Acute
Acute
Post-
ACO
Care
Measurement Gaps by Clinical Setting
Adverse drug events; polypharmacy X X X
Care transitions and transfers: quality and safety across facilities and settings X X
Care coordination and handoffs using eCQMs X
Communication and care coordination including rural populations X X X
Dialysis: coordination for transient patients X
EHR saf ety: patient matching and correct identification X
Interoperability across settings; bidirectional exchange of clinical information X X X X
Medication review and reconciliation: discharge and transfers X X X X
Medication safety: opioid prescribing and stewardship X
Patient access to records; two-way sharing of patient-/caregiver-generated data X
Readmissions: condition-specific, 7-day time frame, interaction with mortality X
Telehealth: incorporate into existing measures X
Timely exchange of clinical information X X
Transitions of care for cancer patients across facilities and outpatient settings X X X X
2021 National Impact Assessment of CMS Quality Measures Report Page 16Best practices of clinical care and prevention
4. Effective Prevention contribute to better results and higher satisfaction
and Treatment for patients, caregivers, and providers.
Meaningful to Patients “[My doctor] does “Mental health
“She wants to work toward lowering the breast exam— screening would be very
her [arthritis] pain. Say, from 1 to 10, that’s very good for each doctor to
maybe she’s at a 5, and she wants to important, even do when a person
eventually end up at a 2.” though I get a comes in for a physical.”
mammogram.”
Effective Prevention and Treatment Measure Portfolio
19 *45 *202 *0 *247
Quality Programs Outcome Process Structure Total Measures
*Measures in use for the 2020 performance period are counted individually based on published rules or documentation for each
CMS program; duplicate counts can occur when multiple programs use the same measure.
Focus on Outcomes
Percentage of total Effective Prevention and Treatment measures that address outcomes:
Note: Proportionally fewer outcome measures are feasible for this health care quality priority because long-term clinical outcomes
(e.g., heart attacks) are difficult to attribute to providers.
Measure Performance Trends
110 Effective Prevention and Treatment measures with ≥ 3 years of
data from 2013 to 2018 were analyzed. See Appendix E for analytic
results for all measures.
89% of the analyzed Effective Prevention and Treatment
measures had improved or stable performance.
Reducing Burden
Selective reductions in the number of
measures can reduce reporting burden.
Digital quality measures use data from electronic
health records, health information exchanges, clinical
registries, case management systems, electronic
administrative claims systems, electronically submitted
assessments, and wearable devices.2(p. 84849)
All-Payer Reach
55% of all Effective Prevention and Treatment measures can be calculated using data
from patients covered by any payer, not just from Medicare beneficiaries.
2021 National Impact Assessment of CMS Quality Measures Report Page 17EFFECTIVE PREVENTION AND T REATMENT
Clinician/
Managed
Effective Prevention and Treatment Key Indicators
Acute
Acute
Post-
Trends by Setting
ACO
Care
Behavioral Health and Substance Use
Clinical Depression Screening and Follow-Up
Tobacco Use Screening
Chronic Conditions
Blood Pressure Control
Cholesterol Control
Diabetes – Eye Exam
Diabetes – Poor Hemoglobin A1c Control
Diabetes – Kidney Disease
End Stage Renal Disease – Hypercalcemia
Health Risk Assessment
Osteoporosis
Rheumatoid Arthritis
Mortality
Acute Myocardial Infarction Mortality
Chronic Obstructive Pulmonary Disease Mortality
Coronary Artery Bypass Graft Mortality
Heart Failure Mortality
Pneumonia Mortality
Prevention and Screening
Breast Cancer Screening
Colorectal Cancer Screening
Healthcare Personnel Influenza Immunization
Influenza Immunization
Note: For a listing of component measures for each Key Indicator, see Appendix B.
Legend: = Improving = Stable = Declining = Mixed
Impact of Effective Prevention and Treatment Key Indicators
Corresponding to topics in the preceding table, the highlighted analytic results represent the
greatest impacts associated with improvement in Key Indicator measure scores.
• More beneficiaries whose MIPS clinician groups reported via the Web Interface received
clinical depression screening and follow-up, from 28.9% in 2014 to 68.2% in 2018;
screening increased for patients associated with ACOs, from 39.4% to 67.1%.
• Patients of MIPS clinician groups reporting via the Web Interface received increased
screening for tobacco use and cessation intervention from 2014 to 2017 (86.1% to
93.1%), as did patients associated with ACOs (87.1% to 90.4%).
• More Medicare beneficiaries experienced blood pressure control from 2014 to 2018:
Rates increased from 68.1% to 73.2% for patients associated with ACOs and from 67.0%
to 70.7% for patients whose MIPS clinician groups reported via the Web Interface.
2021 National Impact Assessment of CMS Quality Measures Report Page 18EFFECTIVE PREVENTION AND T REATMENT
• From 2013 to 2018, MA beneficiaries receiving diabetes care had better than expected
monitoring for potential complications, including:
o 234,774 more annual eye exams.
o 163,143 fewer cases of poor hemoglobin A1c control
with estimated 10-year costs avoided of $1.7 billion–
$2.9 billion.
o 175,497 more annual tests for kidney disease.
• Hypercalcemia, an adverse condition associated with higher risk of cardiovascular
events and death in individuals with ESRD, was reported as declining from 2.0% of
patient-months in 2014 to 1.0% in 2018 (177,048 fewer patient-months than expected).
Disparities detected in 2013 were no longer evident for low-income individuals with
ESRD and narrowed for Black and multiracial patients.
• More MA beneficiaries in Special Needs Plans received an annual health needs and risk
assessments as rates increased from 59.1% in 2013 to 70.7% in 2018.
• Women in MA plans (2013–2018) had higher rates of screening or treatment for
osteoporosis within six months of breaking a bone, increasing 10.9% per year from
27.7% to 48.3%. Disparities detected in 2013 were no longer evident for residents of
noncore (rural) areas and dual-eligible beneficiaries.
• Among discharged patients, 14,596 fewer deaths than expected occurred within 30 days
after acute myocardial infarction (2013–2018), coronary artery bypass graft (2014–
2018), and pneumonia (2015–2018).
• An additional 262,301 MA beneficiaries received breast cancer screening as rates
increased from 70.6% in 2013 to 74.5% in 2018.
• Since 2013, 1.2 million more MA beneficiaries than expected received colorectal cancer
screening, increasing from 64.6% in 2013 to 74.0% in 2018. Disparities narrowed for
those with dual eligibility status and were no longer evident among low-income
beneficiaries.
• 4.1 million more health care personnel received an influenza immunization as rates
increased in acute care hospitals (from 75.0% in 2013 to 88.6% in 2018) and inpatient
rehabilitation facilities (from 85.7% in 2016 to 88.1% in 2018).
• 103,131 more patients in psychiatric facilities (from 70.8% in 2016 to 81.7% in 2018)
received an influenza immunization (annual increases of 8.0%).
• Disparities in reporting receiving an influenza immunization narrowed among Blacks
with traditional fee-for-service Medicare and low-income beneficiaries in MA plans.
Opportunities for Improvement
Among Effective Prevention and Treatment Key Indicators, declining measure performance and
worsening disparities are noted.
• Rates of poor hemoglobin A1c control increased from 16.7% to 17.1% among patients
of MIPS clinician groups that reported via the Web Interface (2014–2016). Disparities
worsened among MA plan members who were dually eligible, low- or middle-income,
or living in noncore (rural) areas.
• Chronic obstructive pulmonary disease (COPD) mortality within 30 days of
discharge from a hospital stay increased by 1.9% per year (2013–2018) from 7.8%
to 8.5%.
2021 National Impact Assessment of CMS Quality Measures Report Page 19EFFECTIVE PREVENTION AND T REATMENT
• Disparities worsened in coronary artery bypass graft mortality for American Indians/
Alaska Natives and for low- or middle-income beneficiaries, in heart failure mortality
for those living in micropolitan or noncore (rural) areas, and in reported rates of receiving
an annual influenza immunization for American Indians/Alaska Natives with MA plans.
Addressing Gaps in Performance Measurement
CMS is addressing previously identified measurement gaps in high-impact areas for Effective
Prevention and Treatment through 10 measures in development. Two are clinician behavioral
health measures for psychosis; other topics include opioids (five measures for clinicians) and
wellness screenings (three for clinicians). Eight emerging measures include four addressing safe
opioid prescribing and pain management (acute care, clinician, managed care), two assessing
aspects of waitlists for kidney transplants (post-acute), and one each for HIV screening (clinician)
and metabolic monitoring for patients receiving antipsychotic medications (managed care).
Table 5 summarizes newly identified measurement gaps from key sources published from
January 1, 2018, to March 31, 2020; an X indicates a gap in one or more programs within a
setting. Appendix F contains a comprehensive list of gaps identified from key sources.
Clinician/
Managed
Table 5. Effective Prevention and Treatment
Acute
Acute
Post-
ACO
Care
Measurement Gaps by Clinical Setting
Cancer: personalized medicine and testing, pain management, survival X X
Co-prescription of opioids and benzodiazepines X
Dementia X
ESRD: management of comorbid conditions; dialysis – pediatric and palliative X
Psychiatric (inpatient) outcomes and comorbidities; treatment outcomes for SUD X X
Maternity care: interpregnancy interval, inter-conception care to address risk
X
f actors, experience of care and breastfeeding
Mental and behavioral health X
Mental health and substance use integration with primary care; substance use
X X X
other than opioids
Nutrition / malnutrition: screening, assessment, plan, discharge X X X
Opioids: appropriate clinical prescribing; new/chronic use and frequency X X
Screening children for abuse and neglect X
2021 National Impact Assessment of CMS Quality Measures Report Page 20You can also read