Comprehensive Community Substance Abuse Prevention Plan - 2019-2021 Report Prepared by: Nevada Institute for Children's Research and Policy School ...
←
→
Page content transcription
If your browser does not render page correctly, please read the page content below
2019-2021
  Comprehensive Community
Substance Abuse Prevention Plan

                                             Report Prepared by:
              Nevada Institute for Children’s Research and Policy
                           School of Community Health Sciences
                                  University of Nevada Las Vegas

                                             December 31, 2018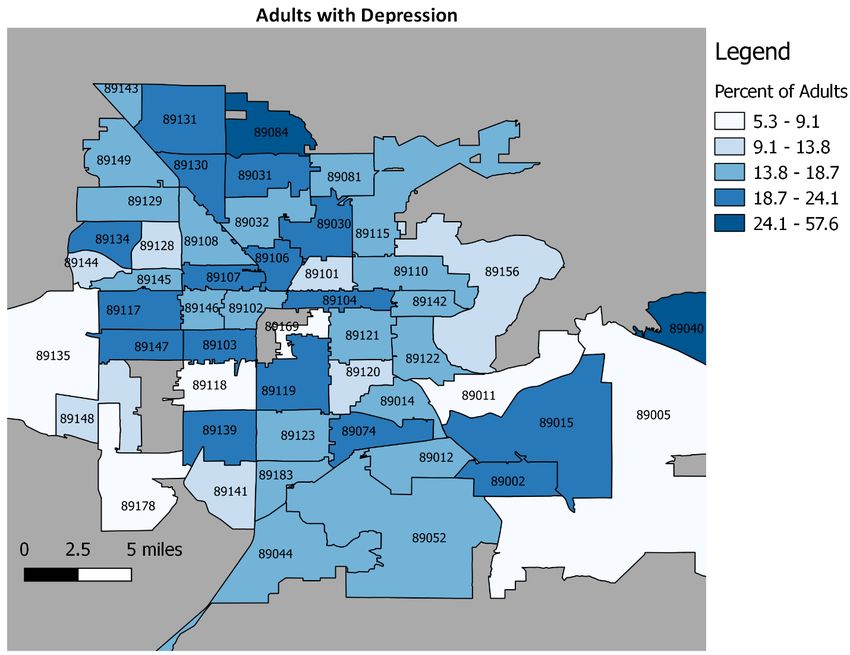
Table of Contents
INTRODUCTION ............................................................................................................................................ 3
   OVERVIEW OF PACT COALITION ............................................................................................................... 3
   MISSION .................................................................................................................................................... 3
   VISION ....................................................................................................................................................... 3
   PACT PROGRAMMING .............................................................................................................................. 3
NEEDS ASSESSMENT ..................................................................................................................................... 4
   TARGET SERVICE AREA MAP ..................................................................................................................... 4
   DEMOGRAPHIC PROFILE AND CHARACTERISTICS OF SERVICE AREA RESIDENTS ..................................... 5
   THE IMPACTS OF SUBSTANCE ABUSE IN NEVADA AND CLARK COUNTY .................................................. 5
   SUBSTANCE ABUSE TRENDS AND PATTERNS ............................................................................................ 7
       TRENDS IN ILLICIT DRUG USE ................................................................................................................ 7
       TRENDS IN THE USE OF TOBACCO PRODUCTS ...................................................................................... 7
       TRENDS IN CLARK COUNTY ................................................................................................................... 8
       DEATH RATE DUE TO DRUG POISONING .............................................................................................. 9
       ALCOHOL-IMPAIRED DRIVING DEATHS................................................................................................. 9
       MARIJUANA USE ................................................................................................................................... 9
       PRESCRIPTION DRUG ABUSE ............................................................................................................... 10
   RISK FACTORS AND PROTECTIVE FACTORS FOR SUBSTANCE ABUSE ..................................................... 11
       TOBACCO USE ..................................................................................................................................... 14
       COMMUNITY AND FAMILY SUPPORT ................................................................................................. 15
       OWNER OCCUPIED HOUSING RATES .................................................................................................. 15
       POVERTY.............................................................................................................................................. 16
       ACADEMIC SUCCESS............................................................................................................................ 16
       SINGLE PARENT HOUSEHOLDS............................................................................................................ 16
       PREVALENCE OF ADULT DEPRESSION ................................................................................................. 17
       YOUTH DEPRESSION AND SUICIDE ATTEMPTS ................................................................................... 18
       ADVERSE CHILDHOOD EXPERIENCES .................................................................................................. 19
ASSESSMENT OF CAPACITY ........................................................................................................................ 20
   ORGANIZATIONAL CAPACITY .................................................................................................................. 20
   CULTURAL RESPONSIVENESS .................................................................................................................. 21
   POTENTIAL OBSTACLES AND OPPORTUNITIES........................................................................................ 21
   EDUCATION ............................................................................................................................................. 22
   COMPASSION FATIGUE ........................................................................................................................... 22
   SUMMARY OF RECOMMENDATIONS...................................................................................................... 23

Comprehensive Community Substance Abuse Prevention Plan 2019-2021                                                                                       Page 1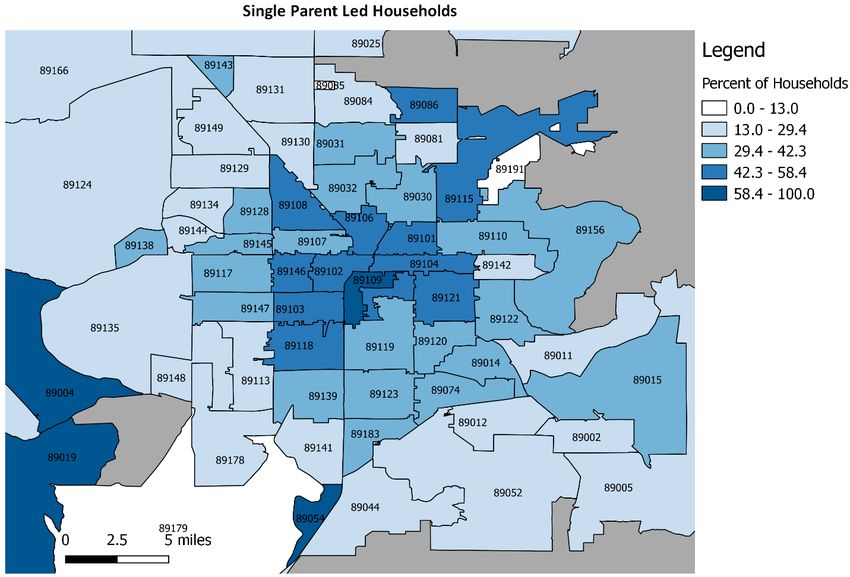
COALITION ACTIVITIES AND ACCOMPLISHMENTS (2016-2018) ............................................................... 24
SUBSTANCE ABUSE PREVENTION PRIORITIES ........................................................................................... 25
REFERENCES AND DATA CITED................................................................................................................... 26
APPENDIX 1................................................................................................................................................. 31
APPENDIX 2................................................................................................................................................. 32

Comprehensive Community Substance Abuse Prevention Plan 2019-2021                                                                                   Page 2
INTRODUCTION
The following report is designed to present current data and statistics regarding substance use and its
impacts in Southern Nevada. In addition the information is used to inform a community prevention plan
for the PACT Coalition by looking at existing rates of substance use and related injuries and outcomes,
along with an assessment of capacity as expressed by community stakeholders. Finally, this plan lays out
the target areas of emphasis for the PACT Coalition over the next three years in an effort to prevent
substance use in Clark County, Nevada.

OVERVIEW OF PACT COALITION
The PACT Coalition was formed in August of 2010 to promote substance abuse recovery and prevent
substance abuse in Southern Nevada. These types of prevention efforts had been focused primarily on
the areas of Clark County north of Charleston Boulevard prior to 2013. Since 2013, substance abuse
prevention efforts have expanded to include all of urban Clark County to ensure that all residents of
Clark County can access substance abuse prevention services.

The PACT Coalition uses prevention funding received from the Nevada Substance Abuse Prevention and
Treatment Agency (SAPTA) to create programs to support substance abuse prevention in Southern
Nevada. PACT focuses upon primary prevention strategies to address risk and protective factors
particularly among youth who are at risk for developing substance abuse issues.

MISSION
The PACT Coalition seeks to empower Southern Nevada with the resources to prevent substance abuse
for all ages and promote recover through culturally competent advocacy, education, stigma reduction,
support, and outreach. A diverse cross-section of community leadership is represented by the PACT
Coalition that will work together to ensure a sustainable future and a healthier community.

VISION
The PACT Coalition envisions a community in which every layer of society is involved in the prevention of
harm and the advocacy of education.

PACT PROGRAMMING
The PACT Coalition uses two methods of service delivery for substance abuse prevention: direct services
offered by sub-grantees and trainings offered by the PACT Coalition. PACT awards funding for evidence
based prevention programming to SAPTA certified sub-grantees that target populations ages 3 and up in
urban Clark County.

The PACT Coalition provides educational programming which encourages environmental change
through strategies such as: pill take backs, social media strategies, conferences and educational
trainings, and media campaigns including educational billboards, social media messaging, pharmacy
bags, and monthly newsletters. The PACT Coalition offers many of their materials in a variety of
languages to serve the various cultural and ethnic groups in urban Clark County.

PACT offers substance abuse education to middle and high school students and community members.
These evidence-based trainings include: Freedom from Smoking, Adult Mental Health First Aid, and

Comprehensive Community Substance Abuse Prevention Plan 2019-2021                                 Page 3
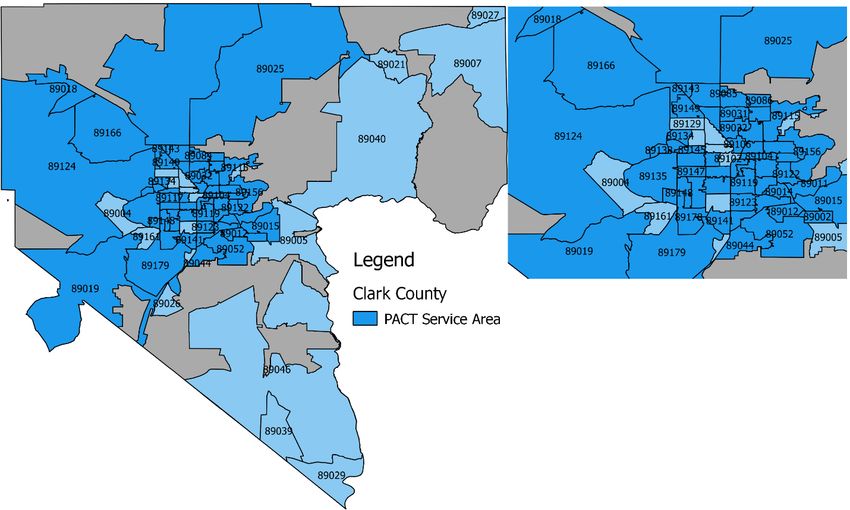
Youth Mental Health First Aid. PACT also offers conferences where expert speakers on medical
marijuana, opioids, and other community needs speak to professional audiences including health care
professionals. The PACT Coalition provides Pill Take Backs in partnership with the CARE Coalition and
the Clark County School District Police Department as a means to reduce access to prescription drug
medications and raise awareness of prescription drug abuse and misuse. Pill Take Backs provide
education on proper disposal methods and safe alternatives for storing prescription drugs.

This Comprehensive Community Substance Abuse Plan is aimed at residents of urban Clark County. The
most recent census estimates Clark County’s population at 2,204,079 (Census Bureau, 2017). In Clark
County, 23.5 percent of the population is currently under the age of 18 – just slightly higher than the
national average of 22.6 percent (Census Bureau, 2017). The demographic profile of Clark County is
unique in terms of the degree of diversity. Clark County is home to a larger than average Hispanic and
Asian populations. In order to serve this population in a culturally competent manner, the PACT
Coalition provides educational resources in a variety of languages and subcontracts with other
nonprofits who offer specialized programming to minority communities across Clark County.

NEEDS ASSESSMENT
This needs assessment involves determining the gaps between PACT’s current substance abuse
prevention planning activities and the current needs of urban Clark County. This needs assessment is
used to identify PACT Coalition’s priorities for substance abuse prevention and develop a plan of action
to address those needs in the coming years. This will begin with an assessment of existing data
concerning the demographic characteristics of PACT’s service area, an examination of the impacts of
substance abuse in Clark County, and the trends in drug abuse.

TARGET SERVICE AREA MAP
The PACT Coalition serves urban Clark County, and includes the following 54 zip codes: 89009, 89011,
89012, 89014, 89015, 89018, 89019, 89025, 89030, 89031, 89032, 89044, 89052, 89074, 89081, 89084,
89085, 89086, 89101, 89103, 89104, 89106, 89109, 89110, 89113, 89115, 89117, 89118, 89119, 89120,
89121, 89122, 89123, 89124, 89130, 89131, 89134, 89135, 89138, 89141, 89142, 89143, 89144, 89145,
89146, 89147, 89148, 89149, 89156, 89166, 89169, 89178, 89179, and 89183.

Comprehensive Community Substance Abuse Prevention Plan 2019-2021                                 Page 4
PACT Service Areas

DEMOGRAPHIC PROFILE AND CHARACTERISTICS OF SERVICE AREA RESIDENTS

Nevada is one of the most diverse states in the country, ranking 4th in the country in ethnic diversity, and
9th in overall diversity (Wallethub.com, 2018). Clark County is home to larger than average Hispanic and
Asian populations (Kaiser Foundation, 2016). Owing to the presence of several military bases in the
area, Clark County is home to an estimated 148,394 military veterans (Census Bureau, 2017). A table
which details the demographic profile of PACT’s service area as compared to Clark County as a whole,
and which compares Clark County to each zip code in PACT’s service area is included as Appendix A. The
demographic profile of PACT’s service area is similar to the demographic profile of Clark County as a
whole, because PACT’s service area comprises 84 percent of Clark County.

THE IMPACTS OF SUBSTANCE ABUSE IN NEVADA AND CLARK COUNTY

The U.S. Surgeon General estimates that the annual costs of substance abuse to be over $400 billion in
lost productivity, health care expenses, criminal justice costs, and motor vehicle crashes (United States
Department of Health and Human Services, 2016). Loss of life due to accidental and intentional
overdose of drugs and alcohol in the United States reached 63,632 lives in 2016 (CDC, 2017a). Opioids
accounted for 42,249 of those deaths, including 13,032 deaths from opioid pain relievers, 9,688 deaths
from heroin, and 19,413 deaths from synthetic opioids like fentanyl (CDC, 2017a). In Clark County,
Nevada 481 deaths were attributable to overdose in 2016 (CDC Wonder, 2017).

Nevada’s ranking in drug overdose mortality in the United States has steadily fallen from 4th in 2013
(Trust for America’s Health, 2013) to 22nd in 2016 (CDC, 2016a). Despite this, the rate of overdose

Comprehensive Community Substance Abuse Prevention Plan 2019-2021                                    Page 5
deaths per 100,000 people has steadily increased, from 18.4 in 2014 to 21.7 in 2015, and the number of
accidental overdose deaths has increased from 545 to 665 in the same length of time (CDC, 2014,
2017b). Opioids are a major source of drug overdoses in Nevada, with 408 opioid-related overdose
deaths in 2016. Nevada has an overall opioid prescribing rate of 80.7 prescriptions per 100 persons,
above the national rate of 66.5 prescriptions per 100 people, and the 13th highest rate in the nation
(CDC, 2017c; NIDA, 2018a). Nevada also has the 9th highest rate of long acting/extended release opioid
prescriptions in the country, at 8.7 prescriptions per 100 people, above the 6.3 national rate (CDC,
2017c). Inpatient hospital admissions for opioid related emergencies in Nevada has increased 15.7
percent from 2016 to 2017, from 7,485 to 8,661 (NV DHHS, 2018; NV DPBH, 2018).

Drug use amongst older adults is expected to rise to 3.2 percent by 2020 (Mattson, Lipari, Hays, &
VanHorn, 2017). In 2012, there were over 14,000 admissions to treatment facilities by adults aged 65
years old or older (Mattson et al., 2017). Opioid related deaths in Nevada have decreased for many age
groups since 2010, but have increased for individuals in the 55+ age groups (NV DHHS, 2018). The
administration of Naloxone (a medication which rapidly reverses opioid overdose, brand names are
Narcan and Evzio) also increased between 2010 and 2015 for individuals aged 55+ (NV DPBH, 2018). Of
the 3,867 times Naloxone was administered between 2010 and 2015, it was administered to individuals
aged 55 and older 685 times (NV DPBH, 2018).

In The Behavioral Health Barometer for Nevada, SAMHSA (2017a) reports on the several areas of
concern for Nevada, including the number of individuals seeking treatment for substance abuse. In
2015, 6,930 people were enrolled in substance abuse treatment in Nevada, a 20.3 percent decrease
from 2013 (SAMHSA, 2014, 2017a). Of those individuals seeking treatment for substance abuse, 47.5%
were receiving treatment for drug problems only, 18.3% for alcohol problems only, and 34.2% were
receiving treatment for both drug and alcohol problems (SAMHSA, 2017a).

Nationally, 17.2 percent of high schoolers seriously considered suicide, 13.6 percent made a plan about
how they would attempt suicide and 7.4 percent attempted suicide (YRBS, 2018). In Nevada, 16.7
percent of all high schoolers and 20.2 percent of all middle schoolers seriously considered attempting
suicide, 14.3 percent of high schoolers and 14.7 percent of middle schoolers made a plan about how
they would attempt suicide, and 7.4 percent of high schoolers and 8.1 percent of middle schoolers
attempted suicide (NV YRBS, 2018a, 2018b). In Clark County, 15.9 percent of high schoolers and 21.4
percent of middle schoolers seriously considered suicide, 13.8 percent of high schoolers and 15.5
percent of middle schoolers made a plan to kill themselves, and 8.2 percent of both high schoolers and
middle schoolers had attempted suicide (NV YRBS, 2018c, 2018d).

In 2015 and 2016, Nevada youth (aged 12 – 17) reported use of any illicit drug in the past month at a
rate of 10.3 percent, which is higher than the national rate of 7.9 percent for 2016 (SAMHSA, 2016).
Youth surveys in Nevada now report on individual drug use rather than overall drug use, so comparisons
are made for each drug (Table 1). High schoolers in Clark County use each substance at rates lower than
the state average. The percentage of high school students in Clark County who were ever offered, sold,
or given an illegal drug on school property is 29 percent, which is nearly equal with the Nevada state
rate of 28.4 percent, but higher than the national rate of 19.8 percent.

Comprehensive Community Substance Abuse Prevention Plan 2019-2021                                Page 6
Table 1: Ever Use of Illicit Substances by High School Students

                          Substance                     Clark County a      Statewide b        National c
           Marijuana                                         35.5               39.4             35.6
           Prescription Pain Medicine Misuse                 14.5               14.8             14.0
           Synthetic Marijuana (K2/Spice)                     7.0                7.7              6.9
           Inhalants                                          6.9                7.5              6.2
           Ecstasy                                            5.7                6.3              4.0
           Cocaine                                            4.3                5.1              4.8
           Methamphetamines                                   2.8                3.3              2.5
           Prescription Steroid Misuse                        2.8                3.2              2.9
           Hallucinogens*                                      -                  -               6.6
           Heroin                                             2.1                2.6              1.7
          * Hallucinogen use is not reported for Clark County or Nevada. a 2017 Nevada High School YRBS: Clark County
          Special Report. b 2017 Nevada High School YRBS. c 2017 National YRBS.

SUBSTANCE ABUSE TRENDS AND PATTERNS
National survey data (SAMHSA, 2017b) indicates that drug use and abuse by adolescents and young
adults has decreased over time since 2002. Alcohol and cigarette use has declined for both young adults
and teenagers (SAMHSA, 2017b). Young adults report alcohol use at 57.1 percent and cigarettes at 23.5
percent, while teenagers report alcohol use at 9.2 percent and cigarette use at 3.4 percent. Marijuana
use by teenagers has also seen a national decrease to 6.5 percent, though adult use is rising, at 20.8
percent in 2016 and 22.1 percent in 2017 (SAMHSA, 2017b). In 2016, illicit drug use among all young
adults and adolescents was 10.6 percent nationally, and 7.9 percent for all teenagers. Although national
trends show declining substance use and abuse amongst teenagers and young adults, Nevada’s data
varies substantially from the national trends. For this reason, our plan examines Nevada and Clark
County’s data in comparison to the national trends.

TRENDS IN ILLICIT DRUG USE
Data from Las Vegas are not collected as part of the National Drug Warning System (NDEWS, 2017),
however, data are collected for Los Angeles, the largest metropolitan area tracked by the NDEWS. Since
many new Las Vegas residents are moving from southern California and the greatest number of visitors
to southern Nevada come from Los Angeles and southern California, many of the trends observed in Los
Angeles are likely to be similar to trends observed in Las Vegas. The most commonly reported
substances used in Los Angeles are alcohol, marijuana, and prescription drugs (NDEWS, 2017). Nearly
90 percent of all admissions for substance abuse treatment in Los Angeles were for methamphetamine,
heroin, alcohol, and marijuana. Cocaine/crack and prescription opioids accounted for approximately 4
percent each. The prevalence of synthetic drugs remains low, and is decreasing for synthetic cathinones
(Bath Salts) and cannabinoids (K2/Spice); 2016 reports of synthetic cathinones were similar to 2015, and
lower than the prevalence reported in 2014 (NDEWS, 2017).

TRENDS IN THE USE OF TOBACCO PRODUCTS
A growing area of concern in tobacco product use includes the rising use of e-cigarettes, particularly by
youth. E-cigarette use by youth has slowly increased since the products were introduced, and are now
the most commonly used tobacco product for middle and high school students (CDC, 2018a). After
tripling from 2013 to 2014, the prevalence of any use of e-cigarettes by high-school students reached
42.2 percent in 2017, a non-significant decrease from 2015 (YRBS, 2016; YRBS, 2018). Findings from the

Comprehensive Community Substance Abuse Prevention Plan 2019-2021                                                 Page 7
2017 National Youth Risk Behavior Survey indicated that current use of e-cigarette products by high school students has decreased significantly since 2015, from 24.1 percent to 13.2 percent (YRBS, 2018). E-cigarette use has surpassed cigarette use, smokeless tobacco use, or cigar use among high school students (YRBS, 2018). Ever e-cigarette use was highest among Hispanic students, followed by non- Hispanic whites, and then non-Hispanic black students. Current e-cigarette use is highest for all tobacco products surveyed, among all races (YRBS, 2018). Current e-cigarette usage is highest amongst non- Hispanic whites. E-cigarette usage among non-Hispanic blacks has surpassed cigar usage for the first time (YRBS, 2018). The rise of e-cigarette usage has offset declines in the use of more traditional tobacco products such as cigarettes. Overall rates of any tobacco products used declined from 24.6 percent for high school students in 2014 to 19.5 percent in 2017 (YRBS, 2018). The highest rates of tobacco product use were for non-Hispanic whites, followed by Hispanics, then non-Hispanic blacks. The most commonly used tobacco products by high school students were e-cigarettes (13.2 percent), cigarettes (8.8 percent), cigars (8.0 percent), and smokeless tobacco (5.5 percent). TRENDS IN CLARK COUNTY The numbers of deaths due to unintentional drug overdose have been on the rise in the United States since 1999. Unintentional overdose deaths have risen 5 fold, from 11,155 in 1999 to 54,793 in 2016 (CDC Wonder, 2017). Opioid deaths in 2016 reached a high of 42,249 in 2016 including 17,087 deaths from prescription opioids (NIDA, 2018b). Nearly 50 percent (19,413) of those opioid overdose deaths occurred from synthetic opioids, like illegal synthetic fentanyl (NIDA, 2018b). Admission rates for treatment for opiates decreased in Nevada between 2005 and 2015 (SAMHSA, 2017b). Despite this, more than 1,170 people were admitted to treatment for opioid abuse in Nevada in 2015 (SAMHSA, 2017b). The most common opiate people were seeking treatment for was heroin, which accounted for 76.9 percent of opiate admissions. The highest treatment admission rates in Nevada are for methamphetamines and amphetamines. As opioid addiction grows, heroin is becoming an increasingly serious problem. Of the 1,171 people admitted for treatment for opioid abuse in Nevada in 2015, 76.9 percent of them were seeking treatment for heroin addiction (SAMHSA, 2017). Heroin related deaths in Nevada have more than doubled between 2011 and 2016, while prescription opioid deaths have decreased during the same period (NIDA, 2018a). People with addictions to prescription opioid pain relievers often turn to heroin when they can no longer get access to or afford the prescription pain relievers. Nationally, the growth in opioid use and abuse has resulted in increased rates of opioid use and abuse in pregnant women. Between 1999 and 2014, rates of opioid use disorder among pregnant women delivering babies increased from 1.5 to 6.5 per 1,000 deliveries (Haight, Ko, Tong, Bohm, & Callaghan, 2018). Nevada’s rate increased from 0.6 to 4.5 between 2002 and 2014 (Haight et al., 2018). The use of opioids during pregnancy can also result in neonatal abstinence syndrome (NAS) – withdrawal symptoms in newborns – that can cause lengthy hospital stays for babies born with the syndrome. In 2013, there were 4.8 cases of NAS for every 1,000 births (NIDA, 2018c). In 2017, Nevada reported a total of 8,411 adult and 774 juvenile substance abuse arrests related to the prohibition on the distribution, production, and use of certain substances (Nevada Department of Public Safety, 2018). This is a decrease of more than 6,500 adult arrests and a decrease of nearly 900 juvenile arrests from 2016 (Nevada Department of Public Safety, 2017, 2018). Of those substance related arrests Comprehensive Community Substance Abuse Prevention Plan 2019-2021 Page 8
in the state, 413 (53.5%) of juvenile arrests and 7,045 (83.8%) were in Clark County (Nevada Department
of Public Safety, 2018). The 43.6 percent decrease in adult substance abuse arrests between 2016 and
2017 may be due to the decrease in arrests for marijuana use and possession since its legalization for
recreational use in the state in 2017.

Drug abuse also impacts other crimes in the state. According to state arrest data, 19,474 (62.8%) of the
30,303 domestic violence incidents reported in Nevada involved suspected drug or alcohol abuse
(Nevada Department of Public Safety, 2018). Similarly in Clark County, 17,504 (70.6%) of the 24,777
domestic violence incidents reported involved suspected drug abuse.

DEATH RATE DUE TO DRUG POISONING
According to the Centers for Disease Control and Prevention, in 2017 there were 676 drug overdose
related deaths in Nevada resulting in a rate of 21.6 deaths per 100,000 population. These overdose
related deaths could involve a number of different drugs, however in 2017 opioids, specifically synthetic
opioids- are a main driver in these deaths, accounting for just over 67% of these deaths nationwide
(Centers for Disease Control, December 2018). In 2016 there were 12.8 opioid related deaths per
100,000 population in Nevada, and 12.3 per 100,000 in Clark County and 33.2 opioid related deaths per
100,000 in Nye County (Southern Nevada Health District Opioid Dashboard, 2018).

ALCOHOL-IMPAIRED DRIVING DEATHS
In 2016, 34,439 people were killed in traffic accidents in the US (NHTSA, 2017a). Twenty-eight percent
(10,497 people) of all traffic-related fatalities, were from alcohol-impaired driving crashes (NHTSA,
2017a). Alcohol-related incidents kill 29 people per day, or approximately 1 person every 50 minutes
(NHTSA, 2017b). Among drivers involved in fatal-crashes where alcohol was involved, 27% of drivers
with a blood alcohol concentration (BAC) at or above the legal limit of .08% were between 25 – 34 years
of age (NHTSA. 2017b).

In Clark County, 32 percent of all motor vehicle fatalities were alcohol-related between 2012 and 2016,
resulting in 304 alcohol-related deaths (County Health Rankings, 2018). This is slightly higher than the
national rate of 28 percent of motor vehicle fatalities, but has improved year over year since the 2008 –
2012 rates (County Health Rankings, 2014). During the 2017 Legislative Session Nevada legislators
passed Senate Bill 259, which requires all persons convicted of an offense involving driving under the
influence to install an ignition interlock device to prevent further impaired driving. Other effective
measures to reduce alcohol-related crashes employed in Clark County include sobriety checkpoints, and
community-based approaches to alcohol control and prevention of impaired-driving like programs that
provide a safe means of transportation home after alcohol consumption.

MARIJUANA USE
While the use of most illegal drugs have stabilized or declined over the past ten years, the use of
marijuana has increased in the United States. Attitudes and state laws regarding the use of marijuana
medically and recreationally are changing, with most Americans now supporting the legalization of
marijuana. Marijuana is legal for medical use in 30 states, the District of Columbia, and Guam and has
been legalized for recreational use by adults aged 21 or older in 9 states, including Nevada. Research
has suggested that legalization of marijuana for medical or recreation use leads to greater marijuana use
by adults and individuals under the legal age of 21 (Pacula, Powell, Heaton, & Sevigny, 2015).
Nationally, about 20.8 percent of young adults and 7.2 percent of older adults were current users of
marijuana in 2016 (NSDUH, 2017).

Comprehensive Community Substance Abuse Prevention Plan 2019-2021                                  Page 9
In Nevada, recreational use of marijuana was legalized by voters on Election Day in 2016. For individuals
aged 21 or older, possession of marijuana became legal on January 1st, 2017 and purchase of marijuana
for recreational use became possible on July 1st, 2017. Because of this, use rates of marijuana for 2017
may not be comparable to prior years.

Despite this, marijuana use among high school students nationally and in Nevada has decreased
between 2015 and 2017 (Table 2). Current marijuana use in Nevada was highest among American
Indian/Alaska Native (34.3%), African American (27%) and Other/Multiracial (22.3%) high school
students (NV YRBS, 2018b). In Clark County, current marijuana use was highest among African American
(27.3%), Other/Multiracial (21.3%) and Hispanic/Latino (19%) high school students (NV YRBS, 2018a).

                        Table 2: Rates of Marijuana Use by High School Students

                                            2015                                              2017
                          Clark                                             Clark
                                        Statewide b       National c                      Statewide e       National f
                         County a                                          County d
    Ever Use of
                            38.2             39.4            38.6             35.5            37.0             35.6
    Marijuana
    Current
                            18.6             19.6            21.7             18.4            19.5             19.8
    Marijuana Use
a
 2015 Nevada YRBS: Clark County Special Report. b 2015 Nevada YRBS. c 2015 National YRBS. d 2017 Nevada YRBS: Clark County
Special Report. e 2017 Nevada YRBS. f 2017 National YRBS.

PRESCRIPTION DRUG ABUSE
Prescription drug misuse affects an estimated 25,274,000 people in the United States in 2017 (CDC,
2017b). Nationally, 14 percent of high school students reported misusing a prescription pain medication
by taking it without a doctor’s prescription, or differently than prescribed (YRBS, 2017). Overall, Nevada
rates are similar to national rates. In Nevada, 14.8 percent of high school students reported having ever
used prescription pain medication differently than prescribed, or without a prescription (NV YRBS,
2018).

Between 1999 and 2015, prescriptions for opioid pain relievers nearly trebled, despite decreasing in half
of US counties since 2010 (CDC, 2017c). Overdose deaths also tripled in the United States between 1999
and 2016 (Hedegaard, Warner, & Meniño, 2017). Nationally, there were 63,632 drug overdose deaths in
2016, including 42,249 where opioids were involved (CDC, 2017c; HHS, 2018). High school students
report misusing several different kinds of prescription drugs, including 1.8 percent who report using
OxyContin and 1.3 percent who report using Vicodin (Miech, et al., 2017). High school seniors also
report misusing prescription drugs like sedatives (5.2 percent), tranquilizers (7.6 percent), and
amphetamines (10 percent) (Miech et al., 2017).

Nationally, 21 percent of high school seniors reported having used any illicit drug other than marijuana
(Miech et al., 2017). That rate jumps to 48 percent of high school seniors when including marijuana.
Misuse of prescription drugs, such as amphetamines, tranquilizers, narcotics, and sedatives decreased in
2016 to the lowest levels recorded by the Monitoring the Future Survey, down to 18 percent. Misuse of
prescription narcotics Vicodin and OxyContin have decreased year over year since 2009 for both drugs
(Miech et al., 2017). In Clark County, 6.6 percent of high school students reported using a prescription
pain medicine (like Vicodin and OxyContin) without a prescription or differently than prescribed (NV

Comprehensive Community Substance Abuse Prevention Plan 2019-2021                                                Page 10
YRBS, 2018). Because questions have changed since the 2015 Youth Risk Behavior Survey (YRBS), the data are not comparable to previous years in Nevada and Clark County. However, in 2015, 16.5 percent of Clark County high schoolers reported taking any prescription drug without a prescription (NV YRBS, 2016). According to the Monitoring the Future 2016 Survey, there has also been a decrease in teenagers misusing other medications. For example, the prescription stimulant Adderall, down 10.3 percent from a peak of 4.5 percent in 2010 to 3.9 percent in 2016 (Miech et al., 2017). Teenagers also report missing over the counter (OTC) cough and cold medicines 40.6 percent less often than they did in 2006, where use peaked at 5.4 percent. Current rates of misuse of OTC cough and cold medicine are 3.2 percent, a slight increase from 2015 (3.1 percent). Most of the teenagers surveyed report getting the prescription drugs they misused from friends or family members, and also from prescriptions they already had (Miech et al., 2017). For that reason, it is important that drug abuse education extend to include families and community members. RISK FACTORS AND PROTECTIVE FACTORS FOR SUBSTANCE ABUSE Risk and protective factors affect children at different stages of their development. At each developmental stage, risks occur that can be changed through prevention intervention. Risks such as lack of parental supervision can be offset through family, academic, and community interventions that are designed to help children develop appropriate and positive behaviors. Negative behaviors can lead to additional risks like academic failures and social difficulties if not properly addressed, which puts children at greater risk for drug abuse later in life. This section of the plan focuses on the data related to these risk and protective factors for youth in Clark County in comparison to state and national averages. The data on risk factors for substance abuse pertaining to youth is based on the National and Nevada Youth Risk Behavior Surveillance Surveys (YRBS, 2017). Data specific to Clark County were taken from the Youth Risk Behavior Surveillance Survey: Clark County Special Report (2017). The YRBS is a school based survey conducted by the Centers for Disease Control (CDC), which monitors several categories of risk behaviors in youth and young adults, including smoking, injury and violence, alcohol and other drug use, and sexual behaviors. Adult data comes from the most recent Behavioral Risk Factor Surveillance Survey (BRFSS) which monitors risk factors for the non-institutionalized adult population. The BRFSS collects data about tobacco use, healthy status, and alcohol consumption. This report examines the factors which are most closely related to substance abuse including: alcohol and drug abuse among adults and adolescents, tobacco use among adults and adolescents, poverty, veteran status, academic success, and familial status, and mental health issues. ALCOHOL AND DRUG ABUSE An important risk factor for the development of substance abuse is the exposure to drug-using behaviors such as the use of alcohol and other substances by family, friends, and peers (NIDA, 2002). For this reason, we begin our examination of risk factors with data concerning abuse of substances in Nevada as a whole and Clark County in particular. When available, we will examine disaggregated data for PACT’s service area to identify particular geographic areas where additional services are needed. Comprehensive Community Substance Abuse Prevention Plan 2019-2021 Page 11
YOUTH ALCOHOL USE
In Clark County, 59.9 percent of high school students report having ever tried alcohol (NV YRBS, 2018b).
Hispanic/Latino and Other/Multiracial students reported the highest rates of having ever tried alcohol at
64.8 percent and 67.01 percent, respectively. Of Clark County high school students who have tried
alcohol, 25.1 percent report currently using alcohol. Current use rates are highest among
Hispanic/Latino (28.1%) and Other/Multiracial (29.0%) students.

In Clark County, 17.9 percent report having their first alcohol beverage before the age of 13. The
highest rates of students reporting their first alcoholic beverage before 13 are Hispanic/Latino students
(21.3%) and Other/Multiracial students (21.0%). Individuals who report alcohol dependence later in life
are five times more likely to have started drinking before the age of 15.

ADULTS WHO DRINK EXCESSIVELY
According to the CDC, excessive alcohol consumption, either through binge drinking (drinking 4 or more
drinks on one occasion for females, or five or more drinks on one occasion for males) or heavy drinking
(drinking one or more drinks per day for women, or two or more drinks per day for men) can lead to
increased risk of health problems such as liver and kidney diseases, unintentional injuries, and death.
Excessive alcohol use is also associated with a variety of other negative outcomes, including family and
social problems, financial loss, legal problems, employment difficulties, and other interpersonal issues.
In Clark County, 17 percent of adults drank excessively in 2016, compared to 23.4 percent of adults,
nationally and 18 percent of adults in Nevada (County Health Rankings, 2018; YRBS, 2017).

ADULT BINGE DRINKING PREVALENCE
Binge drinking is the consumption of large quantities of alcohol at one time – usually four or more drinks
at one time for women, and five or more drinks at one time for men. In 2015 in Nevada, 14.2 percent of
adults report binge drinking at least once in the last 30 days (NV BRFSS, 2016). Young adults between
the ages of 18 – 24 and older adults over age 55 were the most likely to report binge drinking in Nevada.
Rates of binge drinking in Clark County were just slightly lower than statewide rates, at 13.9 percent. In
2015 males (6.4%) were more likely than females (6.0%) to engage in binge drinking in the state, and
whites (7.2%) and African Americans (6.8%) were more likely than Hispanic/Latino or other racial groups
to engage in binge drinking (NV BRFSS, 2016).

Binge drinking is the most deadly pattern of excessive drinking in the United States. In 2010, binge
drinking cost the United States $191 billion dollars in health care expenditures, lost productivity,
criminal justice costs, and other expenses (CDC, 2018a). Binge drinking is twice as common among men
as among women, and is most common among people with annual household incomes of $75,000 or
higher. Some risks associated with binge drinking include unintentional injuries and death from car
accidents and alcohol poisoning, interpersonal violence such as homicide and intimate partner violence,
sexual assault, alcohol dependence, memory and learning problems, and health risks such as cancer,
high blood pressure, and liver disease.

HIGH SCHOOL AGE STUDENTS WHO BINGE DRINK
Nationally, 13.4 percent of youth and young adults aged 12 to 20 reported binge drinking in the past 30
days during 2016 (US DHHS, 2017). In Nevada, binge drinking is slightly lower than the national average
(Table 3). Females (11.5%) report binge drinking at slightly higher rates than males, and binge drinking
is most common among white students. Clark County rates are lower than both the national and state

Comprehensive Community Substance Abuse Prevention Plan 2019-2021                                 Page 12
rates, males and females report binge drinking at the same rate, and binge drinking is most common
amongst white and Hispanic/Latino students.
Table 3. Rates of Binge Drinking among High School Students
National a Nevada b Clark County c
Total 13.5% 11.1% 9.8%
Female 14.1% 11.5% 9.8%
Male 12.8% 10.8% 9.8%
Age
14 or younger - 6.9% 6.2%
15 - 7.6% 6.0%
16 - 11.3% 9.2%
17 - 13.7% 12.8%
18 or older - 18% 17.2%
Grade
9th 7.3% 7.3% 6.4%
10th 11.4% 7.7% 5.3%
11th 15.4% 13.1% 12.1%
12th 20.9% 17.1% 15.9%
Race/Ethnicity
American Indian/Alaska Native - 16%* 0%
Asian - 4.1% 4.1%
Black 5.6% 4.5% 4.0%
Native Hawaiian/Pacific Islander - 16.4%* 16.6%*
White 15.7% 13.3% 11.2%
Hispanic/Latino 14% 11.5% 11.2%
Other/Multiple - 13.4%* 12.4%*
* Indicates results with broad 95% confidence intervals. a 2017 National YRBS.
b
2017 Nevada YRBS. c 2017 Nevada YRBS: Clark County Special Report.
MILITARY SERVICE AND POST TRAUMATIC STRESS DISORDER
Clark County is home to a substantial veteran population. Veterans are at significant risk for developing
substance abuse issues. Veterans who suffer from Post-Traumatic Stress Disorder (PTSD) may try to
deal with the symptoms of PTSD through negative coping techniques, including using and abusing drugs
and alcohol (U. S. Veteran’s Administration, 2018a). Approximately 46.4 percent of veterans with PTSD
have a co-occurring substance use disorder (U. S. Veteran’s Administration, 2018b). Men with PTSD
experienced a co-occurring substance use disorder (51.9%) nearly twice as frequently as women (27.9%)
(U. S. Veteran’s Administration, 2018b). Among Vietnam Veterans, 74 percent of those with PTSD also
had a substance use disorder (Veteran’s Administration, 2018b). Among veterans of the Operations
Enduring Freedom/Iraqi Freedom/New Dawn, 63 percent of veterans with any substance use disorder
(alcohol or other substance) also had a PTSD diagnosis.
The large number of veterans and current service members in Clark County and the link between
military service, PTSD, and substance use disorder has caused PACT to target development of
collaboration and partnerships with the military; active service, veterans, reservists, National Guard, and
their families.
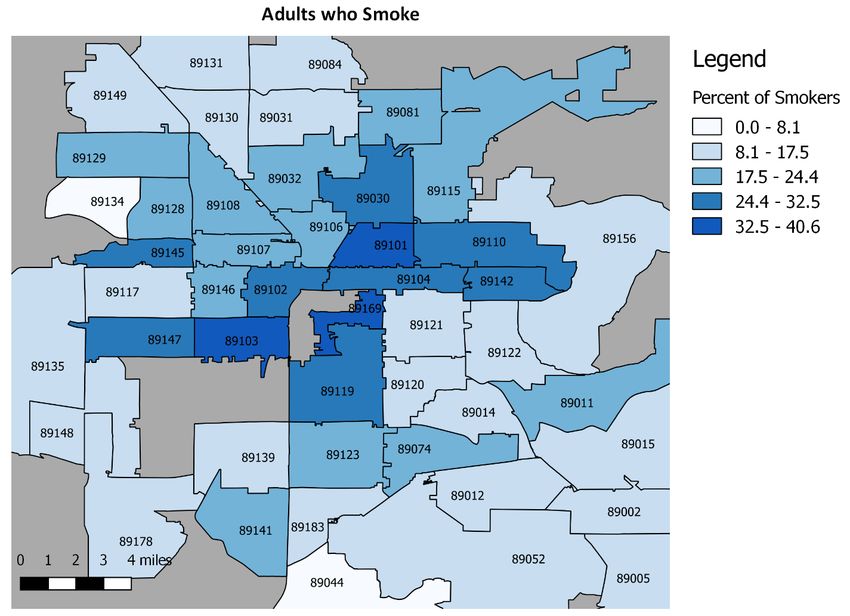
Comprehensive Community Substance Abuse Prevention Plan 2019-2021 Page 13ADOLESCENT ADMISSIONS TO DRUG TREATMENT One of the biggest risk factors for substance use and abuse among youth is the exposure to peers and family members who use drugs and alcohol. In 2016, there were 5,903 people in substance use treatment in Nevada (SAMHSA, 2018). Of those individuals seeking treatment for substance use disorder, just 3.4 percent (n = 202) of them were under age 18, a 63.1 percent decrease from 2015 (NV DPBH, 2017). However, SAMHSA estimates that nationally only 1 in 10 people seeking treatment in a year are able to access services. Therefore, based on the estimated 202 youth in treatment in 2016 we can estimate that roughly 2,000 youth in our state may have been seeking treatment, but were unable to access services. Further, Nevada is ranked 49th in the nation in access to mental health and substance use treatment professionals. To further illustrate the lack of treatment services, for a population of 2.2 million residents, Clark County currently has 16 residential beds for youth, 8 of which are for foster youth, and 8 are reserved for those with private insurance, making it necessary for the majority youth seeking treatment in Clark County to go outside Nevada to access inpatient treatment services. TOBACCO USE Smoking is the leading cause of preventable death in the United States. Cigarette smoking causes more than 480,000 (or nearly 20%) of deaths in the United States each year (CDC, 2017). Smoking causes more deaths annually than alcohol use, motor vehicle accidents, fire-arm related deaths, illegal drug use, and HIV combined. Tobacco use also increases the risks for heart disease, stroke, lung cancer, and a number of other health issues. Other effects of smoking include difficulties becoming pregnant, and can cause health issues with fetuses and infants. Areas like Clark County, with a high smoking prevalence, have high second hand smoke exposure rates for non-smokers. Secondhand smoke causes serious health effects in both adults and children. Children experience health effects like ear infections, asthma attacks, respiratory infections, and a greater risk for sudden infant death syndrome (SIDS) (CDC, 2017). Adults exposed to secondhand smoke can experience a greater risk for heart disease, lung cancer, and stroke. ADULT SMOKING More than 15 of every 100 adults in the United States aged 18 years or older (15.5%) currently smoke cigarettes (CDC, 2018b). An estimated 37.8 million adults are current cigarette smokers, a decrease of nearly 4.3 million since 2013 (CDC, 2018b). In Nevada, 17.5 percent of adults report being current smokers, and smoking is more common among males (20.5%) than females (14.6%), and more common among African Americans (27.4%) than white (17.5%) and Hispanic (14.3%) of adults (NV BRFSS, 2015). In Clark County, the rate of adult smoking decreased from 17.4 percent in 2012, and 20.5 percent in 2013 to 16.9 percent in 2015 (NV BRFSS, 2015). The map below disaggregates reports of adults who smoke by zip code in Clark County. The examination of zip code level data highlights several zip codes in Clark County in need of additional program to combat high smoking rates. The zip codes served by PACT which have smoking rates above the Clark County average rate, in order of severity, include: 89169, 89101, 89103, 89119, 89147, 89145, 89030, 89104, 89110, 89142, 89081, 89146, 89106, 89115, 89032, 89011, 89074, 89123, and 89141. Comprehensive Community Substance Abuse Prevention Plan 2019-2021 Page 14
YOUTH SMOKING AND TOBACCO USE
Much like adult smoking rates, youth smoking rates have been on the decline nationally. In 2017, 21.8
percent of Clark County high school students report having ever tried smoking cigarettes, but only 5.4
percent report smoking cigarettes during the past 30 days, and 4 percent were daily smokers (NV YRBS,
2018c). Only 10.5 percent of students surveyed used any type of tobacco product in the past 30 days.
However, declines in the use of traditional tobacco products are being offset by increasing usage of
vapor products like e-cigarettes. In Clark County, 40.6 percent of high school students reported having
ever used a vapor product and 12.9 percent reported using one in the past 30 days (NV YRBS, 2018c).

COMMUNITY AND FAMILY SUPPORT
The presence of strong family bonds is a primary protective factors for preventing substance abuse in
youth (NIDA, 2002). This includes parental monitoring of children’s activities and their friends and the
establishment of clear rules that are consistently enforced. Other familial protective factors includes
consistent parental involvement in the lives of their children. Success in school and strong bonds with
institutions such as schools also provide protection against the development of substance abuse
problems (NIDA, 2002).

OWNER OCCUPIED HOUSING RATES
Risk factors for substance abuse include disconnection from community and the lack of a strong
neighborhood. Homeownership is an indicator of community connection, organization, and stability

Comprehensive Community Substance Abuse Prevention Plan 2019-2021                                 Page 15
(Rohe, Van Zandt & McCarthy, 2001). For this reason, we examined the level of homeownership in Clark
County as a possible indicator for risk of substance abuse. In Clark County, 54.2 percent of housing is
owner occupied, which is just slightly lower than the national average of 56.3 percent (Census Bureau,
2018).

POVERTY
In Nevada, 18.2 percent of children under the age of 18 live in poverty (Census Bureau, 2018). In Clark
County, the overall poverty rate is 12.8 percent and the childhood poverty rate is 20.3 percent (Census
Bureau, 2018). Poverty rates vary widely across the county, with some zip codes having well below
average rates of poverty rates and others having poverty rates well above average. Poverty decreases
the resources available for adults and families to respond to issues when they arise. Adults and
adolescents living in poverty are at increased risk of substance abuse and tobacco use compared to
individuals not living in poverty.

The following zip codes in Clark County have higher overall rates of poverty (highest rates listed first):
89030, 89106, 89101, 89169, 89115, 89104, 89119, 89156, 89110, 89121, 89103, and 89146. These
areas are identified as being at higher risk for substance abuse, and will need additional programming
for substance abuse prevention.

ACADEMIC SUCCESS
In Nevada, 85.4 percent of individuals over the age of 25 have completed high school, making Nevada
the 10th lowest performing state nationally in terms of high school completion (Census Bureau, 2018). In
Clark County, 85 percent of individuals over the age of 25 have completed high school, just slightly lower
than the rate for Nevada (Census Bureau, 2018).

Nationally, 6.7 percent of students indicated that they had not attended school on at least one day
during the 30 days prior to the survey because they felt unsafe at school or on their way to school (NV
YRBS, 2018a). . In Nevada, 8.7 percent of students indicated that they had not attended school on at
least one day in the past month because they felt unsafe (NV YRBS, 2018a). The rate for Clark County
was just lower than Nevada, at 7.9 percent of students (NV YRBS, 2018c).

SINGLE PARENT HOUSEHOLDS
In 2016 in the United States, 31 percent of households were led by single parents (US Census Bureau,
2018). In Clark County that rate is just above the national average, with 38.2 percent of households
being led by a single parent between 2012 and 2016 (Census Bureau, 2018). Children in single-parent
households, or households in which an adult family member leaves for long periods of time, are more at
risk to develop adverse health effects like emotional and behavioral problems compared to their peers
in two parent households (Amato & Anthony, 2014). Children and parents in these households are more
likely to have depression, smoke, and deal with issues of substance abuse.

In the following map, the disaggregated data shows rates of single led parent households in Clark
County. A large number of zip codes in the county and in PACT’s service area are single parent
households. The following zip codes in PACT’s service area are at higher risk (those with the highest
rates are listed first): 89109, 89019, 89106, 89169, 89018, 89101, 89115, 89119, 89086, 89108, 89121,
89103, 89030, 89104, 89156, 89118, 89142, 89081, and 89146. These zip codes will need additional
programming targeting substance abuse prevention.

Comprehensive Community Substance Abuse Prevention Plan 2019-2021                                   Page 16
PREVALENCE OF ADULT DEPRESSION
Depression is a common mental disorder for adults in the United States. It often co-occurs with other
illnesses such as cancer, substance abuse, anxiety, and other serious illnesses (NIMH, 2018). Depression
often co-occurs with other illnesses such as anxiety disorders, substance abuse, and cancer. People with
depression may have difficulty seeking care, including seeking care for substance abuse.

Depression affects nearly 16.2 million American adults, or about 8.1 percent of the U.S. adult population
(CDC, 2018c). In Clark County, 16.6 percent of adults have been told by a doctor, nurse, or other health
professional that they had a depressive disorder including depression, major depression, dysthymia or
minor depression (NV BRFSS, 2016). This is nearly double the rate of depression reported nationally.

The map below presents the disaggregated data shows rates of adult depression in Clark County. Nearly
all the zip codes in Clark County are above the national average. Only three zip codes fall near or below
the national prevalence of adult depression: 89011, 89135, and 89169. The following zip codes have
substantially higher rates of depression in the PACT service area: 89084, 89103, 89117, 89119, 89031,
89134, 89131, 89002, 89106, and 89074. These zip codes, and others in the PACT service area will need
additional programming around substance abuse prevention.

Comprehensive Community Substance Abuse Prevention Plan 2019-2021                                Page 17
YOUTH DEPRESSION AND SUICIDE ATTEMPTS
Depressive symptoms has been linked to the initiation of drug use in adolescents. In 2017, 31.5 percent
of youth nationally reported feeling sad or hopeless every day for 2 or more weeks, slightly higher than
the rate in 2013 (YRBS, 2014, 2018). Just over 17 percent (17.2%) seriously considered suicide, an
increase from 2013 and 13.6 percent made a plan about how they would attempt suicide – unchanged
from 2013 (YRBS, 2018). Nationally, 7.4 percent of youth attempted suicide, with 2.4 percent of those
suffering an injury, poisoning, or overdose related to a suicide attempt (YRBS, 2017).

In Nevada, 34.6 percent of youth reported feeling sad or hopeless every day for 2 or more weeks, a
slight rise from 2013 (NV YRBS, 2018). Just over 16 percent (16.6%) of youth considered suicide and
14.4 percent made a plan about how they would attempt suicide, a slight decrease from 2013 (NV YRBS,
2018). In Nevada, 8.5 percent of youth actually attempted suicide, and 2.6 percent of those attempting
suicide suffered an injury, poisoning, or overdose related to a suicide attempt (NV YRBS, 2018).

The rates indicating depression and suicide attempts for youth in Clark County are lower than those at
the state level. In Clark County, 34.4 percent of youth indicated that they felt sad or hopeless every day
for at least the past two weeks (NV YRBS, 2018b). Nearly 16 percent (15.9%) of youth seriously
considered suicide, and 13.8 percent made a plan about how they would attempt suicide. The rate for
actual suicide attempts is slightly lower than the rate for Nevada, at 8.2 percent, with 2.4 percent of
those attempting suicide in Clark County suffering an injury, poisoning, or overdose related to a suicide
attempt (NV YRBS, 2018b).

Comprehensive Community Substance Abuse Prevention Plan 2019-2021                                 Page 18
These high rates of adult depression and suicide attempts in Clark County have led the PACT Coalition to
target reduction in suicide attempts/completions as one of their priorities.

ADVERSE CHILDHOOD EXPERIENCES
Childhood experiences, both positive and negative, impact health outcomes later in life. Negative, or
adverse, childhood experiences (ACEs) such as abuse and neglect and exposure to negative household
environments like substance abuse and domestic violence can result in adverse health outcomes in the
future (CDC, 2016b). Overall, ACEs are common – in the original study which investigated the role of
ACEs in negative health outcomes, nearly two-thirds of study participants reported at least one ACE, and
more than 20 percent reported three or more ACEs (Felitti et al., 1998). However, ACEs impact on
future health outcomes are a graded dose response (Felitti et al., 1998); meaning that increased
exposure to ACEs are directly related to increased risk for alcoholism, illicit drug use and abuse,
depression, attempted suicide, and other negative health outcomes (Dube et al., 2003; Felitti et al.,
1998).

In Nevada, the 2015 YRBS asked high school students about their experiences with ACEs. Female
students, students receiving free or reduced lunch, LGB students, and students with a family member in
the military were significantly more likely to report two or more ACEs in their life. Students who
reported 3 or more ACEs were significantly more likely to report substance use than students who
reported two or fewer ACEs (Table 4) (NV YRBS, 2015). This information is critical in developing
prevention strategies that address the adverse experiences people experience in childhood as they have
a direct link to substance use/abuse in teens and adults.

  Table 4. Rates of Adverse Childhood Experiences among High School Students in Nevada*

                                                      0 ACEs     1 ACE    2 ACEs    3+ ACEs    p-value
 Currently drinks alcohol                             20.6%      34.3%    36.2%      40.8%
ASSESSMENT OF CAPACITY The following section reviews the existing capacity of substance abuse prevention through the community partners and sub-grantees that the PACT Coalition works with to provide programming, support, and resources. The data reported in this section was collected through interviews with community stakeholders and key informants. In the past year, the PACT Coalition has worked with approximately 450 people at 125 community partner organizations and with 16 sub-grantees. PACT sub-grantees provided services to 5,103 individuals during the prior year. Conferences and summits reached 450 participants, presentations to senior centers, other coalitions and organizations, WIC offices, community centers, schools, churches, and others reached over 4,500 participants. Pill take back events collected more than 3,500 pounds of pills, and other outreach events reached more than 10,000 participants. ORGANIZATIONAL CAPACITY To learn more about the role that PACT plays in the community, interviews were organized with 14 stakeholders that work with the PACT Coalition. Stakeholders were identified by the PACT Coalition and NICRP contact each of the stakeholders to complete a brief interview. Interviews consisted of 18 questions, and interviews lasted between 30 and 45 minutes. Participants have been working with the Coalition for as long as since the Coalition’s founding to as little as one year. Participants included community partners, grantees, and a former board member. Stakeholders were asked what they felt the biggest accomplishments their organizations were able to achieve through their collaboration with PACT over the past two years. Many felt that the establishment of and participation in the Southern Nevada Opioid Advisory Council was one of the most important accomplishments in the prevention community of the past few years. One participant said about the Southern Nevada Opioid Advisory Council, “I think another accomplishment has been, the two years that we’ve had our opioid advisory council, together, really being able to work collaboratively and to lean into the strengths of each organization.” Stakeholders also stressed that the training events they were able to participate in or offer were an important part of the support they receive from the Coalition. One stakeholder said “the most significant to me… they’ve actually provided training funding for me to train not just my staff, but also community partners in parent education programs.” She noted that she has been able to offer evidence based training that can be very cost prohibitive, and therefore the financial support of the Coalition was critical in being able to bring this training to Southern Nevada. Key informants were also asked about the benefits of working with the PACT Coalition. Participants viewed being able to make connections with other community partners as one of the biggest benefits of working with the PACT Coalition. About connecting with other community partners, one stakeholders said “collaborating with all organizations with all non-profits, all for profits, when it comes to suicide prevention… because we can’t do suicide prevention alone.” Other benefits that stakeholders identified included being able to attend coalition meetings and learn about events, activities and services as well as develop important professional relationships with other members of the Coalition that help them to better serve their own clients. Key informants were also asked if there were additional ways that PACT could serve their community partners. Many wanted PACT to continue offering trainings and to add new trainings. Others felt that Comprehensive Community Substance Abuse Prevention Plan 2019-2021 Page 20
You can also read