MAXIMISING THE RETURNS - THE ROLE OF COMMUNITY HOUSING IN DELIVERING NSW'S FUTURE HOUSING NEEDS - Community Housing Industry ...
←
→
Page content transcription
If your browser does not render page correctly, please read the page content below
MAXIMISING
   THE RETURNS
   THE ROLE OF COMMUNITY
 HOUSING IN DELIVERING NSW'S
   FUTURE HOUSING NEEDS

A REPORT PREPARED FOR THE COMMUNITY HOUSING INDUSTRY ASSOCIATION NSW

                          JUNE 2021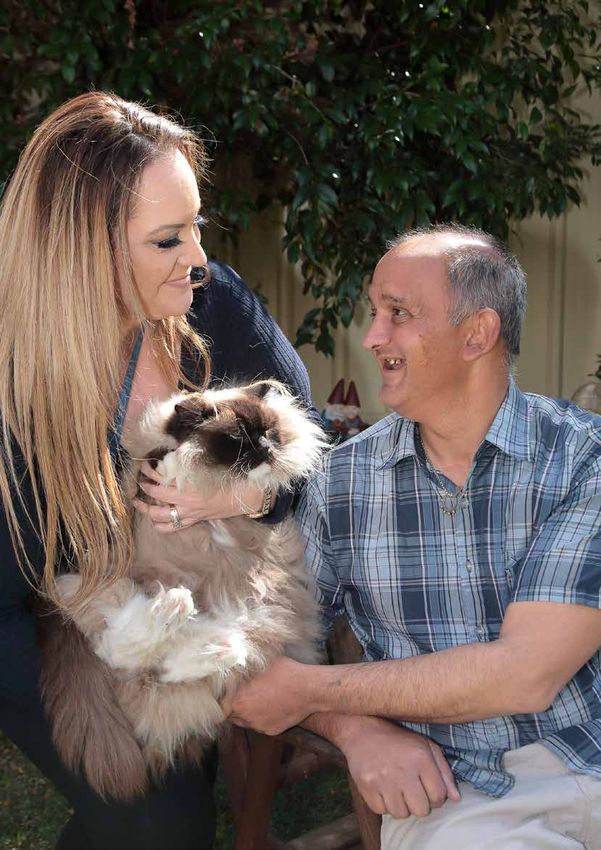
EQUITY ECONOMICS

                                                ABOUT EQUITY
                                                ECONOMICS
                                                Equity Economics is an Australian based
                                                economic consultancy committed to
                                                providing quality economic analysis and
                                                policy advice to the not for profit, corporate
                                                and government sectors. With the aim
                                                of providing organisations with access to
                                                the skills and expertise required to deliver
                                                effective strategies and influence policy
                                                debates, Equity Economics’ expertise
                                                includes economic analysis, policy advice,
                                                research, advocacy and strategy on some
                                                of Australia’s most complex economic and
                                                social policy challenges. The unique focus
                                                of Equity Economics on addressing issues
                                                surrounding inequality drives passion for
                                                inclusive growth, equality of opportunity
                                                and stronger bilateral and multilateral
                                                relationships. Equity Economics strives to
                                                bolster development and shared prosperity
                                                in our region and internationally.

      ACKNOWLEDGEMENT OF COUNTRY
      Equity Economics acknowledges Aboriginal and Torres Strait Islander peoples as the
      Traditional Owners of Country throughout Australia and their continuing connection
      to both their land and seas. We also pay our respects to Elders – past and present – and
      generations of Aboriginal and Torres Strait Islander peoples now and into the future.

2
MAXIMISING
    THE RETURNS
    THE ROLE OF COMMUNITY
  HOUSING IN DELIVERING NSW'S
    FUTURE HOUSING NEEDS

A REPORT PREPARED FOR THE COMMUNITY HOUSING INDUSTRY ASSOCIATION OF NSW

                            JUNE 2021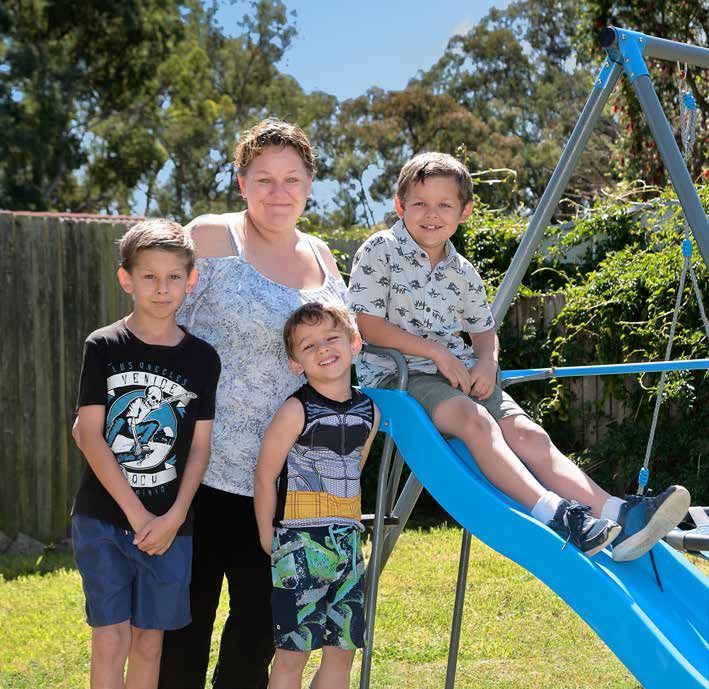
EQUITY ECONOMICS

    MEETING
    THE GROWING
    NEED FOR
    SOCIAL HOUSING
    530,000 households and 1.4 million people in NSW
    are living in housing stress, and need more affordable
    housing options, including social housing.

    While based on the OECD average NSW currently has a shortfall of 70,000
    social housing units, previous UNSW modelling has estimated that the
    real shortfall is over 135,000 social housing units. Waiting times for social
    housing of over ten years in some areas of NSW are contributing to rising
    levels of homelessness.

    The NSW Government’s Housing 2041 Strategy outlines the need for a
    strategic partnership between Government and the community housing
    sector to meet the housing needs of NSW. In this report we demonstrate
    how this partnership will deliver value for money for NSW taxpayers and
    large benefits for the NSW economy.

    Original modelling by Equity Economics finds that delivering the
    additional social housing needed through community housing providers
    would generate a return on investment over 50 per cent higher, from the
    perspective of the NSW Government, compared to delivery through public
    housing.

    Equity Economics forecasts that NSW needs to build, on average, an
    additional 5,000 social housing units per year over the next 30 years to meet
    and maintain the OECD average. Based on a model development this would
    require approximately $2.2 billion per year in building and land costs if NSW
    built all this housing through its own Land and Housing Corporation.

    However, the NSW Government can, by leveraging the community housing
    sectors ability to borrow and receive additional commonwealth funding,
    deliver these additional 5,000 housing units per year for less:

         $631 million less if delivered exclusively through community
         housing providers; and

         $316 million less if delivered 50:50 through community housing
         and the state government’s own Land and Housing Corporation.

    The ongoing investment in social housing will generate jobs in the
    construction sector, reduce homelessness and drive broader economic
    growth. Building an additional 5,000 homes per year would deliver
    economic and social benefits, including:

4
MAXIMISING THE RETURNS THE ROLE OF COMMUNITY HOUSING IN DELIVERING NSW'S FUTURE HOUSING NEEDS

The ongoing
investment in
social housing
will generate jobs in the
construction sector, reduce
homelessness and drive broader
economic growth. Building an
additional 5,000 homes per year
would deliver economic and
social benefits, including:

                16,200                                                 750 less
                construction jobs                                      people
                supported each year.                                   entering
                                                                       homelessness
                $5.2 billion                                           each year
                                                                       saving $13 million each year
                in additional economic                                 in avoided costs, including
                activity each year.                                    increased health expenditure.

                                            Improved health,
                                            social, educational &
                                            employment outcomes
                                            leading to long term improvements in productivity,
                                            that would on previous estimates equate to at
                                            least $3,818 per household in Sydney and $158 per
                                            household in regional NSW by 2049.

Over 50 per cent                                     NSW Government could save
higher return                                        $631 million by delivering
on investment through community                      5000 social housing units
housing compared to public housing.                  through community housing. 5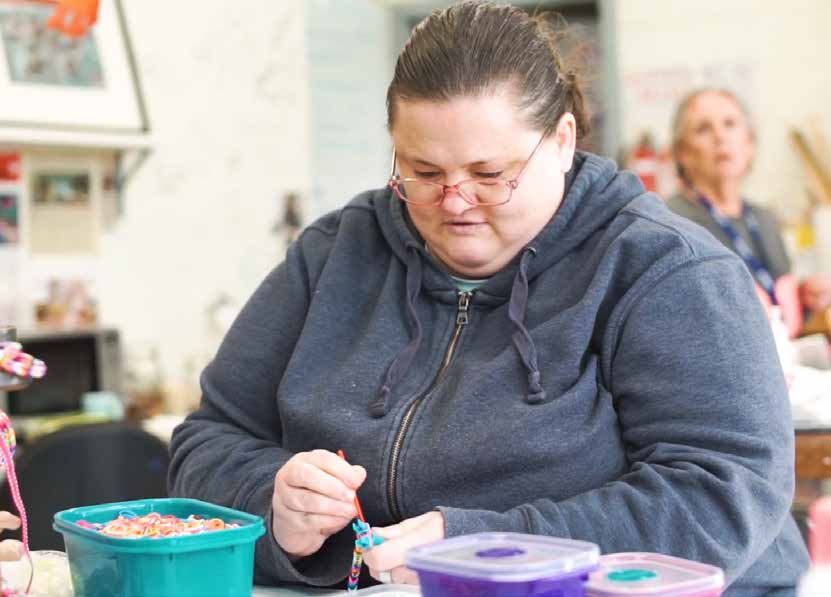
EQUITY ECONOMICS

6
MAXIMISING THE RETURNS THE ROLE OF COMMUNITY HOUSING IN DELIVERING NSW'S FUTURE HOUSING NEEDS

GAIBRIELLE
Gaibrielle has lived in community
housing with Pacific Link since she was
one. As the first person in her family to
go to university, she has been awarded
two scholarships through Pacific Link
to support her studies, and shares that
the stability of community housing has
played a significant role in her life.

I’ve lived in community
housing almost all my life.
My mum was a single parent,
on the disability pension
and unable to work. She
was living from house to
house, with my two brothers moving from school to school. Mum
had previously been homeless and living with really challenging
personal circumstances. She was initially referred to community
housing through a women’s refuge. Before that, Mum had never
lived anywhere stable.

She passed away last year and that led to a bit of a time of reflection for me, in thinking about
what Pacific Link meant for mum. I’d say she probably could have rung them for anything and
they would have found a way to help her. Mum has always spoken so highly of Pacific Link. She
was so worried that I would be homeless after she passed and it was just so reassuring for her to
know that my housing was looked after, and that I could remain a tenant with Pacific Link at a
new place in Newcastle.

In addition to stable housing, Pacific Link have been incredible in helping me, awarding me
with two scholarships to support my education. This enabled me to have a laptop, printer and
an opal card to get to classes.

I’m really grateful for all the opportunities I’ve had. I’m the first
person in my family who has gone to university. I’m now in my last
semester, studying a Bachelor of Social Science, with the goal of
becoming a social worker.

                                                                                                    7
EQUITY ECONOMICS
GROWING NEED
There is a large and growing need for investment in social and affordable
housing to meet the housing needs of the people of NSW. 51,395 people were
waiting for public and community housing in June 20201 and 1.4 million people
were experiencing housing stress in NSW.2
Social Housing in the 2020-21 Budget for new and upgraded
housing and approximately 780 new social
Social housing provides both a safety net homes. However, this falls short of the ongoing
and a springboard for those experiencing investment required to address the current and
disadvantage. It provides insurance against the projected shortfall.
risk of homelessness and through acting as a
foundation for other supports can offer a means Across the OECD, Australia has below the
to break the cycle of disadvantage. average social housing stock, reflecting decades
of underinvestment. In 1991, social housing stock
As acknowledged in the May 2020 NSW stood at 7.1 per cent of total housing in Australia,
Government Housing Strategy Discussion Paper, and by 2018 this had fallen to 4.2 per cent.4 This
investment in social housing has not kept pace is 2.9 per cent below the latest available OECD
with population growth and demand.3 Reflecting average.
this need, the NSW Government invested $812m
FIGURE 1 SOCIAL HOUSING AS A % OF TOTAL HOUSING STOCK (2020 OR LATEST AVAILABLE)
40
35
30
25
20
15
10
5
0
Netherlands
Austria
Denmark
United Kingdom
France
Ireland
Iceland
Finland
Korea
Switzerland
Poland
OECD Average
Slovenia
Malta
Australia
Norway
Italy
Belgium
New Zealand
United States
Canada
Hungary
Japan
Germany
Portugal
Turkey
Latvia
Slovak Republic
Luxembourg
Spain
Estonia
Lithuania
Czech Republic
Colombia
Source: OECD, Affordable Housing Database. 2020 or latest available.
8
MAXIMISING THE RETURNS THE ROLE OF COMMUNITY HOUSING IN DELIVERING NSW'S FUTURE HOUSING NEEDS
In NSW there are 96,939 state owned social Only accounting for population growth and not
housing dwellings and 53,031 community and other demographic shifts, the number of social
Aboriginal community housing dwellings.5 This housing dwellings needed to match the OECD
equates to around 5 per cent of NSW housing average will increase to over 300,000 by 2050,
stock, above the Australian average. However, twice as many as NSW currently has across public
in order for NSW to reach the OECD average, it and community housing.6
would require an additional 70,000 social housing
The gap between the need and supply of social
dwellings.
housing needed to reach the OECD average could
Demand will continue to increase, as the be bridged through building an additional 5,000
population grows and ages into the future. units per year of social housing in NSW.
FIGURE 2 EXPANDING SUPPLY OF SOCIAL HOUSING TO MEET NSW CURRENT AND FUTURE NEEDS
350,000
Stock Need Potential Expansion
300,000
250,000
200,000
150,000
100,000
2020
2021
2022
2023
2024
2025
2026
2027
2028
2029
2030
2031
2032
2033
2034
2035
2036
2037
2038
2039
2040
2041
2042
2043
2044
2045
2046
2047
2048
2049
2050
2051
2052
Expanding the social housing stock by 5,000
units per year would involve approximately $2.2
billion in building costs per year.7 Even partly
meeting the current and forecast increase in
need for social housing will require a significant
ongoing investment from the NSW Government.
Ensuring that this investment represents
value for money and maximises the return
on investment for NSW taxpayers will drive
potential costs savings, and maximise the
leverage of any investments. In section 3 we
assess the return on investment of delivering
increased stock through community housing
providers or the NSW Government. This analysis
shows that not only are the costs lower for
community housing providers, but there is also
higher potential revenue which reduces the level
of funding required from the NSW Government.
9
EQUITY ECONOMICS

     What is                       What is
     social housing?               community
     Long term housing for those   housing?
     on low incomes who may:
                                   Community housing providers offer
        be unable to work; or      social housing as well as affordable
        have support needs.        rental housing that is rented below
                                   market rates to those on lower incomes.

10
MAXIMISING THE RETURNS THE ROLE OF COMMUNITY HOUSING IN DELIVERING NSW'S FUTURE HOUSING NEEDS
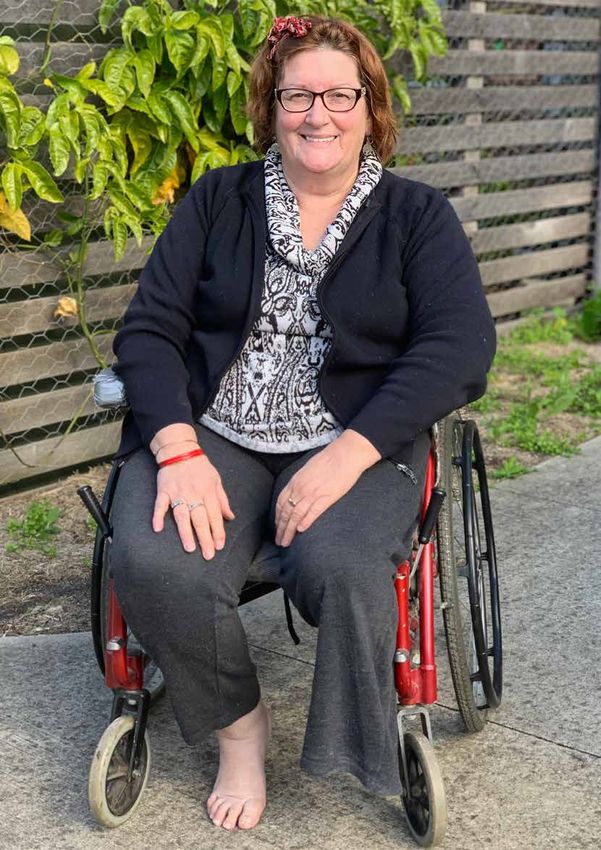
MARGARET
Margaret is an Aboriginal woman who identifies as a Wiradjuri woman, as her ancestors
originated from Wiradjuri country . For many years, Margaret worked with her kin in both
teaching roles and as a foster carer. Before this, she worked as Aboriginal Officer within the
Department of Housing. Margaret has been diagnosed with a neurological disorder and
became a community housing tenant relatively recently.
For Aboriginal people, it can be particularly challenging to find housing. As a smaller group, we
get singled out. We are often labelled with the stigma that we are ‘bad’ tenants, and that we
don’t appreciate anything or that we won’t look after things. We see this in private rental all the
time where the response is just “nothing available.” All this racism is very sad and when we found
ourselves in a situation where we needed housing ourselves, I said to my husband, “we have no
chance at all.”
But actually, we were very much welcomed at Housing Trust and they found us a villa. I was
initially worried about acceptance but I would say it has been a very positive experience, almost
across the board. In the circumstances where there were issues with racism, Housing Trust
addressed these and since then it has been great.
Acceptance is really important to me. Of who you are. What you are. As you
are. Everyone has their story. At Housing Trust, I have people around me
who care. I have a medical condition where I have very serious seizures.
Here, people know what to do when I have a seizure and they support me.
You really know who your friends are when it comes to health issues.
You wouldn’t find this support anywhere else. Housing Trust have crisis workers to solve issues,
and one of their staff members came to visit me in hospital. She went back to Housing Trust
and said, “this has happened to one of our tenants and we need to support her.” In another
environment, you would just be on your own.
I’m very lucky in our villa. I love it. I have an art space where I can do Aboriginal Art. A lot of healing
is needed for our people and my art is part of this. Coping with all the trauma is very challenging.
It goes without saying that the Stolen Generation comes into things too. When I was younger, we
saw a lot of kids get taken. In my case, I was relatively lucky in that my brother was able to hide
me quite well. For some of these Elders now, they know their children are out there somewhere –
pretending to be white. It is still really raw. All of a sudden people weren’t allowed to be who they
were. Weren’t allowed to live the way they were. Everything has been taken away. Culture. Land.
Even our kids. Where do you call home?
When I think more broadly beyond the work of Housing Trust and consider the role of
Aboriginal community housing, it is fairly good, with a lot of elderly people living together. If
we had unlimited funding, I would like to see much bigger kitchens and more bedrooms to
accommodate the large, extended families. In addition to the physical layout, ideally it would also
be an environment that enables trauma recovery.
Cultural Awareness training is so necessary, particularly for people that work in the services, not
just for Aboriginal people but for all cultures.
11EQUITY ECONOMICS
Affordable Housing
Affordable housing ensures that households can access quality housing without compromising their ability to
meet other needs, and is available to people on moderate incomes as well as very low incomes. NSW has the
worst levels of housing affordability in Australia, due to higher housing costs that are not offset by higher than
average incomes.
The number of people in NSW experiencing housing stress has grown over time, and in 2017-18, 48.3 per cent
of low income and 18.2 per cent of all households spent more than 30 per cent of their income on meeting
housing costs.8 This represents 530,000 households and 1.4 million people in NSW that are living in housing
stress, and could benefit from more affordable housing options.
FIGURE 3 PERCENTAGE OF LOW-INCOME HOUSEHOLDS SPENDING MORE THAN 30 PER CENT OF THEIR
INCOME ON HOUSING
60
2007-08 2009-10 2011-12 2013-14 2015-16 2017-18
50
40
30
20
10
0
NSW VIC QLD SA WA TAS NT ACT
Source: Australian Bureau of Statistics (2019), Housing Occupancy and Costs 2017-18 Financial Year,
https://www.abs.gov.au/statistics/people/housing/housing-occupancy-and-costs/latest-release
This growth in housing stress has been due to rising house prices and rents, higher mortgages and a
decline in home ownership. Between 1988 and 2017 the proportion of young people aged 25-34 who owned
their home declined from 54 per cent to 35 per cent.9 As a result, the proportion of people renting has
increased in NSW over time, from 25 per cent in 1994 to 31 per cent in 2017.10
FIGURE 4 CHANGING TENURE TYPES IN NSW
100
80
60
40
20
0
1994-95
1995-96
1996-97
1997-98
1999-00
2000-01
2002-03
2003-04
2005-06
2007-08
2009-10
2011-12
2013-14
2015-16
2017-18
Owner without a mortgage Owner with a mortgage State or territory housing authority Private renters
Source: Australian Bureau of Statistics (2019), Housing Occupancy and Costs 2017-18 Financial Year,
https://www.abs.gov.au/statistics/people/housing/housing-occupancy-and-costs/latest-release
12MAXIMISING THE RETURNS THE ROLE OF COMMUNITY HOUSING IN DELIVERING NSW'S FUTURE HOUSING NEEDS
Aboriginal and Torres Strait
Islander Housing
Aboriginal and Torres Strait Islander people
are more likely to live in social housing (21%)
than the average across Australia (4%).11
However, currently only 4.0 per cent of the
stock of social housing is provided through
Indigenous Community Housing.12
The expansion of the provision of culturally
safe and supportive housing solutions for
Aboriginal and Torres Strait Islander people
is a priority under the new Closing the Gap
Agreement. This will require substantially
increased investment in the sector over time
to ensure that targets are met.
Building Supply
A lack of investment over 20 years has
resulted in a significant drop in the number
of social housing units relative to the
population.13 At the same time housing
affordability has fallen. Addressing this
shortfall over the next 30 years will require
additional investment from Government
of up to $2.2 billion per year. However as
we show later in this report, these costs
could be reduced through partnering with
community housing providers. In addition,
there are quantifiable economic and social
benefits of this investment. These are
explored in the next section, before analysis
of the relative return on investment through
delivering additional supply through public
versus community housing is explored.
Community Housing in NSW
With a 40-year history, the community housing sector in NSW is the
largest in Australia. As at May 2021, 169 Community Housing Providers
(CHPs) in NSW are registered through, and regulated by, the National
Regulatory System for Community Housing.14
Community Housing Providers (CHPs) build and manage safe and
affordable homes that are available to tenants on very low, low and
moderate incomes to ensure quality outcomes for tenants, investors and
government. In NSW, CHPs own or manage more than 51,000 properties,
representing more than one-third of all social housing properties.5
13EQUITY ECONOMICS
Community
THE COMMUNITY HOUSING SECTOR:
housing in NSW
Supports the people of NSW, with tenants located in
small and large communities, coming from a range of
backgrounds, including:
by numbers
People on a disability or aged care pension.
Those who have experienced family violence or
homelessness.
Aboriginal and Torres Strait Islander people. 100+ community
Some essential services workers who would otherwise be housing providers
priced out of the area.
Places tenants first, often providing services in addition
to housing such as employment programs and education
More than
assistance scholarships. 51,000 properties
Includes Aboriginal Community Housing Providers
(ACHPs), with 100 organisations15 providing housing services 84% tenant
aimed at meeting the needs of Aboriginal people.
satisfaction
Is environmentally focused, with sustainability being a key
focus for CHPs who seek to create long-term infrastructure
with reduced climate impact. 45 Local
Is expanding rapidly. Since 2012, CHPs have delivered government areas
more than 3,000 new homes across NSW, representing an
investment of over $1.2 billion.16
Supported to grow by the Social and Affordable Housing
$1.2 billion
Fund, the Social Housing Management Transfer Program and in investment
the National Housing Finance and Investment Corporation.4
Reinvests profits with a focus on building and sustaining new developments:
Creating new economic investment in areas where it is most needed, driving growth and job creation.
Contributing to addressing the growing future housing demand, driven by the aging population.
Has many competitive advantages compared to private developers and state housing authorities. The
sector’s charitable status makes it exempt from GST, land tax and stamp duty, and enables the sector to
attract philanthropic donations. In addition, the recognition of CHPs as private landlords enables tenants
to receive Commonwealth Rent Assistance, thereby increasing CHPs’ income stream and rent revenue.
Can maximise the impact of government investment in social and affordable housing by redirecting
the value of their tax exemptions and their developer margins into additional housing supply. In this way,
CHPs can potentially deliver between 25 and 30 per cent17 more social and affordable properties than
would otherwise be available if the CHP or government purchased them from a private developer.
Usually retains most of their new housing stock for the long-term, so that they are focused on
designing high-quality homes which:
Are environmentally sustainable
Require less maintenance as a result of innovative design, and
Deliver cost savings to their tenants
14MAXIMISING THE RETURNS THE ROLE OF COMMUNITY HOUSING IN DELIVERING NSW'S FUTURE HOUSING NEEDS
CHARLES
Charles is Chief Executive Officer (CEO) of BlueCHP, a CHP that has
delivered 1,832 affordable homes since its inception. As Australia’s largest
developer of Specialist Disability Accommodation, Blue CHP operates as
a not-for-profit. In 2020, BlueCHP provided $5.75 million of social benefit,
with occupancy rates being 99.5 per cent to 100 per cent. As CEO,
Charles is responsible for all aspects of leadership.
We work with all sorts of tenants, whether they Corporation (NHFIC) to create construction loans,
may be exiting domestic violence or facing other consolidating fees into the construction period. We
challenges. I’m particularly proud of the commitment have a range of developments coming up, including
we make to people living with a disability. In 2020, a 63-unit development in Liverpool, and a 30-unit
337 people with a disability lived in our homes. development in Lane Cove, and two (2) developments
We established a brand, ‘Guide You Home’ which in Queensland delivering 80 apartments. NHFIC debt
supports people with high level disability with all is very advantageous to us. Without it, projects like
aspects of their housing needs. Importantly, we tailor these wouldn’t happen. It is as simple as that.
the homes to the individual’s needs and aspirations.
Because we don’t distribute profits, government
“Two people with the same disability can subsidies provided to CHPs stay within the entity
permanently and are continually recycled over and
require very different needs within their
over again, to make an ongoing impact on those in
home. Our ambition is to customise each need of housing. Government contributions can have
home.” a pretty big “bang for buck”. With the reinvestment
of this funding and the value of the various tax
When engaging with our tenants, it is not just about exemptions (GST, land tax and stamp duty), we
affordability of housing itself, it is about thinking can deliver significantly more social and affordable
about the long-term. For example, we’re very housing properties than would otherwise be possible.
conscious that those on the lowest incomes face the
highest ongoing electricity costs. We’re piloting solar What is exciting for us is that our aim is to create
panels in “cluster” grids to cut electricity prices for a 100 years legacy such as the Joseph Rowntree
clients, benefiting the environment and being fully Foundation in the UK. We have a small, amazing
self financing. We have also played a role in shaping team of people who are highly skilled, with the
the design standards for the NDIS Specialist Disability ability to manage a whole range of stakeholders
Accommodation (SDA). Under our Guide You Home such as families, real estate agents, Federal and State
program we are currently executing the construction governments delivering service excellence.
of almost $30 million worth of disability housing. When you design and build houses for people, it is
The role of financing can be complex – our Board very much a customer engaged experience, and
require financing to be in place before we begin client communication is critical. What motivates me
to develop a property. In our case, it can take up to personally is that real sense of giving back to society. It
two years before we start to construct a property was an example set by my grandparents and parents,
(once you have design and development approvals and it’s something I’ve passed on to my sons too.
completed). With bank loans, this can get very
“If you can give someone a stable house,
expensive as banks’ annual Line of Credit fees really
add up. It can be so expensive as to make the entire if you can give children a stable
project uneconomic. In terms of accessing lower education, then you start breaking long
cost financing, we were the first CHP to engage term poverty. That is one of our long term
with the National Housing Finance and Investment
motivating goals.”
15EQUITY ECONOMICS
ECONOMIC AND
SOCIAL BENEFITS OF
GREATER INVESTMENT
Addressing the current shortfall in social and affordable housing will
require significant additional investment from government. Building
5,000 additional social housing units a year will deliver significant
economic and social benefits across NSW.
Jobs Based on economic modelling by City Futures
Research Centre, if NSW built an additional
The most immediate positive impact of
5,000 houses over the next 25 years it would
increasing the stock of social housing is
generate productivity and participation
on construction jobs, with each $1 million
benefits of $3,818 per household in Sydney,
investment estimated to generate nine jobs
and $158 per household per year in regional
and around $2.9 million of industry output
NSW by 2049.20
and consumption across the economy.18
Building homes is the second most effective
mechanism for driving broader economic
Homelessness
growth, due to spill over effects.19 According to the 2016 Census, NSW has the
highest rates of homelessness in Australia
Building 5,000 new dwellings per year would
outside the Northern Territory.21 The NSW
generate up to 16,200 additional construction
Government has committed through its
jobs in NSW and also generate $5.2 billion in
Premier’s Priorities to reduce the rates of
additional economic activity each year.
street homelessness by 50 per cent by 2025.22
FIGURE 5 RATE OF HOMELESSNESS PER 10,000 PEOPLE
60
50
40
30
20
10
0
NSW VIC QLD SA WA TAS NT ACT
2006 2011 2016
Source: Australian Bureau of Statistics (2018), Census of Population and Housing: Estimating Homelessness
https://www.abs.gov.au/statistics/people/housing/census-population-and-housing-estimating-homelessness/latest-release
16MAXIMISING THE RETURNS THE ROLE OF COMMUNITY HOUSING IN DELIVERING NSW'S FUTURE HOUSING NEEDS
17EQUITY ECONOMICS
Increasing the stock of social housing reduces levels probability of employment by 11 per cent for males
of homelessness, as people in social housing are and 5 per cent for females.28
less likely to enter homelessness due to the benefits
Community housing providers often offer specific
of stable and affordable accommodation, and the
employment programs to their tenants. For
ancillary support services available.23
example, the Bridge to Work (Bridge Housing) and
The Journeys Home Study found that social Catalyst (SGCH) programs are delivered in-house
housing is associated with lower rates of entry into and provide intensive case management and
homelessness. Based on the findings from the study, employment support services to their tenants, while
we can estimate that an additional 5,000 social Neighbourhood Jobs (Link Wentworth Housing)
housing dwellings would reduce the number of is a social enterprise that provides employment
people entering homelessness in NSW by 750 each opportunities to young people working in the
year, saving $13 million per year.24 This means after property care industry.
four years an additional 20,000 social housing units
would reduce the number entering homelessness Health
by 3,000,25 generating savings in Government
expenditure of $52 million per year. Entering public housing has also been found to
improve health outcomes. These links are both
direct and indirect, with strong evidence of links
Employment between housing quality and health outcomes due
Research from the Productivity Commission has to improved air quality, heating, lower noise and
highlighted the positive association between improved safety.29
entering social housing and employment.26 The
A United States based study found that people
report highlights the importance of housing stability
currently in public housing had a 23 per cent lower
to employment outcomes, and that through
chance of poor health and a 41 per cent lower chance
providing this stability social housing assists people
of psychological distress than people on the
to find jobs.
waiting list.30
Based on administrative data from Western Australia
In Western Australian research, clients in the priority
and South Australia entering public housing
housing access pathway recorded lower health care
improves employment outcomes by up to
costs after entering public housing. The benefits
3 percentage points after one year.27
of moving into public housing equated to health
Previous research also from Western Australia found system savings of between $4,846 and $13,273 per
that moving into public housing increased the person per year.31
Education
Affordable housing and lower levels of crowding has
been found to reduce parental stress and improve
education outcomes of children.32 There is also a link
between improved health and education outcomes.33
A 2019 Australian based study found that
disadvantaged communities with higher levels of
low-density public housing performed better than
expected in relation to the percentage of children
that were developmentally vulnerable.34
And in 2016 an audit of 20 community housing
providers in NSW found that all provided some form
of educational support, including half that offered
scholarships or volunteer work placements.35
18MAXIMISING THE RETURNS THE ROLE OF COMMUNITY HOUSING IN DELIVERING NSW'S FUTURE HOUSING NEEDS
Community Housing Providers support
a diverse range of people in NSW
Social housing - percentage of households: Affordable housing
14 per cent were homeless - percentage of households:
prior to being housed by a CHP 9 per cent identify as Aboriginal
36 per cent have a householder 18 per cent come from culturally
member with a disability and linguistically diverse
Almost 9 out of 10 households have backgrounds
a Centrelink payment as their main
income source
Source: CHIA NSW State of the Industry Report: Community Housing in NSW (2018)
Domestic Violence
Around 25 per cent of all people seeking specialist housing services in NSW have experienced family violence,
reflecting the important link between breaking the cycle of violence and housing solutions.36
Women that leave violent and unsafe relationships too often end up in homelessness, and at a higher risk of
returning to an abusive partner. An increased supply of social housing will provide more women with safe
housing options.
ISOBEL Isobel knows the value of social and affordable housing. In her 50s,
Isobel works as a carer and is a Domestic Violence survivor.
Following a period of homelessness, I was Housing Trust works so hard to give
referred to community housing through a
people a safe place to live. What they do
women’s refuge. It was during a time in my
life where things were really challenging. I was
for the community is incredible. They
on NewStart and finding a place to live just have very much enabled a strong sense
wasn’t feasible. I’d inspected 55 rental properties of community among the tenants.
and was knocked back with every application.
We have a communal garden that people really
I was so excited to get the call from Housing
enjoy. Housing Trust do bus trips to senior gala
Trust to say that they may be able to help. The
events. They hold Christmas parties and offer
apartment they had available was just beautiful,
scholarships, supporting tenants with areas they
I couldn’t believe it. There was a room for me and
are dedicated to. They are quick to fix anything or
one for my 10-year old son. Straight away, I felt
handle any issues.
secure and I didn’t feel vulnerable. It was such a
blessing and I still pinch myself ten years later. I interact all the time with the other tenants and
we say hi when we see one another. We are part
The environment here continues to feels safe.
of a community.
I don’t sleep in fear. I am not worried about
someone coming through the window or the I feel safe here. I have very much
front door. Big security doors are on every unit. made it my own home.
Keys and buzzers are needed to get in. There are
security cameras and secure car parking.
19EQUITY ECONOMICS 20
MAXIMISING THE RETURNS THE ROLE OF COMMUNITY HOUSING IN DELIVERING NSW'S FUTURE HOUSING NEEDS

RETURN ON INVESTMENT
IN COMMUNITY HOUSING
VERSUS PUBLIC HOUSING
Social housing is currently delivered directly by NSW Government through the
Land and Housing Corporation (LAHC) and Department of Communities and Justice
(DCJ), and in partnership with community housing providers.

Given the scale of the investment task required to                               were able to cover the costs of development over a
meet long term demand for social housing, it is                                  30-year period.
prudent that the NSW Government reduce costs
                                                                                 The development is modelled as a 50-unit
and maximise its return on investment in social
                                                                                 development, with 30 2-bedroom and 20 1-bedroom
housing, and deliver the best social and economic
                                                                                 units will be made available to social housing
outcomes for tenants.
                                                                                 tenants.37
In this section we calculate and compare the return
                                                                                 Following is a summary of the costs and benefits
on investment (RoI) for a model development,
                                                                                 associated with the development, and presentation
presenting a RoI figure for community housing to
                                                                                 of the RoI. Further information about assumptions,
deliver the development, and another RoI for LAHC
                                                                                 calculations and sources are provided in the
to deliver.
                                                                                 Appendix.
We model a scenario where the Government
purchases the land for development and either
                                                                                 Costs
leases this land to a community housing provider on
a peppercorn long-term lease or transfers the land                               There are two types of costs: those that are required
to the LAHC. However, in reality the Government has                              for the initial development, and those that are on-
significant surplus crown land that could be used                                going in nature. The initial cost of the development
for such a development which would reduce the                                    includes the build cost, development costs and land
direct costs and improve the RoI calculated below.                               costs. On-going costs include interest, maintenance
In addition, it is assumed that the Government                                   and annual fees such as insurance and water rates.
would provide a subsidy to build community
housing that ensured community housing providers

TABLE 1 UNIT COSTS

                                                                       CHPs                                               LAHC
 One-off ($)
 CIVa                                                               16,244,000                                         17,868,000
 Land                                                                7,298,000                                          7,298,000
 Fees                                                                  61,000                                             67,000
 On-going ($/year)
 Interestb                                                            201,000                                            179,000
 Maintenance      c
                                                                      162,000                                            179,000
 Fixed costs                                                          216,000                                            237,000

Source: EE calculations; Notes: a. Capital investment value (CIV) includes all necessary project costs to establish the project, such as design and
construction, site services, and plant and equipment. See https://www.planning.nsw.gov.au/-/media/Files/DPE/Circulars/planning-circular-new-
definition-of-capital-investment-value-2010-05-10.pdf?la=en for a full explanation; b. Interest cost presented is only for the first year. It declines
over time as the principal is repaid; c. Maximum annual amount.
                                                                                                                                                         21
EQUITY ECONOMICS
As presented in Table 1, many of the costs are Land costs do not need to be financed
higher for LAHC, partly since LAHC has to pay GST, through community housing debt because the
whereas community housing providers do not. development is assumed to be built on land that
is either provided by government (i.e., surplus
The key outlier is interest costs, which are
government owned land), or to be financed by
assumed to be higher for community housing
government through a capital grant.
providers than LAHC. This is because, LAHC, as a
part of the NSW Government, has access to lower As presented in the table above, the annual
interest rate finance than community housing maintenance costs are higher for LAHC than
providers. It is assumed that LAHC’s capital for community housing providers. This figure
investment costs are financed through debt at an represents the maximum annual amount, and
interest rate of 1 per cent. is higher for LAHC because LAHC must pay GST.
Otherwise, due to a paucity of information, it is
As the NSW government is assumed to contribute
assumed that the maintenance costs are the same
to capital investment costs under the community
for both LAHC and community housing providers.
housing model of delivery, this contribution is also
financed at a rate of 1 per cent. To reflect that annual maintenance costs are lower
when the building is newer, and increase as the
For the community housing contribution to
building ages, a time profile of maintenance costs
capital investment costs, the model assumes
has been constructed for both community housing
debt finances 95 per cent of these costs at an
providers and LAHC. This is illustrated in the chart
interest rate of 2 per cent, and equity finances the
below.
remaining 5 per cent of the capital investment
costs.
FIGURE 6 TIME PROFILE OF ANNUAL MAINTENANCE COSTS
200,000
180,000
ANNUAL MAINTENANCE COSTS ($)
160,000
140,000
120,000
100,000
80,000
CHP LAHC
60,000
40,000
20,000
2021
2022
2023
2024
2025
2026
2027
2028
2029
2030
2031
2032
2033
2034
2035
2036
2037
2038
2039
2040
2041
2042
2043
2044
2045
2046
2047
2048
2049
2050
Source: Equity Economics calculations
22MAXIMISING THE RETURNS THE ROLE OF COMMUNITY HOUSING IN DELIVERING NSW'S FUTURE HOUSING NEEDS
Revenue
The primary revenue generated by the investment is the rental income received from tenants. In social
housing, rent is often based upon the tenant’s income.
Community housing tenants pay 25 per cent of income, plus Commonwealth Rent Assistance. Public housing
tenants are ineligible for Commonwealth Rent Assistance, and therefore LAHC receive just 25 per cent of
tenants’ incomes.
In order to estimate rental incomes, tenants’ income has been estimated. Further details are available in the
appendix.
TABLE 2 UNIT COSTS
CHPs LAHC
Annual rental income ($) 535,000 342,000
Source: Equity Economics calculations
Because community housing providers are eligible for Commonwealth Rent Assistance, their annual rental
income from the same size development is over 50 per cent higher.
Residual value of assets
At the end of 30 years, a significant proportion of the value of the building will have depreciated, reflecting
that the condition of the building has declined and aged.
The rate of decline of the value of the building is reflected in the chart below. It is assumed that the building
will depreciate by 3 per cent per year. The residual value of the building is included as a benefit in the
calculation of RoI.
FIGURE 7 TIME PROFILE OF DEPRECIATION OF BUILDING
18
16
14
VALUE OF ASSET ($) MILLIONS
12
10
8
6
4
2
0
2020 2030 2040 2050 2060 2070 2080
Source: Equity Economics calculations
23EQUITY ECONOMICS
Similarly, the land will still have value after 30 Return on investment
years. This takes into account the different way
The return on investment is calculated by dividing
in which land depreciates relative to buildings.
the costs by the benefits. A value greater than one
With land values tending to appreciate due to
implies that the revenue exceeds the costs.
scarcity, analysis undertaken by the Reserve Bank
of Australia found that since the early 1990s, the Before the costs can be divided by the revenue it is
value of land increased by an average of 7 per necessary to discount the costs and revenue – some
cent per annum.38 Over the same period general of which occur in the future, to a present value. To
prices increased by an average of 2.5 per cent per calculate the present value of costs and revenue,
annum, meaning that properties increased by 4.5 the future flow of costs and revenue is discounted
per cent per annum above the general inflation using a social discount rate of 4 per cent.
rate.39 As the analysis presented here is in constant
prices, just the difference between land prices and
general inflation is modelled (i.e. 4.5 per cent).
Discounting
Discounting future costs and revenue into a present value reflects society’s
preference for money now, rather than in the future. A simple example of this is
the way banks pay interest on savings deposits and charge interest for loans.
With a dollar today having greater value than a dollar in the future,
it is important to discount future costs and revenues to a
common (present) value, allowing for an accurate comparison.
The present value of the costs and revenue are presented below and show that the costs are slightly higher for
community housing providers, but that the revenue is much higher than for LAHC. Consequently, the return
on investment is higher for community housing providers than LAHC.
TABLE 3 RETURN ON INVESTMENT, NET PRESENT VALUE
CHP LAHC
Investment
CIV 16,244,000 17,868,000
Land 7,298,000 7,298,000
Fees 61,000 67,000
Interest 2,228,000 1,957,000
Maintenance 2,300,000 2,530,000
Fixed charges 3,729,000 4,102,000
Total investment 31,860,000 33,822,000
Return
Rental incomea 9,255,000 5,911,000
Residual value of buildinga 2,008,000 2,008,000
Value of land a
8,427,000 8,427,000
Total return 19,691,000 16,346,000
RoI 0.62 0.48
Source: Equity Economics calculations; Note: a. Discounted over 30 years.
24MAXIMISING THE RETURNS THE ROLE OF COMMUNITY HOUSING IN DELIVERING NSW'S FUTURE HOUSING NEEDS
25EQUITY ECONOMICS 26
MAXIMISING THE RETURNS THE ROLE OF COMMUNITY HOUSING IN DELIVERING NSW'S FUTURE HOUSING NEEDS

While the RoI is less than one for both            Budget Impact of Building 5000
community housing providers and
                                                   Social Housing Dwellings per year
LAHC, it is important to note that the RoI
analysis is only a financial calculation, and      Comparing the community housing providers and
does not take into account the economic            LAHC investment models, we’ve demonstrated that
and social benefit that flows from social          community housing providers are able to obtain a
housing outlined in this report.                   better RoI.

                                                   In addition, supporting community housing providers
Sensitivity analysis                               to grow the stock of social housing allows the NSW
A model is inherently built upon                   government’s funding to be stretched further by
assumptions – some involve greater                 leveraging the funds of community housing providers.
uncertainty than others. To ensure that            Community housing providers are in turn able to
the results are robust to changes in key           leverage an additional income stream, Commonwealth
assumptions, sensitivity analysis has been         Rent Assistance, that would otherwise go untapped.
undertaken on two key assumptions: the
                                                   The analysis presented above assumed that the NSW
amount (share) of debt that community
                                                   government provided the land for the development,
housing providers take on to finance the
                                                   worth an estimated $7.3 million, plus a subsidy to build
project, and the discount rate used to
                                                   the housing that would generate a break-even position
estimate the present value of all costs and
                                                   for the community housing provider of $12 million.
benefits.
                                                   With this $19.3 million the NSW government has
The sensitivity analysis shows that the            effectively leveraged an additional $4.2 million from the
lower the amount of borrowing used by              community housing sector for the development costs.
community housing providers, the greater
                                                   Furthermore, to build the same development would
its RoI (with LAHC’s RoI unaffected), and
                                                   cost the NSW Government an additional 10 per cent,
the better its performance relative to
                                                   since LAHC is liable for GST and community housing
LAHC.
                                                   providers are not.
Sensitivity analysis also showed that the
                                                   In reality, the NSW Government is able to use surplus
higher the discount rate, the lower RoI for
                                                   crown land to build new social housing developments.
both community housing providers and
                                                   This land is assumed to be either transferred to
LAHC, however LAHC’s RoI was affected
                                                   community housing providers through a long-term
comparatively more.
                                                   lease or directly to LAHC, with no net impact on the
Ultimately, the finding that community             NSW Government’s budget. In estimating the budget
housing providers have a greater RoI than          impact of building 5000 new dwellings in one year we
LAHC was robust to these changes in the            assume that half the land required would be purchased
assumptions.                                       at market price and half the land required would utilise
                                                   surplus crown land (see Appendix for methodology).

TABLE 4 BUDGET IMPACT ($ MILLION, 2021 DOLLARS)

                                100 % COMMUNITY         50:50 COMMUNITY
                                                                                             100% LAHC
                                    HOUSING            HOUSING AND LAHC

Cost to build 5000
                                         1,573                  1,888                             2,204
Social Housing Units40

                                                                    Source: Equity Economics calculations. See appendix

                                                                                                                     27
EQUITY ECONOMICS
The NSW Government could save up to $316 million through choosing to build 5,000 new social housing
units in equal partnership with community housing providers in the year they are built (shown above), and
approximately $25 million in ongoing maintenance and running costs.
Assuming this leveraged model can be extrapolated beyond just the development modelled, community
housing providers offer the NSW government with an alternative/supplementary mechanism for building
social and affordable housing that requires smaller levels of investment than if they build themselves.
And over time, as community housing providers build their equity in existing developments, they can leverage
their equity to borrow and build additional social and affordable housing.
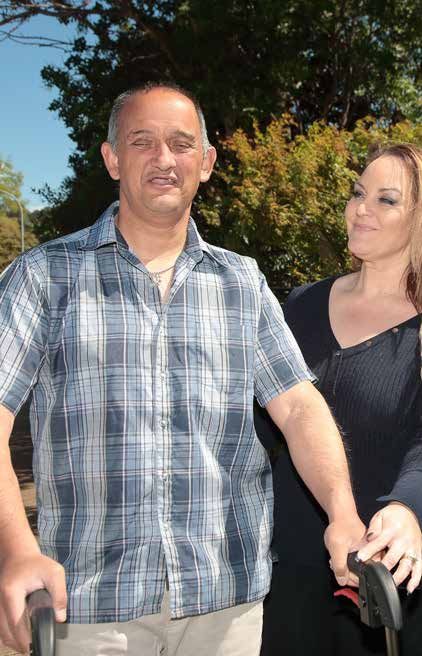
FASIU
Fasiu grew up in a small island near Fiji and spent The sense of community is important. I get on
much of his career in the military. His life changed very well with the tenants here. We all come
very quickly when a blood disorder cost him both from different backgrounds. We all have different
of his legs. values. Overall, I’d say we are a harmonious group.
Everyone says hi when they see me and, if they
I had no idea about community housing until I lost
don’t see me, they check in. My neighbour hadn’t
my legs. Before that I was very busy with a range
seen me for a while and she phoned Housing Trust
of roles and lots of responsibilities, including being
to make sure I was alright. So then I went and
a soldier with the United Nations in peacekeeping.
knocked on her door and said, “It’s ok. I’m still alive.”
I’ve served in Lebanon, Somalia, Libya and Sudan.
We had a bit of a laugh.
I’ve seen the best in people and also the worst
of the worst. This enables me to keep things in I play a bit of a spokesperson role between the
perspective. It certainly helped me when I faced tenants and Housing Trust. Housing Trust does
this personal loss. a lot to support the tenants, with a whole range
of programs enabling people to get back to a
Trying to find accommodation suitable for my
normal form of life. Scholarships. Work placements.
condition was a huge challenge. Following the
They don’t restrict themselves to solely providing
loss of my legs, I spent 15 months in hospital and
housing.
the social worker referred me to community
housing. She did say there would be a transition My health has significantly improved living here.
period before something would be available, and When I was in hospital, I was taking 22 tablets
that was the case. While I waited, it was not easy every day, for all sorts of health things. I was
living in a unit without modifications. When the determined to get my health back. I am able to
occupational therapist came with me to visit that walk now with my prosthetic legs. I am near the
first place, he was quite concerned and it was a city. I can go grocery shopping in my wheelchair. I
real struggle for me once I moved in. I was not yet am near a gym and I go every day. I’ve encouraged
in prosthetics, and it took me 45 minutes just to some of the tenants to join the gym with me and it
get down the stairs and into the shower and then is very rewarding to see them getting healthier too.
another 45 minutes to get back up. And the tablets? Now I am taking just one a day.
I was very fortunate that a community housing Today, I am an amputee mentor, sharing
place then became available and when the
my experiences and explaining how I got
call came through, I almost jumped out of the
chair! Getting that call was probably the best thing my life back. I tell amputees support is
that has ever happened to me. When I went to see available and that things like community
the unit, everything was designed for me and my housing can really help them get their life
wheelchair. I am really grateful that this home is
back. So far, three of the amputees I work
available. Community housing goes a long way to
enabling disabled people to get on with their lives with are back into full time work. I am
and find some sense of normalcy. very proud of this.
28MAXIMISING THE RETURNS THE ROLE OF COMMUNITY HOUSING IN DELIVERING NSW'S FUTURE HOUSING NEEDS
CONCLUSION
Meeting the social housing needs of NSW will require
significant investment over a long period of time, but
will deliver immediate economic benefits and support
jobs across the economy. The investment will also
support measures to reduce homelessness and rates of
domestic violence, and improve health outcomes.
Looking to community housing providers to deliver the additional
investment will generate a higher return on investment for
the NSW Government, due to lower costs and the access to
Commonwealth Government subsidies. This will maximise the
return to NSW taxpayers of greater investments to meet the
future housing needs of the state.
29EQUITY ECONOMICS
APPENDIX
This appendix provides further information about the calculations, assumptions and
sources informing the estimation of the return on investment and budget impact.
Return on Investment FEES
Includes development application fee and legal
COSTS fees. They are calculated as 0.15 per cent and 0.5 per
cent of construction costs respectively.42
CIV COSTS
INTEREST
These have been provided by CHIA NSW, based
upon industry data of similar size developments. Interest on the balance of the loan is accrued daily,
with repayments made monthly. It is assumed that
LAND COSTS the life of the loan is 30 years.
The cost of land is based on analysis undertaken by OPERATING COSTS
Lawson et al (2018), which, using the residual land
Operating costs are comprised of maintenance
value methodology, found that land costs are 31 per
and fixed costs. These estimates are from the same
cent of total development costs.41
source, and are therefore summarised together
below for expedience.
TABLE 5 ANNUAL OPERATING COSTS
Maintenance
ANNUAL COST AS A % OF
CHP LAHCa
REPLACEMENT VALUE
Repairs 0.10% 14,767 16,244
Planned maintenance 0.50% 73,836 81,220
Replacement/sinking fund 0.50% 73,836 81,220
Total maintenance 162,440 178,684
Fixed costs
ANNUAL COST AS A % OF
CHP LAHCa
REPLACEMENT VALUEb
Management costs 1,941 88,216 97,037
Water rates 1,078 49,009 53,910
Council rates 863 39,207 43,128
Insurance 863 39,207 43,128
Total fixed costs 215,639 237,203
Source: Lawson, J., Pawson, H., Troy, L., van den Nouwelant, R. and Hamilton, C. (2018) Social housing as infrastructure: an investment pathway,
AHURI Final Report 306, Australian Housing and Urban Research Institute Limited, Melbourne, http://www.ahuri.edu.au/research/final-reports/306,
doi:10.18408/ahuri-5314301. Notes: a. includes GST; b. Inflated to current prices using operating cost price index of 1.9 per cent per annum from
Lawson et al 2018.
30MAXIMISING THE RETURNS THE ROLE OF COMMUNITY HOUSING IN DELIVERING NSW'S FUTURE HOUSING NEEDS
RENTAL INCOME
Rental income is dependent upon the income of tenants. A ‘bottom up’ approach was taken, building up from
household composition, since welfare benefits, which all social housing tenants are assumed to be receiving,
are based upon household composition.
The following charts summarise the household composition and income source for social housing and
affordable housing tenants respectively.
CHART 1 COMPOSITION AND INCOME SOURCE FOR SOCIAL AND AFFORDABLE HOUSING TENANTS
Household Social Housingb
Compositiona Jobseeker
20%
Single
52% Pension
50%
Couple
11% DPS
30%
Jobseeker
FTB
50%
Single parent Parenting
26% payment
+FTB
50%
Parenting Jobseeker x 2
payment + FTB
+FTB
25%
25%
Couple with children
11%
Jobseeker
+ Parenting
payment +FTB
50%
Notes: a. Derived from ABS Table Builder - 2016 Census Selected Dwelling Characteristics. LLDD Landlord Type by HCFMD Family Household
Composition (Dwelling) by STATE. Counting single family and lone person households, where landlord type is state housing or community
housing; b. Provided by client, based on available CHP data.
31EQUITY ECONOMICS
Outlined below is the assumed fortnightly income received for each of the households, by the type of income.
TABLE 6 INCOME BY HOUSEHOLD COMPOSITION AND SOURCE OF INCOME, $ PER FORTNIGHT
SINGLEa COUPLE SINGLE PARENTb COUPLE WITH CHILDRENc
Pension 953 1436 - -
Disability Support Pension 953 1436 - -
Jobseeker 621 1,131 1,027 1,377
Parenting payment - - 1,201 1,320
Source: Services Australia, ‘How much can you get?’, https://www.servicesaustralia.gov.au/, accessed 15 April 2021; Communities and justice,
https://www.facs.nsw.gov.au/providers/housing/affordable/manage/chapters/household-median-incomes-2020-21. Notes: a. For the purposes of
estimating Jobseeker payments, it is assumed that a single person is less than 60 years of age; b. Single parents receive both FTB (A) and FTB (A);
c. Couple with children receiving payments (i.e. Jobseeker or Parenting payment) also receive FTB (A).
In addition, CHPs also receive Commonwealth Rent Assistance (CRA) from eligible (social housing) tenants.
The value of CRA is outlined below.
TABLE 7 COMMONWEALTH RENT ASSISTANCE BY HOUSEHOLD COMPOSITION, $ PER FORTNIGHT
SINGLE COUPLE SINGLE PARENTa COUPLE WITH CHILDRENa
Maximum fortnightly payment 140.8 132.8 165.62 165.62
Source: Services Australia, ‘How much can you get?’, https://www.servicesaustralia.gov.au/individuals/services/centrelink/rent-assistance/how-
much-you-can-get, accessed 15 April 2021. Notes: a. Assumes 1 or 2 children.
Budget Implications Methodology
In order to estimate the budget impact of building 5000 new social housing units in one year through
community housing and public housing, a number of assumptions are made:
The commencement investment costs of building a unit of housing is consistent with the costs
underpinning the model development of 50 housing units.
50 per cent of the required land for development is sourced through surplus crown land and 50 per cent
through market purchase.
Community housing providers are given an upfront grant to cover the commencement investment
costs, which would deliver them a cost-neutral financial outcome over a 30-year time frame.
32MAXIMISING THE RETURNS THE ROLE OF COMMUNITY HOUSING IN DELIVERING NSW'S FUTURE HOUSING NEEDS
TABLE 8 FINANCIAL IMPLICATIONS ($)
GOVERNMENT INVESTMENT GOVERNMENT INVESTMENT
(EXCLUDING LAND) (INCLUDING LAND)
CHP LAHC CHP LAHC
Capital 12,079,334 17,868,425 19,377,374 25,166,465
50 50 50 50
Per Dwelling 241,587 357,369 387,547 503,329
Total for 2500 603,966,710 893,421,269 968,868,678 1,258,323,237
Total for 5000 1,207,933,420 1,786,842,538 1,937,737,356 2,516,646,474
33EQUITY ECONOMICS
FOOTNOTES
1. NSW Department of Communities and Justice, Guide 14. https://www.nrsch.gov.au/national_register
to waiting times for social housing at 30 June 2020,
Dashboard, https://www.facs.nsw.gov.au/housing/help/ 15. https://www.planning.nsw.gov.au/-/media/Files/DPE/
applying-assistance/expected-waiting-times Discussion-papers/Policy-and-legislation/Housing/A-
Housing-Strategy-for-NSW--Discussion-Paper-2020-05-29.
2. Australian Bureau of Statistics (2020), Household financial pdf, p.52
resources September 2020, https://www.abs.gov.au/
statistics/economy/finance/household-financial-resources/ 16. https://communityhousing.org.au/wp-content/
latest-release uploads/2020/10/Member-Data-Reports-CHIA-NSW-
Community-Housing-Snapshot-2020-1.pdf
3. NSW Department of Planning, Industry and Environment,
A Housing Strategy for NSW: Discussion Paper, May 2020 17. Community Housing Industry Association NSW
https://www.planning.nsw.gov.au/-/media/Files/DPE/
Discussion-papers/Policy-and-legislation/Housing/A- 18. National Housing Finance and Investment Corporation
Housing-Strategy-for-NSW--Discussion-Paper-2020-05-29. (2020), Building Jobs: How Residential Construction
pdf Drives the Economy, https://www.nhfic.gov.au/research/
researchreport/housing-in-the-economy/building-jobs-how-
4. RMIT Fact Check (2019) Have social housing levels fallen to residential-constructions-drives-the-economy/
historic lows? https://www.abc.net.au/news/2019-08-12/fact-
check-social-housing-lowest-level/11403298 19. Ibid
5. Productivity Commission (2021), Report on Government 20. City Futures Research Centre (2019), Strengthening
Services 2021, https://www.pc.gov.au/research/ongoing/ the Economic Case for Housing Policies, file:///Users/
report-on-government-services angelahinckson/Downloads/Full_Report_Final_edited_
logos%20(1).pdf
6. Calculated using Australian Bureau of Statistics (2018),
Population Projections, Australia, https://www.abs.gov. 21. The Northern Territory has rates of homelessness ten times
au/statistics/people/population/population-projections- the Australian average; these are not included in the graph
australia/2017-base-2066 due to scaling. This reflects the decades of underinvestment
in Aboriginal and Torres Strait islander community
7. Note, this is based on a model development and exact costs housing, resulting in high rates of severe overcrowding and
would depend on the model and scale of any development. homelessness.
8. Australian Bureau of Statistics (2019), Housing Occupancy 22. https://www.nsw.gov.au/premiers-priorities
and Costs 2017-18 Financial Year, https://www.abs.gov.au/
statistics/people/housing/housing-occupancy-and-costs/ 23. Johnson, G., Scutella, R., Tseng, Y. P., & Wood, G. (2019).
latest-release How do housing and labour markets affect individual
homelessness? Housing Studies, 34(7), 1089- 1116.
9. Australian Bureau of Statistics (2019), Housing Occupancy
and Costs 2017-18 Financial Year, https://www.abs.gov.au/ 24. Equity Economics (2020), Double Return: How Investing in
statistics/people/housing/housing-occupancy-and-costs/ Social Housing Can Address Growing Homelessness Crisis
latest-release and Boost Australia’s Economic Recovery
10. Ibid 25. Ibid
11. Australian Bureau of Statistics (2019), Housing Occupancy 26. Productivity Commission (2015), Research Paper: Housing
and Costs 2017-18 Financial Year, https://www.abs.gov.au/ Assistance and Employment in Australia, https://www.
statistics/people/housing/housing-occupancy-and-costs/ pc.gov.au/research/completed/housing-employment/
latest-release and AIHW (2019), Australia’s Welfare 2019: housing-employment-volume1.pdf
Indigenous Housing https://www.aihw.gov.au/reports/
27. Wood, L., Flatau, P., Zaretzky, K., Foster, S., Vallesi, S.,
australias-welfare/indigenous-housing
& Miscenko, D. (2016). What are the health, social and
12. Australian Institute of Health and Welfare (2020), Data economic benefits of providing public housing and support
Tables Social Housing Dwellings, https://www.aihw.gov. to formerly homeless people?.
au/reports/housing-assistance/housing-assistance-in-
28. Productivity Commission (2015), Research Paper: Housing
australia-2020/data
Assistance and Employment in Australia, https://www.
13. Lawson, J., Pawson, H., Troy, L., van den Nouwelant, R. and pc.gov.au/research/completed/housing-employment/
Hamilton, C. (2018) Social housing as infrastructure: an housing-employment-volume1.pdf
investment pathway, AHURI Final Report 306, Australian
29. “Housing And Health: An Overview Of The Literature, "
Housing and Urban Research Institute Limited, Melbourne,
Health Affairs Health Policy Brief, June 7, 2018.DOI: 10.1377/
http://www.ahuri.edu.au/research/final-reports/306,
hpb20180313.396577
doi:10.18408/ ahuri-5314301
34You can also read