EMPLOYMENT SITUATION AT AGE THIRTY - RESULTS UPDATE OF THE SWISS PANEL SURVEY TREE - Edudoc CH
←
→
Page content transcription
If your browser does not render page correctly, please read the page content below
EMPLOYMENT SITUATION AT AGE THIRTY
RESULTS UPDATE OF THE SWISS PANEL SURVEY TREE

ANDRES GOMENSORO
THOMAS MEYER
SANDRA HUPKA-BRUNNER
BEN JANN
BARBARA MÜLLER
DOMINIQUE OESCH
MELANIA RUDIN
KATJA SCHARENBERG

                                                Transitionen von der Erstausbildung ins Erwerbsleben
                                                                     Transitions de l’Ecole à l‘Emploi
                                                           Transitions from Education to Employment

TREE, Bern 2017
www.tree.unibe.ch
2
TABLE OF CONTENT
1       Introduction................................................................................................................................................ 5
2       TREE Project Profile and Methodological Design...................................................................................... 6
3       Education and Employment Pathways of the PISA 2000/TREE Cohort: Synopsis 2000–2014 ................. 8
4       Employment Situation in 2014 ..................................................................................................................10
        Multivariate Analysis .................................................................................................................................13
5       Level of Employment ................................................................................................................................15
6       Income......................................................................................................................................................16
7       Precarious Employment ...........................................................................................................................18
8       Conclusion and Outlook ...........................................................................................................................20
Appendices .......................................................................................................................................................23
        Appendix 1            Descriptive analyses .........................................................................................................23
        Appendix 2            Multivariate models ...........................................................................................................31
        Appendix 3            Operationalisation of variables ..........................................................................................32
        Appendix 4            Some methodological remarks on the calculation of income .............................................33
References ........................................................................................................................................................34

LIST OF FIGURES

Figure 1                TREE survey design ................................................................................................................. 6
Figure 2                Post-compulsory education and employment pathways, 2000–2014 ....................................... 9
Figure 3                Employment and education situation in 2014 ..........................................................................10
Figure 4                Employment situation in 2014 by gender, parenthood, migration background,
                        Language region and educational attainment ..........................................................................12
Figure 5                Extent of employment in 2014 by gender, parenthood, migration background,
                        language region and educational attainment ...........................................................................15
Figure 6                Monthly gross income from employment in 2014 by gender, parenthood, migration
                        background, language region and educational attainment; full-time equivalent and
                        nominal ....................................................................................................................................16
Figure 7:               Precarious employment in 2014 by gender, parenthood, migration background,
                        Language region and educational attainment ..........................................................................18

                                                                                 3
LIST OF TABLES
Table 1 Employment status in 2014 by gender, parenthood, migration background, language
region and educational attainment...........................................................................................23
Table 2 Employment status in 2014 by gender and parenthood: Statistical significances ....................24
Table 3 Employment status in 2014 by educational attainment: Statistical significances .....................24
Table 4 Extent of employment in 2014 by gender, parenthood, migration background,
language region and educational attainment ...........................................................................25
Table 5 Extent of employment in 2014 by gender and parenthood: Statistical significances ................26
Table 6 Extent of employment in 2014 by educational attainment: Statistical significances .................26
Table 7 Average monthly income in 2014, gross full-time equivalent, by gender, parenthood,
migration background, language region and educational attainment: Estimates,
standard errors and confidence intervals .................................................................................27
Table 8 Average monthly income in 2014, gross full-time equivalent, by gender and
parenthood: Statistical significances........................................................................................27
Table 9 Average monthly income in 2014, gross full-time equivalent, by educational
attainment: Statistical significances .........................................................................................27
Table 10 Average monthly income in 2014, gross nominal, by gender, parenthood, migration
background, language region and educational attainment: Estimates, standard
errors and confidence intervals................................................................................................28
Table 11 Average monthly income in 2014, gross nominal, by gender and parenthood:
Statistical significances ............................................................................................................28
Table 12 Average monthly income in 2014, gross nominal, by educational attainment:
Statistical significances ............................................................................................................28
Table 13 Precarious employment in 2014 by gender, parenthood, migration background,
language region and educational attainment: Estimates and confidence intervals ..................29
Table 14 Precarious employment in 2014 by gender and parenthood: Statistical significances .............30
Table 15 Precarious employment in 2014 by educational attainment: Statistical significances ..............30
Table 16 Multinomial regression model for predicting employment status in 2014 .................................31
41 INTRODUCTION
The present report addresses employment pathways from the end of compulsory education to young adulthood.
The empirical database is the TREE panel survey (Transitions from Education to Employment). The analyses
draw on the first nine panel waves from 2001 to 2014.
This report is organised as follows: Section 2 gives a brief overview of the goals, design and methodology of the
TREE study and describes the administration of the survey. Section 3 provides a synopsis of the education and
employment pathways across the entire period of observation from 2000 to 2014. Sections 4 to 7 analyse the
TREE cohort’s general employment situation, its rate of employment, income and precarious employment at the
time of the last survey in 2014.
The results are intended for both scholars and an interested non-expert audience. They are mostly of a descrip-
tive kind but have been validated by multivariate analyses and compared with other data sources where availa-
ble. We hope to provide a stimulating, informative and instructive reading experience.
For more detailed findings, interested readers may consult the numerous analyses of TREE data published in
recent years (see references, p. 33). Many of these publications are available for download on the project web-
site (www.tree.unibe.ch). This report continues where the earlier synopses, based on previous TREE panel data,
by Meyer (2005), Bertschy, Böni and Meyer (2007) Keller, Hupka-Brunner and Meyer (2010) and Scharenberg
et al. (2014) left off.
52 TREE PROJECT PROFILE AND METHODOLOGICAL DESIGN
TREE is the first longitudinal study at the national level in Switzerland to address the transition of young people
from school to work and young adulthood. The survey focuses on post-compulsory education and employment
pathways. The TREE sample consists of approximately 6,000 young people who participated in the PISA survey
(Programme for International Student Assessment; BFS & EDK, 2002) in 2000 and left compulsory schooling in
the same year. It is a representative sample of Switzerland as a whole, the Swiss language regions and selected
cantons (Bern, Geneva, Ticino, St Gallen).
The first phase of the project (involving the three follow-up surveys between 2001 and 2003) tracked the re-
spondents’ education and employment pathways at the interface of compulsory school and upper-secondary
general or vocational education (the so-called first threshold). During this first phase, the main focus was on
reasons for and typical trajectories and consequences of irregular or critical educational careers, with particular
attention paid to early dropout (young people who fail to graduate from a post-compulsory education or training
programme).
FIGURE 1 TREE SURVEY DESIGN
Year 2000 2001 2002 2003 2004 2005 2006 2007 2008 2009 2010 2011 2012 2013 2014 2015 2016 2017 2018 2019 2020 2021
Age of sample 16 17 18 19 20 21 22 23 24 25 26 27 28 29 30 31 32 33 34 35 36 37
Transitions from
lower sec. to upper
sec.
Transition End of
Transitions from upper sec. to tertiary level or
progress of compulsory
labour market
sample school
Transitions from tertiary level to labour market
or consolidation of labour market entry
TREE wave 10
TREE wavee 9
TREE wave 1
TREE wave 2
TREE wave 3
TREE wave 4
TREE wave 5
TREE wave 6
TREE wave 7
TREE wave 8
PISA 2000
Surveys
Project
organisation/ TREE Phase 1 TREE Phase 2 TREE Phase 3 TREE Phase 4 TREE Phase 5
funding
In TREE’s second phase (involving four more annual follow-up surveys between 2004 and 2007), the survey
centred on what we refer to as the second threshold, that is, the transition from upper-secondary education to
working life or tertiary education. The third phase (2008 to current) involved additional surveys in 2010 and 2014,
thus ten and 14 years after completion of compulsory schooling, respectively. This phase focused on the transi-
tion to employment by respondents who completed tertiary education (e.g., at a university) and on the early
stages of career consolidation in those cases in which the transition to the labour market occurred after upper
secondary education.
TREE is located at the University of Basel; the Swiss National Science Foundation (SNSF) has been its major
source of funding.
The PISA 2000/TREE sample is representative of the approximately 80,000 youths in Switzerland who finished
the nine years of compulsory education in 2000 and left compulsory school the same year.
The data have been weighted to compensate for biases due to sample attrition, a common issue in any longitu-
dinal research. Hence, the TREE results are not exact values but statistically inferred estimates for the described
sample. Within certain margins of error, these estimates can be assumed to be representative of the population
under study, that is, the school leavers of the year 2000. These estimates thus involve some degree of uncer-
tainty so that, for instance, the ‘actual’ proportion of individuals with a certain level of education lies within a
confidence interval around the respective value indicated. To facilitate legibility, we have omitted information on
6confidence intervals in the running text. This information is provided in tables in the appendix. The following text
nevertheless takes estimation accuracy into account in that it generally only reports statistically significant dif-
ferences between groups.
All calculations were performed on appropriately weighted samples (Sacchi, 2011). Parameter estimates and
confidence interval calculations were all performed using suitable methods to properly model the complex struc-
ture of the PISA 2000/TREE sample. As a rule, the estimates in this publication are expressed in integer per-
centages or are rounded to thousands in the case of absolute population estimates. Results based on un-
weighted subsamples of less than 30 persons are typically not reported. Upon request, the authors will gladly
provide more detailed information on weighting and parameter estimation methodology.
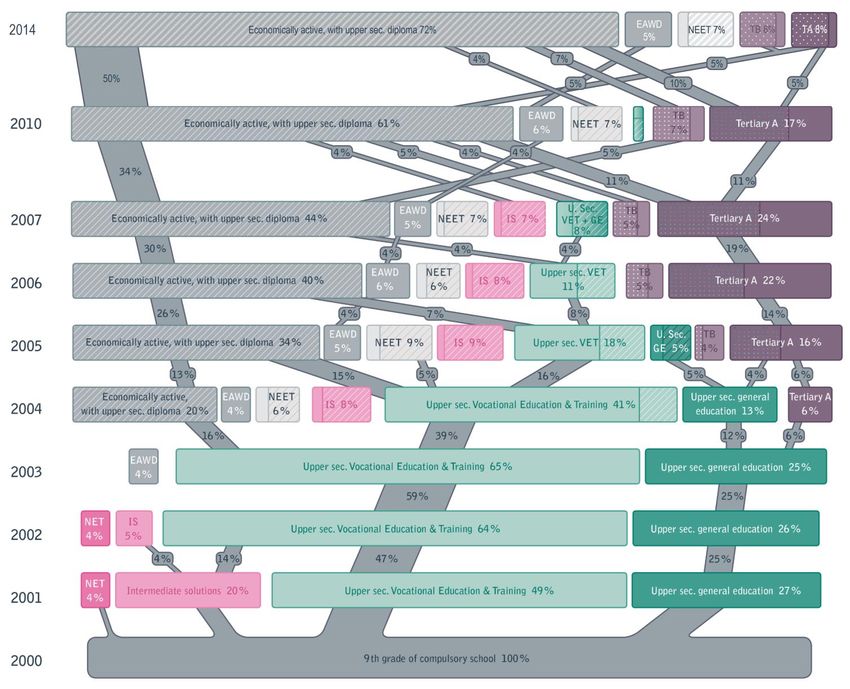
73 EDUCATION AND EMPLOYMENT PATHWAYS OF THE PISA 2000/TREE
COHORT: SYNOPSIS 2000–2014
In 2014, 14 years after leaving compulsory education and at an average age of 30, the majority of the cohort
under study has made the transition from education to employment. Approximately one-sixth are still in educa-
tion, mostly at the tertiary level. Nearly 90 per cent of the cohort are in employment; more than three-quarters is
pursuing gainful employment only, that is, without attending any education or training programme at the same
time. Roughly seven per cent of the cohort are neither in employment nor in education or training (NEET1).
Fourteen years after the end of compulsory schooling, about half of the TREE respondents have successfully
completed upper secondary and 40 per cent tertiary education (23% tertiary A, 17% tertiary B).2 One in ten has
not acquired a post-compulsory certificate of any kind. The graduation rate at the tertiary level can be expected
to increase by a few percentage points in the years to come. There are two reasons for this: First, in 2014, about
seven per cent of the cohort that had not (yet) completed some form of tertiary education was in tertiary educa-
tion. Second, a (small) proportion of those who had completed upper secondary education by 2014 are still likely
to begin (and complete) tertiary education.
The majority of the TREE cohort had thus made the transition from education to employment by 2014, at the
average age of 30 years. What the development across the last three observation periods (2007–2014) demon-
strates, however, is the extent to which the transitions from education to employment extend well into the third
decade of life (and even beyond) – and this can go in both directions: from education to employment and vice
versa.
Let us begin by taking a look at the transitions between 2007 and 2010, thus the age span from 23 to 26. A
cumulated sixth of the cohort made the transition from education to employment during this time. Conversely,
some five per cent of those who had been (exclusively) in employment in 2007 were found to be in tertiary B
education and training programmes in 2010.
Between 2010 to 2014, more than 20 per cent of the cohort entered the labour market upon successfully com-
pleting (mostly tertiary) education. Yet there were still transitions in the other direction as well: some five per
cent of the cohort fell into the category of (exclusively) in employment in 2010, whereas the same percentage
was in tertiary education in 2014 (half of them in tertiary A and B programmes, respectively; these ‘branches’
are therefore not visible in the tree diagram).
The (small) group of those who were gainfully employed without having completed post-compulsory education
of any kind is markedly stable (5–6% of the cohort). From 2005 on, we observe no change in the status of most
in this group. This implies, first, that they did not acquire a post-compulsory certificate at a later point in time,
and, second, that they still seem to have consistently been able to hold their ground in the labour market.
1
NEET = Not in education, employment or training.
2
Tertiary A essentially comprises the ‘Bologna-style’ programmes (Bachelor or Master level) offered at universities, schools of education and
universities of applied sciences. Tertiary B refers to higher vocational training, including technical colleges. The distinction follows the old 1997
ISCED classification, which is still widely used
(ISCED: International Standard Classification of Education; see http://www.unesco.org/education/information/nfsunesco/doc/isced_1997.htm ).
For the new ISCED classification of 2011, see http://uis.unesco.org/en/topic/international-standard-classification-education-isced.
8FIGURE 2 POST-COMPULSORY EDUCATION AND EMPLOYMENT PATHWAYS, 2000–2014
94 EMPLOYMENT SITUATION IN 2014
The following sections provide an overview of the employment situation among the TREE cohort under study.
How many young adults in Switzerland were gainfully employed in 2014, 14 years after completing compulsory
education, at an average age of 30 years? How high is their unemployment rate and what percentage is not
economically active? Who works part-time, who full-time, who under precarious conditions, and how much do
the young adults who make up the TREE cohort earn? In the following, we will first describe the employment
situation for the entire TREE cohort. We will then present more detailed descriptive findings, distinguished by
population attributes such as gender, migration background, language region and highest educational attain-
ment. Subsequently, we will assess the extent to which these attributes predict the employment situation in
2014.3
FIGURE 3 EMPLOYMENT AND EDUCATION SITUATION IN 2014
3% 5%
3%
13%
Exclusively working (active)
Working and in education
Exclusively in education
Unemployed
Inactive
76%
As Figure 3 shows, the large majority of TREE respondents were successful in entering the labour market: About
three-quarters (76%) were exclusively in employment in 2014 (i.e., without pursuing education or training in
parallel). Another 13 per cent worked while in education or training. If we take the small group into consideration
that was exclusively in education (3%; i.e., the group that did not work at the same time), one-sixth of TREE
cohort was still at least partially in education at an average 30 years of age.
Three per cent of the TREE cohort were unemployed in 2014. About eight per cent of the TREE cohort fell into
the category of “not economically active” (among them most of those exclusively in education). The employment
rate among the PISA2000/TREE cohort was thus roughly 90 per cent in 2014. After considering estimation errors
and differences in the definitions and populations upon which the calculation of rates is based, we can speak of
3
The definition of gainful employment is based on International Labour Organization (ILO) standards, which also underlie the labour market sta-
tistics issued by the Swiss Federal Statistical Office (e.g., the Swiss Labour Market Survey; SAKE).
According to ILO standards, employed / active persons are all individuals of working age (15–75 years of age) who work in a job for at least one
hour per week.
Persons are considered unemployed if they are not gainfully employed at the time of the survey, are looking for work and are available to work.
This definition must not be confused with a definition of unemployment that includes only the unemployed that have registered with the regional
job placement centres.
Persons classified as not economically active / inactive are those persons who are neither employed nor unemployed.
See http://www.ilo.org/global/statistics-and-databases/statistics-overview-and-topics/WCMS_470304/lang--en/index.htm;
for Switzerland, see also BFS (2015): Arbeitsmarktindikatoren 2015. Neuchâtel: Bundesamt für Statistik.
10a fairly good agreement between the TREE results and ‘official’ statistics (FSO, 2015). By international stand-
ards, Switzerland features a comparatively high level of labour market integration among young adults. In 2012,
the average employment rate among thirty-year-olds in the 28 EU member states was about 75 per cent, the
unemployment rate just under ten per cent and the economic inactivity rate4 at around 13 per cent.5 The relative
risk of youth unemployment in Switzerland is slightly below the OECD and EU average (1.8% versus 2.1 and
2.2% respectively).6
The following analyses consider only those in employment who did not pursue education or training while work-
ing.
The first observation is that the employment situation differs considerably by gender and family situation.
Whereas the employment status of Women without children barely differs from that of men, a pronounced gender
gap begins to open up once there are children. The employment rate among Women with children drops below
80 per cent, and the share of those that exit the labour market at least temporarily increases to about 20 per
cent. We observe the opposite development among men: men with children are much more frequently in em-
ployment than men without; their employment rate reaches nearly 100 per cent. The findings are similar if we
look at the extent of employment (see the respective section on p. 15).
As for migration background, what is initially surprising is the exceptionally high employment rate among first-
generation immigrants (95%), which is significantly higher than that among both the ‘native’ population and the
“secondos” (second generation: 84%). Considering their higher educational attainment, one would rather expect
the contrary. According to Scharenberg et al (2014:14), for instance, young first-generation immigrants much
more frequently lack post-compulsory education than the secondos. Other studies show that second-generation
immigrants do as well as or even better than the native population when it comes to acquiring a post-compulsory
certificate and when statistically controlling for social background and other relevant attributes (Bolzman et al.,
2003; Griga, 2014). Secondos nevertheless seems to have much greater difficulties in the labour market: their
risk of unemployment is significantly higher (at 10%) than that of the native population and first-generation im-
migrants. In this context, we must not forget, however, that the secondos are an ethnically and economically
extraordinarily heterogeneous group. A substantial proportion of them come from the successor countries of
former Yugoslavia or from Turkey and demonstrably face discrimination and greater difficulties in integrating into
the labour market (Fibbi et al., 2015; Fibbi, Lerch & Wanner, 2006, Guarin & Rousseaux, 2017).
With regard to the Swiss language regions, Figure 4 suggests that the labour market situation in Italian-speaking
Switzerland is markedly more problematic than north of the Alps. The unemployment rate among the respond-
ents at the time of the 2014 TREE survey was several times higher in Italian-speaking Switzerland than in the
German- and French-speaking regions (2% and 5% respectively). Conversely, the employment rate was mark-
edly lower (81% vs. 92% and 90% respectively).
4
EU statistics use the NEET category (not in education, employment or training), which deviates slightly from the definition of not economically
active used here.
5
Source: http://ec.europa.eu/eurostat/statistics-explained/index.php/Youth_unemployment.
6
Youth unemployment rate divided by the rate of total unemployment.
11FIGURE 4 EMPLOYMENT SITUATION IN 2014 BY GENDER, PARENTHOOD, MIGRATION BACKGROUND, LANGUAGE REGION AND EDUCATIONAL ATTAINMENT
Total
91% 4% 6%
Man without child 92% 6% 3%
Gender and parenthood
Man with child(ren) 100%
Woman without child 94% 4% 2%
Woman with child(ren) 79% 1% 20%
Migration background
No migration background 91% 3% 6%
2nd generation 84% 10% 6%
Migrants 95% 3% 2%
German 92% 2% 6%
Linguistic region
French 90% 5% 5%
Italian 81% 12% 7%
No post-compulsory certificate 82% 8% 10%
Educational attainment
Sec. II - Vocational education 90% 3% 7%
Tertiary B 98% 1% 1%
Tertiary A 93% 4% 3%
0% 10% 20% 30% 40% 50% 60% 70% 80% 90% 100%
Active Unemployment Inactive
12Figure 4 visualises the employment situation in 2014 among those who are not enrolled in education (anymore).
If we look at the employment rate by educational attainment, we can see that it tends to be higher, the higher
the level of educational attainment. Individuals with no post-compulsory certificate have an employment rate of
82 per cent. Graduates of upper secondary vocational education and training have an employment rate of just
under 90 per cent and are thus in line with the overall average. The ones with the highest employment rate of
well above 90 per cent are the holders of a tertiary degree, especially those with a tertiary B certificate (nearly
98%). In regard to unemployment and economic inactivity, what stands out is the high rates among those who
lack a post-compulsory certificate (about 8% and 10% respectively).
When considering these findings, we need to bear in mind that they are the product of a cross-sectional per-
spective, a snapshot at an average age of 30 years. This says little about cumulative labour market opportunities
and risks in a longitudinal perspective. The respective analyses of TREE data are in preparation and still awaiting
publication. A look at the work of the Swiss Federal Statistical Office in the context of the “Longitudinal Analyses
in the Education Sector” programme (Längsschnittanalysen im Bildungsbereich) provides clear evidence that
cumulated long-term risks are considerably higher than the cross-sectional risks presented here. The FSO anal-
yses based on statistical educational data from exhaustive surveys have investigated, among other things, the
risk that upper secondary graduates are forced to register as unemployed once within 30 months upon complet-
ing their certificate. The respective rate is at least 14 per cent overall7, with considerable variation depending on
the level of educational attainment. In this context, we see that not only those without a post-compulsory certifi-
cated face a cumulated unemployment risk of over 20 per cent. The same is also true for the holders of a Swiss
Federal VET Certificate (Eidgenössisches Berufsattest) or a Federal Certificate of Competence
(Fähigkeitszeugnis) after three years of basic VET (Strubi et al., in preparation).
Multivariate Analysis
In this section, we examine the extent to which the cohort’s labour market status in 2014 can be statistically
predicted by a number of characteristics, which, in previous analyses, have proved to affect the employment
situation (Bertschy et al., 2007; Keller et al., 2010; Scharenberg et al., 2014). To this end, we developed a
multinomial logistic regression model with labour market status as the dependent variable. The three categories
of the dependent variable are identical with those displayed in the bivariate statistics in the previous section:
economically active, unemployed and inactive (for definitions see footnote 7, p.13). The model allows us to
assess the impact of a given factor while statistically controlling for all other factors considered. We started by
including the characteristics described in the model above: gender, migration background, family situation, ed-
ucational attainment and language region. Beyond these characteristics, we checked for effects of further factors
related to (academic) skills, educational pathways and social origin, that is, type of lower secondary school track
attended, educational status in the first post-compulsory year, reading literacy skills (PISA) and parental socio-
economic status. The latter two turned out to have no (direct) significant effect on labour market status and were
excluded from the final model (for the full regression table, see Appendix 2, p. 24).8 The full final model was run
on the same subsample as all analyses in this chapter.9 It yields a fair fit to the data (McFadden’s R2 = 0.22). All
of the findings reported below are statistically significant at least at the .9 level. These are the main results:
1. In terms of a ‘gendered’ labour market situation, the multivariate model clearly confirms the findings of
the descriptive results displayed on the previous pages: all else being equal, both the presence and the
number of children significantly reduce the labour market participation of women, while the effect on
men is inverse (see also the section Level of Employment, p.15; Levy & Widmer, 2013).
7
The unemployment rate according to ILO standards, which also takes the unregistered unemployed into account, can be expected to be consid-
erably higher.
8
This does not imply that skills and socio-economic origin do not have an impact on labour market status at all. It must rather be assumed that the
effect is indirect, i.e., moderated by other characteristics such as educational attainment or educational pathway characteristics.
9
Namely, economically active, unemployed or inactive respondents who are not enrolled in a formal education programme at the same time.
132. With regard to migration background, the model also confirms the descriptive results reported in the first
part of this section: while the labour market participation of first-generation immigrants (all else being
equal) is significantly higher than that of the ‘natives’, second-generation immigrants seem to incur a
somewhat increased risk of finding themselves unemployed.
3. Furthermore, educational pathways and attainment have a significant impact on the labour market situ-
ation at the age of thirty. First, the ‘long shadow’ of lower secondary tracking still distinctly makes its
mark almost one-and-half decades after the end of compulsory school: the odds of non-activity are
significantly higher for respondents having attended a track with basic requirements (compared to those
having attended a track with extended requirements). Second, as shown in previous analyses
(Scharenberg et al., 2014; Sacchi & Meyer, 2016), discontinuous transitions from lower to upper sec-
ondary education prove to be a long-term risk factor: individuals who were not in a certifying education
programme during the first post-compulsory year of education run a higher risk of not being in gainful
occupation at the age of thirty. Third, we observe effects of educational attainment on labour market
status at age thirty: compared to upper secondary vocational education and training (VET) graduates,
and all else being equal, individuals with a tertiary B degree have higher odds of being gainfully active,
while the opposite is true for those who hold no post-compulsory degree whatsoever.
4. As already highlighted in the descriptive part of this section, our results with regard to language region
imply a markedly more difficult economic situation for young labour market entrants in southern Swit-
zerland: individuals from Italian-speaking Switzerland are significantly less likely to be gainfully active
and more likely to be unemployed than those from German-speaking Switzerland.
145 LEVEL OF EMPLOYMENT
Roughly one-quarter of the TREE cohort who is (exclusively) in employment works part-time (less than 90% of
full-time employment). Among those working part-time, 17 per cent carry a 50 to 90 per cent workload and
around eight per cent a workload of less than 50 per cent. The extent of employment varies strongly by gender,
family situation and level of educational attainment.
FIGURE 5 EXTENT OF EMPLOYMENT IN 2014 BY GENDER, PARENTHOOD, MIGRATION BACKGROUND, LANGUAGE
REGION AND EDUCATIONAL ATTAINMENT
Total
8% 17% 75%
Man without child 4% 9% 87%
Gender and
parenthood
Man with child(ren) 7% 93%
Woman without child 5% 19% 77%
Woman with child(ren) 33% 43% 24%
No migration background 9% 16% 75%
background
Migration
2nd generation 4% 22% 75%
Migrants 6% 23% 71%
German 10% 15% 75%
Linguistic
region
French 4% 23% 73%
Italian 6% 18% 77%
No post-compulsory certificate 10% 22% 68%
Educational
attainment
Sec. II - Vocational education 8% 13% 80%
Tertiary B 4% 9% 87%
Tertiary A 6% 19% 75%
0% 10% 20% 30% 40% 50% 60% 70% 80% 90% 100%
Workload6 INCOME
At age thirty, the part of the TREE cohort which is (exclusively) gainfully employed earns a nominal gross monthly
income of approximately 5,800 Swiss francs, which corresponds to approximately 6,500 Swiss francs calculated
at full-time equivalents.11 The median full-time equivalent income is somewhat lower at 6,150 Swiss francs. Ac-
cording to the FSO income survey, this figure compares to some 6,200 Swiss francs for the entire Swiss labour
force.12 We can thus conclude that the gainfully active part of the TREE cohort has roughly reached the overall
income level of the Swiss workforce at a relatively early age.
We observe substantial disparities by gender, migration background, language region and educational attain-
ment both with regard to real and full-time equivalent salaries.
FIGURE 6 MONTHLY GROSS INCOME FROM EMPLOYMENT IN 2014 BY GENDER, PARENTHOOD, MIGRATION BACK-
GROUND, LANGUAGE REGION AND EDUCATIONAL ATTAINMENT; FULL-TIME EQUIVALENT AND NOMINAL
Gender and parenthood Total
Man without child
Man with child(ren)
Woman without child
Woman with child(ren)
No migration background
background
Migration
2nd generation
Migrants
German
Linguistic
region
French + Italian
No post-compulsory certificate
Educational attainment
Sec. II - Vocational education
Tertiary B
Tertiary A
0 1000 2000 3000 4000 5000 6000 7000 8000
Full-time equivalent income Nominal income
11
Nominal income: Income earned de facto, disregarding the level of occupation.
Full-time equivalent income: Income weighted by level of occupation.
For further methodological details regarding the calculation of salaries, see Appendix 4).
12
https://www.bfs.admin.ch/bfs/de/home/statistiken/arbeit-erwerb/loehne-erwerbseinkommen-arbeitskosten/lohnniveau-schweiz/kaderloehne-tief-
loehne.assetdetail.39777.html
16Figure 6 highlights that, on average, the income gap (full-time equivalent) between men and women is at a full-
time equivalent of 800 francs per month and even 1,500 francs when we consider nominal income (i.e., when
not controlling for level of occupation; see also the section Level of Employment on page 15). Significant gender
differences persist even if we take educational attainment into account.13
When breaking down income by educational attainment, we observe a span of average full-time equivalent
income ranging from 5,600 francs (individuals without post-compulsory degree) to 7,600 francs (tertiary A grad-
uates). The results imply that attaining a tertiary level degree pays off substantially in terms of wage gain. A look
at the overall average yields the somewhat surprising observation that having an upper secondary VET degree
does not seem to be associated with a significant wage gain compared to holding no post-compulsory degree
at all. Both categories remain under the 6,000 francs threshold. However, we have to keep in mind that wage
levels vary considerably among VET graduates depending on occupation.
Finally, wages and salaries also differ significantly by language region. On average, pay checks in the French-
and Italian-speaking parts of Switzerland amount to 6,200 francs a month, 400 less than in the German-speaking
part.
In the near future, we are planning to expand and deepen our analyses of wages and salaries from a multivariate
perspective. One of our next publications will be devoted to statistically modelling the factors that determine
wages. The planned model will extend beyond the factors described in this section to include others such as
economic sector, field of occupation, professional status and experience. We are also planning in-depth anal-
yses of gendered wage gaps that will pick up on earlier work in this area (Bertschy, Böni & Meyer, 2007; Bertschy
et al., 2014).
13
There are, however, no statistically significant gender differences among graduates at the tertiary level.
177 PRECARIOUS EMPLOYMENT
In the following, we will consider underemployment, temporary employment and work on demand as indicators
of precarious employment.14 These forms of precarious employment are defined by drawing closely on the con-
cepts used by the Swiss labour market survey (SAKE) and the State Secretariat for Economic Affairs (SECO)
(Bertschy et al., 2007, p. 27; Ecoplan, 2003). Employment is called temporary when it is scheduled to end within
one year’s time. Individuals are considered underemployed when they wish to work longer hours than deter-
mined by their employment contract. People work on demand when they go to work only when their employer
calls on them to do so.
The following analyses are confined to individuals who are exclusively employed and work at least eight hours
per week. Because of incomplete data, we also excluded interns, the partially unemployed, the self-employed,
family members working in the family business and individuals whose employment relationship could not be
clearly determined. Please note that these exclusions will result in underestimating the rate of precariousness
to some degree.
FIGURE 7: PRECARIOUS EMPLOYMENT IN 2014 BY GENDER, PARENTHOOD, MIGRATION BACKGROUND, LANGUAGE
REGION AND EDUCATIONAL ATTAINMENT
Gender and parenthood Total
87% 13%
Man without child 83% 17%
Man with child(ren) 94% 6%
Woman without child 85% 15%
Woman with child(ren) 91% 10%
No migration background 86% 14%
background
Migration
2nd generation 85% 15%
Migrants 93% 7%
Linguistic region
German 88% 12%
French 85% 15%
Italian 74% 26%
Educational attainment
No post-compulsory certificate 73% 27%
Sec. II - Vocational education 93% 7%
Tertiary B 85% 15%
Tertiary A 82% 18%
0% 10% 20% 30% 40% 50% 60% 70% 80% 90% 100%
Not precarious Precarious
14
Other potential forms of precariousness such as (false) self-employment, (false) internships, marginal employment and so on were not considered
15
for lack of sufficiently accurate data (for an international comparison, see, e.g., Broughton et al. 2016). The large majority with a Swiss Federal
Certificate of Competence (Eidgenössisches Fähigkeitszeugnis, EFZ).
18In total, approximately five per cent of the respondents in employment work on a fixed-term contract. Some two
per cent work on demand. Five per cent of the respondents can be considered underemployed―that is, they
are involuntarily restricted to working less than they wish or would prefer working full-time. Hence, roughly 13
per cent of the respondents in employment are affected by at least one form of precariousness (see Figure 7).
This overall rate corresponds very well with the findings from other sources (see, e.g., Sacchi & Salvisberg,
2012: 22)
When we consider gender and family situation, what stands out in particular is the extraordinary low rate of
precariousness among men with children (6%). This holds for women as well: Women with children are much
less frequently subject to precarious employment than Women without. In the latter case, however, the difference
is statistically not significant.
A look at migration background reveals that first-generation immigrants are less often in precarious employment
compared to the native population and the “secondos” (7% vs. 14–15%).
In regard to the language regions, however, the analysis shows that the labour market situation is much more
difficult in Italian-speaking than in other parts of Switzerland. There, the rate of precarious employment exceeds
25 per cent and is therefore roughly twice the rate found in German- and French-speaking Switzerland.
As concerns educational attainment, we can see that the absence of a post-compulsory degree bears a strongly
increased risk of being in precarious employment: The respective rate of incidence is 27 per cent, more than
double the overall rate (13%) and four times higher than the rate of those holding an upper secondary VET
degree (7%). The rates of precarious employment among graduates from tertiary education are in between these
two extremes, but the differences to either side are not statistically significant.
198 CONCLUSION AND OUTLOOK
The present report of findings has provided an overview of the labour market situation of the (first) TREE cohort
at an average age of 30 years, that is, 14 years after the end of compulsory education. Primarily, it draws on
data from the last―ninth―panel wave in 2014 but also considers data from the first eight panel waves (2001–
2010), especially in the synopsis in section 3.
Fourteen years after leaving compulsory education, the majority of the cohort seems to have made the transition
from education to employment. Nevertheless, about one-sixth of the TREE cohort is still in education at this point
in time―primarily at the tertiary level. This documents with impressive clarity the extent to which today’s transi-
tion from education to employment extends well into the third decade of life and sometimes even beyond.
Sections 4 to 8 have focused on the four labour market indicators ‘general employment situation’, ‘extent of
employment’, ‘income from employment’ and ‘precarious employment’. The analyses considered the attributes
gender, migration background, language region and educational attainment.
General employment situation: Approximately 90 per cent of the TREE cohort were in employment in 2014;
three-quarters were exclusively employed and one in eight worked while pursuing education or training at the
same time. Some three per cent were unemployed, and roughly eight per cent fell into the category of ‘not
economically active’ (for definitions, see footnote 4 , p.11). Women were significantly less frequently gainfully
employed than men (88% vs. 94%). Second-generation immigrants (secondos) were much less frequently in
employment than first generationers. Moreover, the second generation was affected by unemployment to a sig-
nificantly higher degree than individuals with no migration origin. We could also observe a markedly higher risk
of unemployment among young adults in Italian-speaking Switzerland. As for the highest level of educational
attainment, it strikes the eye that the holders of a tertiary B certificate have a particularly high employment rate
and low risk of unemployment.
Extent of employment: The employment situation of the 30-year-olds is very closely associated with their gender
and family situation. The gap widens especially when there are children: Whereas more than 90 per cent of the
gainfully employed men with children work full-time, the same is true for only nearly a quarter of the gainfully
employed Women with children. Some additional 20 per cent of all Women with children have dropped out of
the labour market altogether (not economically active, at least temporarily).
Income from employment: Pronounced gender differences are also apparent when it comes to income. Women
earn a nominal monthly average of 1,500 Swiss francs less than men. When we control for extent of employment
(full-time equivalent income), the difference still amounts to roughly 800 francs. As for educational attainment,
our analyses reveal a marked wage advantage for those who have acquired a tertiary certificate. Such a certifi-
cate yields an average monthly full-time wage of more than 7,000 francs. By comparison, the figures are lower
than 6,000 francs on average for individuals whose highest educational attainment is an upper secondary cer-
tificate.
Precarious employment: Approximately 13 per cent of those working do so under conditions of precarious em-
ployment that is, they are underemployed, employed on a fixed-term contract or work on demand. Here, too, we
observe pronounced differences by educational attainment: Young adults with no post-compulsory certificate
are four times as likely (at 27%) to end up in precarious employment than those with an upper secondary VET
certificate (7%). In Italian-speaking Switzerland, the rate of precarious employment exceeds 25 per cent and is
therefore roughly twice the rate found in German- and French-speaking Switzerland. In summary, we can state
the following:
20At an average age of 30 years, the observed cohort mostly finds itself in an overall favourable labour market
situation. The general rate of employment is high while unemployment is low, and, with a median income ex-
ceeding 6,000 francs per month (gross full-time equivalent), the TREE cohort has already managed to reach the
income level of the Swiss workforce overall.
In view of the issue at the heart of the TREE project―the transition from and the connections between education
and employment―our analyses have confirmed that education pays off or, conversely, that lacking a post-com-
pulsory certificate entails substantially enhanced risks in the labour market. The group of young people affected
by this risk (approx. 10% of the cohort under study) is less frequently in employment and much more frequently
in precarious employment compared to their ‘educationally certified’ peers.
In a positive vein, however, we can state that four in five individuals with no post-compulsory certificate are in
employment at the age of 30 and earn an average (full-time equivalent) income clearly exceeding 5,000 francs
per month. Moreover, our longitudinal perspective suggests (see p. 8f.) that a substantial part of this group has
proven capable of holding its ground in the labour market over several years now.
What stands out at the upper end of the educational pyramid―among the graduates of tertiary education―is,
apart from their high employment rate, above all the considerable income advantage that they have over those
who lack a tertiary certificate; the differential between the two most extreme categories (with versus without a
tertiary A certificate) is an average 2,000 francs per month (gross full-time equivalent). This suggests a substan-
tial return on educational investment for those who manage to take their educational career to the tertiary level
(and complete it).
What is the bottom line for those who have ended their educational careers by graduating from basic upper
secondary VET?15 Compared to those persons without a post-compulsory certificate, VET graduates have a
higher employment rate and a lower share of precarious employment. Nevertheless, in terms of average income,
the two groups do not differ significantly overall. Looking at average income across all VET graduates, however,
levels the substantial differences in the pay range between occupations. All in all, our findings offer some evi-
dence suggesting that completing upper secondary (vocational) education no longer provides the same protec-
tion in the labour market than it once did and that education to provide such protection has now shifted to the
tertiary level.
Another important result of our analyses is that past transitions within the education system cast a ‘long shadow’
on the labour market situation at age 30. Our model predicts that two earlier transitions increase the risk of
having dropped out of the labour market by the age of 30 (see p. 13 in the running text and p. 31 for the complete
model): attending school types providing lower secondary education limited to basic academic requirements16
on the one hand and attending intermediate or preparatory training programmes or some other form of interim
solution in the transition from lower to upper secondary education on the other.
The most important factor by far that this report has shown to affect the employment situation at age 30 is
gender―in combination with the family situation. Our findings testify beyond any doubt to the extent to which
the occupational careers of men and women still diverge as well as to the persistence of this situation. Upon
birth of a child (at the latest), the oft-proven “gender gap” begins to open up, also between the female and male
school-leavers among our cohort. Whereas almost all men with children work full-time, about one in five Women
with children drops out of the labour market completely (at least temporarily, i.e., is not economically active).
Three-quarters of working mothers work part-time; in nearly half of these cases at less than 50 per cent of full-
time employment. The mechanisms observed here remain operative even if we control for educational attain-
ment.
Our findings further show that women earn significantly less than men. The “wage gap” between the men and
women of the TREE cohort lies at 800 Swiss francs per month (full-time equivalent) at the age of 30, which
15
The large majority with a Swiss Federal Certificate of Competence (Eidgenössisches Fähigkeitszeugnis, EFZ).
16
Depending on the canton in question, this can, for instance, be Realschule, Sek C or cycle d'orientation du type ‘pratique’.
21amounts to about an eighth of the cohort’s overall average income. Even though in-depth analyses of the “un-
explained”17 wage gap at the age of 30 have yet to be conducted, studies based on past TREE data have
determined that women are already subject to wage discrimination at the point of entering the workforce (see,
e.g., Bertschy et al., 2014).
Finally, mention needs to be made of a rather surprising finding on first glance: our analyses could find no
evidence of a (direct) influence of social background on the labour market situation at 30 years of age. Of course,
this does not mean that no such influence exists. What it means is rather that, at this point of observation, social
background has an indirect impact, for instance, via highest educational attainment.
The findings presented in this report are neither complete nor conclusive. Further in-depth analyses intend to
provide insight into the influence of factors hitherto not considered (such as occupation trained for, economic
sector and industry, work experience or firm characteristics) on income or the employment situation. In addition
to these, we aim to investigate other indicators of labour market integration such as job–skills (mis-)match,
change of job and/or occupation, opportunities for career advancement, continuing education or job satisfaction.
Since September 2016, complete monthly data covering all employment episodes among the TREE respond-
ents since 2003 has been available for analysis. In a longitudinal perspective, this will make it possible to trace
career paths and their determinants in a differentiated and detailed manner over a period of twelve years to date.
For 2019, we are also planning another―the tenth―follow-up survey of the cohort, which will have reached an
average age of 35 years by then. By that time, the first data will be available for the second TREE cohort, the
survey of which was launched in 2016. This latter data will provide the first opportunity ever to compare the
transition from school to employment and adulthood in Switzerland.
17
This refers to that part of the wage gap that cannot be explained by differences in qualifications, demands, position in the hierarchy, seniority,
economic sector and other attributes.
22APPENDICES
Appendix 1 Descriptive analyses
TABLE 1 EMPLOYMENT STATUS IN 2014 BY GENDER, PARENTHOOD, MIGRATION BACKGROUND, LANGUAGE REGION
AND EDUCATIONAL ATTAINMENT
Employed Unemployed Not economically active
Share in % Confidence in- Share in % Confidence in- Share in % Confidence in-
terval terval terval
Total (N=3142) 90.8 [88.4;92.7] 3.5 [2.5;4.9] 5.7 [4.1;8.0]
Gender and parenthood
Men without children 91.6 [87.9;94.3] 5.7 [3.6;8.9] 2.7 [1.4;5.3]
(See Table 2)
(See Table 2)
(See Table 2)
Men with children 99.8 [98.5;100] 0.2 [0.0;1.5] 0 [-,-]
Women without children 93.8 [83.7;90.9] 4.2 [2.2;7.6] 2.1 [1.7;3.7]
Women with children 78.6 [69.8;85.4] 1.0 [0.4;2.1] 20.4 [13.7;29.3]
Migration background
No migration background 91.0 a [88.2;93.2] 2.7 a [1.7;4.2] 6.3 a [4.4;9.0]
2nd generation immigrants 84.1 a [73.2;91.1] 10.0 b [5.1;18.7] 6.0 a, b [1.9;16.9]
1st generation immigrants 95.5 b [92.2;97.4] 2.9 a [1.5;5.6] 1.7 b [0.7;3.8]
Language region
German-speaking Switzerland 91.8 a [88.5;94.2] 2.4 a [1.3;4.5] 5.8 a [3.7;8.9]
French-speaking Switzerland 89.6 a [86.0;92.4] 5.0 b [3.3;7.6] 5.4 a [3.3;8.7]
Italian-speaking Switzerland 80.9 b [75.2;85.5] 11.8 c [8.0;17.1] 4.5 a [4.5;11.7]
Educational attainment
(See Table 3)
(See Table 3)
(See Table 3)
No post-compulsory certificate 81.5 [68.6;89.9] 8.1 [3.6;17.1] 10.4 [4.3;22.9]
Upper secondary VET 89.9 [86.1;92.8] 2.9 [1.6;5.3] 7.1 [4.6;10.9]
Tertiary B 97.6 [95.9;98.6] 1.1 [0.6;2.2] 1.3 [0.6;2.8]
Tertiary A 93.0 [90.4;94.9] 4.0 [2.5;6.4] 3.0 [2.0;4.6]
Explanatory note on Table 1:
The percentages in each row add up to 100 per cent (minor differences are due to rounding).
Differences between the categories of a specific attribute are statistically significant (p < .05) if they are marked by different letters (see
also the example below of how to read the table). The significances for attributes with more than three categories (gender and
parenthood as well as educational attainment) are provided in separate tables (Tables 2 and 3 on the next page). Parameter estimates
were performed on the weighted sample, using suitable methods to properly model the complex structure of the PISA 2000/TREE
sample.18 The parametric significance tests were further complemented by exact tests. The lower and upper bounds of the confidence
intervals (p < .05) are provided in square brackets.
Examples of how to read the table:
In Italian-speaking Switzerland, unemployment is estimated to be at 11.8 per cent. The confidence interval (p < .05) is between eight
and 17.1 per cent. The letter c following the value indicates that the difference between this value and the respective value for French-
speaking (5.0%) and German-speaking Switzerland (2.4%) is statistically significant. The different letters (a and b) following the values
for German- and French-speaking Switzerland signify that the differences in the values for the two language regions are also statisti-
cally significant. The situation is different for the employment rate by language region. Whereas Italian-speaking Switzerland (b) dis-
plays significant differences to the other two language regions (a), German- and French-speaking Switzerland show no significant
differences in this respect (both a).
18
For instance, “survey set” in STATA or “complex samples” in SPSS.
23TABLE 2 EMPLOYMENT STATUS IN 2014 BY GENDER AND PARENTHOOD:
STATISTICAL SIGNIFICANCES
Employed (1) (2) (3) (4)
(1) Men without children
(2) Men with children *
(3) Women without children n.s. *
(4) Women with children * * *
*: Differences are significant (p < .05).
n.s.: Differences are not significant (p ≥ .05).
Unemployed (1) (2) (3) (4)
(1) Men without children
(2) Men with children *
(3) Women without children n.s. *
(4) Women with children * n.s. *
*: Differences are significant (p < .05).
n.s.: Differences are not significant (p ≥ .05).
Not economically active (1) (2) (3) (4)
(1) Men without children
(2) Men with children *
(3) Women without children n.s. *
(4) Women with children * * *
*: Differences are significant (p < .05).
n.s.: Differences are not significant (p ≥ .05).
TABLE 3 EMPLOYMENT STATUS IN 2014 BY EDUCATIONAL ATTAINMENT:
STATISTICAL SIGNIFICANCES
Employed (1) (2) (3) (4)
(1) No post-compulsory certificate
(2) Upper secondary VET n.s.:
(3) Tertiary B * *
(4) Tertiary A * n.s. *
*: Differences are significant (p < .05).
n.s.: Differences are not significant (p ≥ .05).
Unemployed (1) (2) (3) (4)
(1) No post-compulsory certificate
(2) Upper secondary VET n.s.
(3) Tertiary B * n.s.
(4) Tertiary A n.s. n.s. *
*: Differences are significant (p < .05).
n.s.: Differences are not significant (p ≥ .05).
Not economically active (1) (2) (3) (4)
(1) No post-compulsory certificate
(2) Upper secondary VET n.s.
(3) Tertiary B * *
(4) Tertiary A n.s. * *
*: Differences are significant (p < .05).
n.s.: Differences are not significant (p ≥ .05).
24TABLE 4 EXTENT OF EMPLOYMENT IN 2014 BY GENDER, PARENTHOOD, MIGRATION BACKGROUND, LANGUAGE
REGION AND EDUCATIONAL ATTAINMENT
Extent of employmentTABLE 5 EXTENT OF EMPLOYMENT IN 2014 BY GENDER AND PARENTHOOD:
STATISTICAL SIGNIFICANCES
Extent of employmentTABLE 7 AVERAGE MONTHLY INCOME IN 2014, GROSS FULL-TIME EQUIVALENT, BY GENDER, PARENTHOOD,
MIGRATION BACKGROUND, LANGUAGE REGION AND EDUCATIONAL ATTAINMENT:
ESTIMATES, STANDARD ERRORS AND CONFIDENCE INTERVALS
Estimates Standard errors (SE) Confidence interval
(lower bound; upper
bound)
Total (N=2580) 6,495 87 [6324;6666]
Gender and parenthood
(See Table 8)
Men without children 6,887 173 [6547;7227]
Men with children 6,878 232 [6421;7336]
Women without children 6,256 112 [6036;6477]
Women with children 5,669 299 [5080;6258]
Migration background
No migration background 6,507 a, b 103 [6305;6709]
2nd generation immigrants 6,921 a 368 [6193;7649]
1st generation immigrants 6,080 b 266 [5553;6607]
Language region
German-speaking Switzerland 6,629 a 111 [6410;6847]
French- and Italian-speaking Switzerland 6,152 b 123 [5911;6394]
Educational attainment
(See Table 9)
No post-compulsory certificate 5,607 461 [4671;6542]
Upper secondary VET 5,849 143 [5567;6131]
Tertiary B 7,122 301 [6527;7716]
Tertiary A 7,641 231 [7186;8096]
Amounts in Swiss francs are provided in the left column.
Within a given cell of the table, differences between subgroups are statistically significant (p < .05) if they are marked by different
letters (a, b, c). The confidence intervals are indicated in brackets. The upper and lower bounds are provided for each figure.
TABLE 8 AVERAGE MONTHLY INCOME IN 2014, GROSS FULL-TIME EQUIVALENT, BY GENDER AND PARENTHOOD:
STATISTICAL SIGNIFICANCES
(1) (2) (3) (4)
(1) Men without children
(2) Men with children n.s.
(3) Women without children * *
(4) Women with children * * *
*: Differences are significant (p < .05).
n.s.: Differences are not significant (p ≥ .05).
TABLE 9 AVERAGE MONTHLY INCOME IN 2014, GROSS FULL-TIME EQUIVALENT, BY EDUCATIONAL ATTAINMENT:
STATISTICAL SIGNIFICANCES
(1) (2) (3) (4)
(1) No post-compulsory certificate
(2) Upper secondary VET n.s.
(3) Tertiary B * *
(4) Tertiary A * * n.s.
*: Differences are significant (p < .05).
n.s.: Differences are not significant (p ≥ .05).
27You can also read