Trends and Determinants of Female Labor Force Participation in Morocco
←
→
Page content transcription
If your browser does not render page correctly, please read the page content below
Public Disclosure Authorized

 Policy Research Working Paper 9591
Public Disclosure Authorized

 Trends and Determinants of Female Labor
 Force Participation in Morocco
 An Initial Exploratory Analysis
Public Disclosure Authorized

 Gladys Lopez-Acevedo
 Florencia Devoto
 Matías Morales
 Jaime Roche Rodriguez
Public Disclosure Authorized

 Poverty and Equity Global Practice
 March 2021
Policy Research Working Paper 9591

 Abstract
 The U-shape theory argues that at early stages of devel- Survey, and the Arab Barometer, probit models and a multi-
 opment, countries experience a reduction in the female nomial logit are estimated to explore the challenges affecting
 labor force participation, eventually followed by a recov- female insertion into the labor market. The findings show
 ery. In Morocco, female labor force participation is now that higher educational attainment increases the probability
 lower than it was two decades ago due to several factors of female participation, but this relationship has decreased
 that are discussed in the paper. There is also a persistent over time, not being enough to offset other obstacles caused
 50-percentage-points gender gap in labor force participation by other individual and household characteristics. Being
 rates, despite improvements typically related to develop- married and the presence of other inactive women are found
 ment and female inclusion—such as a higher gross domestic to decrease female participation. The educational level of
 product per capita, lower fertility rates, and better access the head of household (typically men) increases female inac-
 to education. At the same time, urban job creation has not tivity, suggesting that potentially gender roles may drive
 been able to offset rural job destruction nor the increase in women out of the labor market and slow the recovery in
 the working age population for both genders. Using data women’s participation.
 from the Moroccan Labor Force Survey, the World Values

 This paper is a product of the Poverty and Equity Global Practice. It is part of a larger effort by the World Bank to
 provide open access to its research and make a contribution to development policy discussions around the world. Policy
 Research Working Papers are also posted on the Web at http://www.worldbank.org/prwp. The authors may be contacted
 at gacevedo@worldbank.org.

 The Policy Research Working Paper Series disseminates the findings of work in progress to encourage the exchange of ideas about development
 issues. An objective of the series is to get the findings out quickly, even if the presentations are less than fully polished. The papers carry the
 names of the authors and should be cited accordingly. The findings, interpretations, and conclusions expressed in this paper are entirely those
 of the authors. They do not necessarily represent the views of the International Bank for Reconstruction and Development/World Bank and
 its affiliated organizations, or those of the Executive Directors of the World Bank or the governments they represent.

 Produced by the Research Support Team
Trends and Determinants of Female Labor Force Participation
 in Morocco: An Initial Exploratory Analysis

 Gladys Lopez-Acevedo, Florencia Devoto, Matías Morales, and Jaime Roche Rodriguez

JEL classification: J16, J21, O54
Keywords: Morocco, Female, labor force participation.

This is a background paper for the World Bank Jobs Diagnostic of Morocco (2020). We thank Uche Eseosa Ekhator-Mobayode, Gordon
Betcherman, Vasco Molini, and Federica Alfani for useful discussions and suggestions in the crafting of this paper. All remaining errors
are the responsibility of the authors. To contact the authors please write to gacevedo@worldbank.org. Gladys Lopez-Acevedo1 is a Lead
Economist and Global Lead at the World Bank in the Poverty and Equity Global Practice Group (PEGP). Florencia Devoto, Matias
Morales, and Jaime Alfonso Roche Rodriguez are consultants at the World Bank in the Poverty and Equity Global Practice Group (PEGP).
The findings, interpretations, and conclusions expressed in this paper are entirely those of the authors. They do not necessarily represent
the views of the International Bank for Reconstruction and Development/World Bank and its affiliated organizations, or those of the
Executive Directors of the World Bank or the governments they represent. Postal address: 2232 40th Pl NW, Washington DC, 20007,
United States of America.
I. Introduction

At 21.16 percent, the female labor force participation (FLFP) rate in Morocco ranked 180th

out of a sample of 189 countries in 2018, 1 meaning that 78.4 percent of Moroccan women

between 15 and 65 years old were neither employed nor looking for a job. Currently, the

FLFP rate is lower than it was two decades ago, despite lower fertility rates and better access

to education, factors usually associated with greater chances of employability.

While the education profile of the female population has improved, it has not translated into

a greater share of educated women in the labor force. For instance, 40 percent of unemployed

women have a college education (while 8 percent have no education), and among employed

women in rural areas (half of the total employed women), 77 percent have no formal

education and less than 1 percent have a college education. 2 Although women have better

access to education, the participation rate among those educated has decreased over time.

Female inactivity for women holding a superior education rose from 13 percent in 2010 to

19 percent in 2018 in rural areas and from 23 to 24 percent in urban areas in the same period.

The overall low education profile of employed women signals constraints to participation, a

possible mismatch between firms’ needs and their skills, and other cultural and social norms

that could possibly limit the employment of women. Also, vulnerability in the form of unpaid

or informal work is highly prevalent among employed women.

This paper provides insight into the persistent challenge that Morocco faces in bringing

women into the labor market. From a macroeconomic point of view, increased FLFP would

put more labor inputs to use, thus improving the country’s productive capacity. From a

1
 World Development Indicators 2020.
2
 In urban areas, education levels of the employed are somewhat higher and more evenly distributed.

 2
microeconomic point of view, the benefits are more nuanced. On the one hand, when women

participate in the labor force, they gain a voice in society, and as a consequence, households

invest more in education and health (Duflo, 2012). On the other hand, while higher FLFP

may imply greater welfare, this may not always be true if working conditions are not ideal.

Evidence from developing countries suggests that many women work in low-paid jobs or

unsafe working conditions out of necessity.

We use 18 cross-sectional waves of the National Employment Survey between 2001 and

2018, three waves of the World Values Surveys between 2001 and 2011, and four waves of

the Arab Barometer between 2006 and 2017. Our goal is to gain a better understanding of

Morocco’s low FLFP and to initially explore the constraints and choices that women face

regarding their labor market status. For example, a restricted demand for female employment

may be associated with traditional attitudes toward women’s work, which pulls women out

of the labor force—an understudied factor in Morocco.

The structure of the paper follows: Section II reviews the existing literature on the micro-

determinants of FLFP, along with the role of values and identity in women labor. Section III

describes Morocco’s position in context in the MENA region and the world. Section IV

describes the data used and its sources. Section V describes the profile of active and inactive

women and female workers in terms of participation, employment, and inclusion. Section VI

describes the methodology used to summarize the interplay of multiple variables. Section

VII presents the results. Finally, section VIII pulls the paper together with conclusions.

 3
II. Academic Literature and Previous Studies

The micro-determinants of FLFP

At the microeconomic level, Killingsworth and Heckman (1986) review the empirical and

theoretical literature on the determinants of female labor supply and its interactions with

fertility, marriage, and divorce decisions in the United States, Canada, Great Britain, and

Germany. They established three stylized facts of FLFP observed during the 20th century:

(a) FLFP only decreases after age 20; (b) single women are always more likely to work than

married women, but married women have experienced a sustained FLFP increase over the

past 100 years; and (c) in 1980, women were over-represented in occupations such as white-

collar clerical and services jobs and under-represented in blue-collar jobs such as crafts,

operatives, and non-farm labor.

Using data from the 1960 census, their Ordinary Least Squares (OLS) results indicate that

higher FLFP is associated with higher educational attainment, being single, and having a

source of “other income.” 3 As we do in this paper, they acknowledge that their results arise

from an observed equilibrium between supply and demand for women’s skills and

consequently, cannot be taken as causal relationships. However, the observed characteristics

of labor markets in these 20th century Western countries may differ greatly from those in

Morocco—especially for female inclusion, because of the different conditions in terms of

development.

3
 Income other than own earnings, including transfer income.

 4
What does the literature show for FLFP constraints in Morocco? Overall, the evidence is

limited and out of date. Using the Moroccan Living Standards Measurement Study 1990-

1991, Assaad and Zouari (2002) find that marriage does not affect FLFP, but the presence of

children reduces it, particularly in terms of private-sector employment. Spierings and Smits

(2007) study FLFP in four Arab countries (data from Morocco corresponds to the 2004

Demographic and Health Survey (DHS)) and find that higher education is the most important

explanatory variable. Verme et al. (2016) conclude that the nature of economic growth in

Morocco and gender norms interact to determine FLFP. In particular, they claim that women

holding secondary education are unable to find jobs, which encourages marriage and deters

female labor supply. Previously mentioned works do not explore how demographic

characteristics affect FLFP for different periods of time. Also, they do not pay attention to

the attributes of other members inside the household that could also affect women’s decisions

towards work.

Other literature streams highlight the importance of traditional roles on FLFP. The values in

a society—beliefs and motivations other than economic factors—can shape individual

behavior and play a role in determining female labor supply. A key manifestation of these

traits is the individual’s attitude toward work and its relationship with gender. In Chile, for

example, Contreras and Plaza (2010) find that as more women internalize conservative

cultural values, they participate less in the labor market, offsetting positive human capital

accumulation effects. Identity—that is, the link between certain social categories and the

expectations about them—also affects individuals’ decisions (Akerlof and Kranton, 2000);

 5
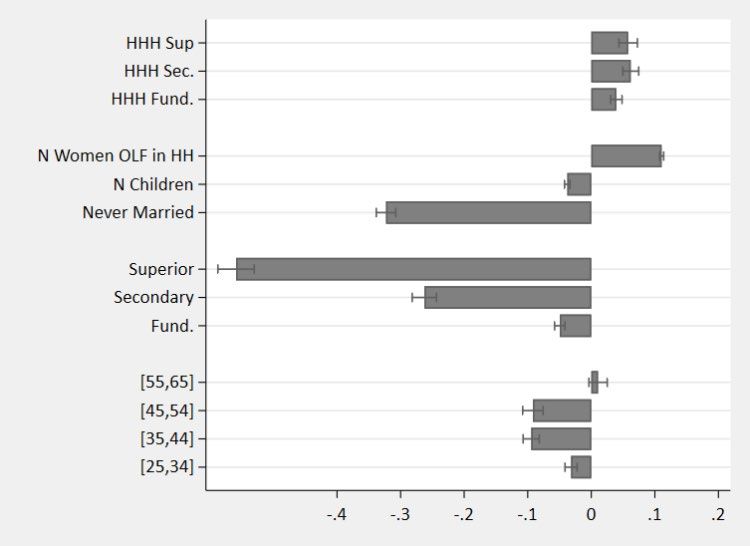
in MENA, women with strong “traditional” 4 identities have a 5-percentage-point lower

probability of entering the labor market (Hayo and Caris, 2013).

III. FLFP in Context
Morocco in the world: The U-shape theory

The U-shape theory argues that as countries develop economically, they experience a

reduction in FLFP, eventually followed by a recovery. At early stages of development,

women participate extensively in economic activity by doing unpaid work in family farms

and businesses. As economies develop, women tend to withdraw from the labor force as jobs

migrate to industries and cities. A plausible explanation for a decrease in female participation

is that households become less dependent on two incomes. Another one is that in many places

a stigma is associated with women performing manufacturing tasks (Caraway, 2007). Also,

it is more difficult to combine working outside the house along with childcare, which is

usually considered “women’s work” (ILO, 2017). At later stages of development, female

employment tends to rise again as sectors better aligned with women’s skills such as light

manufacturing and services tend to develop (Goldin, 1994). Vasco et. al (2021) find that

Between 2000 and 2018, Morocco’s FLFP rate fell from 24 to 21 percent, while GDP per

capita grew 70 percent from $1,976 to $3,361, 5 with a population annual growth ranging

between 1.1 and 1.4 percent. This joint movement fits the empirical regularity depicted in

figure 1, which shows the resulting “U-shaped” relationship between development (GDP per

capita) and FLFP rates for a cross section of countries in 2000 and 2018.

4
 Those who respond that being a housewife is as fulfilling as working for pay.
5
 World Development Indicators.

 6
However, recent empirical evidence, by Heath and Jayachandran (2017) finds an increasing

FLFP trend in most other developing countries, regardless of their GPD per capita. They

confirm that poor countries have been moving along the U-shape curve, but they also show

that the curve has been shifting upwards as the transition from “heavy” to “light”

manufacturing and services takes place earlier in the development process. In other words,

FLFP rates should be higher for any income level, an observation that figure 1 also supports,

given that the 2018 fitted line is above that of 2001.

Figure 1. U-shape relationship between GDP per capita and FLFP rates

Source: World Development Indicators. Each dot represents a different country.

As for Morocco, there has been an FLFP rate decline between 2000 and 2018, as shown in

figure 1, despite its employment shares transitioning out of agriculture and into

manufacturing and services. This means that for Morocco the curve’s rising shift has not been

strong enough to offset the downward force of the U-shape.

 7
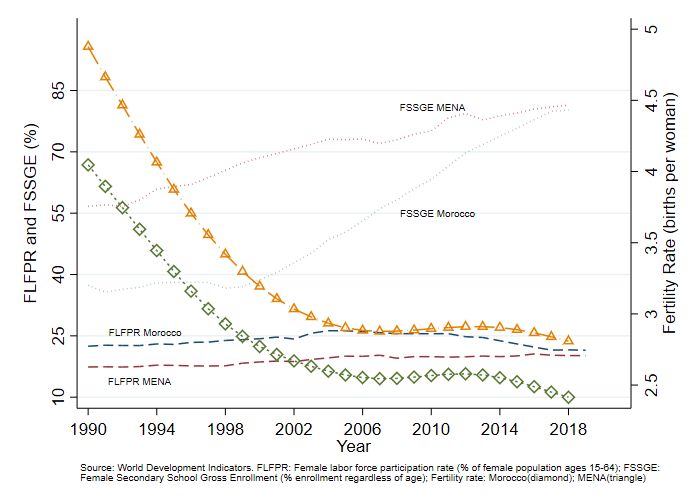
Morocco in the context of the Middle East and North Africa (MENA)

The Middle East and North Africa (MENA) region is characterized by historically low FLFP

rates (Figure 2). In 2005, the unweighted average FLFP rate of MENA countries crossed 20

percent, where it has remained relatively stable, at 21 percent in 2019. However, FLFP varies

widely across countries: in Algeria and Jordan, less than 15 percent of women participated

in the labor market in 2019, while in Libya 34 percent did so. Morocco’s FLFP is slightly

above the MENA average, but it is among the few countries in the region that have recorded

a sustained drop, and the one that has experienced declining FLFP for the longest span of

time—peaking at 26.3 percent in 2004. If this trend persists, in a few years Morocco’s FLFP

rate could be below the region’s average.

Fertility rates have been previously found inversely related with FLFP by Mishra & Smith

(2010). However, they state there is no consensus about this, since previous studies have

found a positive relationship. For this study, fertility rates have experienced similar

downward trajectories in MENA and Morocco, although at a lower level for the latter.

Whereas for MENA this has been coupled with slightly higher FLFP, in Morocco, it has been

coupled with lower FLFP since 2004. Therefore, a question that emerges is: Has Morocco’s

FLFP rate reached a minimum in the U-shape curve—that is, the threshold after which it

should start recovering—and if so, what conditions should be met for this to happen?

Figure 2. Historically low FLFP in Middle East and North Africa

 8
Source: World Development Indicators. FLFPR: Female labor force participation rate (% of female population ages 15-64);
FSSGE: Female Secondary School Gross Enrollment (% enrollment regardless of age); Fertility rate: Morocco (diamond);
MENA (triangle).

IV. Data

Our main source of data is 18 waves of the Moroccan National Employment Survey 6 between

2001 and 2018. The surveys are representative at the sub-national (regional) level and include

detailed household and individual demographic and socio-professional characteristics. The

sampling frame follows a two-stage stratification strategy in urban and rural areas and

regions, which were redefined and reduced to 12 from 16 in 2013. On average, every year

the sample comprises between 150,000 and 250,000 individuals older than 15. Of these, 65

percent lived in urban areas in 2018, 2 percentage points more than in 2001.

One important limitation of our data set is the lack of wage data, which is an important

determinant of individuals’ labor supply decisions. Hence, we focus on non-wage

determinants of labor supply, such as the number of children in the household, education

6
 Enquête National sur l’emploi (ENE).

 9
(which in theory reflects productivity and hence wages), and the presence of other women in

the household. 7

To explore the role of values in shaping women’s labor market decisions, we use two

complementary data sources. The first is the Arab Barometer, which measures political,

societal, and religious attitudes. The questionnaire distinguishes “Employed,” “Inactive,” and

“Unemployed” individuals. While it contains basic demographic characteristics, it does not

include some important data, such as household size, region, rural/urban household, or

occupation. Importantly, it includes a question asking the level of agreement with the claim

that “A married woman can work outside home if she wishes,” which we will use as a

measure of the respondent’s attitudes toward women’s work. Interviewers conduct face-to-

face interviews in the respondent’s residence. There are four waves that include Morocco

that are available: 2006-2009, 2012-2014, 2016-2017, and 2018-2019. The first three waves

have a sample size of around 1,000 observations. The fourth one contains 1,560 women aged

between 18 and 64. 8

The second data source is the World Values Survey, which aims to understand changes in

beliefs, values, and motivations of people throughout the world. Morocco is included in three

of the waves—2001, 2007, and 2011—each of which has about 1,200 observations, equally

split between men and women, for a total of 3,648 individuals aged 18 or older. Questions

measure cultural values, attitudes, and beliefs about diverse variables (such as gender, family,

religion, poverty, education, health, and security). The surveys contain a labor status variable

7
 Verme et al. (2016), facing the same limitation, argue that in informal economies earnings play a less
relevant role in shaping labor supply decisions than in formal economies.
8
 The unavailability of the variable regarding attitude toward female work in the 2018-2019 wave renders it
useless for our purposes.

 10
and several other demographic characteristics. Importantly, individuals are asked about their

level of agreement in a scale from 1 to 4 (Agree Strongly, Agree, Disagree, and Strongly

Disagree) toward the claim “Men should have more right to a job than women.”

 V. The Profile of Active and Inactive Women in Morocco
Participation

Over the past 20 years, labor force participation rates for both males and females (individuals

older than 15) have been falling, with a persistent gender gap of about 50 percentage points

as shown in figure 3.

Figure 3. Big gap persists between female and male labor force participation rates

Source : HCP Enquête National sur l’emploi (ENE), 2001-2018

However, these aggregate figures hide the huge difference that living in urban versus rural

areas makes for both genders. Throughout our sample, the share of women not in the labor

force (labeled as “inactivity”) in urban areas is between 12 and 20 percentage points higher

than in rural areas, depending on the year (figure 4 panels a and b). This means that the low

 11
overall FLFP rate is due to the particularly low rate in urban areas—where 64 percent of the

working age women in our sample lived in 2018. However, Arezki et al. (2020) suggest

inactivity in MENA might be underestimated, so, if this is the case in Morocco, the gap

between inactivity in rural and urban areas could be smaller.

The gender and geographical dimensions shape not only labor participation rates but, as a

consequence, employment and unemployment rates. Female unemployment rates in rural

areas are the lowest of the four sub-populations depicted, remaining at virtually zero. At the

same time, unemployment rates are high in urban areas, along with high female inactivity

(female unemployment rate in 2018 was 13 percentage points higher than male’s in urban

areas), which hints that inactivity might be partly due to the “discouraged worker”

phenomenon. It is worth noting that the urban/rural divide observed in labor market

outcomes for women also holds true for men, whose employment rate is between 15 and 20

percentage points higher in rural than urban areas, and the unemployment rate is between 7

and 12 percentage points lower.

Overall, these patterns reveal the existence of two different labor markets: one in rural areas,

where employment and participation are higher for both genders, and another in urban areas,

where inactivity is extremely high for women and relatively low but increasing for men.

Beyond the urban/rural divide, education plays an important role in determining the labor

status of individuals.

 12
Figure 4. Different job profiles for urban versus rural work status

 a) Women in rural areas b) Women in urban areas

 c) Men in rural areas d) Men in urban areas

Source: HCP Enquête National sur l’emploi, 2001-2018. Relevant populations are (i) working age population (over 15
years old) in the case of Inactivity or Employment share, and (ii) active population in the case of Unemployment Rate.
These relevant populations also change by gender and urban/rural in each panel.

As for education and skills, a common belief is that labor participation rates are low due to

lack of skills of women and that improving access to education for women would solve this

(under this logic) supply-side problem (Cantillon et al, 2001). In Morocco, access to

education for women has improved significantly over the past two decades, with the

percentage of women with no education falling from 50 to 38 percent and that of women

with superior education growing from 5.5 to 10 percent. Even so, labor market outcomes for

women are disappointing, as shown in figure 5, which depicts the shares of women employed,

 13
unemployed, and inactive for each of the four education groups in years 2001, 2010, and

2018.

We observe that in rural environments, people with less education have the highest labor

market participation (figure 5 panel a). Also, those with college education (who are a

minority in rural areas) have similar employment rates as fundamental and secondary

education groups, but a much higher share of unemployed women. This information could

hint at the type of work available depending on the area of residence. For instance, in rural

areas, women typically work in family businesses and farms. But in urban areas, there is a

more positive relationship between education and FLFP rates, in line with international

evidence (figure 5 panel b). However, the trend over time is startling, given that educated

women were significantly less likely to participate in the labor market in 2018 (43 percent)

than in 2001 (54 percent).

Figure 5. Better education of urban women not enough to boost FLFP

 (a) Women in rural areas (b) Women in urban areas

Source: HCP Enquête National sur l’emploi.

 14
Employment

Another way to understand why most of Moroccan women do not join the labor force is by

studying the characteristics of those in the small group who do get a job—distinguishing by

schooling and economic sub-sectors. Women account for 23 percent of total employed adults;

in 2018, the female employment rate (percentage of women in the labor force who are

employed) was 19 percent, compared to 65 percent for males, whereas in 2001 it was 23 and

68 percent, respectively. There is also a wide divide between rural and urban areas: in 2018,

29 percent of women in rural areas declared being employed compared to 14 percent in urban

areas, whereas in 2001, these figures were 33 and 15 percent, respectively.

Figure 6. Most rural women work in agriculture, with little education if any
(Female employment by sector and education level)

 a) Rural sector b) Urban sector

Source: HCP Enquête National sur l’emploi , 2001-2018.

The vast majority of women employed in rural areas work in agriculture: 1.2 million women

in 2018, accounting for 92 percent of all rural female employment. In urban zones, the

majority of women work in services, a share that has risen since 2001; the rest mostly work

in industry, a share that has fallen since 2001. The specialization of agriculture in rural areas

and of services and industry in urban areas creates demand for different types of labor: 82

 15
percent of women with no education, for instance, work in agriculture (figure 6 panel a),

while in urban areas, we observe a mix of levels of education, reflecting more clearly the

progress in educational attainment for women (figure 6 panel b).

While women are getting more educated, this translates only partially into more employment.

In terms of education, as figure 7 panel a shows, the stagnant female rural population has a

lower share of women with no education and the growing female population in urban areas

also has a better educational distribution. However, on the job front, as panel b shows, there

is still a large gap between working age women and employed women. Moreover, it shows

that the employed population is not better educated than the universe of women in rural areas

and the other way around in urban areas.

Figure 7. Education matters, especially in urban areas
(Distribution of education among female population vs female employed population)

 a) Total female population b) Employed female population

Source: HCP Enquête National sur l’emploi , 2001-2018.

Different educational levels lead to different economic sub-sectors

Uneducated women. Most of uneducated women’s jobs are in personal and housekeeping

services (26 percent), followed by the textile industry (22 percent), and wholesale and retail

 16
trade (12 percent)—all sectors with low labor productivity, LFS (2018). While a large share

of women are salaried workers (73 percent), most do not have a formal job (only 24 percent

declare to be enrolled in social security). The average uneducated, employed woman is 41

years old, lives in a household of 4 people where one out of two times the head is a man, has

one child, and is slightly more likely to be married than single (40 percent against 34 percent).

A larger share of women working in personal services, compared to the average uneducated

employed woman, are divorced or widowed, which could signal that these women select into

a low-return activity out of necessity.

Employed women with secondary education. They are scattered among service sectors—

chiefly employed in health and education services (25 percent); wholesale and retail sale (13

percent); government administration (10 percent); finance, insurance, and real estate (10

percent); and the textile industry (10 percent). The share of salaried work is higher among

this group (87 percent), as is the share of formal employees (60 percent). It is also noteworthy

that the public sector employs a significant portion of this group—25 percent against only 5

percent for the uneducated employed women—and that the remaining 75 percent are

employed in the private sector. These women are 36 years old, on average, live in a household

with four members, where 70 percent have a male head, and 50 percent are single.

Employed women with superior education. They work mostly in three sub-sectors: health and

education services (43 percent); finance, insurance, and real estate (17 percent); and public

administration (12 percent). They also display the largest share of formal employment (80

percent), as expected. Most of them are salaried (90 percent), and they are almost equally

divided between the private (54 percent) and the public sectors (45 percent). Educated

women are slightly younger than uneducated women, being on average 37 years old. Almost

 17
half of them are single and live in a household more likely to have a male head (76 percent).

The finance sector employs younger women (mostly between 19 and 44 years old), who are

more likely to be single than the average employed educated woman. However, those

working in the public administration and health and education sectors are older and more

likely to be married (70 percent).

Status on the job

In rural areas, a vast majority of women work on home farms as family workers (figure 8a).

If considering only paid work, the female employment rate decreases to 9 percent in rural

areas—around one-third of the overall female rural employment rate—and remains

unchanged at 13 percent in urban areas. Therefore, while the quantity of jobs for women is

greater in rural areas, job quality is higher for women working in urban areas. This finding

is necessarily correlated to the fact that the majority of educated women live in urban areas,

and they are the mostly likely women to be able to access better jobs.

Figure 8. Most rural females are family workers, while urban ones are salaried
(Female employment by category in the job)

 a) Rural sector b) Urban sector

Source: HCP Enquête National sur l’emploi.

 18
The fact that 70 percent of employed women in rural areas work as unpaid family workers

fits the notion that rural women do not switch job status even when switching families: when

single they work for their fathers and when married they work for their husbands. Not

surprisingly, only 3 percent of these women have a formal job.

Evolution of female employment

How has female employment evolved over the past 20 years? Most female job creation has

taken place in urban areas. Between 2001 to 2018, the number of employed women in urban

areas increased by 32 percent, a net increase of 280,000, while jobs performed by women in

rural areas remained almost stable (net variation of -1 percent). New jobs created in urban

areas absorbed 10 percent of the increase in the female active population, which experienced

a large net increase of 2.7 million women over the period. The pace of job creation observed

in urban areas was thus not dynamic enough to preserve the levels of female employment

observed at the beginning of the period: female urban employment rates declined from 15

percent to 13.7 between 2001 and 2018. Maintaining the same level of women’s employment

would have required net job creation 45 percent higher, or equivalent to 410,000 additional

female employments, instead of the observed 280,000 over the period.

In rural areas, the demographic dynamics are quite different. The female working age

population increased by 0.5 million women in rural areas (as opposed to 2.7 million in urban

areas), outnumbering the slow pace of rural job creation (figure 9 panel a). The number of

employed women fell by 20,000, equivalent to 4 percent of the increase in the female rural

active women. The decline in female employment rates was, therefore, more accentuated in

rural areas—starting at 33 percent in 2001, reaching a peak of 38 percent between 2004 and

2006, before declining steadily thereafter to 29 percent in 2018.

 19
Figure 9. Most job creation taking place in urban areas
(Jobs creation by area and sub-periods)

 a) Difference 2018 – 2001 b) Average difference per year (Number of employed women)

Source: HCP Enquête National sur l’emploi.

In both rural and urban areas, female employment grew at a faster rate between 2001 and

2009 than in the following years. On average 39,800 additional women living in rural areas

found a job annually between 2001 and 2009 (figure 9 panel b), but this number turned into

a net annual decrease of 37,600 women’s jobs between 2009 and 2018—and surprisingly,

female migration toward urban areas did not increase during this period.

In urban areas, the extent of job creation for women was able to only partially offset the job

destruction in rural areas in 2009 - 2018, as evident in the total job creation tally (figure 9

panel b). Over the 2018-2001 period, employed women in rural areas decreased by 20,439

total jobs, while the overall net increase was 260,119, meaning that net job creation in urban

areas was able to cancel out the job destruction. However, this job creation is far from

absorbing the great increase in working-age women (figure 9 panel a).

Job destruction in rural areas is entirely explained by the agriculture and textile sectors—the

two main female rural employers in 2010. As expected, given the characteristics of employed

women in rural areas, this entirely concerns women with low levels of education who worked

 20
in informal jobs as unpaid family workers. The job destruction/creation dynamics observed

in rural areas shows that the likelihood for low-skilled women to find a job is decreasing

significantly. These two sectors are shrinking, while the few job opportunities being created

are in areas requiring higher education.

Most of the female jobs created in urban areas between 2010 and 2018 were concentrated in

four sub-sectors, which fully offset the decline observed in the textiles industry. While female

textile employment decreased by 25 percent, employment in these sub-sectors—finance,

insurance & real state, wholesale and retail trade, housekeeping services and education &

health services—increased by 67, 32, 32, and 19 percent, respectively. Female employment

increased in total by about 10 percent in urban areas between 2010 and 2018, with an

additional 122,000 women being employed.

Female inclusion in the labor market

Declining labor force participation trends are not gender specific, as male labor participation

rates also decreased. However, increased inactivity has affected males and females quite

differently. The decrease in male participation exclusively concerns young men, both in rural

and urban areas (figures 10 panel c and 10 panel d), which, in turn, correlates with larger

school enrollment rates in secondary and superior education. Labor force participation of

adult men (24-65) remained high and stable over the period.

 21
Figure 10. Evolution of participation rates over time

 (a) Women in rural areas (b) Women in urban areas

 (c) Men in rural areas (d) Men in urban areas

Source: HCP Enquête National sur l’emploi.

In contrast, employment trends in rural areas worsened for women in all age groups (figure

10 panel a). This suggests that the decline in rural job opportunities over the past decade

induced women—who most often work as family workers—to withdraw from the labor force

more so than men. Indeed, FLFP dropped from a peak of 32 percent in 2006 to 27 percent in

2018. As expected, since unemployment is not significant in rural areas, similar trends are

observed in the female rural employment rate, which dropped from 36 percent in 2010 to 29

percent in 2018 (table 1).

Table 1: Moroccan employment down since 2010, with unemployment just an urban issue

 22
(Percentage of women in each labor status)

 Rural Urban
 2001 2010 2018 2001 2010 2018
 Employed 32.9 36.2 29 15.1 14.7 13.7
 Unemployed .54 .743 .73 4.96 3.64 4.39
 Inactive 66.5 63.1 70.3 79.9 81.6 81.9
 Paid workers 17.3 25.2 29.4 93.2 94.7 96
 Formal workers .549 1.75 3.05 32.9 44.3 48.1
 Public Salaried . 7.09 10.7 . 25.3 22
 Private Salaried . 88.1 82.8 . 65.6 68.2

 Source: HCP Enquête National sur l’emploi. Paid workers category includes wage workers, independent,
 employers and others; it excludes apprentices and cooperatives workers. Formal workers is the share of
 employed that have health insurance (CNSS). Public and Private categories -unavailable in 2001- are calculated
 as shares of employed (they do not sum up to 100 because of a third “other” marginal category).

In urban areas, the decline in female participation rates is less accentuated, smoother, and

spread across age groups (figure 10 panel b). A phenomenon specific to urban areas is the

increase in female unemployment compared to the steady decline in unemployment for men

between 2001 and 2018. At the same time, female employment rates remained stable at

around 14 to 15 percent throughout the period (table 1). It is worth noting, however, that the

quality of jobs women accessed suffered a slight deterioration—with the number of

remunerated, formal, and private sector salaried jobs marginally lower for women relative to

men. The dynamics of job creation also reveals that the likelihood for a woman to be

employed in a new job fell over the period. Around 21 percent of jobs created over 2001-

2007 in urban areas employed a woman, while only 13 percent did so over 2007- 2018.

VI. Methodology

In the previous sections, we profile different groups of women regarding their labor status

and demographics, and we show the evolution of these variables over time. In the following

equation, we summarize how the multiple variables interact to determine the inactivity of

 23
women in urban and rural areas in two points in time, 2001 and 2018, using a Probit

estimation:

 ( ) = ( + ) (1)

where Xi includes age, squared age, number of kids under 10 years old in the household, a 4-

categories education variable, education level of head of household, a dummy variable that

equals “1” if the woman has never been married, number of inactive women in the household

and its square. These data come from the LFS of 2001 and 2018. We report the marginal

effect of each covariate using the average values in the sample.

We also estimate two models to shed light on the role that values play in determining female

labor force status. The first one is also a Probit model as in Equation 1. The data source is

the World Values Survey. Xi includes 10- Moroccan regions fixed effects, a dummy that

takes the value of “1” if the individual is married, age and squared age, dummies for a 3-

categories educational variable, and number of children. Our variable of interest is a dummy

that equals “1” if an individual agrees with the claim “Men should have more right to a job

than women if jobs are scarce,” which we associate with conservative or traditional traits.9

We estimate this model for men and women separately, and we report the marginal effect

evaluated at the means of the regressors in our sample.

The second model is a multinomial logit model:

 ( )
 ( ) = + ∀ = , , (2)
 ( ) + ∑ , ( )

9
 We drop from the estimation those individuals who do not answer and those who do not know. We set the
dummy to a value of zero for those individuals who disagree or whose answer is “Neither.”

 24
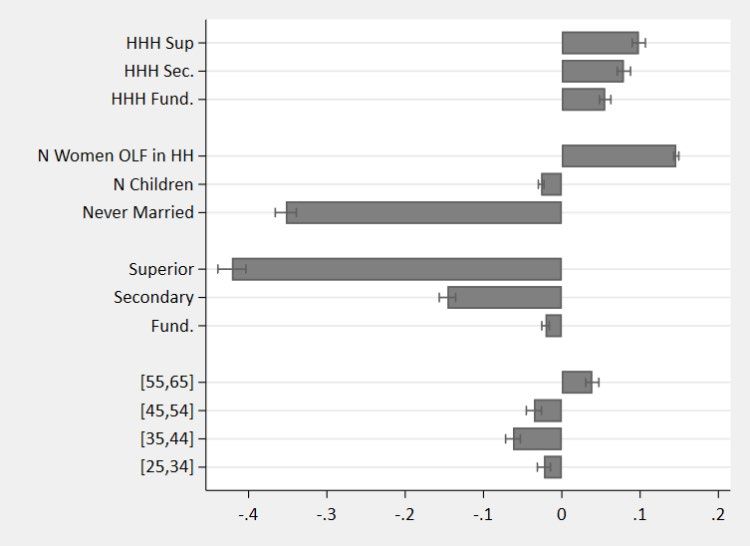
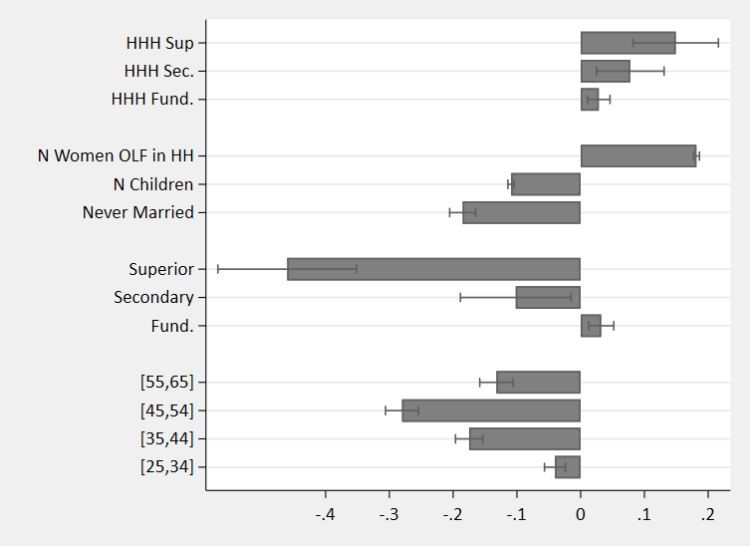
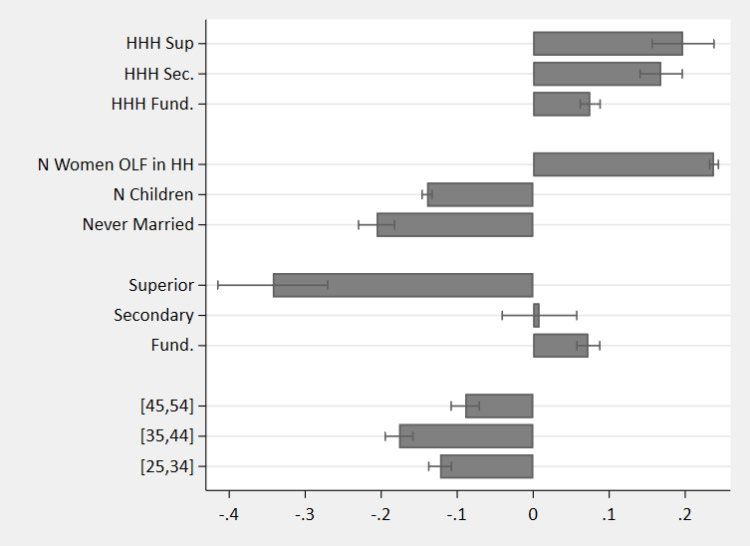
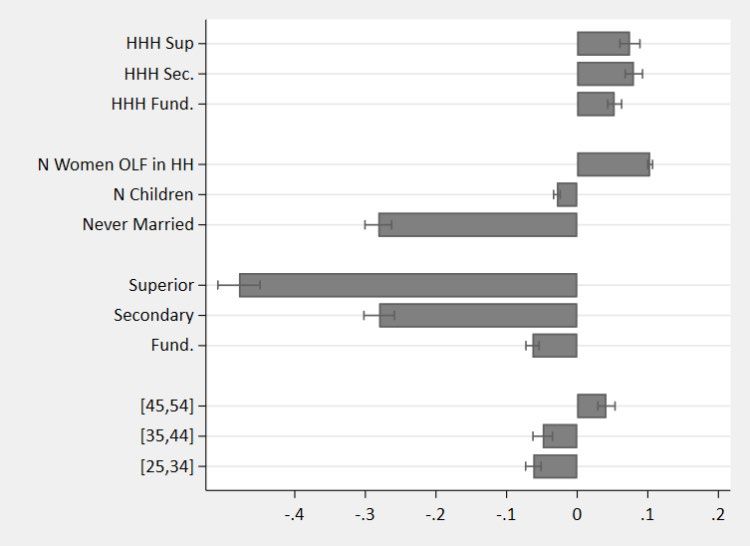
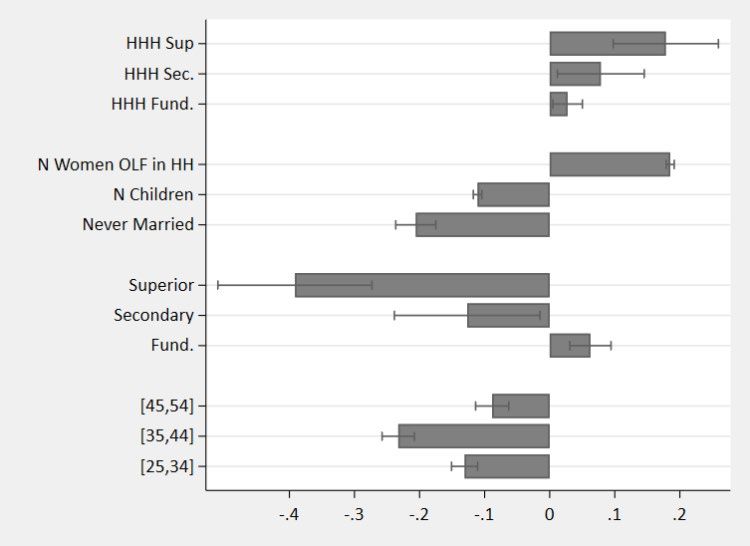
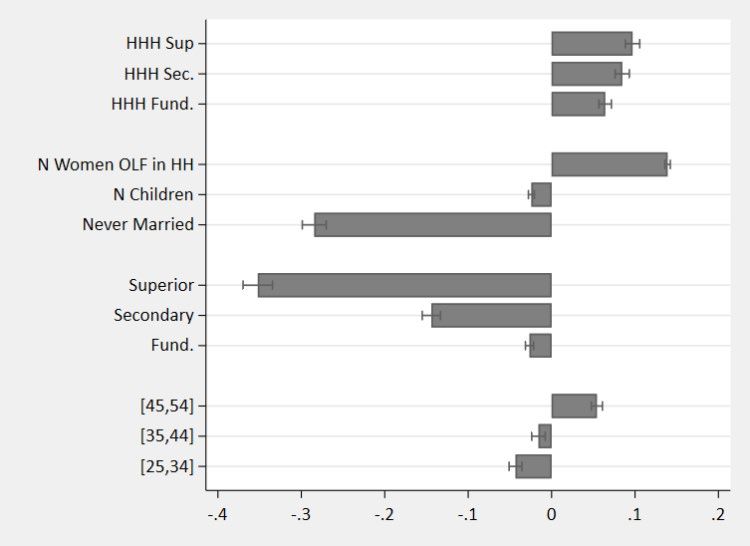
We estimate this model only with women. 10 The data source is the Arab Barometer, and Xi

 includes dummies for 7 age brackets, a dummy variable that equals “1” if a woman is married,

 and dummies for five categories of education and years fixed effects. 11 Our variable of

 interest is a dummy that equals “1” if women agree with the claim “A married woman can

 work outside home if she wishes,” which we will interpret as signaling a positive attitude

 toward female work.

VII. Results: The determinants of female labor supply

 Since the descriptive statistics show that urban and rural areas function as different markets

 for labor, we estimate the model in equation (1) separately for women in urban and in rural

 areas in 2001 and 2018 and show the resulting marginal effects in figure 10. During this time

 period, there are no important qualitative changes in the influence of the covariates and only

 a few important quantitative changes. We highlight the effect of each covariate in our results:

 First, higher educational attainment means more participation, although this relationship

 has decreased over time. The effect of women’s education differs greatly across areas and

 educational levels, although, especially in rural areas, more education does not necessarily

 translate into greater FLFP. In 2001, having fundamental education in rural areas increased

 the probability of remaining OLF compared to women with no education, contrary to the

 results obtained for urban areas where fundamental education slightly reduces the

 probability. In 2001, in rural and urban areas, secondary education decreased the probability

 10
 Further research can estimate this model, including only men’s answers to assess their attitude toward
 female work.
 11
 Strictly speaking, these fixed effects correspond to three waves: 2006-2009, 2012-2014, and 2016-2017.

 25
of remaining OLF. For 2018, the coefficient for rural areas is not significant, while for urban

it remains negative although with a slight decrease.

Holding superior education in urban and rural areas greatly increases the probability of

joining the labor force in both 2001 and 2018, signaling that the type of skills demanded

requires some specialization. These results differ from those in figure 7, where more

education is not necessarily correlated with more employment. However, when controlling

for other characteristics, more education is correlated with higher participation.

The same qualitative results can be found in figure A.1 in the Appendix, where the sample is

limited to women over age 25 (instead of restricting the sample to those currently enrolled in

school). In this sense, the higher the education level of women in Morocco (especially above

fundamental education), the lower the probability they will remain inactive. However, the

correlation has decreased over time, and the share of active women has been decreasing

among educated women.

Second, the better the education of the head of household, the more likely that a woman

will remain OLF. These effects acquire greater importance over time, especially in rural

households, where the effects became stronger in 2018. Indeed, the presence of a head of

household holding higher education renders the probability of a woman in a rural household

remaining inactive almost 20 percentage points higher compared to if the household head has

no formal education.

Third, being never married makes it less likely that the woman will remain OLF. While in

urban areas remaining single reduces the probability of being OLF by 30 percent, in rural

areas, it does so by 20 percent. The marginal effect of being single falls slightly in both areas.

 26
Fourth, the presence of other inactive women in the household increases the probability

of a woman being inactive. These effects increase over time in both rural and urban areas. If

the presence of other women made it easier to join the labor force—for instance, because of

more help with child caring and domestic duties—a negative correlation would be expected,

signaling that low FLFP is a result of supply-side constraints. Since this is not the case, we

hypothesize that FLFP is constrained by either attitudes towards women’s work within

households or a lack of job opportunities for women.

Fifth, the higher the number of children under 10 in a household, the more likely the

woman will remain OLF. This effect holds in both urban and rural areas. The fact that the

number of children is negatively correlated with inactivity (positively correlated with

participation) is also at odds with the notion that childcare deters FLFP. Marginal changes

hold steady over time. 12

Sixth, a person’s age—and hence experience—is of little significance for whether a

woman joins the labor force. This holds in rural and urban areas. This finding is consistent

with the fact that women tend to be employed in low-skilled occupations where experience

might not be rewarded. The marginal effect, which is negligible, holds steady over time.

Figure 11. Drivers of females being out of the labor force (OLF) – Without women currently
studying.
(Marginal Effects on the probability of female inactivity)

12
 Additional specifications of the model using dummies for having at least one child 0-2, 3-6 and 7-10 in the
household were tested obtaining the same negative correlation. This result is atypical and not conclusive
because it varies according to the data source (see results of Figure 15).

 27
(a) Rural 2001 (b) Rural 2018

 (c) Urban 2001 (d) Urban 2018
Source: Authors’ calculations using HCP Enquête National sur l’emploi, 2001-2018. Controls include: 5 age categories;
number of kids under 10 years old in the household; a 4-categories education variable (omitted category is ”No
education”); education level of head of household; a dummy that equals one if women were never married; the number of
inactive women in the household and its square. Marginal effects evaluated at the mean of the covariates in the estimation
sample. Sample restricted to women between 15-65 years old.

What other factors can be behind the declining trend in female LFP?: The role of values

When Moroccans were asked in 2011 about their level of agreement with the statement that

“Men should have more right to a job than women when jobs are scarce,” 75 percent of men

and 47 percent of women agreed. 13 Thus, considering the case in which men are making labor

supply decisions for women, we would expect lower participation among women than among

men because of the deeply rooted idea that men have to be the breadwinners and should have

13
 World Values Survey, 2011.

 28
priority access to job vacancies, whereas women should focus on domestic work. This belief

 finds a slight greater support among married individuals and less among single ones: 78

 percent of married men and 48 percent of married women agree with the statement, while

 these figures drop to 70 percent for single men and 45 percent for single women (figure 12

 panel a).

 Figure 12. Attitudes toward female work

(a) “Men should have more right to a job than women” (b) “Women can work outside home if she wishes”

 Source: World Values Survey, 2011, The Arab Barometer. Average of waves 2006-2009, 2012-2014, 2016-
 2017.

 When Moroccans were asked their opinion on the claim that “Women can work outside home

 if she wishes,” 14.8 percent of women and 35.6 percent of men disagreed. 14 Clearly, a higher

 share of women than men think women have a right to work. Among women who disagreed

 with the statement, 65 percent were inactive, while among those who agreed only 59 percent

 were inactive. Also interesting is the fact that the male labor force participation rate was 6

 percentage points higher for men more open to female work (figure 12 panel b), revealing

 14
 The Arab Barometer. Average of waves 2006-2009, 2012-2014, 2016-2017.

 29
positive attitudes towards women working could be related with participation rates in both

genders.

We delve deeper into this question by decomposing respondents into two age groups—

working age (18-64 years old) and prime age (18-44-years-old)—and examine how

responses change over time.

Figure 13. “Women can work outside home if she wishes” (18-64 years old)

 (a) 2006-2009 (b) 2012-2014

 (c) 2016-2017

Source: The Arab Barometer.

We find that the distribution of women who disagreed changed dramatically over time. While

for those in the working age group, 57 percent were inactive in the first round, this fraction

 30
swelled to 94 percent in the most recent round. Similarly, for those in the prime age group,

53 percent were inactive in the first round, this fraction later swelled to 88 percent, suggesting

attitudes towards women’s work are increasingly affecting women’s participation over time.

Figure 14. “Women can work outside home if she wishes” (18-44 years old)

 (a) 2006-2009 (b) 2012-2014

 (c) 2016-2017

Source: The Arab Barometer.

As for the men who agreed with women’s work, those in the working age and prime age

groups had similar patterns over time. The proportion of employed within them was 52 and

51 percent, respectively, in the first wave, reaching a maximum of 59 and 56 in the second,

and later decreasing to 56 and 49 percent.

 31
These survey responses reveal the existence of conservative views that might deter FLFP.

The question is then: to what extent does the level of agreement with these types of claims,

as a measure of individual attitudes toward female work, actually impact their labor status?

In other words, do social norms against female work offset the positive contribution of

education (observed, for instance, in figure 7 for urban areas)? To shed more light on this

question, we measure the negative effect of traditional attitudes toward female work on the

years of education women receive within a regression framework.

We tackle this question with two sets of estimations. The first consists of two separate Probit

regressions for men and women including a dummy variable that equals “1” if an individual

agrees with the claim “Men should have more right to a job than women.” Figure 15 shows

the resulting marginal effects of different levels of education along with the effect of agreeing

with the claim (which we interpret as holding negative views toward female work).

Figure 15. Negative attitudes associated with female work deters FLFP
(Marginal Effects on the probability of being out of the labor force)

 (a) Men (b) Women

Source: Authors’ calculations using The World Values Surveys 2001, 2007, and 2011. Marginal effects evaluated at mean
of covariates from Probit estimation in which the dependent variable equals one if an individual is inactive and zero
otherwise. Controls include a dummy for married, a spline of age, 3-categories education variable, each person’s number of
children, regions fixed effects, and a dummy that equals one if individual agrees with the claim that “Men should have more
right to a job than women” and zero otherwise (i.e. they answer “Disagree” or “Neither”). Only individuals older than 18
are included in the estimation sample. Observations: 695 women and 719 men.

 32
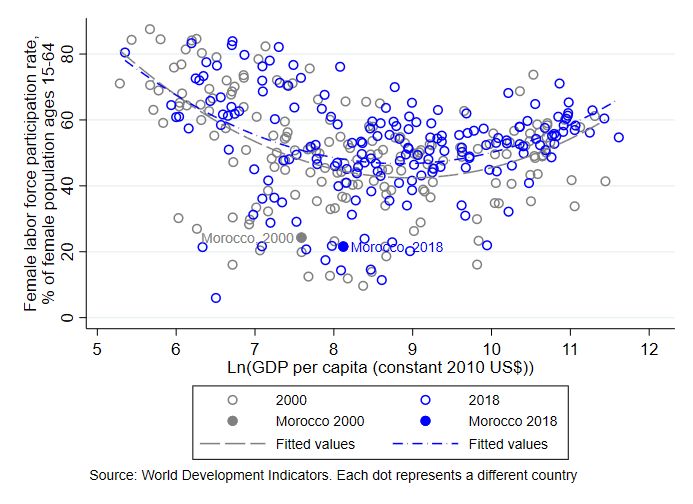
We find that men’s labor force status is not very sensitive to any of the covariates (relative

to the effect these same variables have on women’s status), which we interpret as male labor

force supply being inelastic. In the case of women, though, we find larger effects: for every

additional child in the household it is 3.7 percentage points more likely that a woman will

remain inactive; acquiring secondary education increases the probability by 6.6 percentage

points compared to having no education; acquiring college education does not have a

significant effect. Although we cannot control for urban/rural areas in this estimation because

of the nature of the data, higher education does not increase participation of women at the

national level, even after controlling for regions in which they live. More importantly, those

women who agree with the claim are 5.8 percentage points more likely to remain out of the

labor force than those who disagree. In other words, the stigma associated with female work

deters FLFP, even after controlling for all demographic characteristics.

Second, we complement this finding by estimating the Multinomial Logit Model in Equation

2. Figure 16 shows the marginal effects of different education levels along with the effect of

agreeing with the statement “Women can work outside the home if they wish” on the

probability of working for individuals in each of three labor statuses (Employed, Inactive

(labeled OLF), Unemployed).

Although we cannot claim causality at this point, the results show that agreeing is positively

correlated with the chances of being employed in 6.7 percentage points, about the same

magnitude as having fundamental education (relative to no education at all). It is also

correlated with the probability of being unemployed (this is, still participating) by 2.8

percentage points, and negatively with the probability of remaining inactive by 9.5

percentage points (figure 16).

 33
Figure 16. Positive views associated with female work encourages FLFP
 (Multinomial Logit Marginal Effects) 15

 Source: Authors calculation using The Arab Barometer controlling for 7 age groups categorical variables, dummy married,
 and 5 categories education. Dependent variable is a categorical for each Labor Status and only females are included in the
 estimation. “Agrees” refers to the answer to “Women can work outside home if she wishes”. See Appendix for marginal
 effects.

VIII. Conclusions

 Despite improvements in several key development indicators typically related to greater

 female inclusion in the labor force—such as higher GDP per capita, lower fertility rate, and

 better access to education—Morocco’s FLFP has remained one of the lowest in the world. In

 fact, it is even lower now than it was two decades ago. Further, while employed women’s

 education levels have remained low, educational attainment among unemployed and even

 inactive women has improved, suggesting some degree of misallocation in the labor market.

 15
 The results in figures 15 and 16 may suffer from endogeneity. The presence of social norms may affect
 labor status, but it is also possible that labor status might affect views toward labor market participation.
 Hence, reverse causality might bias our results. Contreras and Plaza (2010) argue that social norms change
 slowly and, therefore, in the short run this should not be a problem. In the absence of an instrument or panel
 data, there is no other way of answering this question. Our results are intended to encourage future research
 on this issue.

 34
The U-shape theory argues that economies experience a reduction in FLFP as they develop,

and that women withdraw from the labor force when jobs migrate from rural to urban areas,

with an eventual recovery when sectors such as light manufacturing and services develop. In

this sense, a question that emerges is: Has Morocco’s FLFP rate reached a minimum in

relation to the U-shape theory—that is, the threshold after which it should start recovering—

and if so, what conditions should be met in order for this to happen? Also, what can be done

to help Morocco benefit from an upward shift of the curve as the transition in manufacturing

and services takes place in the development process—which would facilitate higher FLFP

rates for any income level? So far, Morocco has yet to see this benefit, as evidenced by the

fact that the FLFP rate in 2018 was lower than in 2000.

This paper finds answers by profiling Morocco’s workers, as demographics play a vital role

in determining participation rates. While both female and male overall labor force

participation rates have declined over the past two decades, a 50-percentage-point gender gap

persists, following different dynamics in urban and rural areas. For men, this decline is mostly

present in youth mainly because of education enrollment, while for women this phenomenon

touches all ages and is not necessarily correlated with education enrollment. These gender

and demographic dimensions shape not only labor force participation rates but also

employment and unemployment.

For instance, employment rates are between 15 and 20 percentage points higher in rural than

urban areas, and unemployment rates are between 7 and 12 points lower for both genders.

This is a consequence of urban areas not generating enough jobs for women in Morocco to

offset agricultural job destruction. Female unemployment remains close to zero in rural areas,

while the most recent data (2018) show an urban female unemployment rate 13 percentage

 35
points higher than that of males, suggesting the increase of inactivity might be caused by

discouraged women.

As for inactivity, the reasons women give for staying out of the labor force vary across

education levels and marriage status. Married women report childcare and domestic duties

as their main reasons, while single women report other voluntary reasons. When

incorporating the education variable to the analysis, women with less education state family

opposition and domestic chores as the main constraints, which is related to the fact that social

norms worsen FLFP. In rural areas, the non-educated population has the highest labor

participation. For women with higher education, one-third are unemployed, which may be

related to the lack of suitable jobs for educated workers.

Overall, these patterns reveal the existence of two different labor markets: one in rural areas

where employment and participation are higher for both genders, and another in urban areas

where inactivity is extremely high for women and relatively low but increasing for men.

Using data from the LFS we find there are individual and household characteristics keeping

women out of the labor force, besides the precondition of an overall decrease in labor force

participation rates for both genders, since urban job creation in Morocco has not offset

agricultural job destruction. Being married, and the educational attainment of the head of the

household—which are variables related with traditional gender roles—are found to deter

FLFP. This is also reflected in the later multinomial logit where we find a positive correlation

between women who agree that women should be able to work outside home if they wish are

and the higher probability of being employed and lower of remaining inactive, suggesting

there might be a social stigma toward female keeping women out of the labor force.

 36
You can also read