MARYLAND TEACHER STAFFING REPORT 2016-2018 - Maryland State Department of Education - Maryland State ...
←
→
Page content transcription
If your browser does not render page correctly, please read the page content below
MARYLAND
TEACHER STAFFING REPORT
       2016-2018

    Maryland State Department of Education
           200 West Baltimore Street
       Baltimore, Maryland 21201-2595

             msde.maryland.gov

               September 2016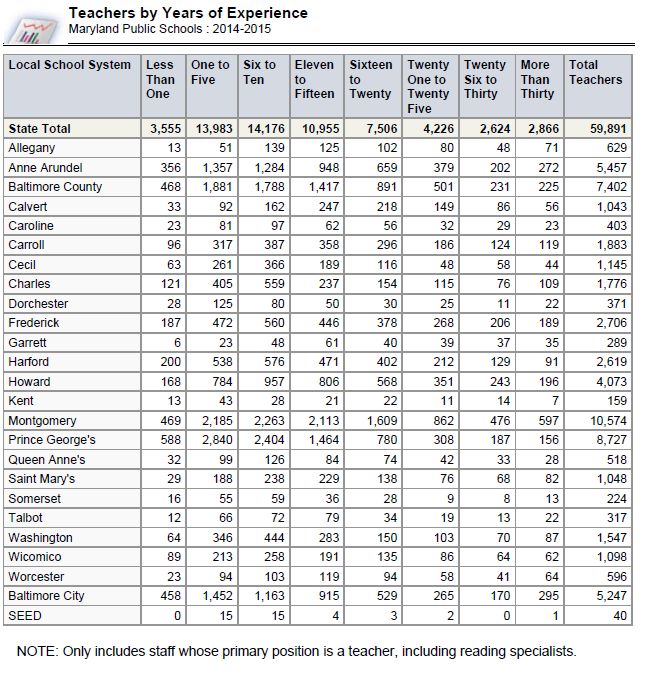
MARYLAND STATE BOARD OF EDUCATION
                           200 West Baltimore Street
                        Baltimore, Maryland 21201-2595

                             Andrew R. Smarick, President
                            Dr. S. James Gates, Jr., Vice President
                               Chester E. Finn, Jr., Ed.D.
                                    Laurie Halverson
                            Michelle Jenkins Guyton, Ph.D.
                                   Stephanie R. Iszard
                               Jannette O’Neill-González
                                      Barbara J. Shreeve
                                    Mrs. Madhu Sidhu
                                   Guffrie M. Smith, Jr.
                                    Laura Weeldreyer

                             David Edimo, Student Member

                                Karen B. Salmon, Ph.D.
                            Secretary-Treasurer of the Board
                            State Superintendent of Schools

The Maryland State Department of Education does not discriminate on the basis of age,
ancestry, color, creed, gender identity and expression, genetic information, marital
status, disability, national origin, race, religion, sex or sexual orientation in matters
affecting employment or in providing access to programs.

For inquiries related to departmental policy, please contact:

                        Equity Assurance and Compliance Office
                        Maryland State Department of Education
                                 200 W. Baltimore Street
                           Baltimore, Maryland 21201-2595
                                  410- 767-0433 (voice)
                                   410-767-0431 (fax)
                                410-333-6442 (TTY/TDD)

                                       Larry Hogan
                                        Governor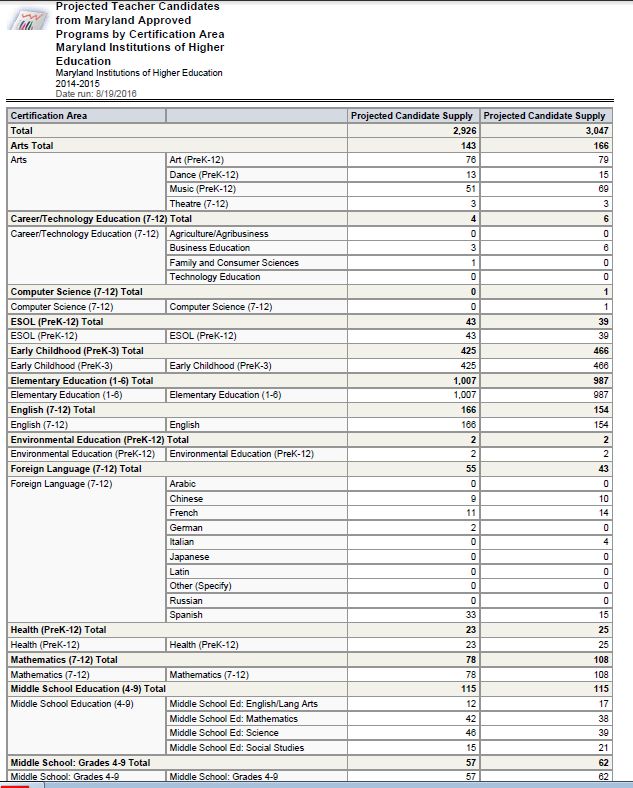
TABLE OF CONTENTS

Executive Summary .....................................................................................................................1

Introduction ..................................................................................................................................5
Background....................................................................................................................................5
Summary .......................................................................................................................................6

Part I:      Incentives and Strategies for the Recruitment and Retention
             of Quality Teachers and Principals ..............................................................................7
             National and Federal Initiatives
             Teacher Education Assistance for College and Higher Education Grant Program ..........7
             Federal Student Aid and Loan Forgiveness Programs ....................................................8
             Troops to Teachers .........................................................................................................8

             State Initiatives ..............................................................................................................9
             Workforce Shortage Student Assistance Grants ..............................................................9
             State Tax Credits .............................................................................................................9
             Resident Teacher Certificate ..........................................................................................9
             National Board for Professional Teaching Standards .....................................................10
             Teachers of Promise .....................................................................................................11
             Retire/Rehire Program ...................................................................................................11
             Local School Systems Participating in Retire/Rehire 2015/2016 ....................................12
             Summary Report of Retire/Rehire Program ...................................................................14
             Comprehensive Teacher Induction Program .................................................................14

Part II:     Staffing Patterns ..........................................................................................................15
             Portal web center Click on: Dashboards Portal

                                              Teacher Supply Dashboards
             Hom e
                                                                      Supply from M AP by Certification
            Overview                                                  P rojected Candidates by M AP
            New Hires by Certification Area                           Graduates by I HE
            New Hires: Transferred from LSS to                        Hires from M AAP P
            LSS                                                       Trend Data: M inorities from I HE
            New Hires by LSS                                          M inority New Hires by Certification
            New Hires Trends                                          Trend Data: M inority New Hires
            Teachers by Years of Ex perience                          New Hires by Gender
            Teacher Attrition                                         M AP Graduates by Gender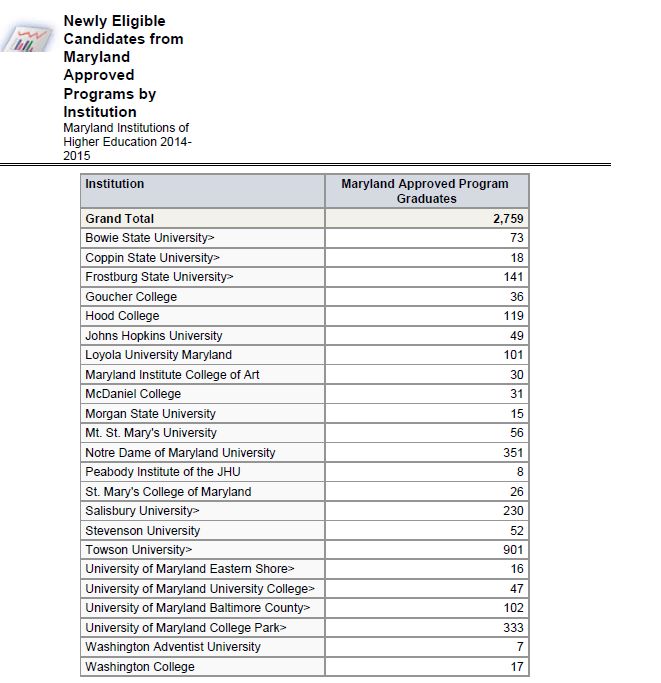
Table of Contents
                                                          (continued)

           New Hires ......................................................................................................................17
           Number of New Hires Who Transferred from Local School System to
           Local School System .....................................................................................................19

           New Hire Trends ...........................................................................................................20
           Teachers by Years of Experience ..................................................................................21
           Teacher Attrition ............................................................................................................22
           Supply from MAP by Certification Area ..........................................................................22
           Projected Candidates by MAP .......................................................................................24
           Hires from MAAPP ........................................................................................................27
           Trend Data: Minorities from IHE ....................................................................................29
           New Hires by Gender ....................................................................................................29
           Maryland Approved Program Graduates by Gender ......................................................30
           Maryland Approved Alternative Preparation Program data by Gender ...........................31
           Conditionally-Certified Teachers ....................................................................................32
           Data Sources for Determining Shortages.......................................................................34
           Formula Process for Determining Shortage Areas .........................................................35
           Certification Areas by Extent of Staffing Need ...............................................................36
           Extent of Staffing Need by Certification Area .................................................................38

Part III: Geographic Areas of Projected Shortage ..................................................................39

Part IV: Non-Classroom Professionals .... …………………………………………………………..41
         Staffing Projections for Non-Classroom Professionals ...................................................41
         Supply of Non-Classroom Professionals ........................................................................42
         Non-Classroom Professionals by Extent of Staffing Need .............................................43
Part V: Recommendations to the Maryland State Board of Education ................................44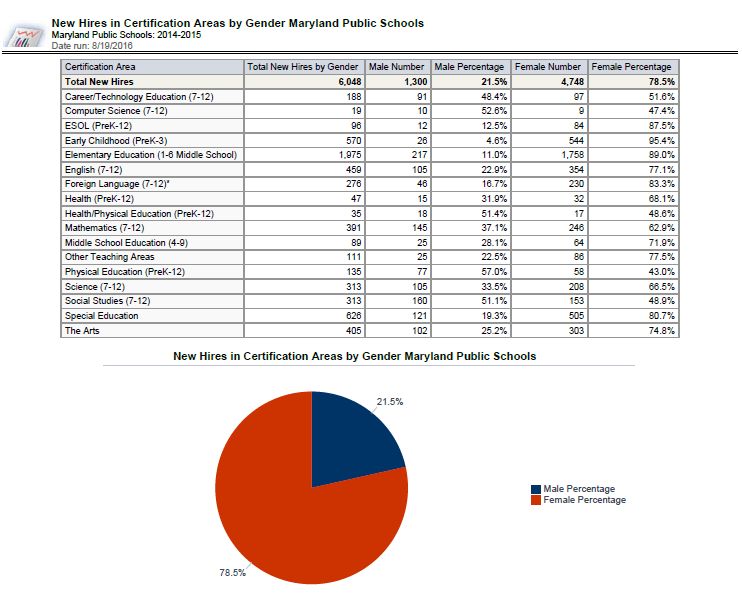
EXECUTIVE SUMMARY

        The Maryland State Department of Education (MSDE), in conjunction with local
school systems (LSS) and institutions of higher education (IHE), has conducted an
annual educator supply and demand study since 1986, the original purpose of which
was to determine critical teacher shortage areas. Although data are collected annually,
since 2008 the report has been published biennially. The latest Maryland Teacher
Staffing Report, 2016-2018, provides data on teacher candidates completing programs
at IHEs that have Maryland Approved Programs (MAP) and in Maryland Approved
Alternative Preparation Programs (MAAPP). The report also includes the hiring data
and projected needs of the LSSs. In addition, each data set includes demographic data
of the candidates. In 2015, at the direction of the Maryland State Board of Education
(hereafter, the State Board), the MSDE Division of Educator Effectiveness (DEE) which
produces this report, in collaboration with the Maryland Assessment Research Center
(MARC), adopted a revised formula for determining critical shortage areas.          This
formula provides an updated and simplified methodology for analyzing the data
referenced above and for applying that formula using the posted criteria. Analysis is
based on actual data rather than survey data, with the exception of LSSs’ projections of
need.

        The State Board, pursuant to HB 688, Workforce Shortage Student Assistance
Grants, Education Article §18-708, adopts the recommended list of critical shortage
teaching areas that then serves many purposes throughout the State.          This report
provides the basis for the Maryland Higher Education Commission (MHEC) to offer
scholarships to qualified individuals who want to become teachers if pursuing
certification in one of the critical shortage areas. The list also helps determine the
criteria for (1) deferment or forgiveness of student loan repayments for teachers who
teach in critical shortage areas; (2) access to grants from the federal Teacher Education
Assistance for Colleges and Higher Education (TEACH) Grant Program Act; and (3)
eligibility to participate in the Retire/Rehire Program in Maryland. The Retire/Rehire

                                           1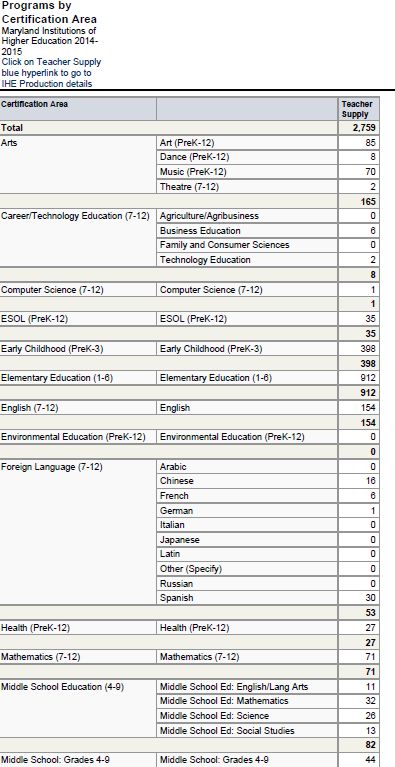
Program allows for LSSs to hire retired teachers, mentors or principals in select schools
in critical shortage areas.
       In addition, this report also provides information for IHEs, alternative preparation
programs, and LSSs as they recruit, prepare and hire teachers for Maryland’s schools.
Finally, each state must submit on a yearly basis the identified areas of critical teaching
shortage to the United States Department of Education (USDE), which annually
publishes Teacher Shortage Areas Nationwide.
       The scope of the Maryland report has expanded over the years, and now
includes:
    • Shortage areas for both teachers and select non-classroom professionals;
    • Enhanced information regarding traditional higher education as well as
       alternative preparation programs;
    • Demographic data for recent program completers;
    • Demographic data for new hires;
    • Geographic shortage areas;
    • Teacher attrition;
    • The number of retired/rehired teachers and principals as allowed for by law; and,
    • Incentives and strategies for the recruitment and retention of quality teachers and
       principals in Maryland public schools.

       The 2016-2017 list of shortage areas was published in the 2014-2016 Teacher
Staffing Report. As a result of the most currently-available data collection and analysis
from all relevant parties, the following recommendations pertaining to teacher shortage
areas for the 2017-2018 school year are made to the State Board:

       Recommendation 1: The Maryland State Board of Education declares the
       following content areas as critical shortage areas:

            •   Career and technology areas (7-12)
                   o Technology education
                   o Family and Consumer Sciences
            •   Computer science (7-12)

                                            2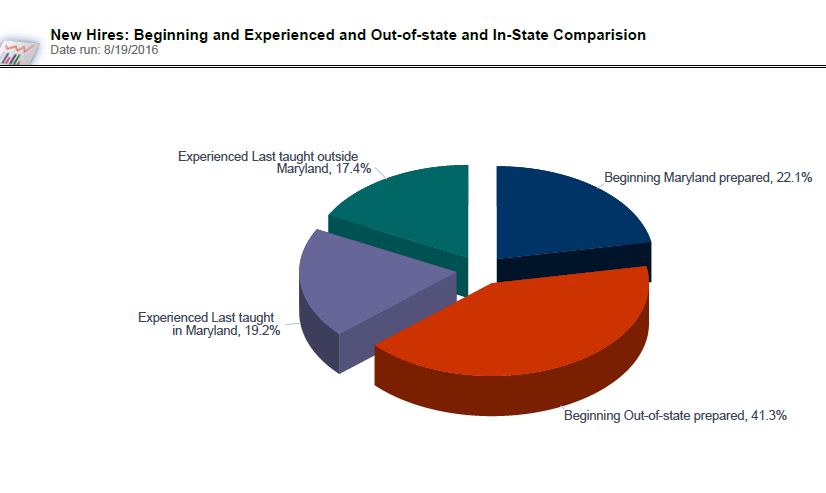
•   Business Education (7-12)
   •   English (7-12)
   •   English for Speakers of Other Languages (ESOL) (PreK-12)
   •   Mathematics (7-12)
   •   Middle School Education (4-9)
            o English/Language Arts
            o Mathematics
            o Science
            o Social Studies
   •   Science areas (7-12)
          o Biology
          o Chemistry
          o Earth/Space Science
          o Physical Science
          o Physics
   •   Special education areas
          o Generic: Infant/primary (birth-grade 3)
          o Generic: Elementary/middle school (grades 1-8)
          o Generic: Secondary/adult (grades 6 – adult)
          o Hearing impaired
          o Blind and Visually impaired
   •   World language areas (PreK-12)
          o French
          o Spanish
   •   The Arts:
          o Art (PreK-12)
          o Dance (PreK-12)

The above areas of certification will be reported to the USDE as Maryland’s
teaching areas of critical shortage for 2017-2018 in November 2016, with the
State Board adoption of this report.

                                   3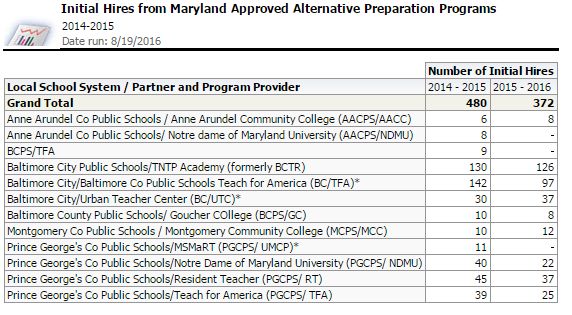
Recommendation 2: The Maryland State Board of Education declares the
      following twenty-four (24) Maryland jurisdictions as geographic areas of projected
      shortage of certified teachers:

         1. Allegany County                       13. Harford County
         2. Anne Arundel County                   14. Howard County
         3. Baltimore City                        15. Kent County
         4. Baltimore County                      16. Montgomery County
         5. Calvert County                        17. Prince George’s County
         6. Caroline County                       18. Queen Anne’s County
         7. Carroll County                        19. St. Mary’s County
         8. Cecil County                          20. Somerset County
         9. Charles County                        21. Talbot County
         10. Dorchester County                    22. Washington County
         11. Frederick County                     23. Wicomico County
         12. Garrett County                       24. Worcester County

      Recommendation 3: The Maryland State Board of Education declares a
      shortage of teachers who are males, and a shortage of teachers who are
      members of minority groups.

      Recommendation 4: The Maryland State Board of Education declares a
      shortage of the non-classroom professional positions of library/media specialist,
      school psychologist, and speech/language pathologist.

       MSDE, which has traditionally calculated new shortage areas every two years to
coincide with the publication of this report, will now calculate the shortage areas
annually rather than biennially. As a result of the analysis of the most current data,
MSDE will submit the above-listed shortage areas to the USDE for the 2017-2018
listing, and will continue to provide annually-calculated data in future years.

                                             4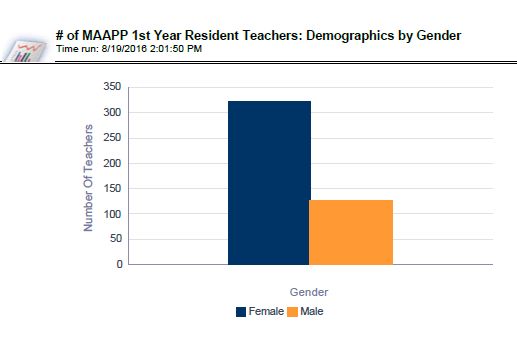
INTRODUCTION

       MSDE, in conjunction with LSSs, IHEs and MAAPPs, conducts an annual study
to determine critical teacher shortage areas. Although data are collected annually, the
report has been published biennially in The Maryland Teacher Staffing Report since
2008. In addition to publishing the content areas that are considered to be shortage
areas, the Maryland Teacher Staffing Report provides information on the number of
teacher candidates produced through traditional teacher preparation programs, MAPs,
and MAAPPs. Further, the actual and anticipated hiring needs of the 24 local school
systems are collected. This information addresses both the supply of new Maryland
teachers and the demand that local school systems expect in hiring. Beginning with the
current reporting cycle, MSDE will report, both to the State Board and to the USDE, an
annually-updated listing of shortage areas.
       The Maryland Teacher Staffing Report is now compatible with the digital age in
which we live. Race to the Top funding targeted toward the development of data
systems that support instruction, was allocated to MSDE to develop a series of
dashboards, the purpose of which was to create graphic representations of data
designed to make that data accessible, easy to read, and simple to understand, with a
minimum of explanation. The dashboard project makes available to the public a great
deal of data heretofore written into textual reports.

Background
       Legislation originally passed by the Maryland General Assembly in 1984 and
revised in 2006 requires the state to declare what teaching fields are designated as
critical shortage areas. This information is often used to award state grants and
scholarships to prospective teachers. The General Assembly unified several pieces of
legislation to include scholarships in many workforce areas.

                                              5
See § 18-708 Workforce Shortage Student Assistance Grants by copying and
pasting the following link into the browser: mhec.mayland.gov/Pages/default.aspx
This bill consolidated all state grants and scholarships across professions,
including teaching. In addition, SB 663: Retirement and Pensions – Reemployment
of Retirees uses the declared teacher shortage areas to exempt certain retired
educators from an earnings limitation if they are reemployed in one of the critical
shortage areas and/or in qualifying schools. This law also includes principals and
mentors.
The USDE annually publishes the Teacher Shortage Areas Nationwide, and
allows certain students who teach in critical shortage areas to qualify for deferment of
loan repayment and/or loan forgiveness. Maryland contributes its findings each year to
this publication.
In 2007, Congress passed the TEACH Grant Program. This law continues to
provide grants of up to $4,000 per year to students who intend to teach in a public or
private elementary or secondary school in a state’s critical teacher shortage areas.
Summary and Overview
The procedures for determining teacher shortage areas were established and
documented to ensure systematic replication in state reports of teacher staffing as well
as formative review for ongoing improvements to the report. Further, the information
contained in this report helps to provide a picture of supply and demand along with
actual hiring data that is helpful in planning at almost every level in Maryland public
schools, colleges and universities, and in alternative preparation programs.
Most data tables are now displayed on dashboards to which the report will
provide a link. One of several tables included in this report is Incentives and
Strategies for the Recruitment and Retention of Quality Teachers and Principals.
This information is not represented on a dashboard. All data gathered for this report is
6posted on the MSDE website or the MHEC website. Data supporting this report is
gathered annually but published only biennially; hence, the website data will be
accurate and current during the off years of publication. Sections of this report that
cover staffing patterns, geographic areas of projected shortage, Maryland-prepared
teachers, minority and gender data, and hiring data on select non-classroom
professionals are also represented on dashboards. Finally, this report includes the
recommendations to the State Board which provides information for IHEs, MAAPPs,
and LSSs as they recruit, educate and hire future teachers for Maryland’s schools.
Part I: INCENTIVES AND STRATEGIES FOR THE RECRUITMENT
AND RETENTION OF QUALITY TEACHERS AND PRINCIPALS
Historically, Maryland has had a shortage of qualified teachers in certain content
areas. Maryland has long been an import state, hiring a significant number of teachers
prepared in other states. Early-career attrition, flat teacher preparation program
completion rates, and teacher retirements all contribute to shortages. Maryland has
instituted state scholarships in all workforce shortage areas including those in
education, and has implemented certain strategies to attract and retain teachers. The
federal government also has several programs, such as the TEACH Act, loan deferment
and loan forgiveness programs, and Troops to Teachers (TTT) to attract retiring military
personnel into second careers as teachers. An overview of select incentives and
strategies with websites for obtaining the most current information is provided below.
NATIONAL AND FEDERAL INITIATIVES
TEACH Grant Program
Congress created the TEACH Grant Program to provide grants of up to $4,000
per year to students who intend to teach in a public or private elementary or secondary
school that serves students from low-income families. Areas of need in the law
are: bilingual education and English language acquisition; foreign languages;
mathematics; reading specialist; science; and special education, as well as any other
field that has been identified as high-need by the federal government, a state
7government, or a local education agency and that is included in the USDE’s annual
Teacher Shortage Area Nationwide Listing (Nationwide List). To be eligible for a
TEACH grant, candidates must meet certain criteria. Information is available through
financial aid offices at participating institutions and the USDE website at:
http://www.ed.gov/index.html.
Federal Student Aid and Loan Forgiveness Programs
The federal government supports loan programs for students who wish to attend
college. The amount of funding for these programs varies from year to year. Current
information is located at the federal loan site: http://www.FederalStudentAid.ed.gov.
The federal government also has several discharge or loan forgiveness programs
connected to federal loans for teachers. The programs include deferment for borrowers
under the Family Federal Education Loan (FFEL); Federal Supplemental Loans for
Students programs; debt incurred under the Federal Perkins Loan Program; reduction
of teaching obligation under the Paul Douglas Teacher Scholarships Program; and the
teaching obligation for recipients of the TEACH Grant Program. Details and
applications are available on the FFEL website.
Troops to Teachers
In 1994, the Department of Defense, in cooperation with the Department of
Education, established the Troops to Teachers (TTT) Program. The program assists
military personnel in making successful transitions to new careers in teaching. For
information call 1-866-251-3123 or go to the website, www.proudtoserveagain.com.
The Veterans Full Employment Act of 2013 is also implemented by MSDE. MSDE
requires educators in Maryland Public Schools and in Non-Public Special Education
Schools under COMAR 13A.09.10 to hold a valid teaching certificate. DEE holds the
authority to issue those credentials as individuals complete requirements. Maryland
implemented the Act effective July 1, 2013, by expediting credentialing for U.S. Armed
8Forces service members and their spouses seeking employment as educators in these
entities. For detailed information, visit
http://test.msde.maryland.gov/about/Pages/DEE/Certification/Veterans.aspx
STATE INITIATIVES
Workforce Shortage Funding Assistance
There are a number of stipends, awards, and scholarship opportunities available for
potential and continuing teachers. Information can be found on the MHEC website
which administers funding. Visit the link below by copying and pasting into the browser.
Information is readily found under the heading Financial Aid Resources.
mhec.mayland.gov/Pages/default.aspx
State Tax Credits
Maryland classroom teachers enrolled in college courses are eligible for an
annual $1,500 tuition tax credit on their Maryland income tax returns, designed to offset
graduate tuition expenses necessary to achieve or maintain advanced teacher
certification. To receive the credit, the teacher must successfully complete the courses
with a grade of B or better, be employed by a LSS, have a satisfactory performance
evaluation, and not have been reimbursed by the LSS for the tuition paid. Check the
Annotated Code of Maryland Tax-General Article §10-717 at the website:
http://taxes.marylandtaxes.com/Individual_Taxes/General_Information/Tax_Credits_and
_Deductions/Quality_Teacher_Incentive_Credit.shtml
Resident Teacher Certificate
The Resident Teacher Certificate (RTC) is designed to attract and recruit into
teaching recent college graduates as well as career changers who possess academic
content backgrounds in the arts and sciences, but who did not complete teacher
preparation programs. All programs that use the RTC are state-approved teacher
preparation programs and operate under the authority of the DEE at MSDE.
These programs may be in partnership between a LSS and a program provider,
or the LSS may act as its own provider and develop its own program. Each
9program undergoes cyclical state program approval including onsite peer review
that includes representatives from IHEs, both two- and four-year, LSSs, and
other MAAPPs. For additional information, visit the MSDE home page, DEE,
Program Approval where information relevant to Maryland’s alternative pathways
can be found.
MAAPPs have their own set of dashboards as well. For a detailed look at
alternative programs and their candidates, visit Dashboards Portal. In the upper left, click
on P12LDS, and choose P12LDS HOME from the pull-down menu. Click on View all
Dashboards (right side of page), click on MAAPP.
National Board for Professional Teaching Standards
The National Board for Professional Teaching Standards (NBPTS) is an
independent, non-profit, non-partisan organization established in 1987. It was
established to improve student learning in America’s schools by developing a system of
advanced, voluntary certification for teachers. NBPTS has established rigorous
standards and a performance-based certification system to recognize quality teaching.
Certification is achieved through a performance-based assessment that typically takes
more than a year to complete. It is designed to measure what accomplished teachers
should know and be able to do. The process for becoming a Nationally Board Certified
Teacher (NBCT) requires teachers to demonstrate how their activities, both inside and
outside the classroom, strengthen student performance and contribute to student
achievement. The certification process is open to anyone with a baccalaureate degree
who holds a current and valid Maryland certificate and has completed three years of
classroom experience. The certificate is valid for 10 years, after which a teacher may
seek renewal. Maryland is proud that it has 2,785 NBCTs.
As of July 1, 2016, classroom teachers and other non-administrative, school-
based employees who hold National Board Certification and work in a comprehensive
needs school will be eligible to receive a stipend up to $2,000. Classroom teachers and
other non-administrative school based employees who hold National Board Certification
and work in a non-comprehensive needs school are eligible to receive a stipend up to
$1,000.00. It should be noted that LSSs can implement more stringent standards. As
10of July 1, 2017, the stipend will increase to $4,000.00 for classroom teachers and other
non-administrative school based employees who hold National Board Certification and
work in a comprehensive needs school. For more information, visit the link below.
Teachers of Promise
The Teachers of Promise mentoring program, underwritten by the Maryland
Independent Colleges and Universities Association, Comcast, the Maryland State
Education Association, Smart Technologies, and State Farm Insurance, began as an
outgrowth of the Maryland Teacher of the Year Program. It capitalizes on the expertise
of Teachers of the Year and other award-winning teachers by matching them with the
most promising pre-service graduating seniors from Maryland colleges and universities.
This program is designed to provide these promising candidates with support as they
transition from the role of student to the new role of teacher. Mentoring begins in the
candidates’ senior year and continues through summer and fall placement in Maryland
schools, creating a transitional mentoring program for beginning teachers. Research
suggests that teacher mentors assigned to work with new teachers can be crucial in
encouraging them to remain in the field. The Teachers of Promise Program has
developed powerful partnerships among MSDE, corporations, and IHEs, that together
enhance the chances of success and confidence for so many of our new teachers. The
program is now in its 11th year and works with 21 Maryland colleges and universities.
Retire/Rehire Program
In 1999, the Maryland General Assembly passed a bill which exempted certain
retired teachers and principals from an earnings limitation of their Maryland pension,
provided they are re-employed as classroom teachers, substitute teachers, teacher
mentors or principals. The revision in 2005 was SB 663: Retirement and Pensions -
Reemployment of Retirees, and is aimed at rehiring teachers to work in specific schools
and teach in critical shortage content areas.
11These retired rehires represent experienced teachers or principals or others who
qualify and are placed in the lowest performing schools in critical teacher shortage
areas or in positions that qualify. The 2015-2016 report follows:
Individuals by Local School System Participating in the Retire/Rehire Program
Maryland State Department of Education
SB663 Retirement and Pension - Reemployment of Retirees 2015-2016
Date of
Position Annual Qualifying Critical Re-
Title Salary Name of School School Subject Employ.
BALTIMORE CITY PUBLIC SCHOOLS
James McHenry Critical
Elementary/Middle Shortage Special
1 Teacher 76,862 School Area Education 9/19/2015
DORCHESTER COUNTY PUBLIC SCHOOLS
Social New Directions Alternative
2 Worker 77,700 Learning Academy Education Social Work 10/20/2014
FREDERICK COUNTY PUBLIC SCHOOLS
Critical
Shortage
3 Teacher 29,514 Catoctin High School Area Mathematics 1/28/2016
HARFORD COUNTY PUBLIC SCHOOLS
Critical
Aberdeen Middle Shortage Special
4 Teacher 66,410 School Area Education 8/20/2015
KENT COUNTY PUBLIC SCHOOLS
Title I
5 Coordinator 88,629 County-wide Critical Need Title I 7/1/2015
PRINCE GEORGE'S COUNTY PUBLIC SCHOOLS
Princeton Elementary Special
6 Teacher 95,976 School Title I Education 8/17/2015
G. James Gholson
7 Teacher 72,906 Middle School Title I Mathematics 8/17/2015
Critical
Fort Washington Shortage
8 Teacher 45,704.50 Elementary School Area ESOL 8/17/2015
Critical
James Duckworth Shortage Special
9 Teacher 38,390.40 School Area Education 9/9/2015
Critical
Shortage
10 Teacher 74,817.76 DuVal High School Area Mathematics 8/17/2015
Berwyn Heights
11 Teacher 43,527.50 Elementary School FARM ESOL 8/17/2015
12ST. MARY’S COUNTY PUBLIC SCHOOLS
School 62,993 Green Holly Title I 10/20/2014
12 Nurse Elementary School
Director of 118,676 Central Office Allowable 7/2/2007
Special one of five
13 Education
Bus Driver Department of Allowable two
14 Trainer 43,075 Transportation of five 9/6/2010
Critical
Shortage
15 Teacher 80,505 Various Sites Area ESOL 8/19/2009
Critical
Benjamin Banneker Shortage Special
16 Teacher 75,862 Elementary School Area Education 9/22/2009
Chopticon High Allowable
17 Principal 133,571 School three of five 7/1/2008
Chopticon High Allowable
18 Teacher 43,141.50 School four of five Latin 8/19/2005
WICOMICO COUNTY PUBLIC SCHOOLS
Special
19 Teacher 55,461 Wicomico High School FARM Education 8/25/2015
Special
20 Teacher 55,461 Wicomico High School FARM Education 8/25/2015
Speech Speech
21 Therapist 85,652 Wicomico High School FARM Education 8/25/2015
Special
22 Teacher 55,461 Wicomico High School FARM Therapist 8/25/2015
Special
23 Teacher 55,461 Wicomico High School FARM Education 8/25/2015
Revised 8/18/2016
13Summary Report of Retire/Rehire Program
Maryland State Department of Education
Report for 2015 – 2016
Dorchester
St. Mary’s
Wicomico
Baltimore
Frederick
George’s
TOTALS
Harford
Prince
Kent
Total # Rehires
Teachers 1 1 1 1 6 3 4 17
Speech Pathologist 1 1
Principals 1 1
Counselor or other 1 1 3 1 5
specialized area
Total 1 1 1 1 6 7 6 23
Condition of Rehire
Title I 2 1 3
Alternative Education 1 1
Exemption* 1 4 5
FARM 1 5 6
Critical Shortage Area 1 1 1 3 2 8
Total 1 1 1 1 1 6 7 5 23
Content Areas
Biology
ESOL 2 1 3
Earth Science
Latin
Mathematics 1 2 1 1
Psychology*
Physical Science
Spanish
Special Education 1 1 2 1 3 8
Total Retire/Rehire 1 1 1 1 1 6 7 5 23
*Exceptions: The law allows a minimum of five exemptions per system, or 0.2% of the total full-time
equivalent teachers, not to exceed 15 per school system. The exemptions may be either a regular school
or a non-critical content area.
Data provided to Maryland State Retirement and Pension System (MSRP) and MSDE by the local school
systems, 2015-2016 school year.
Comprehensive Teacher Induction Program
In response to the Maryland General Assembly, which passed a law requiring
mentoring programs, COMAR 13A.07.01 Comprehensive Teacher Induction
Program was adopted by the State Board on April 27, 2010. This law provides greater
14consistency in the quality of support provided to new teachers throughout the state and
it also provides training for mentors. The policy requires each local school district to
“establish and maintain a comprehensive induction program for all new teachers” “until
they receive tenure.” The regulations referenced below provide detail.
13A.07.01.03; 13A.07.01.04; and 13A.07.01.05.
State regulations also require LSSs to provide a comprehensive induction
program report to MSDE. The report must include a description of the mentoring
program; data, including the number of teachers using a conditional certificate and the
number of mentors who have been assigned; and, how effectiveness of the program is
measured. In summary, various incentives and strategies have been implemented in an
effort to recruit and retain quality teachers and principals. The strategies have been
implemented to attract and retain teachers for public school classrooms. This report
makes no effort to assign causality to improved early retention rates as mentioned
above, but MSDE’s efforts through the programs mentioned here will continue, as will
data tracking in the search of continuous and ongoing improvement.
Part II: STAFFING PATTERNS
This section presents information on the number of new hires by Maryland LSS,
by certification area. Included also is the methodology for determining teacher shortage
areas; certification areas by extent of staffing need; trend data; and teacher experience
and attrition. It is also in this section where the report moves into the digital age and
derives its data from the dashboards. The Dashboards Portal (“control” + click) will take
the reader to the Teacher Supply dashboard. To view all of the dashboards available,
go to the upper left and click on P12LDS Home, choose P12LDSHOME from the pull-
down menu, then choose View all Dashboards, found on the right of the page. All
available dashboards are displayed here.
MSDE is dependent upon IHEs and LSSs for accuracy. All data are validated
and triangulated for accuracy through collaboration between DEE and the Division of
Curriculum, Assessment and Accountability (DCAA).
15From the Teacher Supply dashboard, click on Teacher Supply, Multimedia. This
tutorial provides a preview of the dashboards and some suggestions for interpreting
data. In addition to the preview, below is a listing of the tabs included on the dashboard.
While not all tabs are included in the preview, all are visible from the main page of the
Teacher Supply dashboard in a list found on the right side of the page. They are
presented in the order in which each tab appears on the dashboard and, consequently,
in this part of the report.
Teacher Supply Dashboards
Home
Overview
New Hires by Certification Area
New Hires: Transferred from LSS to LSS
New Hires by LSS
New Hires Trends
Teachers by Years of Experience
Teacher Attrition
Supply from MAP by Certification
Projected Candidates by MAP
Graduates by IHE
Hires from MAAPP
Trend Data : Minorities from IHE
Minority New Hires by Certification
Trend Data: Minority New Hires
New Hires by Gender
MAP Graduates by Gender
DEE suggests that the user open the dashboard as directed above, and leave it
open on the computer, toggling back and forth between the Word document, Teacher
Staffing Report, and the dashboard Teacher Supply. (Each document is, in all
likelihood, at the bottom of the computer screen.) Each of the tabs on the dashboard
has comments and in some cases possible interpretation of the data. Again, to get
started, (the link is Dashboards Portal ), begin with New Hires. In order to assure
accessibility of the information even if, for any reason, technology is not available, many
16data tables are also presented as screen shots in this report.
New Hires
Actual New Hires by Certification Area reports the number of new hires
between October 2013 and October 2014. This closing date (2014) reflects the first of
the years reported on the dashboard. In other words, while the data reflect collection
between the above two dates, they are reflected on the dashboards as 2014-2015.
New hires are categorized as beginning or experienced, Maryland prepared or out-of-
state prepared, and by the certification area for which they were hired. During this
period, there were 6,048 new hires, an increase of 536 new hires over 2013-2014, or
about 9%. This is a predictable and reasonable increase considering that PreK-12
student population rose at almost the same rate during the same time period, from
866,169 to 874,514. Occasionally there are anomalies in hiring that show up as spikes
for a particular year, which did occur between 2011-2012 and 2012-2013 when there
was a 17% hiring increase that was unanticipated and not projected by LSSs, while at
the same time the statewide student population rose only about 1%. Both the rates of
PreK-12 student population growth and the rate of new teacher hires have remained
fairly static since this time. The dashboard offers five years of data for a more extensive
review of hiring.
1718
The next dashboard tab displays data on teachers who move from school system
to school system, known as “within-state” movement of teachers.          Teachers who
change jobs within the state are reported as “new” by their school systems, although
they are not new to teaching in Maryland. Since including this movement of teachers
from system to system skews the number of new hires, these teachers are extracted
from the totals. The Number of New Hires Who Transferred from Local School
System to Local School System displays the number of teachers from each “sending”
and each “receiving” school system. The chart lists which school systems are hiring
from other in-state systems and which systems are losing teachers to other in-state
systems. Attention to the within-state new hiring data is important for understanding the

                                           19
teacher shortage issue. The impact of what is viewed as the teacher shortage areas is
mitigated by within-state movement, which is analyzed only rarely as a component of
new hire data. The number of teachers who moved within the state during 2014-2015
was 557, or about 9% of the new hires. No screen shot is provided for this table, so it is
important to select the appropriate year, in this case 2014-2015, when looking at the
dashboards.
New Hire Trends shows the number of new hires for the past five years prepared
in Maryland and prepared outside of Maryland. Maryland has traditionally been a state
that imports more new teachers than it prepares; however, the rate of those prepared
outside of Maryland, both new to teaching and experienced, has risen to 59% in this
data cycle, leaving 41% of new hires actually prepared in Maryland as illustrated by the
pie chart below.
20Teachers by Years of Experience displays the total number of teachers by LSS
and the years of experience of those teachers. (It is important to select the year for
Teachers by Years of Experience.) Comparison of three years of data reveals no
significant changes in the levels of experience of teachers in Maryland Public Schools.
The screen shot below shows the data from 2014-2015, (note that the collection is
between October 2013 and October 2014).
21Once having selected the appropriate year, the user finds information regarding
when teachers left the classroom by LSS in 2014-2015 under Teacher Attrition. The
three-year comparison available on the dashboard shows no marked increases or
decreases either in the rate of attrition or the number of years in the teachers’ career
when separation occurred. No screen shot is available for this dashboard.
Not only is it critical to capture LSS hiring needs, but also the production of
teachers by providers of preparation programs in Maryland. The next chart, Supply
from MAP by Certification Area, shows the number of individuals who completed
college or university programs in 2014-2015 by certification areas, as the title suggests.
It should be noted that not all who complete programs actually seek Maryland
certification. (Clicking on the blue hyperlink in the table reveals the results from
individual IHE.) As has been the case for a number of years, both production and the
areas in which program completers are being certified have remained relatively flat.
Again, multiple years are available on the dashboard. For this table, 2014-2015
represents an academic year beginning in September and ending in August.
2223
IHEs are also asked to project their production of teachers for a two-year period
following the current hiring year which is 2015-2016. The next chart, Projected
Candidates by MAP, follows the same format as the one above. In this chart, if the
user selects 2014-2015, the two projected years are academic years 2016-2017 and
2017-2018.   It should be noted that, although students may be in the pipeline to
complete a program at a specified time, many factors (economic, academic, life
situations, etc.) can influence a delay in completion, including the decision not to
complete at all. The chart begins on the next page.

                                          24
25
.

     The next chart breaks down the numbers of candidates who complete programs
by IHE, by year. The chart below shows those data for academic year 2014-2015.
Multiple years are available on the dashboard.

                                          26
In addition to college and university traditional teacher preparation programs,
Maryland has a robust and rigorous alternative route to certification that utilizes the
Resident Teacher Certificate, as described earlier in this report. The data collection for
MAAPPs is web-based, meaning that whenever a user submits new data, it is reflected
immediately on the dashboard. The user will also note that a number of years of
historical data can be found. This dashboard is called Hires from MAAPP. All MAAPP
resident teachers represent new hires in the chart of new hires found on page 18 of this
27report since candidates are accepted into a program only if the sponsoring LSS projects
a need in a particular certification area and if the candidate is successful in the
preparation program. Again, for complete data on MAAPPs, please visit the MAAPP
dashboard.
The chart below shows the number of teachers hired in 2014-2015 who received
initial certification, the Resident Teacher Certificate, through MAAPP. It should be
noted that, of the 1049 inexperienced, new teachers hired in Maryland in 2014-2015,
480 (46%) were hired as Resident Teachers through MAAPPs. Because MAAPP data
collection is live, MSDE is able to report that there are 372 Resident Teachers serving
as teachers of record in 2016-2017. As revealed by the chart below and on the
dashboards, MAAPPs are located exclusively in the central, highly populated LSSs in
the state, offering no relief for smaller, but no less critical, needs for using alterative
pathways outside the central Maryland region. MSDE is currently reaching out to both
the Western and Eastern Shore LSS to discuss possible cost-effective expansion of this
opportunity.
28Research indicates that it is an advantage to students to have instructors who
reflect to as great an extent as possible the demographic population of the school
setting. IHEs are held accountable for not only the recruitment of a diverse population
of teacher candidates, but providing them with the experiences necessary to teach a
widely diverse population of children. The next dashboard shows the number and
percentage of minority program completers from MAPs over a four-year period. On the
dashboard, click on the blue hyperlinks to see the results by individual IHE. This
dashboard is titled Trend Data: Minorities from IHE. In 2008-2009, minorities
represented 21.3% of program completers followed by several years of reduced
minority participation. Minority representation in the current completing class shows a
gradual increase from 16.9% in 2011-2012 to 19.6% in 2014-2015.
Demographic data for MAAPPs often show a higher number of participants from
minority groups than traditional preparation programs. Detailed information regarding
MAAPPs can be found on the MAAPP dashboard. The most recent data are from
2013-2014 reflecting about 50% minority hiring through MAAPPs. (Click on View All
Dashboards and select MAAPP for more years of data).
The next dashboard, Minority New Hires by Certification, offers additional
information about the minority demographic in hiring. Four years of data are shown on
the dashboards which illustrate a breakdown by general areas of certification as well as
that same breakdown by each IHE. Screen shots are not available for these data.
Just as the minority status of supply and demand is tracked, so is the gender of
those prepared and hired in Maryland. The next dashboard, New Hires by Gender,
shows the results.
29Even though the male population of new hires is significantly smaller in all areas
of certification, the gap is even wider in the areas of ESOL, Early Childhood Education,
Elementary Education, World Languages, and Special Education where males make up
20% or less of the new hires.
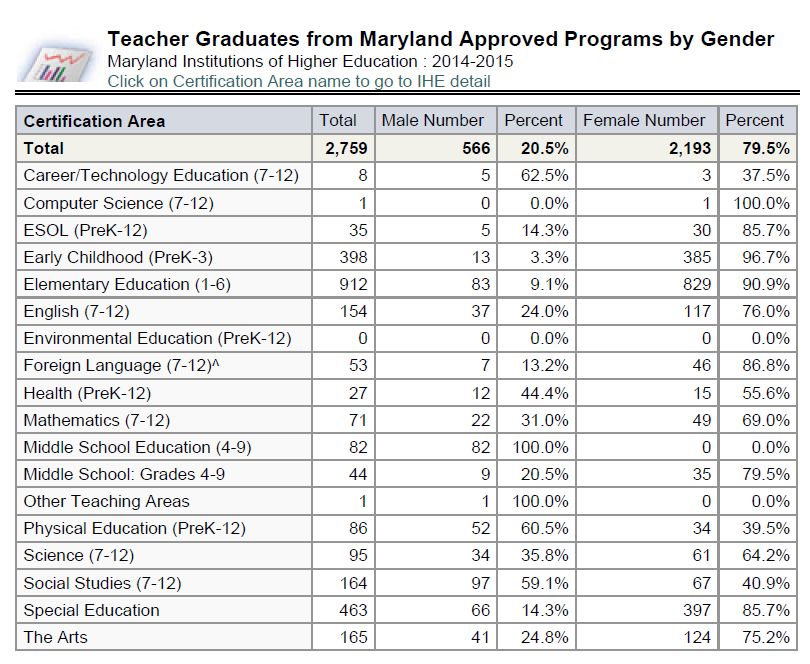
The final dashboard supplies the production side of the equation for program
completers by gender. It is MAP graduates by Gender.
30Production data nearly mirrors that of hiring data in the certification areas where males
make up 20% or less of the completers.
It should be noted, when attempting to make comparisons between traditional and
alternative programs in the discussion of minority and gender participation, that there
are career changers participating in MAAPPs. A number of Resident Teachers,
therefore, already had successful careers and often are not in search of the financial
rewards that opportunities outside of education may afford, but see teaching as a way of
“giving back” to the community. There are significant differences between the young
college graduate and the more mature career changer which may be reflected in these
data. The bar chart below reflects 2013-2014 data from MAAPP. Comparison data
from other years can be found on the MAAPP dashboard.
31Conditional Teachers
The chart on the next page reflects a two-year comparison of the total number of
conditionally certified teachers by local school system. Newly Hired Maryland
Teachers with Conditional Certificates reports the total number of newly hired
teachers in 2014-2015 and 2015-2016 holding Conditional Certificates.
3233
Data Sources Used to Determine Shortage Areas
        In 2014, the State Board directed DEE to update its method of calculating teaching
shortage areas to ensure that, wherever possible, actual rather than survey data support
the basis for such calculations. DEE worked in partnership with the Maryland Assessment
Research Center (MARC) to develop a revised formula. Data used for this report are
provided by DCAA which annually collects data from LSS, as well as from colleges and
universities, MAAPP providers, and both LSS and IHEs reporting directly to DEE.
        The calculation of shortage areas of certification for the state is based on a regression
analysis of hiring vs. production data using as many years of available data as possible.
The resulting number and percentage of supply versus demand for each certification area
is then related to the current LSS’s projections of need. Five years of comparable data
were available for this report.
        In addition, DEE surveys the human resources directors in each of the LSSs in late
August to provide a view of school staffing for the opening of school. The survey requests
remaining vacancies, and continuing recruitment difficulties. These surveys from each LSS
provide the most current available information at the point of the opening of schools each
fall.     These data, however, are not gathered uniformly across the state with specific
vacancies in specific areas of shortage.            The surveys provide snapshots of existing
vacancies, but are not considered as part of the calculated data. This is not to minimize the
importance of the surveys, but in fact, function in quite the opposite manner. In addition to
providing further support for the identification of easily-recognized areas of teacher
shortage, they also capture shortages of individuals with the abilities and skills, as well as
credentials, to teach carpentry, the Allied Health programs, or nanotechnology, for
example, that the previous data documents do not collect. This will be discussed more fully
in the section Certification Areas by Extent of Staffing Need.

                                               34
Formula Process for Determining Shortage Areas
1. Add hiring data by certification area for as many years as available. Add IHE production
data by certification area for as many years as data are available for hiring. The sum of
the hiring data becomes the numerator; the sum of the production data becomes the
denominator. Divide the fraction/ratio by number of years available.
2. Subtract the resulting denominator from the projected current need. Extract the % of
shortage.
Equation
Percentage of Shortage = Current year need – supply quotient of the
sum of available years of hiring data # of years of hiring data
________________________________ \ _________________ \ current year need
sum of equal # of available years of supply data # of years of supply data
Rubric for Determining Critical Shortage Content Areas
2016-2018
Objective: To determine the State’s critical shortage areas using the following rubric.
The rubric provides a score for each content area. The percentages are derived from a
five-year regression model that utilizes production data from Maryland colleges and
universities, as well as both actual hiring numbers and projection estimates from all
Maryland local school systems by certification area. Hiring data include in-state, out-of-
state, and those prepared through Maryland Approved Alternative Preparation Programs.
This regression model was developed in partnership with the Maryland Assessment
Research Center located at the University of Maryland, College Park. Detailed calculation
sheets and rubric determinations are available in the Division of Educator Effectiveness,
Maryland State Department of Education.
Content Area: ____ ______________
Statewide Statewide Statewide Statewide Total
Critical Shortage Balance Oversupply
Shortage
Criteria 4 points 3 points 2 points 1 point
1. State 70 % – 100% 30% - 70% 0% to 30% Supply is
projection shortage: shortage: shortage: greater than
formula 100% that of
projected need.
2. Projected Need is 10 or Need is 10 or Need is 10 or No need is
Need more in number: fewer in fewer in number: reported.
number:
35For all content areas, use the following scale:
_____ 7-8 points, statewide critical shortage area
_____ 5-6 points, statewide shortage area, but not critical
_____ 3-4 points, content area is in state balance.
_____ 0-2 points, content is an area of oversupply
DECISION:____________________
Certification Areas by Extent of Staffing Need
The critical shortage areas identified are valid for a one-year period, 2017-2018.
Although the report is produced biennially, critical shortage areas will be calculated and
reported for 2018-2019 in September 2017. The results for 2017-2018 are displayed
below. They have been categorized into Shortage, Critical Shortage, Balanced and
Surplus.
DEE added the Shortage category with this report to reflect growing needs across
the state which may be fewer than ten in number, in areas not represented through
traditional supply and demand data collection, and to highlight those areas of shortage
which do not quite rise to the level of critical. Many LSSs report acute difficulties in
recruiting for Professional Technical Education areas of instruction, such as culinary arts,
nursing, cosmetology, TV production, carpentry, Homeland Security, engineering, masonry,
and auto mechanics. In addition, there are expressed needs for part-time instructors in
specialized sub-content areas such as nanotechnology and other high-level mathematics
and science subjects and in such areas as American Sign Language. 60% of LSSs report
growing need for Speech/Language Pathologists, a field which does not require
certification, but licensure. Pupil Personnel Workers appear to be in short supply for many
LSS, as well, and nearly all LSS report difficulty in recruiting minority candidates for their
classrooms.
Elementary education is reflected for the first time in many years as an area of slight
shortage, and biology returned to the critical shortage list, joining all other areas of
secondary science.
36It is always important to understand that, in a report that garners its data from
statewide supply and demand sources and uses that data to provide a statewide snapshot,
some LSS will report an oversupply of teachers in certain areas while others have
continued difficulty recruiting in the same area. In addition, it should be noted that,
although IHEs produced 2,759 program completers eligible for Maryland certification, there
are no data on how many actually sought that certification, nor how many who did seek
certification also sought employment in Maryland. There are also no data on those who
became certified, and subsequently hired, through transcript analysis. Subtracting the 447
teachers hired as Resident Teachers from the total 1,049 Maryland-prepared inexperienced
new teachers, data suggest that, at best, only 602 of the total 2,759 prepared in Maryland
IHEs were actually hired in Maryland public schools in the period between October 2013
and October 2014, reflected in this report as 2014-2015.
37Extent of Staffing Need September 2016
Category Shortage Critical Balanced Surplus
Shortage
Certification Area
The Arts
Art (PreK-12) X
Dance (Pre-K-12) X
Music (PreK-12) X
Theatre (PreK-12) X
Career/Technology Education (7-12)
Agriculture X
Business Education X
Family and Consumer Sciences X
Technology Education X
Computer Science (7-12) X
Early Childhood (PreK-3) X
Elementary Education (1-6) X
English X
ESOL (PreK-12) X
Foreign Language (7-12)
Arabic X
Chinese X
French X
German X
Italian X
Latin X
Japanese X
Russian X
Spanish X
Health/Physical Education (PreK-12) X
Mathematics X
Science (7-12)
Biology X
Chemistry X
Earth/Space Science X
Physical Science X
Physics X
Social Studies (7-12) X
Special Education
Generic: Infant/primary (Birth-grade 3) X
Generic: Elementary/Middle (1-8) X
Generic: Secondary/Adult (6-adult) X
Hearing Impaired X
Severely and Profoundly Disabled X
Visually Impaired X
Revised 9/1/2016
38GEOGRAPHIC AREAS OF PROJECTED SHORTAGE
Maryland legislation enacted in 1986 (Annotated Code of Maryland, Education
Article §18-703) required the State Board to annually identify geographic areas of
teacher shortages. The intent of the legislation was to assist LSSs affected by
geographical conditions that make the recruitment and retention of qualified teachers
difficult. However, when the scholarship incentive to teach in a declared area of
geographic shortage was repealed, MSDE made the decision to continue to collect this
information for some federal loan forgiveness programs that use geographic shortage
areas.
Procedures
To determine the areas of geographic shortage, the procedures outlined below
were followed. The State Board must have identified content areas as critical shortages
for at least three years. Those areas identified as critical shortage areas for at least
three years for this report are computer science, technology education, ESOL,
mathematics, chemistry, earth space science, physical science, physics, and most
areas of special education. Each local school superintendent was surveyed to
determine if he/she was able to satisfy the need for teachers in any of the above
identified critical shortage areas and was asked to respond to two questions:
1. Did your local school system experience a critical shortage of teachers
in any of the following state identified critical shortage areas: computer
science, technology education, ESOL, mathematics, chemistry, earth
space science, physical science, physics, as well as all areas of
special education?
2. If yes, do you wish to have your local school system declared an area
of geographic shortage?
Each local school system superintendent must agree to have his or her system
designated as an area of geographic shortage, based on the above information.
39Findings: All LSSs have requested designation as areas of geographic shortage.
1. Allegany County 13. Harford County
2. Anne Arundel County 14. Howard County
3. Baltimore City 15. Kent County
4. Baltimore County 16. Montgomery County
5. Calvert County 17. Prince George’s County
6. Caroline County 18. Queen Anne’s County
7. Carroll County 19. St. Mary’s County
8. Cecil County 20. Somerset County
9. Charles County 21. Talbot County
10. Dorchester County 22. Washington County
11. Frederick County 23. Wicomico County
12. Garrett County 24. Worcester County
40You can also read