BARRIERS TO EXPANSION OF NC PRE-K: PROBLEMS AND POTENTIAL SOLUTIONS - BY W. STEVEN BARNETT, PHD, WITH ASSISTANCE FROM RICHARD KASMIN, NIEER ...
←
→
Page content transcription
If your browser does not render page correctly, please read the page content below

Barriers to Expansion of NC Pre-K:
Problems and Potential Solutions
By W. Steven Barnett, PhD, with assistance from Richard Kasmin, NIEER
© 2018 The National Institute for Early Education Research

Barriers to Expansion of NC Pre-K:
    Problems and Potential Solutions

    Acknowledgements
    The opinions expressed in this report are solely those of the author. This report was supported with funding from
    PNC Financial Services and technical support by SAS Institute. The findings, interpretations, and conclusions are solely
    those of the author.

    This report is a product of the National Institute for Early Education Research (NIEER), a unit of the Graduate School of
    Education at Rutgers, The State University of New Jersey.

    Founded in 2002, NIEER improves children’s lives by promoting early learning and development through research
    informing effective, evidence-based policy. For more information, visit www.nieer.org or contact NIEER at
    848-932-4350.

2
Executive Summary
With recent increases in state funding, North Carolina’s high-quality pre-kindergarten program (NC Pre-K) is
approaching enrollment of almost half (47%) of eligible children, representing about one in four of all 4-year-olds in
the state. Yet, almost 33,000 children who are income-eligible for NC Pre-K (53%) still lack access to the program.

The demand and need for NC Pre-K, along with barriers to expansion, are best illustrated by county responses to
increased funding for the program in 2017:

       hen funds for 1,750 more NC Pre-K “slots” were announced, more than 6,000 requests for those slots were
    • W
      made from 56 of North Carolina’s 100 counties.

       t the same time, 44 counties – with thousands of eligible but unserved children – declined any expansion
    • A
      dollars. This trend continued in 2018.

To find out why this occurred, the National Institute for Early Education Research analyzed statewide preschool data,
including enrollment, financing and costs. This report provides recommendations regarding three interrelated issues
critical to expanding the NC Pre-K program: first, determining how many children are eligible for NC Pre-K but do not
have access to it; second, analyzing whether county “waiting lists” are an accurate measure of the need and demand for
the NC Pre-K program; and third, understanding what barriers exist to expanding NC Pre-K to fully meet the actual need.

The NC Pre-K program is designed to provide a high-quality educational experience during the year prior to
kindergarten entry, enrolling at-risk 4-year-olds primarily from low-income families, as explained in more detail
below. Extensive research has confirmed that children who participate in the program experience significant positive
outcomes that extend well into their elementary school years.

ELIGIBILITY AND ENROLLMENT IN NC PRE-K: 2018

                                                48%                52%
                                                 58,597           62,287                     47%         53%
         120,884                             NOT ELIGIBLE        ELIGIBLE                   29,509      32,778
                                              for NC Pre-K     for NC Pre-K                 SERVED       NOT
       4-year-old children
                                                                                                        SERVED
        in North Carolina

Our analysis confirms:

    • The number of children eligible for NC Pre-K but unserved far exceeds:
        o The number of children on “waiting lists.”
        o The availability of funded “slots” within the program.
        o The current capacity to serve additional eligible children.

    • County “waiting lists” are not an accurate measure of either need or demand for NC Pre-K:
        o T
           he term “waiting lists” used in state budget language actually refers to county capacity to enroll more
          children – not an actual list of children seeking to enroll.
        o C
           ounties are not required to maintain actual waiting lists, and no consistent statewide policy exists for
          creating such lists.

                                                                                                                          2
o A
                t best, waiting lists only address the number of excess applicants in a single cohort of 4-year-olds at a
               static point in time.
             o A
                s funding for NC Pre-K has increased, so has demand that cannot be met, far exceeding the number of
               children on any “waiting lists.”

           he overriding, fundamental barrier to expanding NC Pre-K is that revenues and other resources available to
        • T
          NC Pre-K providers are too often inadequate to cover the costs of expansion. Exacerbating that fundamental
          barrier are:

             o R
                ising operating costs, including costs to recruit and retain qualified teachers, expand facilities and
               provide transportation.
             o Stagnant state reimbursement rates since 2012 that fail to cover NC Pre-K costs.

    To overcome barriers to expansion, we recommend modifying the current NC Pre-K funding structure to allow North
    Carolina to more effectively use state funding to expand access for all eligible North Carolina children:

        • D
           evelop targets for expansion to reach 75% of eligible children statewide, with particular attention to
          underserved child populations and areas within the state where NC Pre-K services are least available.
        • O
           ffer financial incentives for four- and five-star private centers, already providing pre-K for 4-year-olds,
          to meet the higher-quality standards to become NC Pre-K sites, thereby allowing them to receive
          state funding.
        • Increase reimbursement rates to account for rising costs and address specific barriers to expansion, including
           startup costs, thus incentivizing counties and providers to enroll at least 75% of eligible children.
        • P
           rovide supplemental funds for NC Pre-K teacher compensation to achieve parity between private centers and
          public schools.
        • Increase the artificially low, allowable amount of funding that can be used to cover administrative costs.
        • E
           xplore mechanisms to better utilize child care subsidy funds and NC Pre-K funds to serve the same child at
          private centers and public schools that provide NC Pre-K.
        • E
           xplore shifting NC Pre-K funding into the public-school funding formula in such a way that all children served
          can be jointly funded by state, local and federal dollars.

    These recommended modifications to North Carolina’s NC Pre-K funding structure should allow significantly more
    eligible children to access the program, laying solid foundations for their future success in school and beyond.

    Methodology of This Report
    Several specific questions are integral to understanding the critical issues this report addresses:

        • How many additional children are eligible for NC Pre-K but currently do not have access to it?
             o How accurately do county “waiting lists” measure this unmet need?
             o Using data beyond waiting lists, what is the best estimate of unmet need?

        •    What, if any, barriers impede expansion of NC Pre-K to fully meet the need?
             o What barriers prevent existing NC Pre-K providers from expanding enrollment?
             o W
                hat barriers may prevent four- and five-star private centers from becoming qualified as
               NC Pre-K providers?
             o To what extent does a shortfall in available public funding per child prevent expansion?
             o H
                ow does the current state rate structure for reimbursing NC Pre-K program providers, which has not been
               increased since 2012, impact the ability to expand services?

        • How can North Carolina better support expansion by both new and existing providers of NC Pre-K?

3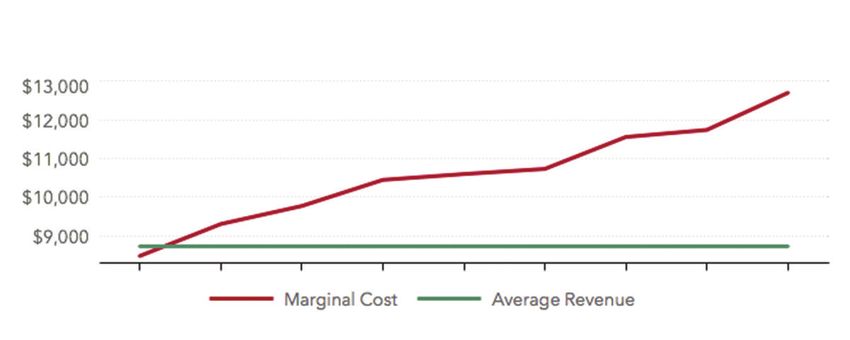
To address these questions, we analyzed both current statewide data and new data collected specifically for this
investigation from 13 representative North Carolina counties. The primary data sources are as follows:

         • S
            tatewide data on enrollment and “waiting lists” from the North Carolina Department of Health and Human
           Services, Division of Child Development and Early Education (DCDEE), disaggregated by county.

         • U
            S Census Bureau 2016 population estimates for North Carolina counties by age, race/ethnicity and income.
           These data provide estimates of the size of the eligible pre-K population from which the number of children
           served can be subtracted to estimate the unmet need.

         • A
            North Carolina State University (NCSU) Center for Urban Affairs and Community Services cost study that
           collected expenditure and revenue data from more than 90 NC Pre-K sites to examine the cost of delivering NC
           Pre-K and the sources of funding used to meet these costs.

         • C
            ost estimates for NC Pre-K in public school sites, private centers and Head Start centers, using the Center on
           Enhancing Early Learning Outcomes (CEELO) Cost of Quality and Revenue (CPQ&R) tool with the NCSU survey
           data, but also recognizing that many survey respondents could not report all of the information requested in the
           NCSU cost study, resulting in the need to estimate missing elements of cost for some sites based on others.

         • T
            wo newly conducted surveys by DCDEE, expressly for purposes of this analysis, of NC Pre-K contractors
           and providers in 13 representative North Carolina counties to examine in more detail potential barriers and
           challenges to serving more children.1

Positive, Lasting Outcomes for NC Pre-K Children
Extensive research has shown that program quality is a key determinant of the effectiveness of large-scale public pre-K
programs, which can vary substantially. The NC Pre-K program has consistently embraced high standards, a strong
record of quality, and extensive evidence of effectiveness. Rigorous research has demonstrated the NC Pre-K program
has produced both short- and long-term benefits for children. For example:

         • U
            niversity of North Carolina at Chapel Hill studies have found that NC Pre-K raises children’s literacy, math, and social-
           emotional skills at school entry, as well as end-of-third-grade reading and math test scores for low-income children.

         • L
            ongitudinal research over 14 years with almost 1 million children conducted at Duke University2 found that
           NC Pre-K has raised math and reading test scores and reduced rates of special education placement and grade
           repetition through elementary school.

         • D
            uke University found these positive outcomes either hold steady or significantly increase through at least fifth
           grade, with no “fade-out.”

         • In fact, Duke University determined that reductions in special education placements can result in savings of $358
            per student in third grade, which in turn equals a significant net savings to North Carolina within four years after
            the initial preschool investment.3

The problem, however, is obvious. NC Pre-K – one of the highest-quality programs in the United States with
proven results for at-risk students – is reaching less than half the children it was designed to serve. As outlined
below, significant numbers of children, across all races and ethnicities – in both rural and urban areas – are losing the
opportunity to develop foundational skills that will prepare them to succeed in the state’s K-12 education system
and beyond.

1
    The 13 counties are Brunswick, Cleveland, Cumberland, Forsyth, Henderson, Jones, McDowell, New Hanover, Pitt, Rockingham, Stanly, Union, and Wake.
2
     odge, K. A., Bai, Y., Ladd, H. F., & Muschkin, C. G. (2017). Impact of North Carolina’s early childhood programs and policies on educational outcomes in elementary school.
    D
    Child Development, 88(3), 996-1014.
3
    Participation in NC Pre-K reduces placement in special education classes by 32% at a savings of $358 per student in third grade. Within three years of NC Pre-K participation,
    North Carolina can have a net savings from the NC Pre-K investment and, within four years after the initial investment, net savings to North Carolina of $46 million, per cohort of
    children. Muschkin, C.G., Ladd, H.F., & Dodge, K.A. (2015), “Impact of North Carolina’s Early Childhood Initiatives on Special Education Placements in Third Grade.”                  4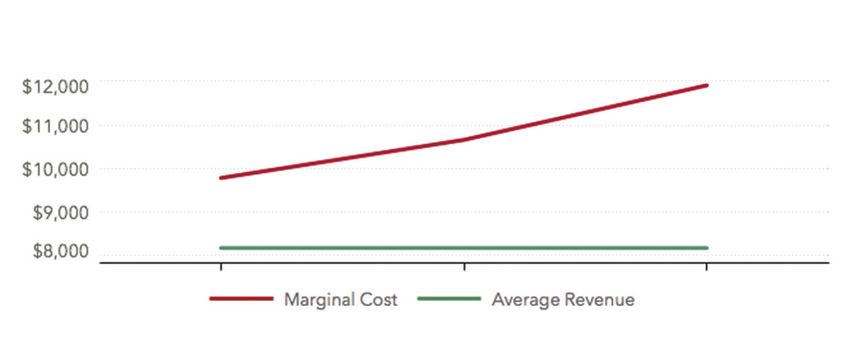
Landscape of the NC Pre-K Program
    CHILDREN SERVED BY NC PRE-K TODAY
    The NC Pre-K program has grown substantially since its beginning. In 2001, as the More at Four Pre-Kindergarten
    Program, the program served just 1% of North Carolina’s 4-year-old population. By 2016, NC Pre-K served 22% of that
    population.4 Yet expansion has had its ups and downs along the way. In 2008-09, combined state and local funding
    for the program peaked at $196 million. By 2016-17, despite an increase in the number of eligible children, state and
    local funding had declined to $143 million. While some federal spending helped fill this funding gap, enrollment and
    overall spending during this period were essentially flat.

    Today, however, North Carolina is taking steps to significantly expand the benefits of NC Pre-K to more children. In its
    biennial 2017-19 budget, North Carolina increased funding for the program by $27.3 million, seeking to enroll 3,525
    additional children over the two-year period. That increase in funding brought the total of eligible children being
    served to 47%, or 24% of all North Carolina 4-year-olds.

    This increased number of children was characterized in the 2017-19 biennial budget as “reduc[ing] the NC Pre-K
    waitlist” by 75%. In February 2018, through legislation designed to address potential adverse consequences from a
    grades K-3 class size reduction mandate, the North Carolina General Assembly increased NC Pre-K funding further,
    with a goal of enrolling 3,000 additional children in 2019-2021, stating the increase would eliminate the “waiting list.”
    Total funding for NC Pre-K increased to $154.5 million in FY2017-18 and to $163.8 million for FY2018-19. Funding for
    the program comes from a combination of state, lottery and federal funds.

    Today, the NC Pre-K program enrolls just over 29,500 children. Across the state, about one-quarter of North Carolina
    counties are serving 75% or more of their eligible children – a good and reasonable goal.5 However, the vast majority
    of North Carolina’s 100 counties are not reaching 75% enrollment of eligible children, with 40 counties serving less
    than 50%.

    ELIGIBLE CHILDREN NOT SERVED IN NORTH CAROLINA: 2017

                                                                                                                                                                 4-year-old children
                                                                                                                                               120,886           in North Carolina

                                                                                                                                                           of 4-year-old children are
                                                                                                                                               52%         ELIGIBLE for NC Pre-K

                                                                                                                                               62,291            eligible

                          Over 75% served
                                                                                                                                                           of ELIGIBLE children
                          Less than 75% served                                                                                                 54%         are NOT SERVED
                          25-50% unserved
                          52-75% unserved                                                                                                      33,904           remain unserved

                          Over 75% unserved

    Looking at enrollment by race/ethnicity across the state reveals significant disparities among those children who are
    eligible for NC Pre-K but who are not being served:

           • African American: 35% (5,800 children) not served.
           • Hispanic: 41% (4,700 children) not served.
           • Asian: 51% (1,100 children) not served.
           • White non-Hispanic: 65% (27,000 children) not served.

      4
          Income is not the only criterion for eligibility so that the total number of eligible children unserved is larger, but not precisely known. Unless otherwise specified, we use
           the term “eligible” to refer to only the somewhat smaller, but clearly identifiable, group of income-eligible children.
      5
          This percentage is a common upper-bound estimate of the full “take-up rate” for early care and education services; that is, the maximum proportion of families likely to
5         participate in programs, given that some families use parental care exclusively or otherwise do not enroll in formal early care and education services. Some state pre-K
          programs have even higher enrollment rates, such as Florida, which has reached 80%.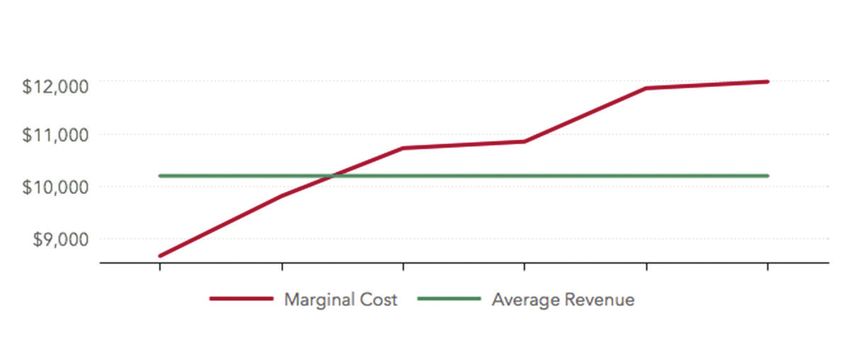
ENROLLMENT AMONG ELIGIBLE CHILDREN BY RACE/ETHNICITY: 2017

                                                                                 Black/
                  White                          Asian                     African American                      Hispanic
                                                                                                                                                       Enrolled
                                                                                                                                                            Yes
              35%                           49%                              65%       35%                    59%
                        65%                           51%                                                               41%                                 No

Further, larger percentages – and therefore numbers – of eligible children are not being served in urban areas. This is
unexpected because urban areas are typically assumed to have greater access to additional resources beyond what
the state provides, enabling them to pay teachers more, which would be expected to help with teacher recruitment/
retention, as well as potentially having more transportation and facility options. That suggests urban areas should have
more seats available. However, urban areas might have higher costs per child because there is greater competition in
more urban counties for teachers, facilities, and other resources.

Rural counties have the largest ranges of percentiles of children who are eligible but not being served, when
compared to urban/suburban counties. Some rural counties are doing very well, serving more than 80% of eligible
children. At the same time, some rural counties are serving only 11 to 20% of eligible children, meaning more than
eight out of 10 eligible children are not being served.

NUMBER OF ELIGIBLE, UNSERVED CHILDREN IN URBAN/SUBURBAN AREAS OF
NORTH CAROLINA: 2017

                    of eligible, unserved children
    45%             are in 20 North Carolina counties.

Statewide, roughly half of NC Pre-K classes are in public schools and half in private for-profit or nonprofit centers.6
However, some counties serve children almost exclusively using public schools, while other counties primarily use
private centers. The use of public schools versus private centers is largely a factor of capacity available in each county
to operate NC Pre-K classrooms. Location of NC Pre-K classes greatly impacts barriers to expansion.

At the state level, DCDEE administers the NC Pre-K program. At the local level, the program is administered through 91 contract agencies by county or geographic
6

  region in coordination with their local NC Pre-K committees. NC Pre-K contractors subcontract with local providers with a classroom or classrooms that meet the NC Pre-K
  program requirements.
                                                                                                                                                                             6
Responses to 2017, 2018 NC Pre-K Expansion Funds
The goal of the increased funding for NC Pre-K in 2017 was to create 1,750 additional “slots” across the state.
Accordingly, each North Carolina county was given the opportunity to expand its program by being asked how many
additional children the county would like to serve. Important and telling reactions occurred:
• For the newly funded 1,750 slots:
o More than 6,000 slot requests were made from 56 counties.
o The total number of eligible but unserved children in those 56 counties exceeded 24,000.
• 44 out of 100 counties declined expansion dollars. In those 44 counties:
o More than 9,000 children were eligible for NC Pre-K—but unserved.
2017 NC PRE-K EXPANSION FUNDS
44 56
Counties DECLINED Counties ACCEPTED
Expansion Funds Expansion Funds
A similar response to expansion funding occurred in 2018, when additional funding was appropriated, with the goal of
opening 1,775 “slots” across the state:
• For these newly funded slots:
o More than 5,600 slots were requested from 66 counties.
o The total number of eligible but unserved children in those 66 counties was almost 27,000.
• 34 out of 100 counties declined expansion dollars. In those 34 counties:
o Almost 6,000 children were eligible for NC Pre-K but unserved.
72018 NC PRE-K EXPANSION FUNDS
34 66
Counties DECLINED Counties ACCEPTED
Expansion Funds Expansion Funds
• O
ver the two years of funding expansion, 28 counties declined any expansion funding. Of those
28 counties:
o 12 counties are serving more than 75% of eligible children.
o In the other 16 counties, almost 5,000 children eligible for NC Pre-K remained unserved.
COUNTIES THAT DECLINED EXPANSION FUNDS BOTH YEARS: 2017-2018
A lle g h a n y N o rth a m p to n
A sh e Va G a te s C u rritu ck
S u rry S to k e s R o c k in g h a m C a sw e ll P e rso n nc W a rre n Pa
e H e r t fo r d sq Ca
uo
i lle H a l i fa x ta
m
de
W a ta u g a a nv Per
qui nk n
W ilk e s Y a d k in F o rsy th O ra n g e Gr Ch
ow
ma
ns
ce
M itc h e ll A v e ry F ra n k lin B e rtie an
m
an
G u i l fo r d r ha
am
C a ld w e ll N ash
D a v ie Du n
Al
A le x a n d e r Ed g eco m b e
M a d iso n Yan cey g to Ty rre ll
Ir e d e l l D a v id so n M a rtin s h in
B u rk e
W ake Wa
R a n d o lp h C h a th a m W ilso n D a re
M c d o w e ll C a ta w b a Row an
B u n co m b e P itt
H ayw ood
S w a in L in c o ln Lee J o h n sto n G re e n e B e a u fo r t
y
R u t h e r fo r d C a b a rru s er H yde
G ra h a m H e n d e rso n om H a rn e tt W ayn e
Jackso n a C le v e la n d G a sto n S ta n ly tg M o o re
ni P o lk on
L e n o ir C ra v e n
y lv a M e c k le n b u rg M
M aco n ns C u m b e rla n d P a m lic o
C h e ro k e e
C la y Tra R ic h m o n d
U n io n A n so n H oke S am p so n Jon es
D u p lin C a rte re t
nd
la
ot
Sc
O n slo w
R o b eso n B la d e n
Pender
C o lu m b u s N ew
H an over
B ru n sw ic k
28 17 11
Counties DECLINED = Counties NOT MEETING Counties MEETING
Expansion Funds target of 75% served target of 75% served
8We undertook a 13-county study, through two surveys of NC Pre-K contractors and providers, to collect additional
data to help us learn why: a) some counties declined expansion funds; b) requests for additional “slots” exceeded
the number of children on “waiting lists”; and c) counties requested fewer “slots” than the number of eligible but
unserved children.
Our analysis and recommendations are based on an understanding of how funding for NC Pre-K is structured. State
funding is not designed to completely cover the cost of an NC Pre-K slot. Rather, state funding covers approximately
60% of the slot cost, leaving each county to cover the remaining 40% through county, local, philanthropic, or other
funding sources.
Based on that funding structure, counties have declined new funding because NC Pre-K expansion ran up against
three negative financial impacts.
• F
irst, and perhaps most important, is that as the demand for qualified teachers increases it drives up salaries
to produce a corresponding increase in supply. As NC Pre-K expands, more teachers need to be recruited and
retained. In an industry well-known for low compensation, recruiting and retaining qualified teachers will require
offering higher compensation to be competitive with North Carolina’s K-12 teacher pay schedule.
• S
econd, the average cost per child rises. While providers work diligently to enroll some of the most at-risk
children who will benefit from the program, often the children enrolled to a provider’s capacity are those easiest
to recruit and who do not require transportation. Enrolling additional children from families who may not be
aware of the benefits of the program, have unstable housing arrangements, or would require transportation
assistance increases costs.
• F
inally, availability of nonstate funding and in-kind contributions to supplement state funding declines as
programs expand. For example, at some point, available dollars from local, county and federal sources
will already be committed; unoccupied or inexpensive facilities adapted to preschool are fully used; and
administrative capacity is exhausted. As a result, programs stop serving new children at the point where they
lose money by adding another child.
How Large Is the Unmet Need for NC Pre-K?
NC Pre-K serves approximately 24% of the total 4-year-old population in North Carolina – and 47% of program-eligible
children – in a mixed delivery system comprising public schools, private centers, and Head Start centers. As shown
in Table 1 below, approximately another 27% of 4-year-olds are enrolled in special education, Head Start, and four-
and five-star centers outside of the NC Pre-K program. Approximately 50% of the more than 120,000 4-year-olds in
North Carolina do not attend any preschool program or attend an unlicensed program or a licensed but lower-quality
program (below four stars).7
TABLE 1: NORTH CAROLINA 4-YEAR-OLD POPULATION PRE-K ENROLLMENT: 2017
Served by NC Pre-K Not Served by NC Pre-K
Public Schools 13,613
Special Education* - 3,841
Head Start 4,312 6,134
Four- and Five-Star Centers 10,460 17,386
None of the Above - 65,098
Total 28,385 92,459
Data on 4-year-olds served in schools, Head Start, four/five-star centers provided by NC Health and Human Services, Department of Child Development and Early Education. Data
on Special Education enrollment from The State of Preschool 2017.Data on Head Start enrollment from US Health and Human Services, Office of the Administration for Children &
Families. Population data from US Census Bureau. NC Pre-K includes 1,430 additional special education students, and another 1,186 special education students attend Head Start.
*Only preschool special education children not in NC Pre-K or Head Start are reported separately.
7
his is roughly consistent with estimates from the US Census that 41% of North Carolina’s 3- and 4-year-olds attend some preschool or child care center, which, adjusting for age
T
differences, would indicate 53% of 4-year-olds attend some kind of center.
9Not all North Carolina 4-year-olds are eligible for NC Pre-K. An age-eligible child must also be: (a) from a family whose
gross income is at or below 75% of the State Median Income (SMI) (or $52,500 per year for a family of four), or (b)
in an active duty or certain other military family regardless of income. In addition, up to 20% of age-eligible children
enrolled may have family incomes in excess of 75% SMI if they have documented risk factors in specific categories,
including developmental disability, Limited English Proficiency, educational need, or chronic health condition. Most
children enrolled in NC Pre-K meet the income-eligibility threshold, so we are using this conservative estimate to analyze
expansion of NC Pre-K to all eligible children.
Although there are children in other pre-K programs throughout North Carolina, these programs do not include all of
the quality components of NC Pre-K and are not, therefore, able to access state funding. High-quality early learning
opportunities are essential to produce lasting pre-K benefits for both children and taxpayers over a lifetime, as
confirmed through extensive, longitudinal research by both Duke University and UNC-Chapel Hill. Those served by a
lesser-quality program might be considered “underserved,” and may not experience the lasting benefits as do NC Pre-K
children.8 Because of the confirmed, positive outcomes from participation in NC Pre-K, North Carolina should strive to
enroll at least 75% of eligible children in that program by raising lesser-quality programs up to NC Pre-K level standards.
Census-Based Estimate of Unmet Need
About half of North Carolina’s young children are in low-income families.9 The percentage of families below 200% of
the federal poverty line and 75% of the state median income (the income eligibility level for NC Pre-K) are very similar.
Overall, the estimated total number meeting this criterion is roughly 62,000.10 We have calculated the gap, or number
of eligible 4-year-olds per county not enrolled in NC Pre-K, by subtracting actual enrollment from the estimated
number of eligible 4-year-old children. The result is an estimated unmet need of almost 33,000 children – many
times larger than the number of children identified by county “waiting lists,” as discussed below.
Moreover, this estimate of almost 33,000 North Carolina children still unserved is a conservative one. The reasons this
number likely underestimates all eligible but unserved children include:
• L
ooking just at income does not include children in active duty military families who are automatically eligible
for NC Pre-K.
• T
his number also does not include those children whose families are above the income-eligibility level but meet
another criterion, such as having a child with developmental or learning disabilities, limited English proficiency,
or chronic health conditions.
• U
p to 20% of those served may exceed the income threshold if they meet any of these other criteria, which
tends to make our estimated unmet need an undercount.11
• T
he number of children served at any time during the year may be greater, since children may leave and enter
the program during the year, such as if families move, and those children may share a slot funding allocation.12
• T
he fact that a few counties report larger “waiting lists” than our estimated unmet need suggests that, on
balance, our estimate might be slightly low rather than too high.
“Waiting Lists” – Undercounting Unmet Need
A close look at the data confirms that “waiting lists” maintained by only some North Carolina counties are not an
accurate measure of demand and need for the NC Pre-K program.
In 2017, when funding for an additional 1,750 slots was announced, 56 counties requested more than 6,000 new slots.
However, those 56 counties only had capacity to add 4,800 slots. Somehow, that capacity level came to be viewed as
the number of children on “waiting lists,” with state funding increases tied to that number.13 The problem is that the
number of students a county is “able” to enroll at a given point is not an accurate measure of demand and need for the
NC Pre-K program.
http://nieer.org/wp-content/uploads/2016/12/HS_North_Carolina_Profile.pdf; ECERS scores provided by North Carolina’s Health and Human Services, Department of Child
8
Development and Early Education (DCDEE) show a positive and statistically significant difference (t-test value 6.93; p =.000) in mean score for programs in NC Pre-K (5.66)
relative to those outside of NC Pre-K (5.41).
National Center for Children in Poverty (2018). North Carolina Demographics of Low-Income Young Children. Low income is defined as under 200% of the federal poverty level,
9
$50,200 in 2018. https://aspe.hhs.gov/poverty-guidelines
10
http://www.nccp.org/profiles/NC_profile_8.html and http://longleafpolitics.com/north-carolina-pre-k-expansion/
11
Effective October 2016, eligibility at or below 75% of state median income is $52,500 for a family of four.
12
See “NC Pre-K Expansion and Rate Fact Sheet,” NC Early Education Coalition; “Study Costs and Effectiveness Associated with NC Pre-K Slots,” Report to House Appropriations
Committee on HHS and Senate Appropriations Committee on HHS and Fiscal Research Division, NC Department of Health and Human Services, Feb. 1, 2017.
13
his same “capacity” issue occurred in 2018 as well. For 1,775 new slots, 5,600 requests were made from 66 North Carolina counties. However, those counties had capacity for
T 10
only 4,000 additional slots.INACCURACY OF NC PRE-K “WAITING LISTS”: 2017
33,304 6,346 4,896
Eligible, 56-County Slot 56-County Slot
UNSERVED REQUESTS CAPACITY
Additional data underscore this conclusion because so-called “waiting lists” have serious limitations as indicators of the
underserved eligible population:
• F
irst, waiting lists include only children in families who tried to enroll. Many eligible families may not seek to enroll
because they: (a) lack knowledge about the program and the important benefits to their children from high-quality
pre-K; (b) know that a program is full; (c) are hesitant to enroll in a state-run program or share family information,
especially if they are immigrants; (d) are limited by difficulties in proving eligibility; and/or (e) have other challenges
related to transportation, homelessness, work schedule, or language.
• S
econd, providers at full capacity may consider ongoing outreach – and creation of a waiting list – a waste of
resources if families will inevitably be disappointed when they are denied enrollment.
• T
hird, there is no statewide, centralized waiting list, nor is there a standardized process in place for NC Pre-K
contractors to develop waiting lists. As a result, counties that do keep lists can develop them in whatever manner
they deem appropriate.14
• F
ourth, any waiting list can vary substantially from one month or year to another for reasons unrelated to changes in
unmet need, such as families who move abruptly without notice.
• F
inally, because NC Pre-K is a 10-month program for 4-year-olds, a waiting list can only be addressed on an annual
basis. The children on any year’s list will age out of eligibility during a year, and a new number will age in.15 A single
year’s “waiting list” simply cannot be phased out over a multiyear period of time.
Accordingly, the data point that is most relevant when seeking to expand NC Pre-K is the number of children who are
eligible for the program but who do not have access to it. North Carolina needs to move beyond the notion of thinking
that inaccurately labeled “waiting lists” as the metric to be used for expanding the NC Pre-K program – especially when
there are almost 33,000 eligible but unserved children across North Carolina who the program was designed to serve
and who would benefit most from participation.
To serve those 33,000 children, advocates for expanding NC Pre-K have set a goal of enrolling 75% of all children
eligible for the program. Serving 75% of eligible children is a conservative estimate for providing early education
services to all eligible children who are likely to participate, and thus a reasonable goal to set.16
An exception is Head Start programs that are federally required to maintain a waiting list of age-eligible children regardless of income. However, it is unlikely that this
14
information is shared with non-Head Start providers in their counties. Further, in North Carolina, Head Start serves only 5% of 4-year-olds, and only 36% of Head Start centers are
NC Pre-K qualified, serving 3,467 children as noted above in Table 1.
Further, the population of children eligible for NC Pre-K is expected to grow as the state of North Carolina continues to grow. See North Carolina Office of State Budget
15
Management, County/State Population Projections.
See footnote 5, supra.
16
11Financial Barriers to Expansion: The Gap Between State Funding
and Actual Cost to Enroll a Child
Funding for NC Pre-K is made available for “slots” only. A “slot” refers to the capacity of a site or county to serve one
child for a full 10-month, part-day program. The total state-funded rates provided to serve one slot for one year have
remained constant since 2012 at an average of $5,200. As shown in Table 2, the rate paid to a provider depends on the
auspices under which an NC Pre-K class operates.
TABLE 2: NC PRE-K PROVIDER RATES
Provider Maximum Rate/Month
Head Start $400
Public Schools $473
Private Centers $65015
State funds are distributed to NC Pre-K “contractors.” These contractors are the 91 agencies with which DCDEE17
contracts to administer the NC Pre-K program. These contractors include public school systems, Smart Start
partnerships,18 and Head Start agencies. Contractors incur the administrative costs of the program, including
monitoring, recruitment, assignment and payment. The contractors then subcontract with “providers” at individual
sites, including for-profit and nonprofit private centers, public schools, and Head Start agencies. These NC Pre-K
providers incur the costs of day-to-day operations of the program. NC Pre-K providers have some flexibility in their use
of state funding. State funds are to be used for “operating” the NC Pre-K classrooms, which may include salary and/
or benefits for teaching staff, equipment, supplies, curriculum and related materials, developmental screening tools
and assessments efforts, and staff training. Funding can also be used to cover expenses associated with meeting the
program’s quality standards. However, state funding is not available to cover certain costs – primarily the costs of real
property, buses or motor vehicles.
NC PRE-K CONTRACTOR “ADMINISTRATIVE COSTS”
The 91 NC Pre-K contractors across North Carolina receive an allocation for program administration capped at
4% of each NC Pre-K contractor’s total funding allocation. Contractors have reported the need to increase this
administration allocation to at least 8%, with some stating as much as 15% is needed. Understanding what goes
into administering the NC Pre-K program is necessary when analyzing an appropriate cost allocation.
Although NC Pre-K is administered as a 10-month program, it requires year-round administration, including
summer efforts toward recruitment, eligibility determination, and site selection and setup to meet the program’s
quality components. As a result, the 4% allocation from state funds covers at best only half of the actual year-
round cost to administer the program, causing contractors to have to find supplemental sources to cover the full
cost. While supplemental or “other resources” are required as part of the NC Pre-K program, the state does not
stipulate what portion of NC Pre-K costs should come from “other resources.” Because of the significant amount
of resources from other sources being required and utilized locally to cover many program operating costs
(teacher salary supplements, supplies, etc.), NC Pre-K contractors have expressed concern about the viability of
the program if those supplemental funding sources are not consistently available, are reduced, and/or are no
longer available to cover the additional costs to administer the program.19
12State funding for NC Pre-K is expressly designed not to cover the entire cost for a slot for a child. On average, state
funding covers 61% of the cost for an NC Pre-K slot, requiring counties to raise the additional 39%. To expand
enrollment, providers need to be able to cover the costs of additional enrollment from a combination of NC Pre-K state
funds and other funding resources they may be able to access. In the absence of other resources, providers are faced
with a choice of refusing to open new slots or to operate at a loss.
The evidence regarding costs and revenues indicates that NC Pre-K program expansion at current funding levels is
hindered primarily by two problems. First, the cost per child is not constant but increases with expansion. As noted
above, although significant effort is made to enroll the most at-risk children, many who are the most difficult to
reach are those who are more expensive to serve. Thus, costs of the required resources rise with increased demand
(especially facilities, teachers, and transportation). Second, other available resources (with the possible exception of
local revenues, such as local tax levies that could, at least in theory, be increased) are largely exhausted at the current
level of enrollment. Without additional resources for expansion, many providers simply cannot afford to increase
enrollment.
Current Average Cost per Child
North Carolina’s plan to serve an additional 3,525 children has been supported by $27.3 million in additional funds
over a two-year period through the 2018-19 school year, with an added infusion of $18.6 million for 3,000 more
children in 2019-21. In this plan, state funding is fixed at the current level of $5,200 per child. The North Carolina
Pre-Kindergarten Cost Study conducted by NCSU found the average cost per child for those children already
served is approximately $9,100.20 Programs have made up the difference by accessing a range of other resources,
including county funding, Smart Start funding, federal Title I dollars, in-kind resources, and existing administration and
infrastructure of larger organizations.
To obtain our own estimates of cost, we used CEELO’s Cost of Preschool Quality and Revenue (CPQ&R) tool. Our
estimates suggest the NCSU estimate of full cost is conservative. Table 3 below contains our estimates, which are
quite similar to those in the NCSU study for public school programs, slightly higher for private centers, and nearly 20%
higher for Head Start centers.
TABLE 3: CPQ&R ESTIMATES OF COST PER CHILD, BY TYPE OF CENTER
Public School Private Center Head Start
State-Level Implementation Costs $9,679,983 $8,030,979 $5,251,133
Provider-Level Implementation Costs $123,167,369 $90,300,433 $32,701,270
Total Annual Implementation Costs $132,847,352 $98,331,412 $37,952,403
Cost Per Child $9,330 $9,615 $10,947
17
The Division of Development and Early Education (DCDEE) is within the North Carolina Department of Health and Human Services.
18
The North Carolina Partnership for Children, often called “Smart Start,” is a public-private initiative, founded in 1993, that provides funding throughout the state to “ensure that
every child reaches his or her potential and is prepared to succeed in a global community.” Smart Start is a significant funder of the NC Pre-K program.
19
See “Study Costs and Effectiveness Associated with NC Pre-K Slots,” Report to the House Appropriations Committee on Health and Human Services and Senate Appropriations
Committee on Health and Human Services and Fiscal Research Division by North Carolina Department of Health and Human Services, February 1, 2017, at p. 3, 10.
13Marginal Cost Per Child for Expansion
The cost estimates discussed above represent the average cost per child with current enrollment. They do not
represent marginal cost, which is the cost per additional child when enrollment is expanded. We used the NCSU cost
survey data to examine how costs might rise by looking at not only the average cost per child, but also at the costs in
the 25% of programs with the highest costs.21 Thus, these marginal cost estimates are based on actual expenditure
data from more than 90 public schools, private centers, and Head Start centers serving NC Pre-K children.
We find marginal costs are considerably higher than average cost per child. As can be seen in Table 4, just the
nonlabor costs per child of the top 25% are $1,000 to $2,000 higher. At the very top, nonlabor costs22 per child are
more than $2,000 dollars higher in all three provider sectors. However, labor costs also are likely to rise with expansion.
TABLE 4: NC PRE-K COSTS PER CHILD, BY TYPE OF CENTER
Teacher Salary Other Salary Nonlabor Avg. Nonlabor Top 25% Nonlabor Max
Public Schools $5,686 $1,143 $2,958 $3,832 $5,082
Private Centers $3,716 $1,972 $2,794 $4,088 $5,048
Head Start $4,543 $1,339 $2,790 $4846 $4,971
The largest cost for NC Pre-K providers is teaching staff. That cost is driven higher because of the program’s teacher
degree requirements – one of the most important quality components of the NC Pre-K program.23 Nevertheless,
teacher pay between those in public school settings versus those in private centers varies widely, fueling the difficulty
to recruit and retain qualified teaching staff.
When an NC Pre-K program is operated in a public school, teachers must be paid in parity with K-12 teachers in
accordance with the state’s teacher pay schedule. However, there is no state requirement that NC Pre-K teachers in
private or Head Start centers be paid in parity with K-12 public school teachers. As a result, on average, teachers in
private centers are paid 69% of the salaries of their public-school counterparts. Similarly, teachers in Head Start are
paid 82% of public school salaries. Although some qualified teachers might prefer to teach in private centers, even
with lower salaries and benefits, the supply of these qualified teachers is limited. As indicated in responses to our
surveys regarding barriers, turnover is high because many NC Pre-K teachers leave private and Head Start programs
for public schools to secure higher salaries and benefits. In 2017, North Carolina’s average wage was just $12.44 per
hour for all preschool teachers – less than half the $25.37 per hour wage for kindergarten teachers.24
At the same time, upcoming class size reductions for grades K-3 in the public schools, mandated by recent legislation,
will raise demand for teachers in grades K-3 in the public schools, putting increased pressure on the supply of teachers
for NC Pre-K. These mandated class size reductions can also mean decreased space availability in public schools as
more classrooms will be needed for K-3 classes. Moving these classrooms to private sites will not only cost more, but
the barriers to recruit and retain teachers at those private sites, as just outlined, will then exist.
Thus, the rising marginal cost of hiring additional teachers and increasing classroom space constitute obvious barriers
to NC Pre-K expansion at current funding levels.
20
See: http://buildthefoundation.org/wp-content/uploads/2017/02/Cost-of-PreK-Fact-Sheet-Final.pdf
21
We assume that the centers observed to have the highest costs currently are illustrative of the costs that other providers will face as they expand to serve more children and
move out along the rising supply curve to compete for new teachers, acquire facilities, and face increased needs for administrative capacity.
22
These include supplies, materials, equipment, facilities and the operating costs of facilities.
14Revenue Shortfalls Increase With Expansion
Revenue-based considerations present additional barriers to expansion. As discussed above, average state funding
per child is far below the actual marginal cost per child. Some programs receive higher levels of funding, but all
programs must rely on other sources to make up the difference. In many counties, these alternative sources have been
maxed out, and there are no additional dollars from which to draw these sources as additional children are enrolled.
This problem is exacerbated by the limitation of spending on NC Pre-K contractors’ administration costs to 4% of total
funding. Actual program budgets indicate this is only about half of what is needed for administration.25 The difference
between actual costs and revenues available to both NC Pre-K contractors and providers may be considered a revenue
shortfall.
The magnitude of the currently existing revenue shortfall is demonstrated in Table 5, which shows the current average
NC Pre-K revenue per child for each type of provider and the average additional revenue per child these providers
raise from other sources.
TABLE 5: NC PRE-K ANNUAL REVENUE PER SLOT, BY TYPE OF CENTER
State Average Other Total
Public Schools1 $5,781 $2,400 $8,181
Private Centers 2
$7,231 $1,500 $8,731
Head Start3 $4,000 $7,700 $11,700
1
Other = local and federal funds, including TANF, IDEA, Title 1, CACFP.
2
Other =local and federal funds, including TANF and CACFP.
Other = federal Head Start funds. Programs receiving this level of Head Start receive $4,000 in state funds. Programs receiving up to $8,700 in state funds are not eligible to
3
receive federal Head Start funds.
As can be seen by comparing revenue to cost by type of provider, only for Head Start is current revenue enough to
meet the current average cost per child as shown in Table 6.
TABLE 6: CPQ&R ESTIMATES OF COST PER CHILD COMPARED TO ANNUAL REVENUE
PER SLOT, BY TYPE OF CENTER, BASED ON CURRENT COST/REVENUE NUMBERS
$12,000
$11,700
$10,947
$10,000
$9,615
$9,330
$8,731
$8,000
$8,181
$6,000
$4,000
$2,000
Cost
$0 Revenue
Public School Private Center Head Start
23
All NC Pre-K teachers must hold, or be working toward, an NC Birth through Kindergarten (B-K) license or an NC K-6 or other state’s license, along with a Provisional Preschool
Add-on or B-K license.
24
See: http://cscce.berkeley.edu/files/2018/06/2018-Index-North-Carolina.pdf
25
See: http://buildthefoundation.org/wp-content/uploads/2017/02/Cost-of-PreK-Fact-Sheet-Final.pdf
15This suggests public schools and (to a lesser extent) private centers are relying on substantial in-kind and other
contributions, likely for administration and facilities, as any gap between cash revenue and cost must be met through
“in kind” contributions. This is reflected in the cost survey, where some providers listed no costs for such resources,
including both private providers with responsible administrators not paid through NC Pre-K and public schools that
did not assign indirect costs to NC Pre-K programs.
The current revenue shortfall, along with the need to make up this shortfall by stretching existing administration and
facilities thinner, hampers expansion. It is unlikely providers have remaining untapped resources. As a result, many
programs would be unable to expand enrollment even if they could hold down costs to current levels. The revenue
shortfall becomes an even bigger barrier as cost per child rises with expansion. Even those programs able to secure
higher payments from the state because of exceptional circumstances would still be unable to cover the higher cost
per child for expansion observed in the survey data.
The mismatch between revenue and estimated marginal cost is depicted in Figures 1-3. These figures illustrate,
for each type of provider, marginal cost and revenue per child as the number of children increases in an NC Pre-K
program. Each provider starts with current cost levels that reflect average teacher salaries, average non-teacher
salary cost, and average non-labor costs per child. As we have explained above, marginal costs rise with expansion as
lower-cost labor and facilities supplies are exhausted. Marginal cost for expansion reaches about $12,000 per child
regardless of the type of provider agency. Private center cost per child is the highest, perhaps because the centers
tend to be smaller with less opportunity for economies of scale.
FIGURE 1: PUBLIC SCHOOL COST AND REVENUE PER CHILD
FIGURE 2: PRIVATE CENTER COST AND REVENUE PER CHILD
16FIGURE 3: HEAD START COST AND REVENUE PER CHILD
INSIGHTS FROM SURVEYS: FINANCIAL AND RELATED BARRIERS TO EXPANSION
The two surveys conducted for this analysis by the NCDEE of contractors and providers in 13 counties that represent
variation across the state provide another source of information about challenges for expansion. NC Pre-K contractors
and providers reported that finding and retaining qualified teachers is the most significant barrier to serving more
students. Of contractors surveyed, 77% cited finding qualified teachers, and 54% cited retaining qualified teachers, as
a barrier to expansion. Of private center sites surveyed, 51% reported finding qualified teachers, and 43% reported
retaining qualified teachers, as a barrier to expansion.
“ If we could get additional funding to pay the teachers, add materials, and . . . convert the
existing classrooms to a large enough space, we could expand.
– McDowell County NC Pre-K Contractor
Among contractors, transportation also can create a considerable barrier to expansion, most notably for private
centers, which do not have vans or buses at their disposal, cannot use state NC Pre-K funds for these vehicles, and lack
funds to cover the cost of transportation. This scenario is different when NC Pre-K is housed in a public school. In those
instances, transportation may be more readily available, although some schools charge a fee to NC Pre-K contractors
to provide transportation. Further, public schools have the ability to spread the cost of transportation across the entire
school or district.
The overriding, fundamental barrier to expanding NC Pre-K, reflected in responses to the survey, is inadequate
revenue and other resources to cover the additional costs. Survey responses identified six themes related to
inadequate funding and resources:
• Teacher cost is not fully covered, and this results in decreased demand for expansion funds.
• C
ontractors’ administrative costs are not adequately covered because of the 4% cap placed on such costs when
state funds are used.
• P
roviders have reached the end of their capacity to expand as the workload for the existing administration and
support staff is at capacity.
• Space for expansion is scarce, and acquiring new space becomes more expensive with expansion.
• T
ransportation becomes a bigger issue with expansion, as expansion requires increasing access for more
children who cannot attend without transportation.
17• T
he additional expense of outreach to expand enrollment of families who are more difficult to reach and engage
is not recognized in funding.
• O
ther revenue sources dry up as providers expand, and additional funding from the state is not available to
make up the difference.
Another theme evident in the survey responses, as well as in our analyses of cost and revenue, is that barriers to
expansion have stronger impacts on programs run by private centers than by programs run in public schools. The
inability to afford teacher and transportation costs are among the barriers that weigh most heavily on private center
providers. This results in larger unmet need in some counties than in others.
Although barriers to expansion tend to be greater for private centers, significant barriers hinder expansion in
the public schools as well. Most notable is the impact of the recently mandated K-3 class size reductions, despite
postponing these until the 2021-22 school year. As the public school system will require more space to serve K-3
children, less space will be available for NC Pre-K, effectively pushing not only expansion but existing slots to private
centers – providers that have their own barriers to expansion as noted above. This unintended consequence of the new
class size limits in North Carolina was explained by one survey respondent:
“Yes, this [K-3 class size reduction] will definitely impact the NC Pre-K Program. There is already a struggle with having
the space and teachers to serve pre-K due to the increasing demands to serve the K-3 children. As the mandate is
phased in, this will become even more of a challenge. The public schools already have to work each school year to find
space for the pre-K children.”
Raising Four- and Five-Star Providers to NC Pre-K Quality
Across the state, some four- and five-star centers are serving 4-year-old children in pre-K programs, but the programs
are not NC-Pre-K qualified, which would allow them to receive state NC Pre-K dollars. The goal is to increase NC Pre-
K-qualified centers because the quality components required by that program drive the lasting positive outcomes
confirmed by extensive research. Determining what it would take to raise these four- and five-star sites to the NC Pre-K
highest quality is a logical approach to expansion. By raising the quality of these existing programs to qualify for NC
Pre-K funding, not only would more children be served, but we also would know that the additional children served in
an NC Pre-K qualified program would enjoy lasting, positive educational outcomes.
North Carolina’s Star-Rated License System
North Carolina has a star-rating system, often called a Quality Rating and Improvement System (QRIS), for early learning
programs in public schools, Head Start centers, and for-profit and nonprofit private centers across the state, including
those operating NC Pre-K programs. However, not every four- and five-star rated center meets the higher qualifications
to be NC Pre-K qualified and, in such cases, does not receive NC Pre-K state funding.
A four- or five-star rating may be acquired in multiple ways with the accumulation of points over two component areas:
1) program standards; and 2) education standards of the teaching staff. A four- or five-star rating is a necessary but
not sufficient criterion to qualify as NC Pre-K. In addition to meeting the four- or five-star requirements, a center has
to go above those standards in a variety of ways. For example, an NC Pre-K teacher must have a B-K license, while the
highest education level required in the star-rated system is an Associate in Applied Science (AAS) vocational degree.
Ratios are reduced for NC Pre-K classrooms to 1:9, while in a four- or five-star center, they could be meeting a 1:12
or 1:13 ratio. There are requirements related to formative assessments and family engagement for NC Pre-K that are
not required in a four- or five-star program. Lastly, an NC Pre-K classroom must receive a score of 5.0 or higher on the
Early Childhood Environment Rating Scale (ECERS-R), whereas an average can be used for four-star and many five-star
programs where an individual classroom could receive less than a 5.0 score. The ECERS-R includes ratings on space
and furnishings, personal care routines, language reasoning, activities, interactions, program structure, and parents
and staff.
18NUMBER OF ACTIVE 4 & 5 STAR SITES NOT QUALIFIED FOR NC PRE-K IN URBAN/
SUBURBAN AREAS OF NORTH CAROLINA
of sites not NC Pre-K qualified are
68% in 20 North Carolina counties.
Our 13-county survey highlighted difficulties that may be faced in taking four- and five-star centers to the NC Pre-K
level. The cost and revenue issues identified in our analyses also were reflected in survey responses about why most
four- and five-star centers do not seek to become qualified NC Pre-K providers. The answer is they believe the balance
of cost and revenue makes becoming an NC Pre-K provider a bad, or impractical, financial decision. As explained in
the 13-county survey:
“ … even if a facility is a four- or five-star program, they are not willing to put the additional
money/resources into the program to assure they are meeting the requirements for the higher
standards of the NC Pre-K program.
–Cumberland County NC Pre-K Contractor
In spite of these challenges to expansion in both public schools and private centers, as North Carolina looks to expand
NC Pre-K, it could be substantially beneficial – and cost-effective – to begin with four- and five-star centers serving
low-income children as an effective way to expand the NC Pre-K program. This could be done by determining which
quality components are lacking and assisting these centers in incorporating those components to get them to NC
Pre-K qualified as efficiently as possible. In addition, it will be necessary to ensure they can cover the additional costs,
and the most cost-effective way for the state to do this may be to allow them to blend child care subsidy funds and
NC Pre-K funds to serve children at NC Pre-K standards, while also providing those children with full workday, work
year coverage.
19You can also read