ANACONDA: a new tool to improve mortality and cause of death data
←
→
Page content transcription
If your browser does not render page correctly, please read the page content below
Mikkelsen et al. BMC Medicine      (2020) 18:61
https://doi.org/10.1186/s12916-020-01521-0

 RESEARCH ARTICLE                                                                                                                                Open Access

ANACONDA: a new tool to improve
mortality and cause of death data
Lene Mikkelsen1*, Kim Moesgaard2, Michael Hegnauer3 and Alan D. Lopez1

  Abstract
  Background: The need to monitor the Sustainable Development Goals (SDGs) and to have access to reliable and
  timely mortality data has created a strong demand in countries for tools that can assist them in this. ANACONDA
  (Analysis of National Causes of Death for Action) is a new tool developed for this purpose which allows countries to
  assess how accurate their mortality and cause of death are. Applying ANACONDA will increase confidence and
  capacity among data custodians in countries about their mortality data and will give them insight into quality
  problems that will assist the improvement process.
  Methods: ANACONDA builds on established epidemiological and demographic concepts to operationalise a series
  of 10 steps and numerous sub-steps to perform data checks. Extensive use is made of comparators to assess the
  plausibility of national mortality and cause of death statistics. The tool calculates a composite Vital Statistics
  Performance Index for Quality (VSPI(Q)) to measure how fit for purpose the data are. Extracts from analyses of
  country data are presented to show the types of outputs.
  Results: Each of the 10 steps provides insight into how well the current data is describing different aspects of the
  mortality situation in the country, e.g. who dies of what, the completeness of the reporting, and the amount and
  types of unusable cause of death codes. It further identifies the exact codes that should not be used by the
  certifying physicians and their frequency, which makes it possible to institute a focused correction procedure.
  Finally, the VSPI(Q) allows periodic monitoring of data quality improvements and identifies priorities for action to
  strengthen the Civil Registration and Vital Statistics (CRVS) system.
  Conclusions: ANACONDA has demonstrated the potential to dramatically improve knowledge about disease
  patterns as well as the functioning of CRVS systems and has served as a platform for galvanising wider CRVS
  reforms in countries.
  Keywords: ANACONDA, Cause of death, Data, Mortality, Policy, Statistics, Quality

Background                                                                            debates [2]. More recently, a global assessment [3] found
More than a decade ago, the Lancet series ‘Who                                        that despite increasing demand for better quality data,
Counts?’ [1] drew attention to the fact that cause of                                 particularly by the Millennium Development Goals
death (COD) statistics from Civil Registration and Vital                              (MDGs), and more recently, the Sustainable Develop-
Statistics (CRVS) systems, despite being the main source                              ment Goals (SDGs) [4], progress remains patchy.
of national and international COD information,                                          The recent emphasis on monitoring progress has pro-
often were of very poor quality, and, moreover, had im-                               duced a few assessment tools [5] but none with a spe-
proved very little over the previous half century. Only 31                            cific focus on the quality of the mortality collection
countries representing 13% of the world population had                                system and the data produced. Mikkelsen et al. [3] in
at that time data that was considered to be of reasonably                             their global analysis of CRVS systems suggested that the
good quality and fit for purpose to inform public policy                              Vital Statistics Performance Index (VSPI) [6] could yield
                                                                                      useful insights into which components of the mortality
* Correspondence: lene.mikkelsen@unimelb.edu.au                                       system are most in need of improvement efforts. Their
1
 Melbourne School of Population and Global Health, The University of
Melbourne, Carlton, Victoria 3053, Australia                                          analysis also showed that those countries experiencing
Full list of author information is available at the end of the article

                                        © The Author(s). 2020 Open Access This article is distributed under the terms of the Creative Commons Attribution 4.0
                                        International License (http://creativecommons.org/licenses/by/4.0/), which permits unrestricted use, distribution, and
                                        reproduction in any medium, provided you give appropriate credit to the original author(s) and the source, provide a link to
                                        the Creative Commons license, and indicate if changes were made. The Creative Commons Public Domain Dedication waiver
                                        (http://creativecommons.org/publicdomain/zero/1.0/) applies to the data made available in this article, unless otherwise stated.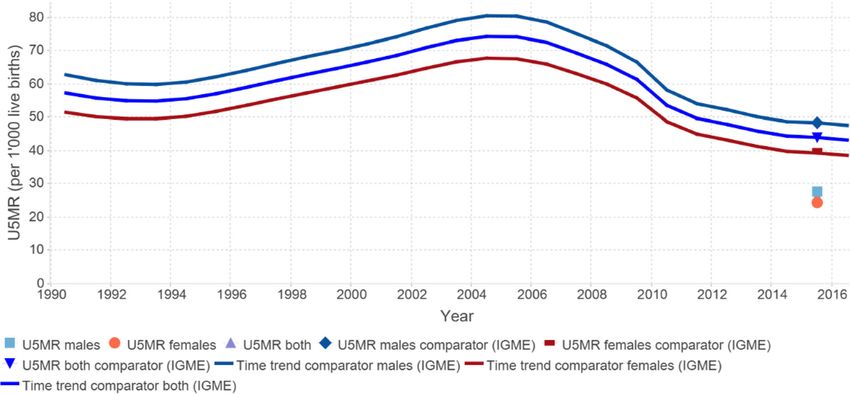
Mikkelsen et al. BMC Medicine   (2020) 18:61                                                                       Page 2 of 13

the most progress in a relatively short time were those          To better meet policy need, a more sophisticated diag-
in which there had been ‘sustained and informed gov-           nostic data quality assessment tool has been developed
ernment commitment’ [3], and where information and             and widely applied under the Bloomberg Data for Health
communications technologies were applied at the same           (D4H) Initiative at the University of Melbourne (UoM)
time. This is important, since knowledge generated from        [17]. The tool is known as ANACONDA (Analysis of
vanguard countries can be used by others to advance            Causes of National Deaths for Action) [18]. This paper de-
their systems, particularly if technical leadership and ad-    scribes the methods, structure, and concepts underlying
vice about how to improve the defined system weak-             ANACONDA and reports on its application potential in
nesses is available to them.                                   countries to guide health information system develop-
   The poor quality of global COD data is not only, as is      ments to improve mortality and COD data quality.
often assumed, due to the high proportion of deaths oc-          The technical framework and software of ANACONDA
curring in the community, away from hospitals and physi-       are described in Additional file 1.
cians. A systematic review of studies investigating the
quality of hospital death certificates [7] concluded that      Methods and standards used in ANACONDA
there were systematic and extensive misdiagnoses of COD        ANACONDA was developed to specifically assess the ac-
by physicians in hospitals. The review covered studies         curacy and completeness of mortality and COD data. It sys-
undertaken in the period 1983–2013, and all showed a           tematically takes users through a series of 10 steps and
considerable degree of misclassification of COD, varying       many sub-steps to perform arithmetic checks, calculate
between 25 and 62% for those studies that used the Inter-      rates and indicators, and, importantly, facilitate comparison
national Statistical Classification of Diseases and Related    of country data with estimates based on the ongoing Global
Health Problems (ICD), Version 10 (ICD-10) at the three-       Burden of Disease (GBD) study. The tool was developed as
digit level. Yet in many countries, hospital data are the      a key platform for improving policy data for health through
only source of information about mortality patterns;           the strengthening of national mortality reporting systems.
hence, it is imperative that the data perform to the stan-     Through support from the D4H initiative, it has been pos-
dards required to support good public policy.                  sible to conduct both national and inter-regional ANA-
   There are a few well-documented strategies and prac-        CONDA trainings for countries to teach them how to use
tical interventions that countries can use to reduce uncer-    the tool and familiarise themselves with epidemiological
tainty about what people die from. A series of                 and demographic concepts essential for mortality analysis.
recommended key actions that can help to overcome                 ANACONDA is essentially built around the data quality
some of these challenges have been proposed in a recent        dimensions which have been empirically identified by Phi-
policy brief for the Asia-Pacific Region [8]. Training of      lips et al. [6] to determine the performance of vital statistics
physicians in proper ICD COD certification as well as          systems globally in a standardised and detailed way. ANA-
training of coders has been proposed in numerous studies       CONDA also includes a summary indicator for overall data
[9, 10], and several online tools have been created over the   quality as assessed by the five components that measure the
years for both ICD certification and coding [11, 12], but      overall quality of mortality data, labelled as the Vital Statis-
little is known about their usage and impact. More re-         tics Performance Index for Quality (VSPI(Q)).
cently, for non-hospital deaths, new automated verbal aut-        ANACONDA uses global standards of disease classifica-
opsy tools have been developed that allow large-scale          tion, such as the International Statistical Classification for
application and provide reliable insight into COD pattern      Diseases and Related Health Conditions and the GBD
for community deaths [13, 14].                                 Classification, and applies common demographic and epi-
   With most evaluations and proposed pathways for vital       demiologic techniques and principles to assess the data.
statistics development found in the literature focused on      Each quality dimension is evaluated according to a series
how complete and timely the registration/reporting of          of specific analyses or sub-steps that interrogate the data,
vital events are [5], a framework to facilitate quality im-    and calculate indicators or statistics that can be compared
provement was proposed by the Health Information               with similar data drawn from the UN population esti-
Knowledge Hub at the University of Queensland in 2010          mates, the Inter-agency Group for Child Mortality Estima-
[15]. This framework was later used by the World               tion, and the GBD database. To apply ANACONDA, the
Health Organization (WHO) to develop an electronic as-         input data must be entered with ICD-10 codes (3 or 4
sessment tool, analysing mortality levels and causes-of-       digits) and compiled into 5-year age groups, except for
death (ANACoD) [16]. While ANACoD proved to be a               deaths under age 5 which are disaggregated into those oc-
useful tool to analyse mortality and COD data, experi-         curring less than 1 year of age and 1–4 years.
ence with the tool suggested that countries needed more           In the following sections, we will go through the ten
guidance to usefully assess the key drivers of poor data       steps of the ANACONDA analysis and show extracts of
quality in their systems.                                      examples using real country data from the WHO
Mikkelsen et al. BMC Medicine     (2020) 18:61                                                                   Page 3 of 13

Mortality Database for three unnamed countries from                ANACONDA uses two methods to assess complete-
three regions of the world (Latin America, Africa, and          ness. First, from the entered data, the CDR is calculated
Asia).                                                          and compared to the 30-year trend of estimated CDRs
                                                                available in the GBD database for the given country. The
                                                                GBD estimates the extent of under-reporting of deaths
Contents of the key ANACONDA steps
                                                                by applying standard death distribution methods such as
Part I: All-cause mortality
                                                                the Generalized Growth Balance, Synthetic Extinct Gen-
Step 1: Age and sex structure of population and deaths
                                                                erations, and a combination of the two, and then applies
The population age structure is crucial to correctly inter-
                                                                this adjustment factor to all adult deaths, by age, to esti-
pret mortality and COD data, since, irrespective of the
                                                                mate the number of adult deaths in each country-year
health situation of a country, the age and sex structure of
                                                                [19]. Completeness of death registration for ages 5 and
the population strongly influences the number of deaths.
                                                                under is estimated by comparing under-five mortality es-
As a reflection of the strong age dependency of mortality
                                                                timates, derived from the vital registration system, to es-
rates, countries with older populations should expect, in-
                                                                timates of under-five mortality derived independently
ter alia, higher crude death rates than countries with
                                                                from censuses and surveys. A weighted average of these
younger population age structures. ANACONDA pro-
                                                                two age group estimates of completeness is computed to
duces both population and death pyramids that allow
                                                                produce a single indicator of completeness, weighted ac-
quick visual checks of the data as well as tables with abso-
                                                                cording to the estimated number of deaths in each broad
lute numbers and percentages. Comparator data facilitate
                                                                age group, which is then applied to the input data to es-
further verification of the plausibility of the age structure
                                                                timate the ‘true’ crude death rate for any given country-
of deaths and population, and the interpretation notes that
                                                                year. ANACONDA shows this 30-year trend in the CDR
accompany each step guide users in the interpretation of
                                                                from the GBD and compares the calculated (unadjusted)
the data. Figure 1 shows three country examples of pyra-
                                                                CDR from the input data to this trend (Fig. 2). The rela-
mid output clearly demonstrating the relationship be-
                                                                tive difference between the two measures of the CDR
tween population ageing and the inverted pyramid
                                                                provides an estimate of the extent of under-registration
structure showing the number of deaths at each age.
                                                                of deaths.
                                                                   The second method used in ANACONDA to assess
Step 2: Completeness of death reporting                         completeness of death registration predicts completeness
The completeness of death reporting is closely related to       entirely from the input data, which greatly facilitates ap-
how well the data represent the population they are sup-        plication of the method for estimating completeness of
posed to describe. The crude death rate (CDR), a stand-         death registration at sub-national levels. The method is
ard indicator of population health, can also be used to         based on an empirical model of the relationship between
indicate the extent to which a vital registration system is     the observed CDR and that which would have been pre-
able to capture all deaths.                                     dicted given the level of population ageing, the level of

 Fig. 1 Examples of population age and death structure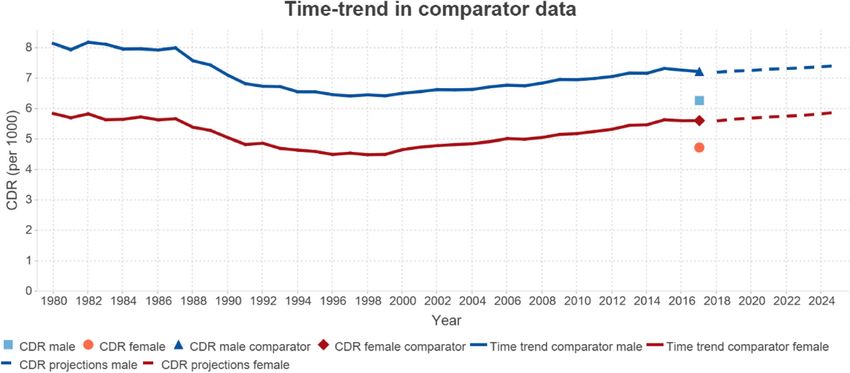
Mikkelsen et al. BMC Medicine       (2020) 18:61                                                                  Page 4 of 13

 Fig. 2 Crude death rate and time trend in the comparator data

child mortality, and the completeness of child death              Step 5: Child mortality
registration in the country [20].                                 Given the comparatively high mortality risks in the first
                                                                  few years of life, ANACONDA includes a specific focus
Steps 3 and 4: Consistency of age and sex reporting               on assessing how well deaths at these ages are being re-
Mortality is closely related to ageing with death rates           ported by calculating, from the input data, the probabil-
typically growing exponentially from around age 30.               ity of a child dying before its fifth birthday (5q0), which
Deviations from this pattern are more easily checked              can be used to estimate the extent of under-registration
by reviewing the natural log of the death rate which              of child deaths. Several studies have shown that child
should increase linearly beyond about age 30, accord-             deaths, and particularly deaths in the first week, are
ing to the Gompertz-Makeham law of mortality [21].                more likely to be undercounted than deaths at any other
ANACONDA provides this visual check as shown in                   age group [22, 23]. For countries that collect information
Fig. 3 for an example country. Further, the pattern of            on neonatal deaths, ANACONDA shows the proportion
sex differences in mortality from the reported data               of all child deaths reported as early, late, or post neo-
can be readily assessed against the comparator data.              natal deaths to better delineate the ages at which most
This can be used to review, as an example, instances              child deaths are missed. These can then be examined
of excess female mortality which is extremely uncom-              and compared to the estimated deaths at each age from
mon at any age.                                                   the GBD database. The extent of under-registration of

 Fig. 3 Age-specific mortality rates for males and females 2015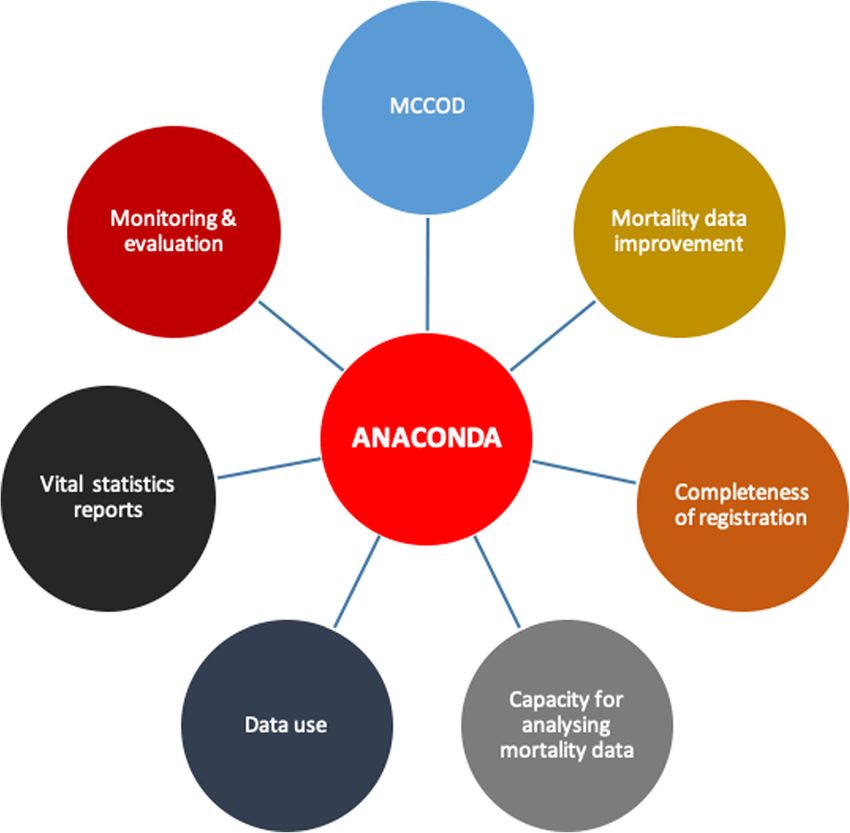
Mikkelsen et al. BMC Medicine (2020) 18:61 Page 5 of 13
Fig. 4 Child mortality indicator (5q0) 2015
child deaths is assessed by comparing the reported 5q0 showing the fraction of codes that are usable for public
with an estimated value that can be reliably calculated health purposes, those that are considered unusable for
from the large amount of data generated from census public health purposes, and those that are poorly speci-
and surveys undertaken in all countries. The UN Inter- fied, as shown in Fig. 5.
agency Group for Child Mortality Estimation (IGME) Another key step in a COD quality assessment is to
provides such annual estimates for all countries. Figure 4 investigate the distribution of deaths on the three
shows the probability of a child surviving to age 5 calcu- broad GBD disease groups ((1) communicable dis-
lated by ANACONDA, based on the registered child eases: infectious and parasitic diseases, maternal and
deaths for 2015 for an example country, compared to neonatal causes, and malnutrition; (2) non-
the point on the best fit line provided by IGME for the communicable diseases including mental health; and
country for the last 25 years. (3) external causes: accidents, homicide, suicide, war,
and natural disasters) to assess whether the observed
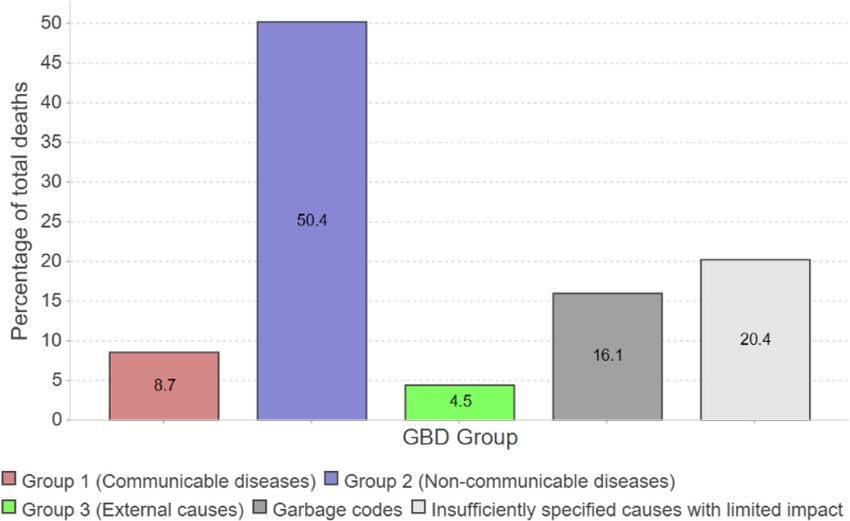
Part II: Causes of death pattern corresponds to what could be expected given
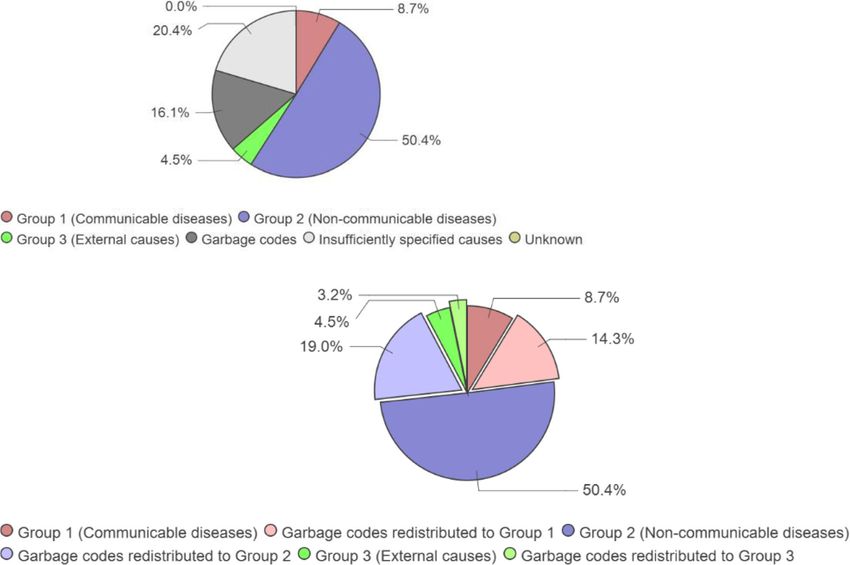
Steps 6, 7, and 8: Quality of cause of death reporting information about the country’s epidemiological tran-
Even in countries with complete or relatively complete sition. Figure 6 shows how ANACONDA distributes
recording/registration of deaths, the quality of data on the deaths across the three broad groups of health
the COD may not necessarily be reliable. According to conditions and classifies the remainder, referred to as
the ICD, the COD that should be collected for statistical ‘garbage codes’,1 into ‘unusable causes’ and ‘insuffi-
purposes is the one that led to the person dying, i.e. the ciently specified codes’. ANACONDA further calcu-
underlying cause of death (UCOD). This distinction is lates the relationship between the first two of the
important as it is not necessarily the same as the final three broad GBD cause of death groups and com-
condition or immediate or intermediate cause that led to pares this to what IHME predicts for the country as a
death. If the physicians who certify the COD do not fill measure of progress through the stages of epidemio-
in the death certificate properly and record the appropri- logical transition. The higher the proportions of the
ate UCOD, the information may be useless and will not two types of garbage codes, particularly the unusable
serve its intended purpose. cases, the higher the likelihood that the dataset is of
ANACONDA provides a detailed framework for poor quality, with serious implications for misinform-
insight into the types of causes/codes in the input data ing policy debates about health priorities and resource
that should be avoided because they cannot be a plaus- allocation.
ible UCOD and which therefore should be avoided as
they have no or very limited public policy utility. As a 1
Term used in the first GBD study [18] to describe codes that have no
first step, the usability of the input data is assessed by or little utility for policy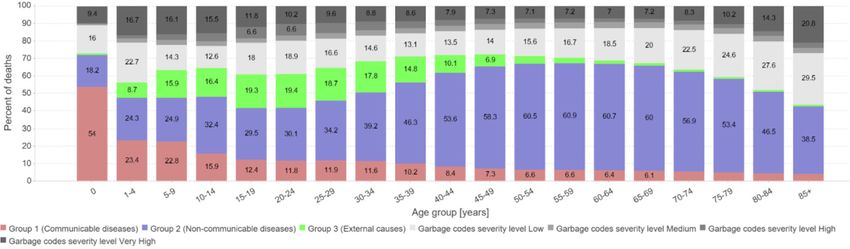
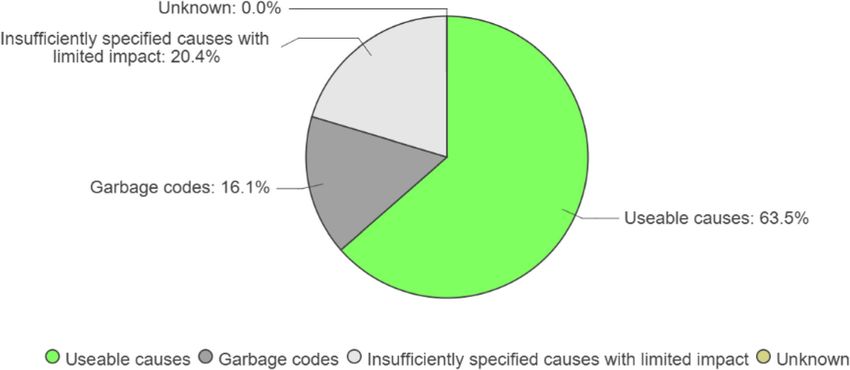
Mikkelsen et al. BMC Medicine        (2020) 18:61                                                                     Page 6 of 13

 Fig. 5 Distribution of causes of deaths by usability

  ANACONDA further provides a comparison of the                           country the significant changes to sizes of the three
distribution of deaths across the three broad cause                       broad disease groups as a result of allocating the gar-
groups, based on the input data, to what might be ex-                     bage codes to valid cause groups, reminding policy-
pected after garbage codes have been redistributed ac-                    makers of the need to proceed with caution when
cording to established GBD algorithms [22], and                           using data with high proportions of unusable and
added to the three groups. Figure 7 illustrates for a                     poorly specified codes.

 Fig. 6 Cause of death distribution on broad cause groups, and unusable and poorly specified causes
Mikkelsen et al. BMC Medicine      (2020) 18:61                                                                                         Page 7 of 13

 Fig. 7 Input cause of death data and probable distribution of the unusable and poorly specified causes

   To reduce the amount of garbage codes in the data, a                       The second typology offered by ANACONDA identi-
better understanding of what these codes are and their                     fies the causes of death that should not be used on the
frequencies is needed. ANACONDA provides suggestions                       death certificate,2 and classifies these into four impact
to that insight by classifying all the uninformative and                   levels, thereby providing guidance as to where efforts to
poorly specified causes into two different typologies—both                 eliminate these ‘garbage codes’ should be concentrated
offering valuable intelligence of the data. The first typ-                 (Table 1). For each level, the most commonly used un-
ology, based on the work by Lozano et al. [23], extracts all               usable codes are extracted to allow elimination strategies
the garbage causes and classifies these into the following                 to focus on these. Through a hierarchical process based
five groups based on ICD concepts: (1) symptoms, sign,                     on grouping similar garbage codes into packages at each
and ill-defined conditions; (2) impossible as underlying                   of the four levels, the packages are ranked in order of
causes of death; (3) intermediate causes of death; (4) im-                 importance, and the actual ICD codes which are most
mediate causes of death; and (5) insufficiently specified                  frequently used within each package are identified so
causes of death.                                                           that users can immediately see what practices are caus-
   This classification, as it is based on the type of ICD                  ing the highest amount of garbage codes. Table 2 shows
error, provides insight into the extent to which physi-                    the contents of the Sepsis package for one country. It is
cians and others who certify deaths are knowledgeable                      this detailed information that is likely to be most useful
about correct death certification practices by specifically                in guiding improvement strategies for quality of COD
showing the amount of each ICD error category in the                       reporting.
data. While it may be argued that the fifth category in                       For effective health promotion interventions, it is use-
the classification contains causes that are not incorrect                  ful to know the age pattern of death within each of the
as a COD, they do however indicate that the certifier did                  broad COD groups. ANACONDA displays this in step 8
not take the time to select a more precise diagnosis or                    for the input data together with the amount of garbage
perhaps did not understand the importance of accurately
diagnosing the cause for planning and health policy                        2
                                                                            See Improving the quality of cause of death data for public health
purposes.                                                                  policy: are all ‘garbage’ codes equally problematic? paper in this series.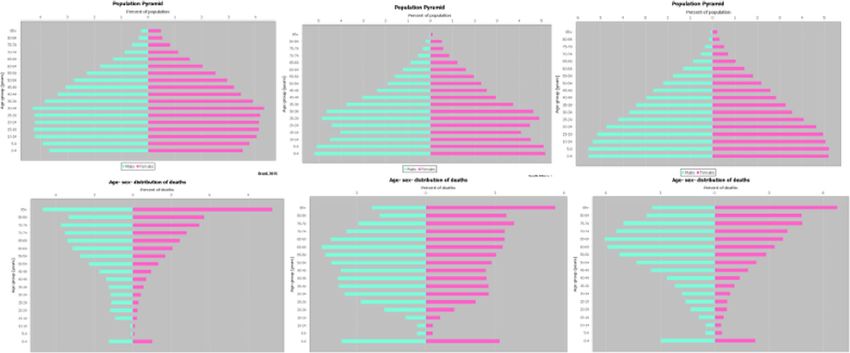
Mikkelsen et al. BMC Medicine (2020) 18:61 Page 8 of 13
Table 1 Typology of garbage codes based on severity of set with the garbage codes redistributed to the 20 lead-
impact level for policy ing causes according to complex country-specific algo-
1. Level 1 (very high)—codes with serious policy implications. rithms. The aim should be to reduce and minimise the
These are causes for which the true UCOD could belong to more than difference between the two datasets.
one broad cause group, for example, septicaemia. Such errors can
potentially grossly misinform understanding of the extent of an
epidemiological transition in a population.
2. Level 2 (high)—codes with substantial implications. These are Part III: System performance indicator
causes for which the true UCOD is likely to belong to only one or
two of the three broad groups (i.e. ‘essential (primary) hypertension’). Step 10: the Vital Statistics Performance Index for Quality
While not altering the understanding of the broad composition of The final step in ANACONDA is the calculation of a
mortality in a population, these codes can significantly affect the composite quality indicator of the input data, the
comparative importance of leading causes within broad disease
categories. VSPI(Q). This index is an adaptation of the VSPI devel-
3. Level 3 (medium)—codes with important implications. These are oped by Philips et al. [6] but based solely on the quality
causes for which the true underlying UCOD is likely to be within the components, where the timeliness dimension has been
same ICD chapter. For instance, ‘unspecified cancer’ still identifies the
death as being due to cancer and thus has some policy value, although dropped. It provides one single summary score of the
greater type (site) specificity is required as different strategies are performance of the death reporting system based on its
applied for different sites of cancer (i.e. breast versus lung). output. The score considers the essential components of
4. Level 4 (low)—codes with limited implications. These are
diagnoses for which the true UCOD is likely to be confined to a single data quality and weights these according to their import-
disease or injury category (e.g. unspecified stroke would still be assigned ance in affecting the overall utility of the data for policy
as a stroke death). The implications of unusable causes classified at this development. The five components that make up the
level will therefore generally be much less important for public policy.
index are as follows:
codes found for each age group. From decades of epi- 1. Completeness of death registration
demiological research, the disease age patterns are 2. Fraction of ‘garbage’ codes in the data
known and can be used as comparators (Fig. 8). In gen- 3. Amount of COD detail in the COD list used
eral, by far, the highest share of communicable diseases 4. Extent to which age and sex of deceased are not
is found in children, while for non-communicable dis- recorded
eases, it is in the age groups 40 and above. For ages 15– 5. Number of biologically implausible causes found in
30, the highest proportions of deaths are due to acci- the data (i.e. highly unlikely of impossible causes for
dents and injuries; these patterns should be reflected in a given age-sex category)
the data.
Regarding the weighting for the garbage codes at each
Step 9: Leading causes of disease level, we arbitrarily assumed, following Philips et al. [6],
All health information systems should, as a bare mini- that severity levels 1–3 garbage codes were, on average,
mum, be able to produce a table showing the leading only half as informative as codes classified to level 4, and
causes of death for the population to guide health policy hence, these were penalised twice as much in the overall
and priority-setting. If uninformative causes are found VSPI(Q) score.
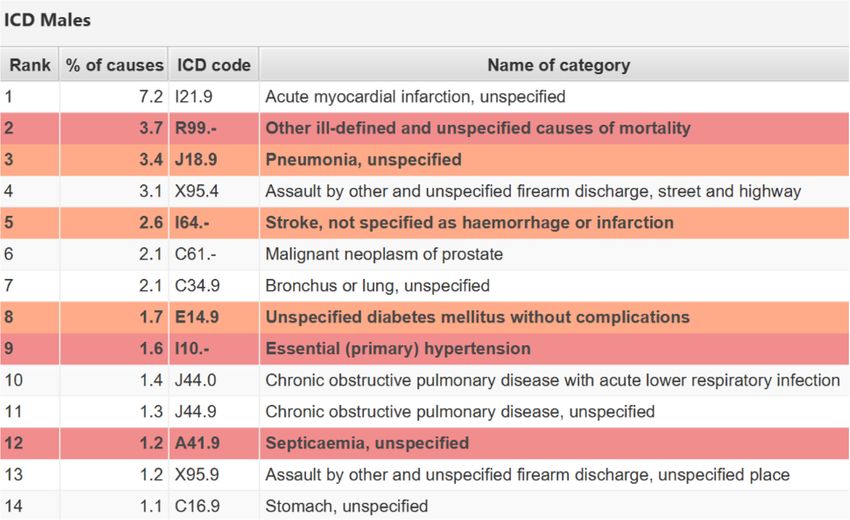
among the 20 leading causes identified by ANACONDA For policy purposes, the greater the amount of
in the input dataset, this is an indication that the dataset granularity in the COD list, the more useful the data
is partially unreliable and not fit for many policy pur- are likely to be. To score this component, the number
poses. ANACONDA uses red to indicate garbage code of distinct causes of death reported in the dataset was
categories that have the most impact on misguiding pol- compared to a standard reference list of 192 causes
icy, and those of lesser policy consequence in orange developed for the GBD study and considered as the
(see Fig. 9 for a country example). ANACONDA also minimum universe of causes which are of substantial
provides a comparator country dataset consisting of the public health interest [6]. The score was calculated by
input data compiled according to the GBD classification computing the proportion of the 192 GBD-standard
with the garbage codes shown separately, and another causes which were available in the input data. The
Table 2 Example of the contents of the Sepsis package of unusable codes
Rank ICD code Name of category Total causes
1 A41 Other septicaemia 6547
2 D65 Disseminated intravascular coagulation 242
3 R02 Gangrene, not elsewhere classified 10
4 A40 Streptococcal septicaemia 5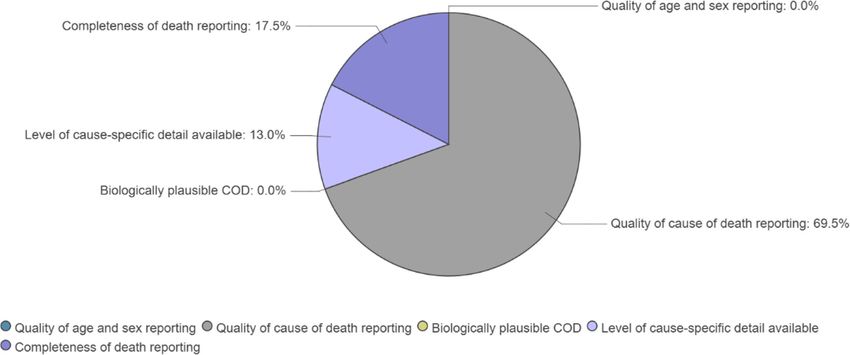
Mikkelsen et al. BMC Medicine      (2020) 18:61                                                                     Page 9 of 13

 Fig. 8 Age distribution on broad disease groups and distribution of garbage categories by age

scores for the two remaining components were simply                       gap between the observed VSPI(Q) score and the max-
calculated as proportions.                                                imum attainable (100%) (Fig. 10 shows an example
  ANACONDA weights and scores each of the five                            country).
components based on the input data and transforms the
scores according to their simulated impact on the actual                  ANACONDA usage in countries
or true cause-specific mortality fractions (CSMFs), taken                 Building a tool like ANACONDA for global use is a
as a measure of the overall policy utility of the data [6].               long process of development, testing, and feedback.
These transformed scores are then multiplied to arrive                    The tool has therefore not been publicly released on
at the overall summary score of data quality, ranging                     the CRVS Knowledge Gateway [24] of the University of
from 0 to 100%. To assist countries to focus their im-                    Melbourne, but has been widely disseminated through
provement efforts, ANACONDA also provides a con-                          training workshops. Several of the 36 countries that
venient visual graphic of the main contributors to the                    have benefitted from the ANACONDA workshops have

 Fig. 9 Leading causes of death
Mikkelsen et al. BMC Medicine        (2020) 18:61                                                              Page 10 of 13

already, like the Philippines and Brazil, integrated the       be exported as well as the cleaned data for further
tool into their annual data production process and use         manipulation outside of the tool. A prefilled template
it for checking and monitoring the quality of their data.      available at the CRVS Knowledge Gateway [24] makes
Some countries are now themselves conducting train-            it possible to produce a comprehensive annual mor-
ings of regional staff in using ANACONDA (Brazil,              tality report from the output with minimal efforts.
China, Colombia, Peru, Philippines) thereby giving local       Those who use ANACONDA regularly will appreciate
authorities an understanding of problems in their data.        the in-built monitoring function in the form of the
Increasing local awareness of quality issues in the data       VSPI(Q) that indicates whether their mortality system
is crucial, since it is at this level where most of the cor-   is improving or not changing at all, or whether they
rective action is needed to achieve overall improve-           are managing to register more deaths and missing less
ment. In China, ANACONDA has specifically been                 child deaths.
used to train officials in mortality analysis, with these        Although the main function of ANACONDA is to
officials now able to show provincial authorities the          allow countries to comprehensively assess the accur-
flaws in their data and how to solve these. The intro-         acy and completeness of their mortality and COD
duction of ANACONDA through regional workshops                 data, it can be used for many other purposes (Fig. 11).
with WHO, the United Nations Economic and Social               Apart from the user guide and resources integrated
Commission for Asia and the Pacific (ESCAP), and               into the tool, a guidance manual for assessing and
Economic Commission for Africa (ECA) has signifi-              interpreting mortality data with ANACONDA is avail-
cantly expanded its use and has led to the initiation of       able to download through the CRVS Knowledge Gate-
related improvement efforts in medical certification           way [24]. Based on the evaluations from such
and the recording of community deaths in several               trainings, conducted in many countries under D4H,
countries, among them Egypt, Iran, and Thailand.               participants who received this instruction built cap-
Given the demand for ANACONDA, we expect that                  acity to apply basic epidemiological and demographic
the tool will be made publicly available at the CRVS           concepts for analysing their datasets and conducting
Knowledge Gateway [24] before the end of the year.             mortality analysis.
                                                                 ANACONDA can also be used to inform the trainings
Discussion                                                     of physicians in correct medical certification. For each
For statistical offices and other data producers prepar-       country, it is possible to extract error patterns in certifi-
ing annual reports of vital statistics or inputs for bur-      cation and identify the exact codes that physicians mis-
den of disease studies [25], ANACONDA has much                 use. This detailed assessment of medical certification is
to offer in the form of checking the data for errors           very valuable since it is known that country practices
and inconsistencies, calculation of common mortality           differ, and hence, a training that specifically incorporates
indicators, and numerous charts and figures. The fig-          country-specific issues is likely to be more successful in
ures and tables produced by ANACONDA can easily                changing physician’s certification practices.

 Fig. 10 Priority areas for action for a country
Mikkelsen et al. BMC Medicine (2020) 18:61 Page 11 of 13 Fig. 11 The ANACONDA platform for mortality system improvement ANACONDA is very useful for those countries inter- methods since their cause lists do not provide individual ested in measuring their mortality burden. The tool al- codes. Perhaps more importantly, the comparators used lows countries to carry out a detailed and in the tool mostly come from the GBD study, which at- comprehensive audit of their mortality data, which is tempts to estimate the likely true age-sex-cause pattern critical if subsequent estimates of the burden of disease of mortality in a country after correcting for under- are to be correctly interpreted for policy purposes. registration and garbage codes. The accuracy of the For countries and users considering the application of comparators is therefore likely to vary from country to ANACONDA, there are a few limitations to keep in country, and over time, depending on the amount of and mind. The tool was developed with national datasets in reliability of the data and other information that was mind, and therefore, small datasets, typically from hospi- available on mortality and cause of death patterns for a tals for which no population at risk data exist, the steps country. involving the calculation of rates will not work. In addition, with less than 4000 deaths annually, some of Conclusions the charts may have gaps due to small numbers for some ANACONDA has already proved to be a very popular age groups. Users should also be mindful that the ana- tool for countries to assess the quality of their mortality lysis of garbage codes is based on the concept of the data—in part because it does more than quality analysis. underlying COD; hence, if reported causes are taken By making the tool user-friendly and explaining the ra- from hospital discharge forms, the garbage code analysis tionale and objectives of the various steps, users can will not be as informative as this is not the underlying quickly appreciate the importance of identifying and cause (generally only reported on the death certificate). monitoring data quality and errors. The tool empowers Because the COD data for ANACONDA must be en- users to become activists for better data, to interact tered with an ICD code, it is of limited use for VA data more effectively with medical associations and medical derived from the application of automated diagnostic schools, and to apply innovative and generally cost-
Mikkelsen et al. BMC Medicine            (2020) 18:61                                                                                                 Page 12 of 13

effective methods to increase death registration com-                               Received: 31 August 2019 Accepted: 11 February 2020
pleteness. Countries spend very substantial sums of
money each year on maintaining and expanding their
CRVS systems; it is thus important that the data outputs                            References
                                                                                    1. Setel PW et al. on behalf of the Monitoring of Vital Events (MoVE)
from those systems represent value for money and are                                    writing group. Who Counts? A scandal of invisibility: making everyone
fit for purpose. ANACONDA provides the empirical evi-                                   count by counting everyone. Lancet. 2007; 370(9598):1569–1577.
dence to ensure this accountability.                                                    Available from: http://www.who.int/healthinfo/statistics/WhoCounts1.pdf.
                                                                                        [cited 2012 Aug 22].
                                                                                    2. Lopez AD, AbouZahr C, Shibuya K, Gollogly L. Comment: Keeping count:
                                                                                        births, deaths, and causes of death. Lancet. 2007;370(9601):1744–6 Available
Supplementary information                                                               from: http://www.who.int/healthinfo/statistics/WhoCountsComment.pdf.
Supplementary information accompanies this paper at https://doi.org/10.                 [cited 2012 Aug 22].
1186/s12916-020-01521-0.                                                            3. Mikkelsen L, Phillips D, AbouZahr C, Setel PW, de Savigny D, Lozano R,
                                                                                        Lopez AD. A global assessment of civil registration and vital statistics
    Additional file 1. Software architecture, building blocks, and resources            systems: monitoring data quality and progress. Lancet. 2015;386(10001):
    included in ANACONDA.                                                               1395–406. https://doi.org/10.1016/S0140-6736(15)60171-4.
                                                                                    4. UN General Assembly. Transforming our World: The 2030 Agenda for
                                                                                        Sustainable Development. A/RES/70/1. 2015. Available from: https://
Abbreviations                                                                           www.un.org/ga/search/view_doc.asp?symbol=A/RES/70/1&Lang=E. [cited
ANACoD: Analysing mortality levels and causes of death;                                 2019 Jan 29].
ANACONDA: Analysis of National Causes of Death for Action; CDR: Crude               5. World Health Organization and University of Queensland. Strengthening
death rate; COD: Cause of death; CRVS: Civil Registration and Vital Statistics;         civil registration and vital statistics for births, deaths and causes of death:
ECA: United Nations Economic Commission for Africa; ESCAP: United Nations               resource kit. 2013. Available from: http://apps.who.int/iris/bitstream/handle/1
Economic and Social Commission for Asia and the Pacific; GBD: Global                    0665/78917/9789241504591_eng.pdf;jsessionid=1304B2762C4810214A943B1
Burden of Disease; ICD: International Classification of Diseases and Related            C52CB5A84?sequence=1. [cited 2019 Jan 29].
Health Problems; ICD-10: International Classification of Diseases and Related       6. Philips DE, Lozano R, Naghavi M, Atkinson C, Gonzales-Medina D, Mikkelsen
Health Problems–Version 10; ICT: Information and communications                         L, Murray CJL, Lopez AD. A composite metric for assessing data on mortality
technology; IGME: Interagency Group for Child Mortality Estimation;                     and causes of death: the Vital Statistics Performance Index. Popul Health
IHME: Institute for Health Metrics and Evaluation; MDGs: Millenium                      Metrics. 2014;12(14):2–30. https://doi.org/10.1186/1478-7954-12-14.
Development Goals; SDGs: Sustainable Development Goals;                             7. Rampitage R, Mikkelsen L, Hernandez B, Riley I, Lopez AD. Systematic review
UCOD: Underlying cause of death; VSPI: Vital Statistics Performance Index;              of hospital-based cause-of-death statistics: strengthening evidence for
VSPI(Q): Vital Statistics Performance Index for Quality; WHO: World Health              policy makers. Bull World Health Organisation. 2014;92:807–16 Available
Organization                                                                            from: https://www.ncbi.nlm.nih.gov/pmc/articles/PMC4221770/.
                                                                                    8. Mikkelsen L, Rampitage R, Hernandez B, Lopez AD. Strengthening vital
                                                                                        statistics systems: what are the practical interventions necessary to reduce
Authors’ contributions                                                                  ignorance and uncertainty about causes of death and disease burden in the
LM and ADL conceptualised the manuscript, developed the analytical                      Asia Pacific region. Policy brief. World Health Organisation on behalf of the
framework, drafted earlier versions of the manuscript, and contributed to the           Asia Pac Observatory Health Syst Policies II. 2014;3(2) Available from: http://
final version of the manuscript. KM participated in drafting earlier versions of        apps.who.int/iris/bitstream/10665/208224/1/9789290616870_eng.pdf?ua=1.
the manuscript, and contributed to the final version of the manuscript. MH              [cited 2019 Jan 29].
developed the ANACONDA software, edited earlier versions of the                     9. Yang GH, Hu J, Kequin R, Ma J, Rao C, Lopez AD. Mortality registration and
manuscript, and contributed to the final version of the manuscript. All                 surveillance in China: history, current situation and challenges. Popul Health
authors have read and approved the final manuscript.                                    Metrics. 2005;3:3–9. https://doi.org/10.1186/1478-7954-3-3.
                                                                                    10. Carter KL, Williams G, Tallo V, Sanvictores D, Madera H, Riley I. Capture-
                                                                                        recapture analysis of all-cause mortality data in Bohol, Philippines. Popul
Funding
                                                                                        Health Metrics. 2011;9:9 Available from: https://www.ncbi.nlm.nih.gov/pmc/
This study was funded under an award from Bloomberg Philanthropies to
                                                                                        articles/PMC3096587/. [cited 2019 Jan 29].
the University of Melbourne to support the Data for Health Initiative. The
                                                                                    11. World Health Organisation. ICD-10 interactive self learning tool: World
funders had no role in the study design, data collection and analysis,
                                                                                        Health Organisation. Available from: http://apps.who.int/classifications/apps/
decision to publish, or preparation of the manuscript.
                                                                                        icd/icd10training/. Accessed 26 Feb 2020.
                                                                                    12. ICD-10 Code look-up. ICD10Data.com. Available from: https://www.icd1
Availability of data and materials                                                      0data.com/. Accessed 26 Feb 2020.
Not applicable.                                                                     13. Serina P, Riley I, Stewart A, James SL, Flaxman AD, Lorano R, et al. Improving
                                                                                        performance of the Tariff Method for assigning causes of death to verbal
                                                                                        autopsies. BMC Med. 2015;13:291. https://doi.org/10.1186/s12916-015-0527-9.
Ethics approval and consent to participate                                          14. Serina P, Riley I, Stewart A, Flaxman A, Lozano R, Mooney M, et al. A
Not applicable.                                                                         shortened verbal autopsy instrument for use in routine mortality
                                                                                        surveillance systems. BMC Med. 2015 Dec 16;13:302. https://doi.org/10.1186/
Consent for publication                                                                 s12916-015-0528-8.
Not applicable.                                                                     15. AbouZahr C, Mikkelsen L, Rampatige R, Lopez AD. Mortality statistics: a tool
                                                                                        to enhance understanding and improve quality. HISHub, School Popul
                                                                                        Health, Univ Queensland. 2010;13 Available from: https://pdfs.
Competing interests                                                                     semanticscholar.org/2a8a/fbfe615b248ec8af5e5201dbe909fc8ff0f5.pdf. [cited
The authors declare that they have no competing interests.                              2012 Aug 22].
                                                                                    16. World Health Organization. Analysing mortality levels and causes-of-death
Author details                                                                          (ANACoD) electronic tool: Department of Health Statistics and Information
1
 Melbourne School of Population and Global Health, The University of                    Systems. Geneva: World Health Organization; 2011. Available from: https://
Melbourne, Carlton, Victoria 3053, Australia. 2Institute of Public Health, Aarhus       www.who.int/healthinfo/anacod/en/.
University, Aarhus, Denmark. 3Swiss Tropical and Public Health Institute,           17. Lopez AD, Setel P. Better health intelligence: a new era for civil registration
University of Basel, Basel, Switzerland.                                                and vital statistics? BMC Med. 2015;13:73.
Mikkelsen et al. BMC Medicine (2020) 18:61 Page 13 of 13
18. Mikkelsen L, Lopez AD. Guidance for assessing and interpreting the quality
of mortality data using ANACONDA. School of Population and Global
Health at the University of Melbourne; 2017. Available from: https://
crvsgateway.info/file/5179/56.
19. Murray CJ, Lopez AD. Alternative projections of mortality and disability by
cause, 1990-2020: Global Burden of Disease Study. Lancet. 1997;349(9064):
1498–504. https://doi.org/10.1016/S0140-6736(96)07492-2.
20. Adair T, Lopez AD. Estimating the completeness of death registration: an
empirical method. PLoS One. 2018;13(5):e0197047. https://doi.org/10.1371/
journal.pone.0197047.
21. Gompertz B. On the nature of the function expressive of the law of human
mortality, and on a new mode of determining the value of life
contingencies. Philos Trans R Soc. 1825;115:513–85. https://doi.org/10.1098/
rstl.1825.0026.
22. Naghavi M, Makela S, Foreman K, O'Brien J, Pourmalek F, Lozano R.
Algorithms for enhancing public health utility of national causes-of-death
data. Popul Health Metr. 2010;8:9.
23. Lozano R, Naghavi M, Foreman K, Lim S, Shibuya K, Aboyans V, et al. Global
and regional mortality from 235 causes of death for 20 age groups in 1990
and 2010: a systematic analysis for the Global Burden of Disease Study
2010. Lancet. 2013;380(9859):2095–128. https://doi.org/10.1016/S0140-
6736(12)61728-0.
24. University of Melbourne and Bloomberg Philanthropies Data for Health
Initiative. CRVS Knowledge Gateway. 2019. Available from: https://
crvsgateway.info.
25. Roth GA et al. Global, regional and national age-sex specific mortality for
282 causes of death, 1980–2017: a systematic analysis for the Global Burden
of Disease Study 2017. Lancet. 2018;392:1736–8588.
Publisher’s Note
Springer Nature remains neutral with regard to jurisdictional claims in
published maps and institutional affiliations.You can also read


