A New Zealand Local Population Database - July 2017 By John Polkinghorne - NZAE
←
→
Page content transcription
If your browser does not render page correctly, please read the page content below
A New Zealand
Local Population Database
July 2017

By John Polkinghorne
A New Zealand Local Population Database
John Polkinghorne
July 2017 (version 1.0)
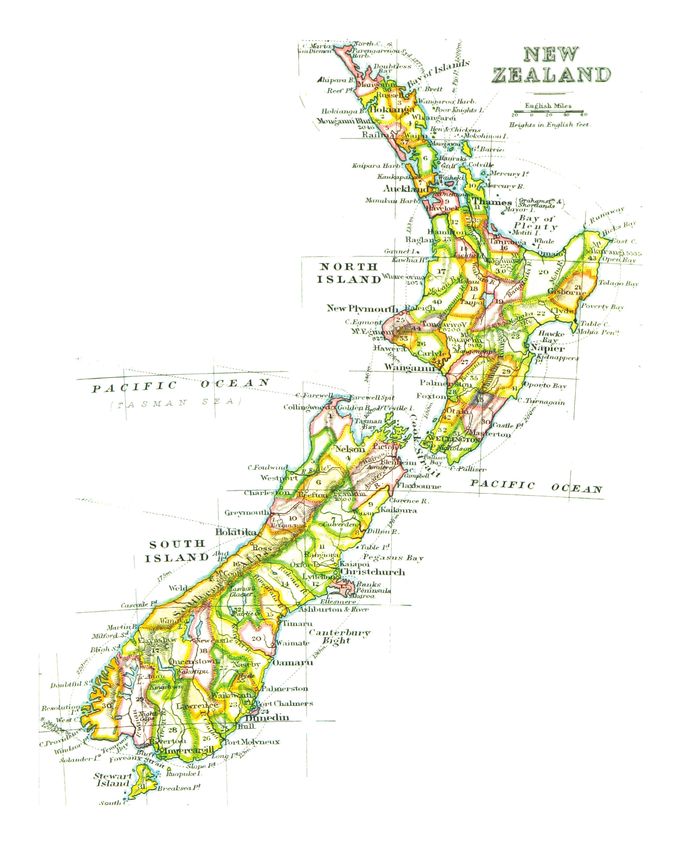
Front cover image: adapted from an 1899 map, initially published in "British
Possessions and Colonies. [With maps.]" and retrieved
from https://www.flickr.com/photos/britishlibrary/11254066744
Abstract
This paper builds on an approach first used by Grimes and Tarrant (2013). It relies
primarily on digitised editions of the New Zealand Official Yearbook, building a local
population database which covers the entirety of New Zealand.
Where Grimes and Tarrant (2013) cover 60 major towns and cities over an 80-year
period, the New Zealand Local Population Database (NZLPD) covers more than 260
defined urban areas and rural centres over a 120-year period from 1891 through to
2013.
Unlike previous work, this paper also provides information for administrative
regions and territorial authorities. As such, it represents a new wealth of information
on long-term population trends, for both urban and rural areas. New Zealand's
population grew from 670,000 to 4.35 million over the timeframe studied.
The database reflects economic and social changes across New Zealand since the late
19th century, and the differing patterns of development across different regions.
Acknowledgements
The author would like to acknowledge the encouragement and support of Dr Arthur
Grimes. Dr Grimes’ 2013 paper with Nicholas Tarrant was a major inspiration for the
current study. Thanks are also due to Brian Osborne at Auckland Council and
Rosemary Goodyear at Statistics New Zealand for helpful discussions and additional
data.
Any mistakes or errors are of course the sole responsibility of the author.
Suggestions, corrections or other feedback are welcomed.
Author contact details
John Polkinghorne
Associate Director, RCG Limited
E: john.p@rcg.co.nz
T: 09 303 1501
RCG | CONSTRUCTIVE THINKING. DELIVERED A NEW ZEALAND LOCAL POPULATION DATABASE
JULY 2017 (VERSION 1.0) 1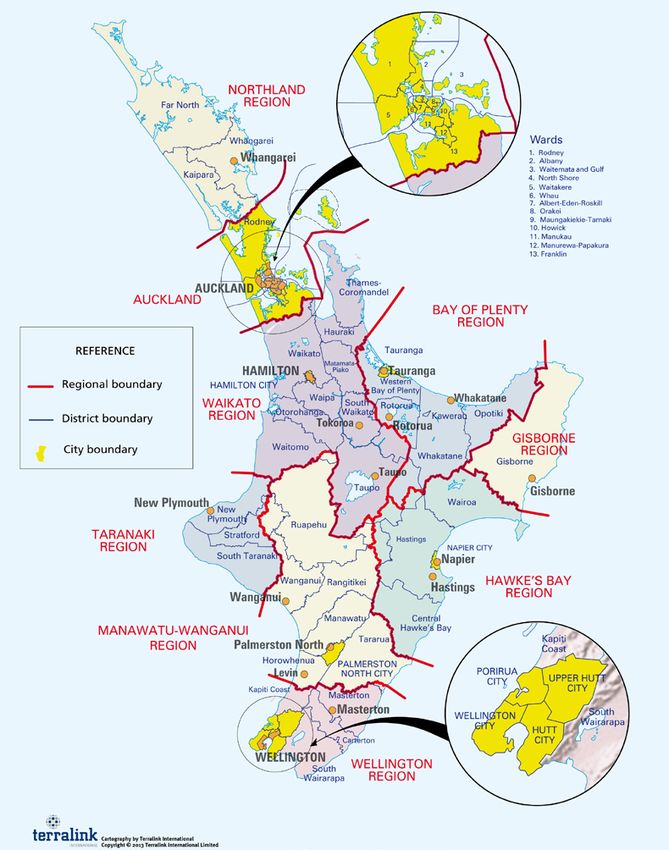
Contents
1.     Introduction .................................................................................................. 3
2.     Prior Literature and Data Series ..................................................................... 4
     2.1.    Population Growth in the North and South Islands .................................. 4
     2.2.    International Migration .......................................................................... 5
     2.3.    Urban Population Growth ...................................................................... 6
3.     Methodology and Important Notes ................................................................. 7
     3.1.    The New Zealand Local Population Database .......................................... 8
     3.2.    Data Sources .......................................................................................... 9
     3.3.    Data Breaks and Discontinuities............................................................ 10
     3.4.    Scaling and Adjustments ...................................................................... 10
     3.5.    Population Measures ............................................................................ 11
     3.6.    Maori .................................................................................................. 12
     3.7.    Census Frequency ................................................................................ 12
4.     Urban Areas ................................................................................................ 13
     4.1.    Urban Areas ......................................................................................... 13
     4.2.    Rural Centres ....................................................................................... 14
     4.3.    Scaling Urban Area Populations ............................................................ 14
5.     Administrative Areas ................................................................................... 16
     5.1.    Local Government Boundaries since 1989 ............................................. 16
     5.2.    Local Government Boundaries 1876-1989 ............................................ 17
6.     Discussion ................................................................................................... 20
     6.1.    New Zealand’s Urban Population in 2013.............................................. 20
     6.2.    Urban Drift .......................................................................................... 21
     6.3.    Urban Area Consistency and Population Density ................................... 22
     6.4.    Maori Population Geography ................................................................ 24
     6.5.    Auckland’s Prominence ........................................................................ 26
     6.6.    The Southland and Taranaki Turnarounds ............................................ 28
     6.7.    Conclusions ......................................................................................... 29
7.     References .................................................................................................. 31

RCG | CONSTRUCTIVE THINKING. DELIVERED                                A NEW ZEALAND LOCAL POPULATION DATABASE
                                                                                         JULY 2017 (VERSION 1.0)           2
1. Introduction
New Zealand has experienced uninterrupted population growth over the last 125
years, growing from fewer than 700,000 people in 1891 to nearly 4.7 million today.
The rate of growth has fluctuated through the years, with changes in birth and death
rates, migration, and two world wars all playing a part.
Although long-term population statistics are available at the national level, they are
very hard to obtain for more local areas. Stats NZ (2015) notes that “over time, New
Zealand has had many different geographical classifications, which makes it difficult
to compare population change at a regional level”. The New Zealand Local
Population Database (NZLPD) aims to address this difficulty.
Our work collects information on ‘urban areas’ – towns and cities – as well as local
government boundaries, i.e. territorial authorities and regions. In many cases,
information can be provided as far back as 1891 on a reasonably consistent basis.
Our hope is that the NZLPD will be useful to researchers in a range of fields, as well
as to councils and New Zealanders generally. In the last century, New Zealand has
changed and grown more than almost every other developed country. Population
changes, such as urbanisation and the “northward drift” of the 20th century, give a
window into how life in New Zealand has changed. In the absence of detailed
regional economic information, 1 they provide a starting point for looking at how our
economy has changed in different parts of the country. Over long time periods,
differences in population growth are likely to reflect differences in economic growth,
at least in part.
We intend to further expand and revise the NZLPD in the future. It will be updated
as new censuses are undertaken, with the next one scheduled for March 2018. The
files published together with this paper constitute version 1.0 of the database, and
any future updates will also be publicly available.
1It is only recently that ‘official’ regional GDP estimates have been produced, but a wide variety of other
economic indicators are available at the regional level. Even so, it is difficult to find consistent regional data
going back more than 20 years or so.
RCG | CONSTRUCTIVE THINKING. DELIVERED A NEW ZEALAND LOCAL POPULATION DATABASE
JULY 2017 (VERSION 1.0) 32. Prior Literature and Data Series
2.1. Population Growth in the North and South Islands
Stats NZ (2015) bring together some long-term population data in their A Century of
Censuses database. The focus is on national-level data, but some information is also
available for the North and South Island and for 13 statistical districts.
Figure 2.1: Census Night Populations for the North and South Islands, 1891-2013
4,500,000
4,000,000
Census Night Population
3,500,000
3,000,000
2,500,000
2,000,000
1,500,000
1,000,000
500,000
0
Census Year
North Island South Island
Source: Stats NZ (2015)
This database, containing census information back to 1858, shows that the South
Island had a larger population than the North Island until the last years of the 19th
century. However, in percentage terms, the North Island grew more rapidly than the
South in the 1880s and 1890s. It continued to outpace the South Island’s growth
throughout the 20th century.
The “statistical districts” described in Stats NZ (2015) are based on New Zealand’s
old provincial boundaries. Although the provincial system was only in force from
1853-1876, information continued to be collected on the populations for these
former areas – for convenience, rather than for any administrative function. To
provide more detail, some of the areas were split. For example, the Auckland
province, which had covered most of the upper North Island, was split into four: the
Northland, Central Auckland, East Coast and South Auckland–Bay of Plenty
statistical districts.
These statistical districts are often similar to modern administrative regions.
However, the information available is very limited. Stats NZ (2015) only show
rounded population densities for the statistical districts, so it is only possible to get a
RCG | CONSTRUCTIVE THINKING. DELIVERED A NEW ZEALAND LOCAL POPULATION DATABASE
JULY 2017 (VERSION 1.0) 4rough idea of their actual populations. Data is only available back to 1926 for the
districts which were split, such as the Auckland ones above, and supporting data
such as maps of the statistical districts’ boundaries is difficult to locate.
2.2. International Migration
Migration has always been a key factor in New Zealand’s population growth. New
Zealand has comprehensive long-term statistics on migration (Statistics New
Zealand, 2010), and articles such as Philips (2005) provide extra context: migration
flows over the years have depended on government policy as much as economic
factors. This has included policies which explicitly favoured certain countries and
nationalities over others, and government-assisted immigration for certain groups.
The figure below shows New Zealand’s annual “natural increase”, or births minus
deaths, and “net migration”, or international immigration minus emigration, for
1860-2009:
Figure 2.2: Components of Population Growth, 1860-2009
Source: Statistics New Zealand (2010)
Net migration has been positive for most years since 1891. It turned negative in the
1930s as the Depression hit, but was strongly positive for almost all years between
1949 and 1975. However, the “baby boom” which was happening at the same time
meant that migration only accounted for a little over a quarter of New Zealand’s
growth in this period.
Net migration was negative over 1976-1989, to such an extent that New Zealand as
a whole actually experienced population decline for one or two years. Immigration
was liberalised in the late 1980s and early 1990s, to focus “selection of immigrants
on personal merit rather than national or ethnic origin” (Philips, 2005). Since 1990,
net migration has again been generally positive.
RCG | CONSTRUCTIVE THINKING. DELIVERED A NEW ZEALAND LOCAL POPULATION DATABASE
JULY 2017 (VERSION 1.0) 52.3. Urban Population Growth
During the 20th century, cities emerged as the growth engines of most developed
economies. They also dominated population growth, and continue to do so as
discussed in section 6.2.
Grimes & Tarrant (2013) compiled population series for 60 of New Zealand’s largest
towns and cities over 1926-2006, in A New Zealand Urban Population Database. This
paper was a major step forward for showing how populations had grown in different
parts of the country. Although no nationwide comparisons are made in the paper,
New Zealand is primarily an urban nation, and the Grimes & Tarrant (2013)
database covers around 75% of New Zealand’s population in 2006, and 87% of its
growth over 1926-2006.
Grimes et al (2014) built on this earlier work to explore the links between urban
population growth and other factors. These included infrastructure, wages and
amenity. They concluded that “four dominant factors have impacted positively on
urban growth, especially since 1966: local land use capability, sunshine hours,
human capital and proximity to major population centres, especially Auckland”. The
paper suggests that policymakers could boost urban population growth through
investing in human capital, and investing in transport links to major cities. It also
noted that “policy should at least facilitate, and certainly not overly constrain, the
size of New Zealand’s most productive city; otherwise the risk is that growth will
increasingly be located in Australia’s four largest cities rather than in Auckland and
its surrounding region”.
RCG | CONSTRUCTIVE THINKING. DELIVERED A NEW ZEALAND LOCAL POPULATION DATABASE
JULY 2017 (VERSION 1.0) 63. Methodology and Important Notes
The studies cited above give some information on how local populations have
changed over time, but they do not provide detailed nationwide coverage. The New
Zealand Local Population Database (NZLPD) aims to fill this knowledge gap.
To create their population series for towns and cities over 1926-2006, Grimes &
Tarrant (2013) utilised the New Zealand Official Yearbook produced by Stats NZ and
its predecessor the Department of Statistics. These yearbooks have been digitised for
the entire period from 1893 to 2012, making data extraction reasonably
straightforward. The yearbooks are an incredibly rich data source, for demography
and a wide range of other topics.
When the current study began, the intent was to simply update Grimes & Tarrant
(2013) to incorporate information from the 2013 census. However, we decided early
on to use different methods of compiling and scaling the data.
More importantly, it became apparent that Stats NZ’s yearbooks also contained a
wealth of other population information, and census publications held even more
information. We have drawn on some of this additional data to create the NZLPD. As
well as showing the changing populations of towns and cities across New Zealand
back to 1891, the NZLPD also provides information for various other local areas:
past and present administrative areas, “provincial districts”, and so on.
Although this study was inspired by Grimes and Tarrant (2013), it has been carried
out as a completely separate piece of research. As with the earlier paper, we have
gone directly to Stats NZ yearbooks and other publications for the data. In
particular, key differences from Grimes and Tarrant (2013) include:
• Data is provided for all censuses between 1891 and 2013, i.e. generally at five-
year rather than ten-year intervals;
• Data is based on 2013 boundaries wherever possible;
• We have taken a different approach to scaling and addressing discontinuities;
• “Census night population” figures have been used throughout, rather than the
“usually resident population” which now forms New Zealand’s official
population measure;
• We include council areas (regions and territorial authorities) to provide
complete coverage across New Zealand, not just towns and cities.
RCG | CONSTRUCTIVE THINKING. DELIVERED A NEW ZEALAND LOCAL POPULATION DATABASE
JULY 2017 (VERSION 1.0) 73.1. The New Zealand Local Population Database
This paper discusses the background to the NZLPD, as well as some interesting
results from the database. However, it should be read in conjunction with the data
files themselves, which are the main output of this work. The NZLPD data file is in
Microsoft Excel XLSX format and includes the following sheets or tabs:
• Intro. This sheet includes version details, important notes and comments on
data sources;
• Figures. This sheet includes figures which have been reproduced in this paper,
along with the raw data behind them;
• Urban Areas. This sheet includes our “final” data for towns and cities across
New Zealand;
• Regions and TAs. This sheet includes our “final” data for regions and territorial
authorities across New Zealand;
• Raw data – Urban Areas. This sheet includes raw data from yearbooks and
census publications, covering defined “urban areas” only;
• Raw data – Pre-1989 Towns. This sheet includes raw data from yearbooks and
census publications, covering all towns which were administratively defined
prior to 1989;
• Raw data – Pre-1989 Counties. This sheet includes raw data from yearbooks,
covering all counties which existed prior to 1989;
• Raw data – Maori 1896-1911. This sheet includes raw data from yearbooks,
showing the geographic spread of the Maori population during these years;
• Concordance. This sheet shows how modern region and territorial authority
boundaries relate to former county boundaries.
We note that the spreadsheets have not been formatted for printing.
We also note that the “final” data often contain formulas which refer back to cells in
the raw data sheets. This has been done to make it easier to see where data has come
from, any adjustments that have been made, etc. If moving or transferring the data
into other spreadsheets, we suggest pasting "values" or text, rather than "formulas".
Essentially, the NZLPD includes information on two different types of areas: urban
areas, and council areas. These two types of area have quite different data
characteristics and issues. Urban areas are much more straightforward. The main
issue is how to scale the population figures. As a secondary issue, information for
many smaller towns is only available for the last 30 or 50 years.
Council areas – regions and territorial authorities – are more complex. The main
issue is how to apportion populations to modern-day council areas, using county
information which in some cases is based on drastically different boundaries, as well
as mergers, splits and boundary changes over more than a century (1891-1989) for
RCG | CONSTRUCTIVE THINKING. DELIVERED A NEW ZEALAND LOCAL POPULATION DATABASE
JULY 2017 (VERSION 1.0) 8which we have data. Fortunately, our data is generally accurate to least at the
regional level, which is the most likely level for economic analysis. For many
territorial authorities, we believe the data is quite accurate over the entire timeframe
of this study. We have noted where this is not the case.
3.2. Data Sources
All information in the NZLPD is ultimately sourced from censuses, carried out by
Stats NZ and its predecessor agencies. Generally, our data has come from four
different kinds of publication:
• Most data for years prior to 1986 is compiled from editions of the New Zealand
Official Yearbook;
• We have also referred to some census publications directly in order to extend
data for some smaller towns; 2
• Data for 1986-1991 has been retrieved from 1996 census tables (Stats NZ,
1997). These use 1996 area unit boundaries, which we have approximated to
2013 boundaries as closely as possible;
• Data for 1996-2013 has been retrieved from NZ.Stat tables (Stats NZ, 2014).
These use 2013 area unit boundaries.
Many of these data cover overlapping years, which provides an opportunity to check
their consistency. The “raw data” sheets in the NZLPD show our efforts to compare
overlapping data.
We have also relied on other Stats NZ information, including urban/ rural
concordances and land areas. As an excellent starting point for viewing current
boundaries, we recommend Stats NZ’s Geographic Boundary Viewer. 3 This
interactive map includes all urban areas, territorial authorities and regions.
The Geographic Boundary Viewer does not extend to the counties, boroughs and
other areas which existed prior to 1989, and we have reviewed a number of historic
maps to align pre-1989 boundaries as closely as possible with current ones. This is
especially important for our work on territorial authorities and regions.
Ironically, some long-term data was more accessible in the pre-digital era than it is
today. For example, a key data source for the NZLPD is a table published as part of
the 1981 census, and containing population information for 37 urban areas over the
55-year period between 1926 and 1981 (Department of Statistics, 1982). These
tables and others like them have never been digitised; part of our work for this paper
21986 census publications include ‘area unit’ population figures for 1976-1986, and those from the 1976
census include figures for 1966-1976 (Department of Statistics, 1977/ 1987). We have used these to extend
the data series for towns not covered in editions of the New Zealand Official Yearbook.
3 http://www.stats.govt.nz/StatsMaps/Home/Boundaries/geographic-boundary-viewer.aspx
RCG | CONSTRUCTIVE THINKING. DELIVERED A NEW ZEALAND LOCAL POPULATION DATABASE
JULY 2017 (VERSION 1.0) 9has been collating similar pre-digital data, and matching them as closely as possible
with urban area and local authority boundaries as they are defined today.
3.3. Data Breaks and Discontinuities
We have endeavoured to provide consistent data wherever possible. However, some
data breaks and discontinuities have been impossible to avoid. In the NZLPD data
tables, we have signalled this by putting numbers prior to the data break in italics, or
highlighting them in yellow for more significant breaks. These older figures should
be treated with caution.
All data can be affected by changes in area definitions. For example, counties and
boroughs often had boundary changes during the 1876-1989 period where this
system of local government was used. Boroughs were typically expanded over time,
whereas counties amalgamated, split or were subjected to other shifts. The “raw
data” sheets in the NZLPD include information on land areas (in square kilometres)
to aid in identifying discontinuities. 4
New Zealand’s current system of regions and territorial authorities is quite different
from the previous system of counties and boroughs. For some parts of the country,
substantial data breaks arise in the process of switching from the old to the current
system, affecting data prior to 1986. We have endeavoured to apportion population
to the current areas as closely as possible.
One issue affecting all data prior to 1926 (and some data for 1926) was that Maori
were excluded, as explained in section 3.6 below.
For urban areas specifically, data breaks can arise from switching from ‘borough’ to
‘urban area’ data, or when the urban area is redefined. These breaks typically relate
to expansions. For most towns, we consider them to be reasonably insignificant over
the longer term.
3.4. Scaling and Adjustments
Given the presence of data breaks as explained above, there is a need to ‘adjust’ some
raw data to approximate today’s boundaries. We have attempted to be as
transparent as possible about this, providing “raw data” and concordance sheets,
and using formulas in our final data which link back to the raw data.
For urban areas, the process is generally one of “scaling”, usually scaling older
figures upwards. We have not scaled the figures where the data breaks seem to be
negligible, and we have not scaled the figures for smaller urban areas.
4It appears that many of the differences in land area from one census to the next are the result of measurement
differences, rather than changing boundaries. The land area data should be used with caution, and only major
changes in the area figures should be seen as indicative of boundary changes.
RCG | CONSTRUCTIVE THINKING. DELIVERED A NEW ZEALAND LOCAL POPULATION DATABASE
JULY 2017 (VERSION 1.0) 10For regions and territorial authorities, the process is generally one of
“apportionment”. This is inherently more difficult, and means that the data for some
council areas may become less accurate the further back it goes.
For example, the former Vincent County is now split between the Central Otago and
Queenstown-Lakes Districts. There were two boroughs within the (geographic)
county, Alexandra and Cromwell, both of which are now part of the Central Otago
District and have had their populations allocated accordingly. Of the remaining
population, we estimate that 90% of the population in 1986 was within the Central
Otago District, and assume that that ratio remained the same as far back as 1891.
This is likely to be a reasonable assumption for 1981 say, but the uncertainty
increases for older years.
3.5. Population Measures
Since the 1996 census, the standard population measure for New Zealand has been
the “usually resident population”: people who were in New Zealand on census night
and who usually reside there.
Prior to the 1996 census, the standard population measure for New Zealand was ‘de
facto’ or ‘census night’ population. This is a count of all people in New Zealand on
census night, including both residents and overseas visitors. 5
Stats NZ (2015) shows both the census night population and the usually resident
population for New Zealand over 1986-2013. The gap between the two measures
has gradually increased over this period, due to the growing importance of tourism.
In 1986, the night population was just 1.0% larger than the usually resident
population, but by 2013 the gap had grown to 2.6%.
Since information on the usually resident population is only available for the last
thirty years, and census night population is available for the entire 1891-2013 period
covered by this study, we have elected to use census night population throughout
our database.
This approach contrasts with Grimes and Tarrant (2013) who use usually resident
population for more recent years. Their approach involves a small ‘data break’ in the
process of switching from census night population to usually resident population,
although as outlined above, the differences are small.
5People who live in one part of New Zealand but are staying in another part on census night are allocated to
their area of usual residence. As such, census night population figures for any area are always at least as large
as the usually resident population for that area. The difference between the two measures is generally small.
RCG | CONSTRUCTIVE THINKING. DELIVERED A NEW ZEALAND LOCAL POPULATION DATABASE
JULY 2017 (VERSION 1.0) 113.6. Maori
For all censuses up to and including 1945, separate censuses were carried out for the
Maori and non-Maori population. The two censuses would be carried out in the
same year, and usually in the same month, so in theory they should be reasonably
comparable – but Stats NZ do note difficulties in enumerating the Maori population,
especially in earlier censuses.
Editions of the New Zealand Official Yearbook prior to 1927 provide detailed
geographic information for the non-Maori population, but only limited information
for the Maori population. Editions from 1928 onwards show figures for the total
population, including Maori.
Unfortunately, the 1927 edition is the only one to provide 1926 census results, and it
does so only for the non-Maori population. The 1928 edition instead shows
“population estimates” for 1927, which do include Maori. Unlike modern population
estimates, these figures did not adjust for census undercount, and are essentially
what Stats NZ would have expected to find if they had carried out a census on this
date.
To give a more complete picture, we have shown both the 1926 census results
(excluding Maori) and the 1927 estimates (for the total population). More complete
data may be available from other sources, but this will have to wait for future
research.
As such, NZLPD population figures for earlier years (1891-1921, and 1926 in many
cases) exclude Maori. All figures for more recent years include both Maori and non-
Maori. This causes a ‘data break’ in the series. However, as explained in section 6.4
below, the Maori population prior to 1926 was concentrated in a few parts of the
country, such that Maori made up only a small share of the population in other
places (and most urban areas).
3.7. Census Frequency
With very few exceptions, censuses have been carried out in New Zealand every five
years since 1881, which of course includes the entire Database period. Censuses are
generally undertaken in March or April, so in most cases the time between them is
very close to five years (Statistics New Zealand, 2013a).
The most significant breaks in this pattern were two cancellations due to depression
and world war (in 1931 and 1941), and the recent 2013 census, postponed from
2011 due to the Canterbury earthquakes. Censuses were held in April 1926, March
1936 (a 10-year gap), and September 1945 (a 9.5-year gap, with what would have
been the 1946 census essentially brought forward by six months to provide more
timely information).
RCG | CONSTRUCTIVE THINKING. DELIVERED A NEW ZEALAND LOCAL POPULATION DATABASE
JULY 2017 (VERSION 1.0) 124. Urban Areas
4.1. Urban Areas
Towns and cities can be defined in a number of ways. Definitions can be based on
administrative (local government) boundaries, but these have gone through many
changes over New Zealand’s history. Furthermore, administrative boundaries often
include significant rural areas, and – especially since 1989 – towns can be quite
sizeable without actually having their own local governments.
As such, Stats NZ defines urban areas, “designed to identify concentrated urban or
semi-urban settlements without the distortions of administrative boundaries”
(Statistics New Zealand, 2013b).
“Urban areas” were first defined in 1917. Stats NZ intended to review urban area
boundaries only very occasionally, so they drew them to include some neighbouring
rural areas which could conceivably become urbanised in the future. Urban area
boundaries were reviewed in 1951, 1971 and 1991, and any revisions in intervening
years were minor. With a couple of exceptions as described later, there have been
only very minor changes to these boundaries since 1991.
Today, Stats NZ defines a hierarchy of urban areas, as follows:
• 17 main urban areas, with populations of more than 30,000;
• 14 secondary urban areas, with populations of 10,000-30,000;
• 103 minor urban areas, with populations of 1,000-10,000.
Some main urban areas are further subdivided into “urban zones”:
• Auckland is subdivided into North, West, Central and South zones;
• Wellington is subdivided into the Wellington, Lower Hutt, Upper Hutt and
Porirua zones;
• Hamilton is subdivided into the Hamilton, Cambridge and Te Awamutu zones;
• Napier-Hastings is subdivided into the Napier and Hastings zones.
We focus on the overall urban areas in this paper, although the NZLPD does also
provide population information for the urban zones. 6
6In two cases, the zone boundaries were shifted in 1989. In Auckland, Otahuhu was formerly considered to be
part of the South Auckland zone, and is now part of the Central Auckland zone. In Wellington, Tawa was
formerly part of the Porirua zone and is now part of the Wellington zone.
RCG | CONSTRUCTIVE THINKING. DELIVERED A NEW ZEALAND LOCAL POPULATION DATABASE
JULY 2017 (VERSION 1.0) 134.2. Rural Centres
New Zealand also has a number of even smaller towns which are not considered to
be urban areas. 133 of these towns are, however, identified as “rural centres”. These
have a population of 300-1,000 people, and their identification “enables the
separation of rural dwellers living in true rural areas from those living in rural
settlements or townships” (Statistics New Zealand, 2013b).
Although rural centres are not considered to be truly urban today, many of them did
have some administrative status in the past, as boroughs, town districts etc. As such,
long-term population information is available for a number of rural centres.
We have presented the population data for New Zealand’s towns and cities on the
same basis used by Stats NZ. The “Urban Areas” sheet in the NZLPD groups main and
secondary urban areas together, followed by minor urban areas, and then rural
centres. We note again that rural centres are not technically urban.
The “Raw data - Pre-1989 Towns” also contains information on towns which are too
small to even be considered rural centres today, although the data is quite
incomplete.
4.3. Scaling Urban Area Populations
Urban areas are defined in terms of “area units”, which are typically suburb-sized.
Larger cities can be made up of a large number of area units, whereas small towns
can consist of one or several area units. As outlined in section 3.2, we have data for
all urban areas using current 2013 area unit boundaries, for 1996-2013. We also
have data using 1996 area unit boundaries, for 1986-1996. With very few
exceptions, this gives complete and consistent population information for all urban
areas and rural centres over 1986-2013.
Tables from the 1981 census (Department of Statistics, 1982) include population
information for 37 urban areas over the 55-year period between 1926 and 1981. By
comparisons with other data, we were able to confirm that these tables used
consistent 1971 boundaries for the entire time period.
These tables eliminated the need to scale population figures for most of New
Zealand’s main and secondary urban areas, at least for 1926-2013. With three
exceptions (Hamilton, Tauranga and Napier-Hastings), there do not seem to be
significant differences between the 1971 boundaries and those used today, at least
for the purpose of estimating populations.
For minor urban areas, and for years prior to 1926 in the case of main and secondary
urban areas, our “final” data typically gives the populations for each census year
based on the population in the corresponding borough (or other administratively
defined area). We have not scaled any of the populations for minor urban areas.
RCG | CONSTRUCTIVE THINKING. DELIVERED A NEW ZEALAND LOCAL POPULATION DATABASE
JULY 2017 (VERSION 1.0) 14It is evident from some Yearbook editions that a number of smaller urban areas have
been defined in the past, although their populations were not published in
the Yearbooks. 7 We have not been able to locate data for these smaller urban areas as
yet, but this is an area for future investigation.
There are some more significant discontinuities for some urban areas, highlighted
below:
• A major discontinuity for Hamilton in 1986 – the Hamilton urban area was
substantially enlarged, with adding an extra 13.7% to the population in 1986;
• A major discontinuity for Queenstown in 1986 – the Queenstown borough had
a population of 3,659 in 1986, with the Frankton community adding another
634. As defined today, the Queenstown urban area had a population of 6,510
in 1986, 52% higher;
• A discontinuity for Rangiora in 1986 – the borough had a population of 6,674
in 1986, whereas the urban area had a population of 8,200 in 1986, 23%
higher;
• There are discontinuities for some minor urban areas, which we have not
scaled or attempted to correct;
• These include altered boundaries between 1996 and 2013, affecting
Rolleston, Wanaka, Amberley and several smaller towns. These are shown in
column BN of the “Raw data - Urban Areas” sheet;
• These discontinuities also include altered boundaries between 1986 boroughs
(or other administratively defined areas) and urban areas, affecting Kerikeri,
Motueka, Coromandel and other small towns. These are shown in column BM
of the “Raw data - Urban Areas” sheet.
7For example, the 1982 Yearbook gives the populations for all ‘main’ and ‘secondary’ urban areas, and shows
their combined population at 2,361,044 in 1981. ‘Minor’ urban areas had a combined population of 289,860,
but their individual populations are not shown.
RCG | CONSTRUCTIVE THINKING. DELIVERED A NEW ZEALAND LOCAL POPULATION DATABASE
JULY 2017 (VERSION 1.0) 155. Administrative Areas
5.1. Local Government Boundaries since 1989
New Zealand’s system of local government was radically overhauled in 1989. The
structures that were put in place during these reforms are largely intact today. These
include the “two tier” system of regions and territorial authorities, and council
boundaries which, with a few exceptions, have not changed since 1989.
2017 Local Government Boundaries for the North Island
Source: http://www.lgnz.co.nz/nzs-local-government/new-zealands-councils/. A South
Island map is also available from this link.
RCG | CONSTRUCTIVE THINKING. DELIVERED A NEW ZEALAND LOCAL POPULATION DATABASE
JULY 2017 (VERSION 1.0) 16The first tier of local government is the region, administered by regional councils. As
at 2016, New Zealand is divided into 16 regions. Regional councils are primarily
responsible for environmental management, although their role includes input into
urban planning, public transport, civil defence and various other matters.
New Zealand is divided into 67 cities and districts, administered by territorial
authorities. These form the second tier of local government. Territorial authorities
are known as district or city councils as appropriate, with no difference in function.
They are responsible for local roads, water infrastructure, reserves, building consent,
resource management and consents, and a range of other matters.
Almost all parts of New Zealand are part of both a region and a territorial authority,
with some minor exceptions such as the Chatham Islands. We also note that a small
number of councils, including Auckland, are “unitary” and perform both regional
and territorial functions.
There have been a small number of boundary shifts and amalgamations since 1989 –
most notably, the 2010 amalgamation of the Auckland region and seven territorial
authorities into the unitary Auckland Council.
5.2. Local Government Boundaries 1876-1989
Between 1876 and 1989, most parts of New Zealand were administered by city,
borough or county councils. Generally, this was a one-tier system, although
administrative responsibility could be shared in some small towns.
Geographically, New Zealand was divided into more than 100 counties, which
covered the entire country except for some offshore islands. However,
administratively, counties did not have responsibility for all parts of New Zealand.
Most towns and cities were independently administered by borough (or city)
councils, while smaller towns could be partly or fully administered by other types of
councils.
The distinction between administrative and geographic counties is therefore an
important one. Yearbooks typically provided population results for the
administrative counties only. To derive populations for geographic counties, we
have taken the administrative figures and added the populations of boroughs and
independent town districts within those counties. Population figures for both
administrative and geographic counties are shown in the “Raw data - Pre-1989
Counties” sheet of the NZLPD data tables.
Boroughs were the most common and longest lasting form of town governance, with
some surviving for more than a century from 1876-1989. Larger boroughs could
become “cities”, although this was a change in name only.
RCG | CONSTRUCTIVE THINKING. DELIVERED A NEW ZEALAND LOCAL POPULATION DATABASE
JULY 2017 (VERSION 1.0) 17As outlined in the Department of Statistics’ 1902 yearbook:
The several stages in the growth of a New Zealand town may be marked thus:
The village, taxed by the parent county, and dependent upon the latter for all
public works; then the legally constituted town district, still subordinate to the
county in some matters, its affairs administered by a Board presided over by a
Chairman. When its population exceeds 500 the town district may become
independent of the county, and control the whole of its revenues. If the
population reaches 1,000, full municipal powers may be obtained [as a
borough], with the dignity of a Council presided over by a Mayor, and finally, if
the number of inhabitants should reach 20,000 or over, the title of “city” may be
assumed, although the constitution remains unaltered. (Department of
Statistics, 1902)
Villages, commonly known as ‘townships’, were not clearly defined and had no
administrative function. While population data is available for many townships over
time, it may not be consistent given the lack of a clear boundary. We have generally
excluded townships in the NZLPD, although they may be added in the future.
Townships later received a more formal statistical definition, as “non-administrative
population centres”. In many cases, the NZLPD has information for these towns over
1966-1986. They include towns which had lost their administrative function, as well
as some which were quite sizeable but had never been administratively defined.
The Yearbook quoted above refers to “independent” town districts, which like
boroughs had full administrative responsibility. Dependent town districts only had
partial responsibility.
The situation for smaller towns was less stable than that for boroughs. By the 1970s,
few independent town districts or dependent town districts remained. Many of them
transitioned to one of the other types of local body below.
The Counties Act 1956 provided for the establishment of “county towns”, which only
had very limited responsibility within their overall county. Around 100 county towns
were defined, and the NZLPD has information for most of these carrying through to
1986 and indeed to 2013.
The Local Government Act 1974 changed the system again, abolishing county towns
but allowing for “communities” within counties. The county council could delegate
some responsibilities to community councils, at its discretion. Most county towns
became communities, and there were more than 100 across New Zealand.
The 1974 reforms also established a new form of local government, the district.
These districts were usually created when counties amalgamated with the boroughs
within them – a hint at the 1989 reforms to come – and they reflected areas which
RCG | CONSTRUCTIVE THINKING. DELIVERED A NEW ZEALAND LOCAL POPULATION DATABASE
JULY 2017 (VERSION 1.0) 18were neither fully urban nor rural in character. Only a small number were created
prior to 1989, and their boundaries do not necessarily coincide with modern district
boundaries.
RCG | CONSTRUCTIVE THINKING. DELIVERED A NEW ZEALAND LOCAL POPULATION DATABASE
JULY 2017 (VERSION 1.0) 196. Discussion
6.1. New Zealand’s Urban Population in 2013
New Zealand is primarily a nation of urban residents. Of the 4.35 million people in
New Zealand on census night 2013, 3.73 million (85.7%) were within the 134
defined urban areas. 8
According to the 2013 census, 30% of New Zealand’s population (1.33 million) was
in Auckland, with another 17% were in Wellington or Christchurch. Hamilton,
Napier-Hastings, Tauranga and Dunedin are smaller again, and were the only other
urban areas with a population of at least 100,000 each.
The populations of these urban areas, our seven largest, are shown in Figure 6.1
below:
Figure 6.1: 2013 Census Night Populations for the Seven Largest Urban Areas
Auckland
Wellington
Christchurch
Urban Area
Hamilton
Napier-Hastings
Tauranga
Dunedin
2013 Census Night Population
There are another ten urban areas which have a resident population of at least
30,000 as at 2013, and meet the criteria for “main urban areas”. Their populations
are shown in Figure 6.2 below:
8 This is the ‘census night’ population, as used throughout this paper and data set.
RCG | CONSTRUCTIVE THINKING. DELIVERED A NEW ZEALAND LOCAL POPULATION DATABASE
JULY 2017 (VERSION 1.0) 20Figure 6.2: 2013 Census Night Populations for Other Main Urban Areas
Palmerston North
Nelson
Rotorua
Main Urban Area
New Plymouth
Whangarei
Invercargill
Kapiti
Wanganui
Gisborne
Blenheim
0 20,000 40,000 60,000 80,000
2013 Census Night Population
72.0% of New Zealand’s population was in the 17 main urban areas listed above,
with another 5.7% in secondary urban areas and 8.0% in minor urban areas.
Most of the remaining population is truly rural: the 133 defined rural centres had a
combined population of just 78,000 people (1.8% of the New Zealand total).
6.2. Urban Drift
“Urban drift”, the tendency for populations to grow faster in cities than in rural
areas, has been a long-established trend in New Zealand. The Department of
Statistics noted in their 1928 yearbook that:
The increasing proportion of urban population in recent years is plainly
manifest. It is noteworthy that the “urban drift,” either non-existent or
quiescent up to 1906, in that year commenced a swift rise, which is rapidly
gaining in momentum... New Zealand is not alone in experiencing the modern
tendency towards urban aggregation: it is, in fact, occurring in almost all
countries. (Department of Statistics, 1928)
Stats NZ have made various attempts to quantify the shift from rural to urban
population, although these have been complicated by changing definitions of what
constitutes an urban area. 9 Figure 6.3 below shows the strong growth in urban
population between 1886 and 2001:
9 International comparisons are also somewhat difficult, as countries use a variety of definitions.
RCG | CONSTRUCTIVE THINKING. DELIVERED A NEW ZEALAND LOCAL POPULATION DATABASE
JULY 2017 (VERSION 1.0) 21Figure 6.3: Number of People Living in Urban and Rural Areas, 1886-2001
Source: Stats NZ (2004)
This graph shows the rural population remaining essentially constant from 1916 to
2001. Interestingly, this has not been the case in more recent years: the rural
population has now grown to more than 600,000, with more intensive dairying
perhaps one of the major contributors.
Another graph from Stats NZ (2004) shows that more than 55% of New Zealand’s
population was rural in 1886, with this percentage declining rapidly to a little over
30% by 1926, and falling more gradually thereafter. As noted earlier, only 14% of
New Zealand’s population is rural today.
6.3. Urban Area Consistency and Population Density
There is some subjectivity around how urban areas are defined, and where their
boundaries are drawn. As noted above, Stats NZ has always defined them to include
some surrounding non-urbanised land, to allow for expansion and avoid the need to
redraw the boundaries too frequently.
Demographia (2017) take a different approach, defining an urban area as “a
continuously built up land mass of urban development that is within a [single
labour] market”, or conceptually “the lighted area that can be observed from an
airplane (or satellite) on a clear night”.
As such, Demographia (2017) define the Auckland urban area as covering 544 km2,
whereas the 2013 Stats NZ definition covers 1,092 km2. The Stats NZ definition is
shown in Figure 6.4 below, and includes areas which could be thought of as semi-
RCG | CONSTRUCTIVE THINKING. DELIVERED A NEW ZEALAND LOCAL POPULATION DATABASE
JULY 2017 (VERSION 1.0) 22urban – for example, lower density lifestyle blocks, steeply hilly areas (including the
Waitakere Ranges). These areas have low population density, but are highly
influenced by their proximity to built-up areas of Auckland. For example, residents
are likely to work and access services within the more established parts of the city.
The ratio of “built up” to “semi-urban” space varies significantly between different
urban areas as defined by Stats NZ. As such, the NZLPD data is not well suited to
comparing population densities. 10 However, it is useful for comparing total
populations, as the semi-urban areas on the fringes tend to be relatively unimportant
to the overall population.
Hamilton is the most broadly defined urban area, containing the Hamilton,
Cambridge and Te Awamutu zones. As at 2013, it covers a larger land area than any
other urban area defined by Stats NZ. At 1,100 km2, this is marginally larger than
the Auckland urban area, although Auckland has more than six times the
population.
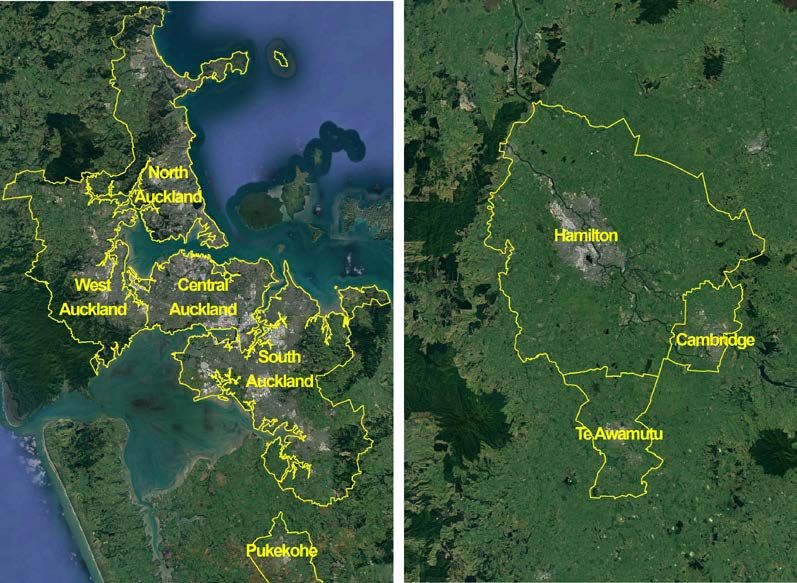
Figure 6.4 below shows the Auckland and Hamilton urban areas (and their
component zones) at the same scale. We also note that Pukekohe, to the south of
Auckland, is defined as its own urban area and not considered to be part of the
Auckland urban area:
Figure 6.4: Auckland and Hamilton Urban Areas (2013 Definitions)
10Nunns (2014) investigates population density for major Australasian cities, using a “population-weighted
density” measure. This is likely to be more informative than a simple average density calculation.
RCG | CONSTRUCTIVE THINKING. DELIVERED A NEW ZEALAND LOCAL POPULATION DATABASE
JULY 2017 (VERSION 1.0) 23Hamilton is an outlier in terms of this very broad definition. It is also significantly
different from the 1971 definition for Hamilton, which was much more tightly
drawn around Hamilton itself and excluded Cambridge and Te Awamutu. This is the
cause of the major ‘data break’ for Hamilton in 1986.
6.4. Maori Population Geography
In the late 19th century and early 20th century, most Maori lived in rural parts of the
country, i.e. outside defined urban areas. Maori only made up a small proportion of
New Zealand’s urban population.
The Department of Statistics’ yearbooks list the number of Maori living in each
geographic county for the 1896-1911 censuses. We have included this information
in a “raw data” sheet of the NZLPD.
More than 20% of Maori lived in what is now the Northland Region, where they
made up around half the total population. Almost another 20% of Maori lived in
Gisborne or the Hawkes Bay. Most others lived in the Waikato or Bay of Plenty areas,
and fewer than 6% lived in the South Island.
The data confirms the largely rural nature of the Maori population at that time.
During this period, there were only a few hundred Maori in the Auckland isthmus
(Eden County) or in Wellington (Hutt County). Based on these figures, Maori only
made up 0.3% to 0.5% of residents in the Auckland isthmus, or in urban Wellington,
in these censuses.
The Department of Statistics write in their 1962 yearbook:
"As late as the 1936 census only 8,249 [Maori (10.02 per cent of the total Maori
population)] dwelt in cities, boroughs, or independent town districts. By the
1961 census the comparative figure was 57,411 (34.4 per cent). The largest
concentration is in Auckland Urban Area, where 19,847 [Maori] were
enumerated." (Department of Statistics, 1962)
By comparison, the total population in cities, boroughs, or independent town
districts was 926,166 in 1936 and 1,549,790 in 1961. Maori made up 0.8% of the
urban population in 1936, and 3.7% in 1961.
There are two separate trends which underlie this change: firstly, the migration of
Maori to towns and cities as evidenced by the Stats NZ quote above; and secondly,
the growing size of the Maori population generally.
RCG | CONSTRUCTIVE THINKING. DELIVERED A NEW ZEALAND LOCAL POPULATION DATABASE
JULY 2017 (VERSION 1.0) 24Information is also available on the Maori and total populations for 14 urban areas
in the 1926, 1936 and 1945 censuses. As shown in Figure 6.5 below, Maori made up
a growing percentage of the urban population over this period, for most cities:
Figure 6.5: Maori % of Total Population in Urban Areas, 1926-1945
6%
Maori % of Total Population
5%
4%
3%
2% 1926
1936
1%
1945
0%
Urban Area
In 1926, Maori made up less than 1% of the population in most urban areas, with
Gisborne the main outlier – and even there, the Maori population was only slightly
over 2% of the total. The 1936-1945 period saw much larger changes than the 1926-
1936 period, and seems to have marked the start of large-scale Maori urbanisation.
As such, although most of the NZLPD’s population figures prior to 1926 exclude
Maori, this is unlikely to have much bearing on our estimates of urban area
populations. However, populations for some regions and territorial authorities,
especially those in the upper North Island, will be underestimated prior to 1926.
Today, the Maori population is approximately as urbanised as the non-Maori
population. According to the 2013 census, 505,000 of the 599,000 New Zealanders
identifying with Maori ethnic groups lived in urban areas, a rate of 84.3% compared
with 85.7% for the total population. Maori made up 13.8% of the total urban
population in 2013. 11
11Note that this data is based on the ‘usually resident population’ concept, rather than census night population
as elsewhere in our paper. Modern concepts of ethnicity have also evolved from those used in the days of
separate European and Maori censuses.
RCG | CONSTRUCTIVE THINKING. DELIVERED A NEW ZEALAND LOCAL POPULATION DATABASE
JULY 2017 (VERSION 1.0) 256.5. Auckland’s Prominence
New Zealand is unusual internationally in having a major city with a third of the
country’s population. However, Auckland was not always seen as being unusually
prominent. In their 1902 yearbook, the Department of Statistics wrote:
While New South Wales and Victoria present what is termed by the statistician
of the former colony “the disquieting spectacle of capital towns growing with
wonderful rapidity, and embracing in their limits one-third of the population of
the territory of which they are the centre,” New Zealand is saved from this by the
configuration of the country, which has resulted in the formation of four chief
towns, besides others of secondary importance but nevertheless trading centres
of considerable consequence. (Department of Statistics, 1902)
The “four chief towns” were Auckland, Wellington, Christchurch and Dunedin. The
Department of Statistics continued to write about Auckland as being of similar size
to these other cities in its 1937 yearbook:
An important characteristic of the distribution of urban population in New
Zealand is what may be termed its decentralization. In place of one great
metropolis containing a huge proportion of the population as in the case of the
Australian States—e.g., Victoria, whose capital city, Melbourne, contains over
50 per cent, of the total population of the State—the more highly urbanized
portion of the community is localized in four widely separated centres. These
four centres have always existed more or less on the same plane, a fact which
has played no small part in the development of the country. (Department of
Statistics, 1937)
Auckland was the largest of the four cities in 1891 – we estimate its population at
61,000, followed by Dunedin at 53,000, Christchurch at 45,000 and Wellington at
40,000. However, Dunedin grew much more slowly throughout the 20th century,
and its population has essentially been flat since the 1970s.
RCG | CONSTRUCTIVE THINKING. DELIVERED A NEW ZEALAND LOCAL POPULATION DATABASE
JULY 2017 (VERSION 1.0) 26Figure 6.6: Urban Populations for Auckland, Wellington, Christchurch and Dunedin
1,400,000
1,200,000
Census Night Population
1,000,000
800,000
600,000
400,000
200,000
0
1891 1911 1931 1951 1971 1991 2011
Year
Auckland Wellington Christchurch Dunedin
Wellington and Christchurch continued to grow strongly, and generally maintained
their size relative to Auckland in the first half of the 20th century. However, a very
different picture began to emerge in the post-war period.
Prior to the Second World War (for intercensal periods up until 1926-1936
inclusive), Auckland had tended to grow at a similar rate to the remainder of New
Zealand, and to the smaller cities of Wellington and Christchurch.
Auckland’s growth trend began to diverge in the middle of the 20th century. On a
percentage basis, the Auckland region has grown significantly faster than the rest of
New Zealand in every intercensal period since 1951-1956. Auckland’s fastest growth
was during the 1950s and early 1960s, when it grew by more than 3% per year.
In every intercensal period from 1976-1981 onwards, Auckland’s absolute
population growth has been higher than or similar to the rest of New Zealand. Over
the entire 37-year period from 1976 to 2013, Auckland’s population has grown by
around 650,000, and the rest of New Zealand has grown by around 575,000.
Stated another way, Auckland has consistently added more people than the rest of
New Zealand combined, for the last 40 years. Recent population projections, which
show this pattern continuing, are in line with a very long-established trend.
RCG | CONSTRUCTIVE THINKING. DELIVERED A NEW ZEALAND LOCAL POPULATION DATABASE
JULY 2017 (VERSION 1.0) 27You can also read