Research on Network Patterns and Influencing Factors of Population Flow and Migration in the Yangtze River Delta Urban Agglomeration, China - MDPI
←
→
Page content transcription
If your browser does not render page correctly, please read the page content below
sustainability

Article
Research on Network Patterns and Influencing
Factors of Population Flow and Migration in the
Yangtze River Delta Urban Agglomeration, China
Xuewei Wang 1,2, * , Shuangli Ding 1, *, Weidong Cao 1 , Dalong Fan 1 and Bin Tang 3
 1    School of Geography and Tourism, Anhui Normal University, Wuhu 241002, China;
      weidongwh@163.com (W.C.); fandl001@ahnu.edu.cn (D.F.)
 2    School of Geography and Planning, Cardiff University, Cardiff CF 10 3WA, UK
 3    School of Architecture, Southeast University, Nanjing 210096, China; tangbinzsj@hotmail.com
 *    Correspondence: wangxw697@ahnu.edu.cn (X.W.); aliceding375@hotmail.com (S.D.)

 Received: 25 July 2020; Accepted: 19 August 2020; Published: 21 August 2020

 Abstract: Through the construction of a population flow and migration relationship matrix, this paper
 analyzes population flow and migration in the Yangtze River Delta urban agglomeration during
 the Spring Festival travel rush and daily period. This paper also studies the urban network spatial
 structure characteristics and the influencing factors from the perspective of inter-provincial population
 flow and migration. The results show the following: (1) as a central city, Shanghai has a significant
 siphon effect, with Suzhou, Nanjing, Hangzhou, Ningbo, Wuxi and Changzhou accumulating 86.95%
 of the incoming population. The Shanghai–Jiangsu cross-border floating population is active and
 accounts for 40.83% of the total mobility scale in the same period. The population flow and migration
 network in the Yangtze River Delta urban agglomeration shows obvious hierarchical characteristics.
 The secondary network relationship during the Spring Festival travel rush is the main migration
 path, while the first-level network relationship in the daily period is the main flow path. (2) Three
 indicators, namely, the network density, mean centrality, and control force based on the population
 flow and migration, consistently show that the Yangtze River Delta urban agglomeration network
 presents a strong connection state with the formation of a local cluster structure, highlighting that the
 city tightness in terms of population flow and migration also has dual attributes, which refers to “the
 restriction of the geographic space effect” and “overcoming the friction of space”. (3) Economic scale,
 political resources, industrial structure, and the historical basis are important factors influencing the
 formation of population flows and migration networks. Employment opportunities and labor wages
 are key guiding factors of the population migration direction, and spatial distance is a conditional
 factor influencing the formation of population flows and migration networks. The inter-provincial
 boundary, temporal distance, and transboundary frequency are the decisive factors for the formation
 of network patterns of population flow and migration.

 Keywords: population flow; population migration; network structure; influencing factors;
 inter-provincial boundary; quadratic assignment procedure; Yangtze River Delta urban agglomeration

1. Introduction
    An urban network is a kind of urban relationship generated in a relatively unconstrained
space–time scale by flow factors such as production, service, information and traffic, etc. [1]. A
multi-scale urban network and the consequent difference research methods are the advantages
of an urban network in the study of urban systems [2]. Urban network studies based on the
perspective of urban agglomeration have attracted a great deal of attention. At present, scholars

Sustainability 2020, 12, 6803; doi:10.3390/su12176803                       www.mdpi.com/journal/sustainability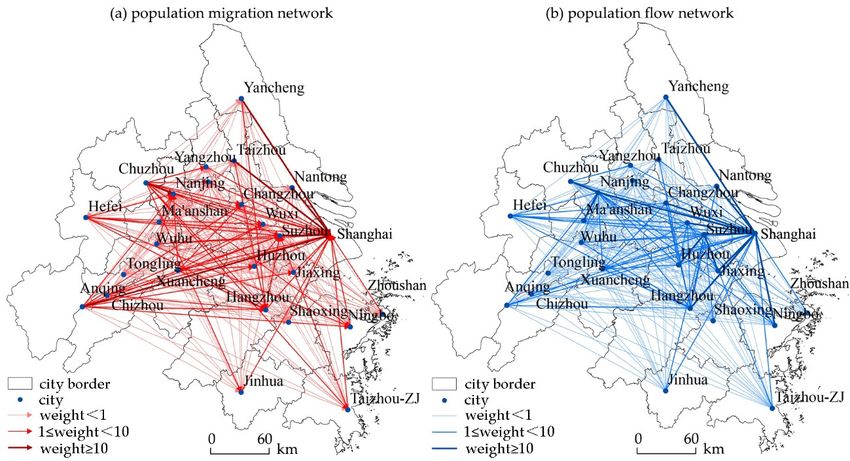
Sustainability 2020, 12, 6803                                                                     2 of 19

have revealed the spatial structure characteristics of urban agglomerations from the perspectives of
structure compactness [3], stability [4], economic connection [5], factor analysis [6], the man–land
relationship [7], and the multi-center network development mode [8]. Studies on the Yangtze River
Delta, the urban agglomeration with the highest development maturity in China, paid more attention
to regional cooperation, regional spatial coordination, and development path exploration [9,10]. As
the integration of Yangtze River Delta has become a national strategy, theoretical and empirical studies
on urban innovation [11], isomorphism [12], the metropolitan area [13], and spatial connection have
increased [14,15]. However, integrative development is faced with the dual problems of constructing a
regional network and eliminating the restriction of boundaries. On the one hand, creating networks is
necessary for the integrated development of urban agglomerations. Under the background of flow
space, various high-speed infrastructure and information networks make the connections between
cities extend beyond the cognitive limits of the previous central place era and form a network
relationship of sharing space and time between cities of multiple spatial scales and levels. Due to
the regional division of labor and functional supplements, spatial flow, as the essential content of
urban spatial connection, becomes a spatial vector with direction and intensity, and its change will
lead to a change in the regional connection network, thus leading to the generation of a spatial
difference [16]. As the network relationship between cities has been gradually strengthened, the
urban flow gradually blurs administrative boundaries, which makes the relative position, relative
correlation, and interaction of cities within the region present new characteristics [17]. On the other
hand, the inter-provincial boundary is a realistic problem facing the integrated development of
urban agglomerations. Since the beginning of the 21st century, boundary research has gradually
emerged, mainly focusing on boundary trade [18,19], market segmentation [20], factor costs [21,22],
capital differences [23,24], cross-border cooperation [25,26], structure estimation [27], and regional
development and coordination [28–33], etc. However, because boundary discussions are mostly
concentrated in the economic field, and the relative flow data between administrative regions are
difficult to obtain, there are few studies based on the perspective of network relationships of factor
mobility. With the continuous advancement of globalization and regional integration, the regional
network, as a key part of the country and global network, makes the development of internal
migration networks become the important component of the transnational network, as well as the
basic unit of a transnational network’s construction. So far, the perspectives of boundary research
have constantly been diversified as follows [34]: economic geography regards economic activities as
homogeneous elements and discusses the differentiation of the phenomenon of cross-regional economic
development caused by administrative boundaries [35]. Urban geography regards urban attributes
as homogeneous elements and discusses the differentiation phenomenon of cross-regional structure
development caused by administrative boundaries [36–38]. Political geography regards political
entities as homogeneous elements and discusses the differentiation of trans-regional cooperation
mechanism and policy governance caused by administrative boundaries [39,40]. The problem is that
the aforementioned research only focused on the phenomenon of regional differentiation caused by
the objective existence of boundaries, including a lack of exploration in the construction paths and
development mechanisms of the international network embedded in national boundaries with the
background of globalization, as well as regional networks embedded in inter-provincial boundaries
with the background of regional integration. As a unique product of administrative divisions in China,
the objective existence of inter-provincial boundaries makes the regional differential size become a key
factor influencing the formation and development of urban network relationships under the boundary
theory system.
      Population migration has been one of the largest and most far-reaching geographical processes
since China’s reform and opening up [41]. Social and economic development, reform of the household
registration system, and construction of high-speed transportation facilities have promoted population
flow and migration. On the one hand, the phenomenon of population flow in the daily stage, i.e.,
population flow as a process of the spatial reallocation of production factors, where its occurrence and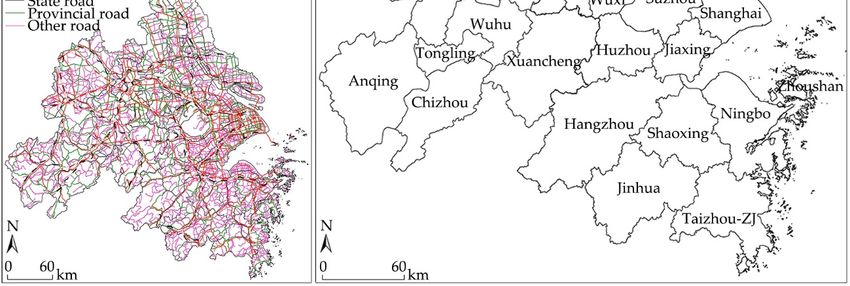
Sustainability 2020, 12, 6803                                                                        3 of 19

development is an important driving force to promote social and economic development [42], is usually
accompanied by social and economic prices. In an urban network, the vertical, horizontal, formal, and
informal links between various enterprises and organizations oriented by value creation constitute
the basis for the existence of the population mobility network. On the other hand, the phenomenon
of population migration during the Spring Festival travel rush is known as the most spectacular
periodic population migration in human history. It has a completely different scale and characteristics
as compared to daily population movement. In 2015, about 2.809 billion people migrated during
the Spring Festival travel rush in China, among which the most significant part was the large-scale
migration of the labor force from rural areas to cities (research on the characteristics and mechanisms
of population migration based on these data can provide a good reference for similar research on
characteristics of rural–urban migration in the process of industrialization in India, Mexico, Brazil, and
other countries), which is also known as the “rite of passage” for rural young people [43]. In general,
the regional economic development is not balanced, and the spatial disharmony between population
distribution and economic activities leads to the differentiation of population and employment space.
Cities in economically developed regions are more attractive than those in economically backward
regions, so people tend to choose cities with more developed economies, more job opportunities and
better infrastructure. Under the influence of traditional festival culture and customs, a large floating
population flows from work cities to their home cities before the Spring Festival, forming the “return
migration”. After the Spring Festival, people return from their home cities to their work cities, forming
the “rework migration”. As a major social phenomenon unique to China, Spring Festival travel has
become an important perspective to study the migration of floating populations [44–46].
     Population mobility is a large-scale group behavior in space and time, and the estimated number
of the floating population in China is very sensitive to the counting method used. Studies based on
census data show that traditional destination surveys fail to account for more than a third of the floating
population, where mainly young people and rural registered resident holders are included [47]. The
arrival of the era of big data makes it possible to obtain human movement patterns based on massive
spatiotemporal trajectories of individual granularity. The development of global positioning systems
(GPS), location-based services (LBSs), and other technologies has provided technical support for the
observation of spatial and temporal characteristics of large-scale population behaviors. These methods
have been widely used in the study of human space trajectories and space interactions based on stream
data [48]. The large number of mobile computing devices with positioning functions and the large
amount of spatiotemporal labelled data with individual granularity (including mobile phone call data,
bus card swiping records, social network check-in data, taxi tracking, bank card swiping records, etc.,)
makes it possible to track individual movements for a long time with high precision and efficiency [49].
The study of individual or group behaviors based on big data, spatial cognitive rules, spatial behaviors
and interaction patterns contained in activities is used to support cross-border flow decisions regarding
social and economic factors, and this has become the frontier of geographic science research.
     To sum up, this paper studies urban network structure characteristics and their influencing factors
in the perspective of Spring Festival travel and daily population flow and migration. The research
goals of this paper are the following: firstly, to carry out urban network construction and structural
characteristics analysis based on the perspective of population flow and migration; secondly, to explore
the influencing factors of the formation and development of urban networks based on a quadratic
assignment procedure (QAP), improving and testing the influencing factor groups of the formation and
development of the network structure. Existing research of network structure influence factors mainly
include the economic scale level, political resources, facilities, service quality, living environment,
and distance, etc. However, network construction is a process of breaking through and covering
administrative boundaries. Therefore, how boundary variables affect the formation and development
of a network is a topic worthy of discussion. Based on that, this paper adds three factors, namely time
distance, and the administrative boundary, as necessary supplements to the existing element group
because of China’s special administrative divisions and transboundary frequency. At the same time,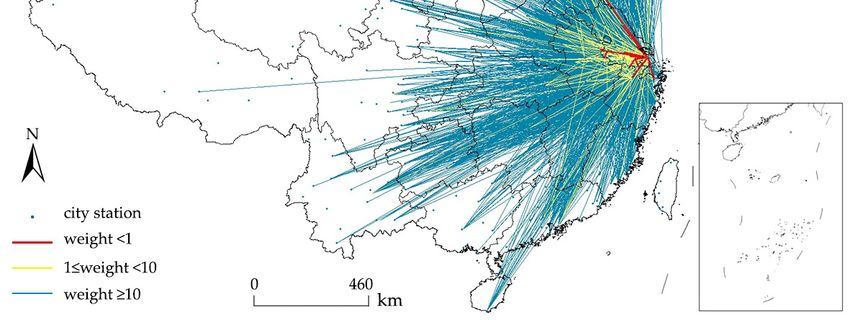
Sustainability 2020, 12, 6803 4 of 19
Sustainability 2020, 12, x FOR PEER REVIEW 4 of 19
constructing a quantitative analysis system between the network matrix and the variable matrix, the
matrix correlation
rationality and regression
and necessity of adding analysis, as well
new elements as proving
is tested thatthe
through thematrix
relationship between
correlation the urban
and regression
network and inter-provincial boundaries is not a “false relationship”. On the one hand,
analysis, as well as proving that the relationship between the urban network and inter-provincial the research
perfects theistheoretical
boundaries not a “falseresearch systemOn
relationship”. of the
an urban
one hand,network and provides
the research perfectsathe
scientific basisresearch
theoretical for the
exploration
system of anofurban
regional spatialand
network networkization paths. Onbasis
provides a scientific the other hand,
for the it can provide
exploration a typical
of regional case
spatial
analysis for research on the formation and development mechanisms of cross-boundary
networkization paths. On the other hand, it can provide a typical case analysis for research on the networks
based on element
formation flow undermechanisms
and development the background of globalizationnetworks
of cross-boundary and regional
basedintegration.
on element flow under
the background of globalization and regional integration.
2. Data and Methods
2. Data and Methods
2.1. Research Area
2.1. Research Area
The Yangtze River Delta urban agglomeration is one of the most developed regions in China’s
The Yangtze
social economy River
and Delta
is also an urban agglomeration
important intersectionisofone
theofBelt
theand
most developed
Road Initiativeregions
and the in Yangtze
China’s
social economy and is also an important intersection of the Belt and Road
River Economic Belt. The economic hinterland of the Yangtze River Delta urban agglomeration isInitiative and the Yangtze
River Economic
vast, with Belt. The
a modern rivereconomic hinterland
and seaport of the Yangtze
and airport groups. River Delta urbannetwork
The expressway agglomeration is vast,
is sound, the
with a modern river and seaport and airport groups. The expressway network
density of trunk lines of public and railway traffic is the highest in the country, and a three- is sound, the density
of trunk linesand
dimensional of public and railway
comprehensive traffic
traffic is the highest
network in the taken
has basically country, and In
shape. a three-dimensional
2016, according toand the
comprehensive traffic network has basically taken shape. In 2016, according
“Yangtze River Delta Urban Agglomeration Development Plan”, the Hefei metropolitan area in to the “Yangtze River
Delta
AnhuiUrban Agglomeration
province was included Development Plan”,
into the Yangtze the Delta
River Hefei urban
metropolitan area in Anhui
agglomeration, province
expanding was
its scope
included
from “two into the Yangtze
provinces andRiver Deltato
one city” urban agglomeration,
the current expandingand
“three provinces its scope from In
one city”. “two provinces
terms of the
and one city” to the current “three provinces and one city”. In terms of the
geographical space, 26 cities, including Shanghai, Nanjing, Hangzhou, and Hefei (Figure 1), cover an geographical space,
26 cities,
area including
of 217,700 Shanghai,
square Nanjing,
kilometers. InHangzhou,
2019, the GDP and Hefei
of the(Figure 1), cover
Yangtze Riveran area region
Delta of 217,700
wassquare
19.74
kilometers.
trillion yuan,Inwith
2019,a the
totalGDP of the Yangtze
population River Delta
of 156 million, whichregion was 19.74
accounts for 2.2trillion
percent yuan, with
of the a total
country’s
population of 156
total land area, million, which
producing 19.92 accounts
percent offorthe2.2country’s
percent ofproduction
the country’svaluetotal land
and area, producing
representing 11.11
19.92
percentpercent
of theofpopulation.
the country’s production value and representing 11.11 percent of the population.
Figure 1.
Figure 1. Research area scope map.
2.2. Data Sources
The migration data of the population involved in the study were sourced from the migration
data of Baidu Maps. Based on LBS technology, Baidu migration maps the trajectory of population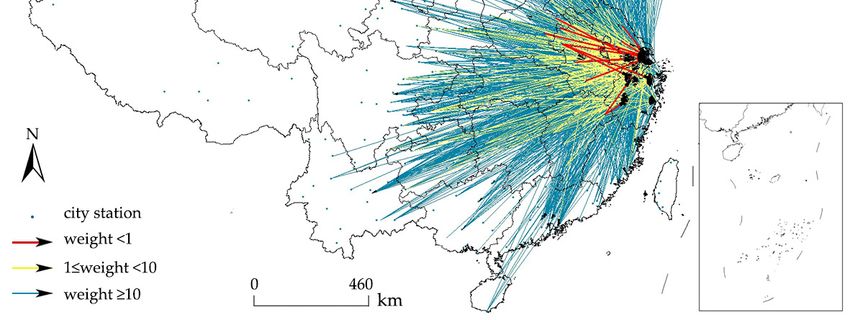
Sustainability 2020, 12, 6803                                                                       5 of 19

2.2. Data Sources
      The migration data of the population involved in the study were sourced from the migration data
of Baidu Maps. Based on LBS technology, Baidu migration maps the trajectory of population flow
via the location information of mobile phone users and shapes the starting and ending nodes and
relationship strengths generated in the process of population flow. The data of population migration
consists of two parts: one is the Spring Festival transport data, which represents the characteristics of
the net population migration in the Yangtze River Delta urban agglomeration; the second is the daily
data, which is used to characterize the spatial network characteristics of population mobility in the
Yangtze River Delta urban agglomeration. The study time was divided here into 40 days of Spring
Festival travel from 7 February to 18 March in 2015 (the officially defined period of Spring Festival
travel in China is generally 40 days, namely, 15 days before and 25 days after the Spring Festival)
and 43 days of daily travel from 19 March to 30 April in 2015, which is not a major holiday period.
During the 2015 Spring Festival travel rush, the Baidu migration platform identified 81.74 million
instances of inter-provincial migration, involving 22,420 directional population migration paths. After
processing, the scale of population migration was found to be 466,400. In the daily 43 days, Baidu
migration identified 38.54 million people moving between provinces. Through the Spring Festival
travel and daily Baidu migration data, the population flow and migration matrices among 26 cities
in the Yangtze River Delta urban agglomeration were constructed, which serves as the basis for the
analysis of the network structure characteristics of the Yangtze River Delta urban agglomeration. In
addition, the index data related to the social and economic development of cities involved in the study
were derived from the statistical yearbooks of the provinces (or cities) and statistical bulletins of the
national economic and social development of cities.

2.3. Research Methods

2.3.1. Social Network Analysis
     According to the analysis method of a social network, a society is a huge network composed of
various relationships and each actor is a node in the network. By studying the network relationships,
the relationship between individuals can be grasped so as to reveal the integration and hierarchies of
the network. This paper uses the social network analysis method to quantitatively analyze the network
structure characteristics of population migration in the Yangtze River Delta urban agglomeration from
three aspects, namely, the network density, centrality, and control force.
     Network density refers to the degree of the closeness of connections between nodes in a relational
network, which is obtained by dividing the number of actual connections in the network by the number
of theoretical connections. The calculation formula is the following:

                                           k X
                                           X k
                                     D=        d ni , n j /k(k − 1)                                    (1)
                                           i=1 j=1

where D is the network density, k is the number of nodes in the city, ni and nj are any two node cities,
and d is the strength of the relationship between the two cities, which is represented by the population
flow weight in this paper.
     Centricity reflects the population of a region or urban agglomeration in terms of the resource
capacity and it can reflect a city’s ability to absorb foreign population inflows, with net ingoing values
used to measure population during the Spring Festival. Based on the Spring Festival time schedule
and overall observation of the data, this determined that the segmentation point of return and rework
population migration is midnight on the 24 February. Based on the time arrangement and overall
observation of the data, the starting and ending times for return migration were determined as 7–23
February before the festival, with the dominant direction of migration by the Yangtze River Delta
urban agglomeration being internal to the external diffusion (diffusion, D). The rework migration after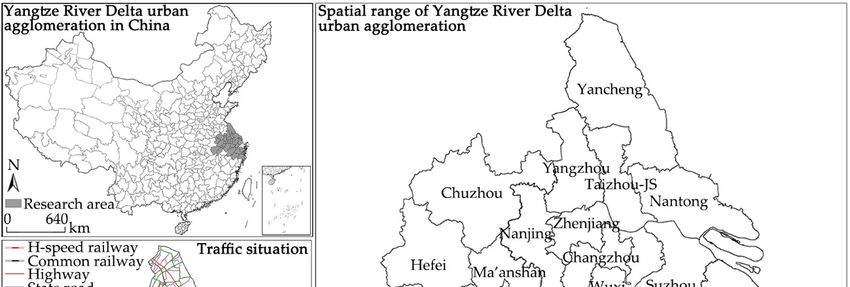
Sustainability 2020, 12, 6803                                                                            6 of 19

the festival occurs from 24 February to 18 March, and the leading direction of population migration is
aggregation from the outside to the inside of the Yangtze River Delta urban agglomeration (aggregation,
A). The calculation formula of this is given as follows:
                                                  X                X
                                  Centralityi =       NIi_dayA −       NIi_dayD                             (2)

      In the formula, Centralityi represents centrality of a city. When Centralityi > 0, this indicates that
city i is the move-in place of population migration during the Spring Festival travel rush, while when
Centralityi < 0, city i is the move out place of population migration during the Spring Festival travel
rush. NIi is the flow scale of the urban population in city i and NIi_dayA is the net flow scale of urban
population in city i before the festival, while NIi_dayD is the net flow scale of urban population in city i
after the festival.
      The control force is the total intensity of the inter-provincial population flow during daily life,
which can reflect the active degree of the population flow in a city. It can be measured by the total flow
scale. The calculation formula of this is given as follows:

                                              Poweri = RTi + Ri                                             (3)

where Ri is the inter-provincial flow matrix of population and RT i is the Ri -transpose matrix. According
to the calculation demand, this paper constructs the matrix of population resettlement intensity
of 26 cities in the Yangtze River Delta urban agglomeration, the whole country, and the urban
agglomeration itself.

2.3.2. Quadratic Assignment Procedure (QAP)
      The QAP can be used to study the relationship between relationships, namely, to study the
correlation and regression between matrices. The QAP needs to construct the city attribute relationship
matrix. If a certain attribute of city i and city j is the same, the encoding value at the intersection of i and
j in the attribute relation matrix is 1, otherwise the encoding value is 0. Based on a directed, weighted
asymmetric matrix during the Spring Festival, the daily time undirected, weighted symmetric matrix,
and the city attribute matrix, matrix correlation analysis (QAP correlation) and matrix regression
analysis (QAP regression) were performed. The former is used to test the correlation relationship
between a population flow network matrix and city property matrix, such as the border area or
transboundary frequency, and the latter is used to quantitatively identify the influence of the city
property matrix on the population migration network matrix.

3. Analysis of Urban Network Pattern

3.1. External Connection of Population Resettlement
      During the Spring Festival travel rush, the total net immigration population was 11.33 million
people, accounting for 24.3% of the national total. Twelve cities, including Shanghai, Suzhou, and
Hangzhou, saw a net migration of more than 10 million people, while 13 cities, including Zhoushan,
Tongling, and Hefei, saw a larger emigration than the number of people moving in (Table 1). In addition,
the spatial characteristics of population migration between the Yangtze River Delta urban agglomeration
and the national cities during the Spring Festival travel rush show significant spatial heterogeneity and
hierarchical characteristics (Figure 2). Cities in the Yangtze River Delta region and cities in the near
region have a close relationship with population migration. The values of the network relationships at
the three levels were 17, 363, and 4376, and the scales of the carrying population migration were 2.31,
9.08, and 3.9 million people, respectively. In daily periods, population flow is associated with 35.2 cities
on average in the Yangtze River Delta urban agglomeration, and each associated path carries 62,400
people. The scale of daily population flow in Shanghai is 2.16 times that in Suzhou and four times that
in Hangzhou and Ningbo, with a prominent siphon effect. In terms of the spatial structure, this also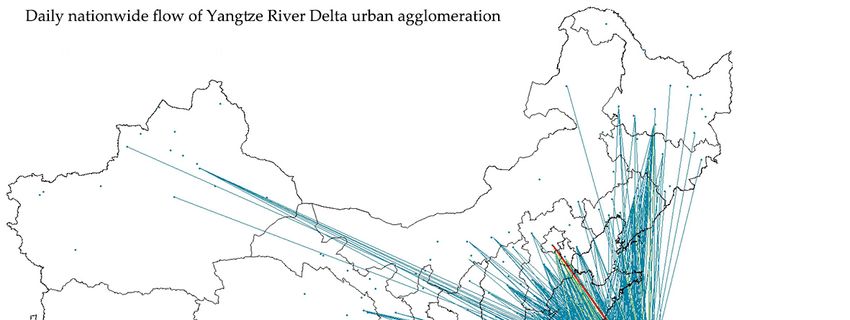
Sustainability 2020, 12, 6803 7 of 19
presents obvious hierarchical characteristics (Figure 3). The numbers of the network relationship at the
three levels are 14, 163, and 5746, and the scales of the carrying population flow are 4.75, 3.95, and
Sustainability 2020, 12, x FOR PEER REVIEW 7 of 19
3.00 million, respectively. The comparison shows that the number of related cities in the Yangtze River
Delta urban agglomeration in the daily period is greater than that during the Spring Festival travel
shows that the number of related cities in the Yangtze River Delta urban agglomeration in the daily
rush, and the radiation scope is wider.
period is greater than that during the Spring Festival travel rush, and the radiation scope is wider.
Table 1. Net migration scale of cities in the Yangtze River Delta urban agglomeration (ten thousand
Table 1. Net migration scale of cities in the Yangtze River Delta urban agglomeration (ten thousand
people).
people).
A Net Migration Flow A Net Migration Flow
A City Flow City Flow
Sequence City Scale Scale Scale
Net Migration Sequence
A Sequence City Scale
Net Migration Scale Scale
Sequence Scale Scale
11 Shanghai
Shanghai 479.23
479.23 509.31
509.31 14
14 Zhoushan
Zhoushan 0.12
0.12 28.15
28.15
22 Suzhou
Suzhou 220.85
220.85 235.47
235.47 15
15 Tongling
Tongling 1.94
1.94 22.12
22.12
33 Hangzhou
Hangzhou 157.93
157.93 129.32
129.32 16
16 Hefei
Hefei 5.13
5.13 19.46
19.46
44 Ningbo
Ningbo 118.37
118.37 123.55
123.55 17
17 Ma’anshan
Ma’anshan 5.52
5.52 18.41
18.41
55 Jinhua
Jinhua 86.05
86.05 66.57
66.57 18
18 Yangzhou
Yangzhou 6.96
6.96 18.36
18.36
66 Nanjing
Nanjing 72.51
72.51 56.35
56.35 19
19 Wuhu
Wuhu 10.58
10.58 16.49
16.49
77 Wuxi
Wuxi 64.87
64.87 48.17
48.17 20
20 Chizhou
Chizhou 13.26
13.26 15.62
15.62
88 Jiaxing
Jiaxing 47.80
47.80 45.15
45.15 21
21 Nantong
Nantong 13.95
13.95 15.59
15.59
99 Taizhou-ZJ
Taizhou-ZJ 38.15
38.15 44.91
44.91 22
22 Taizhou-JS
Taizhou-JS 14.78
14.78 14.11
14.11
10
10 Changzhou
Changzhou 29.34
29.34 41.21
41.21 23
23 Xuancheng
Xuancheng 23.36
23.36 11.12
11.12
11
11 Shaoxing
Shaoxing 28.70
28.70 37.74
37.74 24
24 Yancheng
Yancheng 26.46
26.46 10.65
10.65
12
12
Huzhou
Huzhou
13.90
13.90
36.23
36.23
25
25
Chuzhou
Chuzhou
45.93
45.93
4.864.86
13
13
Zhenjiang
Zhenjiang
4.04
4.04
30.82
30.82
26
26
Anqing
Anqing
60.74
60.74
1.421.42
Figure 2. Spatial
Figure 2. Spatial characteristics of population
characteristics of population migration of more
migration of more than
than 100
100 people
people during
during the
the Spring
Spring
Festival
Festival travel
travel rush.
rush.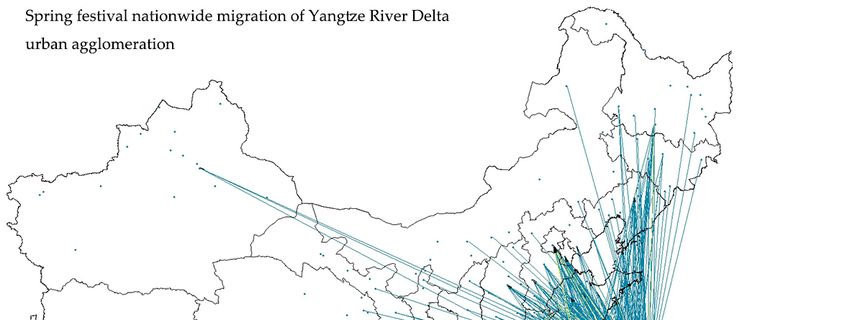
Sustainability 2020, 12, 6803                                                                          8 of 19
Sustainability 2020, 12, x FOR PEER REVIEW                                                             8 of 19

     Figure
     Figure 3.  Spatial characteristics
             3. Spatial characteristics of
                                        of population
                                           population migration
                                                      migration of
                                                                of more
                                                                   more than
                                                                        than 100
                                                                             100 people
                                                                                 people during
                                                                                        during the
                                                                                               the daily
                                                                                                   daily
     travel rush.
     travel rush.

3.2. Internal Relationships of Population Resettlement
3.2. Internal Relationships of Population Resettlement
      During the Spring Festival travel rush, the net migration intensity of the population within the
      During the Spring Festival travel rush, the net migration intensity of the population within the
Yangtze River Delta urban agglomeration was 2.86 million, forming a total of 230 city-related items.
Yangtze River Delta urban agglomeration was 2.86 million, forming a total of 230 city-related items.
Among them, Shanghai attracted 1.49 million net migrants, accounting for 52.04% of the total. Suzhou
Among them, Shanghai attracted 1.49 million net migrants, accounting for 52.04% of the total. Suzhou
and Nanjing gathered 10.61% and 9.45% of the total population, respectively. Hangzhou, Ningbo,
and Nanjing gathered 10.61% and 9.45% of the total population, respectively. Hangzhou, Ningbo,
Wuxi, and Changzhou attracted a total of 425,100 people from 59 cities. So far, 86.95% of the incoming
Wuxi, and Changzhou attracted a total of 425,100 people from 59 cities. So far, 86.95% of the incoming
population has been accumulated in the seven aforementioned cities. Among the top ten population
population has been accumulated in the seven aforementioned cities. Among the top ten population
migration flows with the intensity of net migration, seven link people moving into Shanghai, while five
migration flows with the intensity of net migration, seven link people moving into Shanghai, while
link people moving out of Jiangsu and Anhui, respectively (Table 2). Thus, it can be seen that during
five link people moving out of Jiangsu and Anhui, respectively (Table 2). Thus, it can be seen that
the Spring Festival travel rush, the net migration intensities of Jiangsu to Shanghai, Anhui to Jiangsu,
during the Spring Festival travel rush, the net migration intensities of Jiangsu to Shanghai, Anhui to
and Anhui to Shanghai are relatively strong, and the transboundary migration intensity of Zhejiang
Jiangsu, and Anhui to Shanghai are relatively strong, and the transboundary migration intensity of
is relatively small. During the daily period, the population flow intensity within the Yangtze River
Zhejiang is relatively small. During the daily period, the population flow intensity within the Yangtze
Delta urban agglomeration was 5.50 million people, and a total of 231 intercity population mobility
River Delta urban agglomeration was 5.50 million people, and a total of 231 intercity population
correlations were formed. There are nine links of population mobility between Shanghai and the cities
mobility correlations were formed. There are nine links of population mobility between Shanghai
of Jiangsu province, representing 2.25 million instances of population mobility, accounting for 40.83%
and the cities of Jiangsu province, representing 2.25 million instances of population mobility,
of the total mobility in the same period. The scales of population flow across the three inter-provincial
accounting for 40.83% of the total mobility in the same period. The scales of population flow across
boundaries of Shanghai–Zhejiang, Jiangsu–Anhui and Jiangsu–Zhejiang were 0.99, 0.91, and 0.90
the three inter-provincial boundaries of Shanghai–Zhejiang, Jiangsu–Anhui and Jiangsu–Zhejiang
million, accounting for 18.09%, 16.70%, and 16.33% of the total, respectively. The population mobility
were 0.99, 0.91, and 0.90 million, accounting for 18.09%, 16.70%, and 16.33% of the total, respectively.
between Zhejiang and Anhui provinces was 229,500 people, accounting for 4.17% of the total scale.
The population mobility between Zhejiang and Anhui provinces was 229,500 people, accounting for
Because Anhui province and Shanghai are separated by the Jiangsu and Zhejiang provinces, they
4.17% of the total scale. Because Anhui province and Shanghai are separated by the Jiangsu and
are far apart in space, and the population flow is the smallest, with only 213,100 people. Most of
Zhejiang provinces, they are far apart in space, and the population flow is the smallest, with only
the cities in the top ten daily flow intensities are adjacent and belong to provinces (cities) on both
213,100 people. Most of the cities in the top ten daily flow intensities are adjacent and belong to
provinces (cities) on both sides of the inter-provincial boundary, indicating that the population flow
intensity is affected by the inter-provincial boundary to some extent.
Sustainability 2020, 12, 6803 9 of 19
sides of the inter-provincial boundary, indicating that the population flow intensity is affected by the
inter-provincial boundary to some extent.
Table 2. Top ten net move-in intensities of Spring Festival and daily flow intensity transport (ten
thousand people).
Spring Festival Net
Intensity Daily Flow Intensity
Move-In Travel Rush
Nantong → Shanghai 20.33 Shanghai–Suzhou 118.96
Yancheng → Shanghai 18.65 Nantong–Shanghai 29.12
Chuzhou → Nanjing 13.17 Jiaxing–Shanghai 28.23
Anqing → Shanghai 11.03 Hangzhou–Shanghai 26.41
Suzhou → Shanghai 10.69 Chuzhou–Nanjing 23.10
Taizhou-JS → Shanghai 10.49 Jiaxing–Suzhou 20.17
Yangzhou → Shanghai 8.09 Shanghai–Wuxi 19.65
Chuzhou → Shanghai 7.61 Ma’anshan–Nanjing 15.23
Anqing → Suzhou 7.13 Nanjing–Shanghai 14.52
Chuzhou → Suzhou 6.88 Ningbo–Shanghai 13.54
By comparing and analyzing the population flow and migration network within the Yangtze River
Delta urban agglomeration in two periods (Figure 4), obvious hierarchical characteristics are presented.
During the Spring Festival travel rush, there are six first-level population net migration relationships,
carrying 0.84 million people, where the migration destinations are Shanghai and Nanjing. There are 56
secondary net migration relationships, carrying 1.64 million people. The destinations include 13 cities,
such as Shanghai, Suzhou, and Hangzhou. The 141 third-level population net migration relationships
carry 0.38 million people. The destinations include Ningbo, Jiaxing, Wuxi, and another 21 cities. It can
be seen that in the net migration network of the Yangtze River Delta urban agglomeration, Shanghai
has become the first-level population migration destination, and the second is the Jiangsu province.
During daily life, 13 first-level population flows carry 3.43 million people. There are 51 secondary
population flows that carry 1.68 million people. The other 154 third-level population flows carry 0.38
million people. During the Spring Festival travel rush, the net migration scale of the three levels of the
network accounts for 29.47%, 57.31% and 13.22% of the total migration scale, respectively, and the
migration scale of the three levels of the network accounts for 62.42%, 30.62% and 6.95% of the total flow
scale, respectively, in the daily period. It can be seen that the secondary network relationship during
the Spring Festival travel rush is the main migration path, while the first-level network relationship in
the daily stage is the main flow path. The first-level network relationship mainly links Shanghai. As
the core city of the Yangtze River Delta urban agglomeration, Shanghai is the most attractive city with
the highest level of development and of course the highest cost of living. Almost all of the population
migrants during the Spring Festival travel mentioned above are employees from other places. Most
of these people represent rural population flows to cities for employment. When choosing a city for
employment, these people consider not only employment opportunities and labor benefits, but also
the cost of living and the resulting final benefits. Affected by this factor, most migration flows tend to
avoid cities such as Shanghai and this has led to secondary network relationships becoming the main
migration path.Sustainability 2020, 12, 6803 10 of 19
Sustainability 2020, 12, x FOR PEER REVIEW 10 of 19
Figure 4.
4. Spatial
Spatialcharacteristics
characteristics of
of Spring
Spring Festival
Festival migration
migration (b)
(b) and
and daily
daily flow
flow (a)
(a) in
inthe
theYangtze
Yangtze River
River
Delta urban agglomeration.
3.3. Structural
3.3. Structural Characteristics
Characteristics of
of Population
Population Flow
Flow and
and Migration
Migration Network
Network
During the
During the Spring
Spring Festival
Festival travel
travel rush,
rush, the
the mean
mean centrality
centrality of of the
the net
net population
population immigration
immigration
within the Yangtze River Delta urban agglomeration was 23.08,
within the Yangtze River Delta urban agglomeration was 23.08, which means that which means that the
the 10
10 cities
cities with
with
net population
net population immigration
immigration absorbed
absorbed an an average
average ofof 0.23
0.23 million
million people
people fromfrom the
the Yangtze
Yangtze River
River Delta
Delta
urban agglomeration. Shanghai, Nanjing, Suzhou, and Hangzhou rank as
urban agglomeration. Shanghai, Nanjing, Suzhou, and Hangzhou rank as the top four for centrality the top four for centrality
(Table 3).
(Table The mean
3). The mean centrality
centrality of
of the
the netnet emigration
emigration ofof the
the population
population during
during thethe Spring
Spring Festival
Festival travel
travel
rush is
rush −14.43, which
is −14.43, which means
means the
the net
net emigration
emigration of of the
the population
population fromfrom the the 16
16 cities
cities in
in the
the Yangtze
Yangtze
River Delta urban agglomeration is 0.14 million on average. The top four cities
River Delta urban agglomeration is 0.14 million on average. The top four cities are Chuzhou, Anqing, are Chuzhou, Anqing,
Xuancheng, and
Xuancheng, and Yancheng
Yancheng inin terms
terms of of the
the order
order of
of centrality.
centrality. In In the
the daily
daily period,
period, the
the Yangtze
Yangtze River
River
Delta urban agglomeration’s average control force of the network is 42.31,
Delta urban agglomeration’s average control force of the network is 42.31, the association hosting anthe association hosting
an average
average floating
floating population
population of of
0.420.42 million
million forfor eachpopulation
each populationflow flowlink,
link,with
withthethetop
top five
five cities
cities
(Shanghai, Suzhou,
(Shanghai, Suzhou, Nanjing,
Nanjing, Hangzhou,
Hangzhou, and and Jiaxing)
Jiaxing) carrying
carrying 65.8%
65.8% of of the
the total
total population
population flow,flow, of
of
which Shanghai represents 31.4% of the daily population flow intensity of the
which Shanghai represents 31.4% of the daily population flow intensity of the Yangtze River Delta Yangtze River Delta urban
agglomeration.
urban By calculation,
agglomeration. the network
By calculation, the density
network of density
the Yangtze River
of the Delta urban
Yangtze Riveragglomeration
Delta urban
based on the daily population flow is 0.711, reaching the percolation threshold
agglomeration based on the daily population flow is 0.711, reaching the percolation threshold of 0.5, and the overall
of 0.5,
and the overall network connection shows a strong state of connection. In contrast, theisnetwork
network connection shows a strong state of connection. In contrast, the network density slightly
higher than
density 0.432 inhigher
is slightly the middle
than reaches
0.432 inofthe themiddle
Yangtzereaches
River [50]. AsYangtze
of the one of the most[50].
River developed
As oneregions
of the
in China, the Yangtze River Delta urban agglomeration has a high degree
most developed regions in China, the Yangtze River Delta urban agglomeration has a high degree of inter-city contact, moreof
ways to obtain information and share resources, and a high degree of reciprocity
inter-city contact, more ways to obtain information and share resources, and a high degree of of network resources,
basically forming
reciprocity an integrated
of network resources,urban network.
basically forming an integrated urban network.
Table 3. Attribute table of city nodes of the population flow and migration network.
Related Cities Related Cities
City Centricity Control City Centricity Control
Number Number
Shanghai 25 148.99 345.36 Taizhou-ZJ 18 −4.20 7.68
Nanjing 17 22.68 83.93 Shaoxing 18 −4.40 12.96
Suzhou 17 19.69 178.46 Ma’anshan 18 −5.36 18.02
Hangzhou 18 13.44 59.75 Yangzhou 17 −7.35 15.74
Ningbo 18 8.46 23.24 Wuhu 18 −10.24 12.72
Wuxi 17 7.87 37.32 Chizhou 18 −11.45 3.60
Changzhou 17 3.66 22.47 Taizhou-JS 17 −12.99 12.02
Jiaxing 18 3.38 56.25 Hefei 18 −16.51 25.11
Huzhou 18 2.05 34.03 Nantong 17 −21.39 34.43
Jinhua 18 0.62 10.36 Yancheng 17 −22.50 13.58Sustainability 2020, 12, 6803 11 of 19
Table 3. Attribute table of city nodes of the population flow and migration network.
Related Cities Related Cities
City Centricity Control City Centricity Control
Number Number
Shanghai 25 148.99 345.36 Taizhou-ZJ 18 −4.20 7.68
Nanjing 17 22.68 83.93 Shaoxing 18 −4.40 12.96
Suzhou 17 19.69 178.46 Ma’anshan 18 −5.36 18.02
Hangzhou 18 13.44 59.75 Yangzhou 17 −7.35 15.74
Ningbo 18 8.46 23.24 Wuhu 18 −10.24 12.72
Wuxi 17 7.87 37.32 Chizhou 18 −11.45 3.60
Changzhou 17 3.66 22.47 Taizhou-JS 17 −12.99 12.02
Jiaxing 18 3.38 56.25 Hefei 18 −16.51 25.11
Huzhou 18 2.05 34.03 Nantong 17 −21.39 34.43
Jinhua 18 0.62 10.36 Yancheng 17 −22.50 13.58
Zhenjiang 17 −0.31 8.30 Xuancheng 18 −22.95 27.63
Tongling 18 −1.93 1.32 Anqing 18 −41.65 8.77
Zhoushan 16 −2.62 7.96 Chuzhou 18 −44.97 38.97
Because the density analysis in the social network analysis only focuses on the binary matrix,
and as the strength of connection between cities is different, the density analysis can only reflect the
characteristics of the urban network to a certain extent. However, “small world analysis” has the
feature that most nodes can be reached from any other point through a few correlations, which makes
up for the shortage of density analysis. The average clustering coefficient and average path length can
reflect whether there is a “small world” effect in the network—that is, how nodes are embedded in
their neighbors. The former gives the overall indication of node clustering or agglomeration, and the
latter is the average graph distance between all node pairs, where the graph distance of interconnected
nodes is 1. If the average clustering coefficient of a graph is significantly higher than the random
graph generated by the same number of nodes, and the average shortest path is similar, then the
graph is considered to have “small world” characteristics. The average clustering coefficients of the
population flow and migration network in the Yangtze River Delta urban agglomeration are 0.290 and
0.583, respectively, both of which are significantly higher than the random network coefficients of
0.029 and 0.058 under the same nodes number. The average path lengths are 1.799 and 1.289, which
is close to 1.818 and 1.306. This indicates that there is an obvious “small world” phenomenon in the
urban network of the Yangtze River Delta urban agglomeration based on population mobility, and the
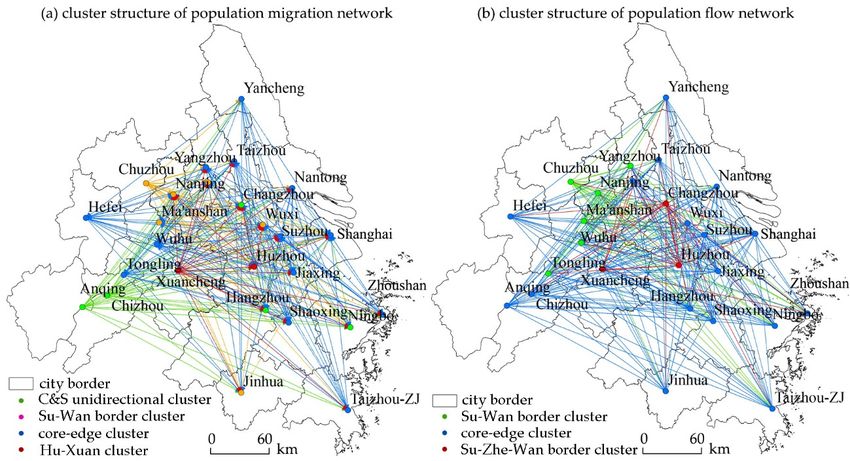
local network has the characteristics of a cluster structure. Using a modular calculation method (a
community detection algorithm [51]) to measure the cities’ association in the Spring Festival travel rush
and daily period of the Yangtze River Delta urban agglomeration, four and three cluster structures
were obtained, respectively (Figure 5). The population migration network of the Spring Festival travel
rush includes the central and southern unidirectional cluster of the Yangtze River Delta, the Jiangsu
and Anhui inter-provincial boundary cluster, the core–edge cluster in the Yangtze River Delta, and
the Zhejiang and Anhui inter-provincial boundary Huzhou–Xuancheng cluster. The daily population
flow network forms the Jiangsu and Anhui inter-provincial boundary cluster, boundary cluster of
the Jiangsu, Zhejiang, and Anhui provinces, and the core–edge cluster of Yangtze River Delta. These
cluster cities have a closer relationship and are geographically closer to each other, which indicates that
the urban closeness based on population migration still follows the restriction of the geospatial effect.
The core–edge clusters in the Yangtze River Delta are spatially divided by other cluster structures,
showing a spatial jump, and are distributed on the east and west sides of the Yangtze River Delta. It
can be seen that under the background of flow space, population flow and migration have a tendency
to partially overcome spatial friction.cluster of Yangtze River Delta. These cluster cities have a closer relationship and are geographically
closer to each other, which indicates that the urban closeness based on population migration still
follows the restriction of the geospatial effect. The core–edge clusters in the Yangtze River Delta are
spatially divided by other cluster structures, showing a spatial jump, and are distributed on the east
and west sides of the Yangtze River Delta. It can be seen that under the background of flow space,
Sustainability 2020, 12, 6803 12 of 19
population flow and migration have a tendency to partially overcome spatial friction.
Figure 5. Population flow (b) and migration (a) network cluster structure diagram of the Yangtze River
Delta urban agglomeration.
4. Analysis of Influencing Factors of Network Pattern Formation
4.1. Variable Selection
In the urban network based on population flow and migration, the relationship of the urban
network originates from population flow and migration between provinces, so the path selection
behavior of population flow and migration constitutes the microfoundation for understanding the
urban network correlation pattern. Based on the analysis framework of “behavior-structure-effect”,
this paper explains the formation mechanism of urban cyberspace pattern in the Yangtze River Delta
urban agglomeration. In the analysis framework, the spatial migration behavior of population at the
micro level is manifested as the urban connection process with the main characteristics of path selection
and path dependence at the macro level. These dynamic processes promote the orderly evolution of an
urban network self-organization system and form certain effects. Therefore, the factors influencing
the choice of population flow and migration path fundamentally shape the relationship pattern of the
urban network. Based on this idea, the following explanatory variables are selected in this paper:
First, the city attribute index. An urban network based on population flow and migration is more
dependent on people’s subjective mobility consciousness, which involves organizations’ tendency to
establish ties with other organizations that can make profits for themselves. The assumption is that
being an attractive network partner depends on some individual characteristics of the city. In this paper,
five indicators were selected as the proxy variables for urban attributes: (1) economic scale (GDP),
which is measured by the GDP per capita of permanent residents in the city region (ten thousand
yuan). (2) Political resources (capital), which is represented by the dummy variable of the urban
administrative level. The value of municipalities directly under the central government, provincial
capital cities, and cities with separate plans is 1, while the values of other cities are 0. (3) Employment
opportunities (employment) and the unemployment rate (unemployment) are measured by the newly
created urban jobs (%) and the registered urban unemployment rate of permanent residents (%),
respectively. (4) Labor wage (wage), using the average wage of employees (yuan) for measurement,
and (5) the industrial structure (industry), measured by the proportion (%) of the output value of the
secondary and tertiary industries in the gross product.
Second, the geospatial index. The geographical location and traffic conditions are the important
factors affecting the intensity of population mobility between cities. In this paper, five indicators wereSustainability 2020, 12, 6803 13 of 19
selected as the proxy variables of geographical space: (1) spatial distance (minimum distance), which
is measured by the shortest travel distance (km) between each pair of cities, representing the physical
distance in the place space (based on Baidu map query, the shortest traffic distance between each
pair of cities in the hybrid transportation system of high-speed railway, ordinary railway, expressway,
national highway and provincial highway); (2) time distance (minimum time), measured by the
shortest travel time (min) between each pair of cities. This is used to represent the network proximity
in the flowing space (through Baidu map query, the shortest travel time between each pair of cities
(if transfer is needed, the transfer time is included) was obtained based on the above transportation
system. In order to ensure the accuracy of the data, the starting and ending points were selected
as the main railway stations of each city in the query process. In addition, 12306 and Gaode auto
navigation were used to conduct navigation queries on 233 pairs of urban travel to further verify the
reliability of the data); (3) shoreline virtual variable (shoreline), where the code of cities along the
Yangtze River and coastal cities shall be 1, and the codes of other cities shall be 0; (4) the border area
virtual variable (border), where areas located on both sides of the inter-provincial boundary cities
code are assigned 1, while other cities are assigned 0 (riverside and coastal cities include the following:
Shanghai, Nantong, Suzhou, Yangzhou, Zhenjiang, Nanjing, Wuhu, Tongling, Anqing, Yancheng,
Jiaxing, Ningbo, Zhoushan, and Taizhou-ZJ. Cities along the inter-provincial boundary include the
following: Shanghai, Suzhou, Jiaxing, Wuxi, Huzhou, Hangzhou, Yangzhou, Nanjing, Changzhou,
Chuzhou, Ma’anshan, and Xuancheng); (5) trans-border frequency (trans-border). Here, we use the
number of inter-provincial boundaries for each pair of related city populations that are required to
go through to travel in the shortest travel time and count 233 associations. The number of border
crossings is at least one and at most three. The last three variables are used to capture the influence of
explanatory variables that do not change with time and provide a basis for subsequent effect studies.
Third, the network time lag (lag 2010). In the development of an urban network, path dependence
(also called preferential attachment [52,53]) is an important driving mechanism. This paper assumes
that the growth and development of urban network link relationships are not only affected by the
relevant variables of the same period, but also depend on the link relationship pattern formed in
history—that is, the habitus of choice of the migration path. In order to capture the influence of
early network development foundations on the current network spatial structure, the urban network
relationship matrix in 2010 is included in the explanatory variables (since there are no systematic
migration data from Baidu in 2010, the floating population data used in this paper are from the data of
the sixth census).
4.2. Analysis Results
In the QAP correlation and regression of the directed weighted network in the Spring Festival
travel period and the undirected weighted network in the daily period (Table 4), the terms of the
economic scale, political resources, employment opportunities, labor wages, industrial structure,
virtual variables of the coastal and riverside coastline, virtual variables of the boundary area, and
network time lag were all positive and passed the significance test. For example, in the regression
analysis of the net migration of the population during the Spring Festival travel rush, the fitting
coefficient of employment opportunities was 0.347. In the random rearrangement experiment, the
probability P (large) that the fitting coefficient was larger than the actual observed value was 0.025,
while the probability P (small) that it was smaller than the actual observed value was 0.975. In the daily
population mobility network regression analysis, the fitting coefficient of employment opportunities
was 0.405. In the random rearrangement experiment, the probability that the fitting coefficient was
greater than the actual observed value was 0.000, while the probability that it was less than the actual
observed value was 1.000. The unemployment rate, spatial distance, time distance, and trans-border
frequency were all negative values in the regression analysis of the population migration network
during the Spring Festival travel rush and the daily population flow network, where neither the
unemployment rate nor the spatial distance passed the significance test in the regression analysis of theSustainability 2020, 12, 6803 14 of 19
population migration network during the Spring Festival. Spatial distance failed the significance test
in the regression analysis of the daily population flow network. In a comprehensive sense, 12 factors,
including economic scale and spatial distance, explain the poor 85.6% distribution of network link
relationships of net migration in the Spring Festival travel rush and the 89.0% value of the floating
population for the daily period.
Table 4. Correlation and regression analysis results of quadratic assignment procedure (QAP) matrix.
Spring Festival Travel Rush Daily Period
Fitting P Fitting P
R P (Large) R P (Large)
Coefficient (Small) Coefficient (Small)
GDP 0.334 *** 0.057 *** 0.025 0.975 0.368 *** 0.071 *** 0.001 0.999
Capital 0.521 *** 0.067 *** 0.100 0.900 0.454 *** 0.247 ** 0.071 0.929
Employment 0.925 *** 0.347 *** 0.025 0.975 0.877 *** 0.405 *** 0.000 1.000
Unemployment 0.209 * 0.262 0.722 0.278 0.255 * 0.068 * 0.075 0.925
Wage 0.763 *** 0.051 *** 0.000 1.000 0.735 *** 0.312 *** 0.000 1.000
Industry 0.393 ** 0.030 ** 0.065 0.935 0.375 * 0.075 * 0.025 0.975
Minimum
0.303 * 0.033 0.724 0.276 0.333 * 0.064 0.866 0.134
distance
Minimum time 0.542 ** 0.209 ** 0.066 0.934 0.653 *** 0.291 ** 0.005 0.995
Shoreline 0.210 ** 0.047 ** 0.000 1.000 0.226 ** 0.051 ** 0.000 1.000
Border 0.646 *** 0.174 *** 0.005 0.995 0.652 *** 0.335 *** 0.000 1.000
Transborder 0.196 *** 0.031 *** 0.044 0.946 0.106 *** 0.072 *** 0.022 0.978
Lag2010 0.903 *** 0.799 *** 0.000 1.000 0.839 *** 0.701 ** 0.000 1.000
R2 0.856 0.890
Note: ***, ** and * represent significance at the levels of 1%, 5%, and 10%, respectively.
First, the economic scale, political resources, and industrial structure are important factors
influencing the formation of a population flow and migration network, while employment opportunities
and labor wages are key guiding factors for population migration. Through the hypothesis test of
the urban attribute and network relationship, it can be concluded that the expected population flows
and migration between high–high and low–high per capita GDP cities are significantly lower than
the actual values, and the expected population flow and migration between low–low per capita GDP
cities is significantly higher than the actual observed value (the judgment of cities with high and low
attribute values was based on the following: the average value of the attribute value was taken as
the truncation value. Cities whose actual attribute value was higher than the truncation value were
determined as the “high” type. Cities whose actual attribute value was lower than the truncation value
were determined as the “low” type). The hypothesis test of the relationship between political resources,
industrial structure, and the network presents similar characteristics. The correlation analysis results
of the QAP for employment opportunities, labor wages, and network relationships show correlation
coefficients between 0.735 and 0.925 and all passed the test of significance here, with highest relevance
in the city property index of the six variables, which can provide a key population flow moving
direction selection guide. The expected value of population migration between cities with high–high
and low–high employment opportunities is significantly lower than the actual observed value, and the
expected value of population migration between cities with low–low employment opportunities is
significantly higher than the actual observed value; the characteristics of the hypothesis testing results
of labor wage and network relationship are the same as above. Although the unemployment rate has a
negative impact on the net population migration, it does not constitute the main factor affecting the
population flow and migration because it does not pass the significance test of regression analysis.
The results show that cities with a large economic scale, rich political resources, and high degree
of industrial structure optimization are conducive to promoting population flow and migration. In
addition, cities with more employment opportunities and high labor wages are conducive to attracting
flow and migration.
Secondly, the spatial distance and time distance are conditional factors that affect the formation of
population flow and migration networks. Among them, the QAP correlation analysis results of the timeYou can also read