South Island Takahē Meta-population: 2020 Modelling Report - A Takahē Recovery Group initiative
←
→
Page content transcription
If your browser does not render page correctly, please read the page content below
South Island Takahē
Meta-population: 2020
Modelling Report                     1

A Takahē Recovery Group initiative
Acknowledgements
The development of this report was supported by the Takahē Recovery Group and the
IUCN SSC Conservation Planning Specialist Group
For further information on this project contact Glen Greaves: ggreaves@doc.govt.nz
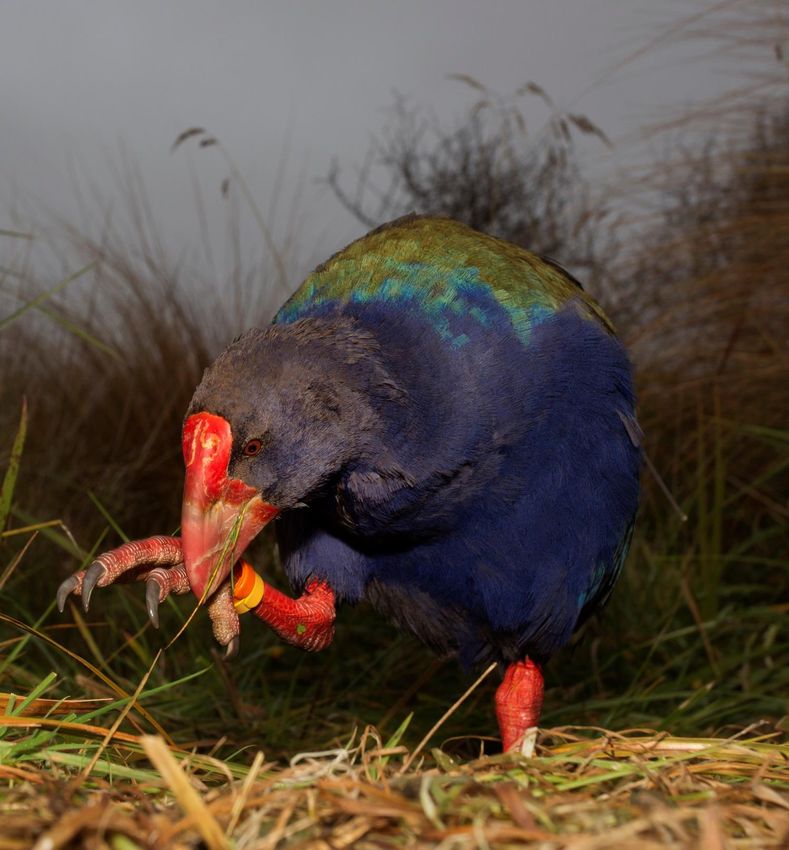
Cover photo © Stephen Belcher
IUCN encourages meetings, workshops and other fora for the consideration and analysis of issues
related to conservation, and believes that reports of these meetings are most useful when broadly
disseminated. The opinions and views expressed by the authors may not necessarily reflect the formal
policies of IUCN, its Commissions, its Secretariat or its members.
The designation of geographical entities in this report, and the presentation of the material, do not
imply the expression of any opinion whatsoever on the part of IUCN concerning the legal status of
any country, territory, or area, or of its authorities, or concerning the delimitation of its frontiers or
boundaries.
Recommended citation: Greaves, G., Rutschmann, A., Joustra, T., Marsh, P. and Lees, C.M. (2020). South Island
Takahē Meta-population: 2020 Modelling Report. IUCN SSC Conservation Planning Specialist Group, Apple
Valley, MN.
2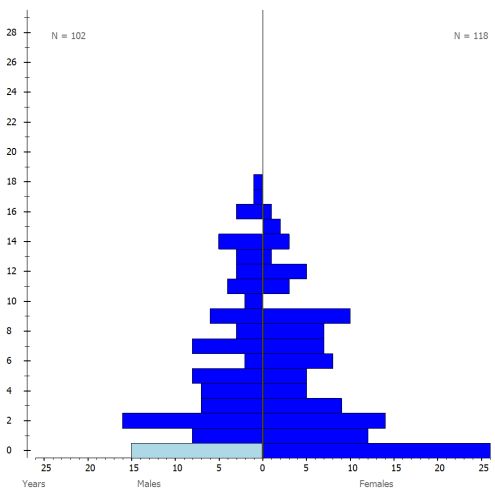
CONTENTS
Contents .......................................................................................................................................................... 3
Executive Summary .........................................................................................................................................4
Introduction ..................................................................................................................................................... 7
   Review of current status ...............................................................................................................................8
       Meta-population components ..................................................................................................................9
       Demographic profile of takahē outside the Murchison Mts ..................................................................... 11
       Genetic profile of takahē outside the Murchison Mts .............................................................................. 13
   Future directions for takahē management ................................................................................................. 15
       The 5-10 year situation and aims of this study ........................................................................................ 15
   Management strategies and scenarios modelled ........................................................................................ 16
   Building Vortex models ............................................................................................................................... 18
   Results ....................................................................................................................................................... 21
       Baseline Model. ...................................................................................................................................... 21
       Varying reproductive output................................................................................................................... 22
       Varying the intensity of genetic management (GM) ............................................................................... 26
       Varying capacity ..................................................................................................................................... 30
References ..................................................................................................................................................... 40
Appendix I: Vortex Model Details.................................................................................................................... 41
Appendix II: Dispersal between populations ...................................................................................................46
Appendix III: Meta-population performance in absence of catastrophes ........................................................ 47

                                                                                 3
EXECUTIVE SUMMARY
As of November 19, 2019, there are 83 takahē occupying North Island sites, 168 birds occupying South Island
sites, excluding the Murchison Mountains where there are an estimated 167 birds (128 adults plus offspring).
Total estimate for the species is 418. The meta-population outside the Murchison Mountains is
demographically and genetically healthy, growing at a rate of around 10% per year and with 97.07% of wild-
sourced gene diversity retained. Some sites in the North are proving less suitable for takahē or more resource
intensive for the Recovery Team, than initially envisaged. Meanwhile a new, large, wild site in the South Island
is performing well and more of these sites may soon be available, but they will remain an uncertain prospect
until more information is available on the results of 1080 bait trials. Immediate decision-making for takahē
needs to strike a balance between maintaining the current labour-intensive but relatively certain outcomes of
the existing meta-population and investing in new directions with potentially much larger but currently less
certain benefits.
AIMS OF THIS MODELLING PROJECT
To support the Recovery Team to build a species management approach that provides a targeted level of genetic
security, while considering limitations of resources (particularly site availability), medium term recovery goals, and
the various tools at their disposal.
INDICATORS OF SUCCESS
Though circumstances and knowledge may change dramatically for the programme over the next five years,
25-year success indicators are used here to distinguish successful models from unsuccessful ones.
• sustaining or exceeding population growth of at least 10% per annum over the next 25 years (for
combined sites outside the Murchison Mountains and Kahurangi);
• maintaining gene diversity at or above 98%1 (for combined sites outside the Murchison Mountains);
• maintaining gene diversity at or above 92%2 in individual sub-populations (for local health and
viability);
• realistic pair number and distribution given expected site availability (i.e. no more than 90 in Secure
Sites).
STRATEGIES MODELLED
Modelled management strategies were based on the potential ability to either 1) manipulate reproductive
output of birds; 2) genetically optimise pairings; 3) increase, decrease or re-distribute capacity; or 4) change the
rate of input of wild birds.
RESULTS
Over the next 25 years, and with the values and risks included in the models, extinction risk was zero for all
Secure Site scenarios. Gene diversity, which began in year 1 at 99.70%, declined slowly but overall gene
diversity targets were met for all scenarios except those in which large amounts of carrying capacity were
removed from year one without compensation elsewhere in the programme (e.g. with no recovery sites in
place).
Increasing reproductive output at Burwood to “high” and “very high” levels achieves all success criteria and
increases the number of birds at recovery sites by year 25 by roughly N=20-50 individuals. Benefits can only be
1
The actual target is 95% of wild source gene diversity. The current meta-population sits at 97.07% (calculated
from pedigree data using PMx). Gene diversity is overestimated in these VORTEX models and so a threshold of
98% is applied in evaluating model outputs, to account for the difference.
2
The actual target is 90% but is elevated to 92% to account for the overestimation expected in the models.
4realised where the additional population growth is matched by available carrying capacity, at sites that can
themselves support growth (i.e. are not population sinks). This may be met either by ongoing success at
Kahurangi or by a site of equivalent size and qualities.
Increasing the intensity of genetic management at Burwood and extending this to other Secure Sites
makes only a small difference to growth rates and gene diversity retention over the 25-year window. A larger
difference is made to the rate of inbreeding accumulation because inbreeding accumulates rapidly in the
smaller sub-populations and this has a disproportionate influence on the mean for the meta-population. With
current rates of gene-flow between sites, and current intensity of genetic management even if applied only at
Burwood, 25-year outcomes are good. The additional gains to overall meta-population gene diversity and
population growth resulting from applying additional close management everywhere, are likely to be small.
However, the value to health and welfare of individual birds, especially at the smaller sites, may still warrant its
application.
Varying capacity by deleting sites showed a range of outcomes. Genetic targets are still met when Tāwharanui
is removed and loss of both Tāwharanui and Motutapu takes gene diversity only slightly below the 98% target
with overall meta-population growth rate slightly increased (because Burwood does not have to “top-up” these
two sites). Removing the No MK Sites allowed all success criteria to be met. The loss of other individual sub-
populations can be tolerated if Burwood retains its current size and productivity, though not all success criteria
are met. Neither growth nor gene diversity criteria can be met without Burwood.
Increasing the rate of input of wild birds from the Murchison Mountains increases gene diversity and reduces
inbreeding accumulation but only slightly compared with other interventions. Note though that this may be
due to the models, which will assign new founders the same opportunities to contribute as other birds, when
they would be likely to receive preferential treatment.
In summary, the greatest gains for the overall meta-population are made where Burwood females are
individually highly productive and where the birds generated from this are deployed at sites that can support
good population growth. Maintaining gene-flow among sites is important. Current levels of close genetic
management are enough to meet success criteria and increasing this intensity makes only a slight difference.
Removal of low-performing sites can increase growth rates at recovery sites provided the conditions there
are favourable.
Note the low variance in mean meta-population size when either Motutapu or all MK Sites are removed. This is
because of the way in which the models are constructed. The MK Sites sub-population varies a great deal in size
over time due to the multiple local risks entered for those sites and the small amount of supplementation from
Burwood (3 pairs every 7 years). As a result, removal of those sites, or a significant component of them (such as
Motutapu), significantly reduces overall meta-population variation.
Table 1. summarises model outcomes for the population outside the Murchison Mountains and Kahurangi. The
larger report gives results that include these two sites. Note that throughout the report, models take a
precautionary approach to risk by including potential catastrophes of various types, at estimated rates and
severities. Appendix III shows the effect of removing these catastrophes on performance in individual sub-
populations and across the whole meta-population. With all catastrophes removed, the total modelled meta-
population (including the Murchison Mountains and any recovery sites) reaches almost 1000 birds in 25 years
(Mean N at 25 years across iterations = 983.00; SD =2.00), indicating recovery potential under closely managed
and well-resourced conditions.
5Table 1. Comparison of alternative management strategies on meta-population performance (excluding the
Murchison Mts. and Kahurangi). Green = outcomes that meet success criteria; Orange = outcomes close to
meeting success criteria; Red = outcomes that do not meet success criteria; Grey = Standard Deviation,
indicating degree of variability in the mean values.
Strategies Pairs stoch-r SD(r) Nall SD(Nall) GeneDiv SD(GD) Inbr SD(Inbr)
Varying reproductive output 1
50% females breeding at
98 0.06 0.07 277 38 0.985 0.0021 0.0136 0.0082
Burwood
75% females breeding at
94 0.07 0.07 275 39 0.984 0.0023 0.0139 0.0082
Burwood
100% females breeding at
92 0.09 0.07 275 39 0.984 0.0027 0.0152 0.0087
Burwood
Varying reproductive output 2
Very Low Performance
94 0.06 0.07 272 41 0.9848 0.0023 0.0133 0.0088
(0.75 fledged/ female/year)
Low Performance
92 0.08 0.07 274 40 0.9840 0.0027 0.0145 0.0093
(1.00 fledged/ female/year)
Current Performance
92 0.09 0.07 275 39 0.9836 0.0027 0.0152 0.0087
(1.12 fledged/ female/year)
High Performance
90 0.10 0.07 273 40 0.9832 0.003 0.0151 0.0091
(1.25 fledged/ female/year)
Very High Performance
(1.50 fledged per female per 88 0.12 0.07 276 38 0.9836 0.0027 0.0198 0.0106
year)
Varying the intensity of genetic management (GM)
No gene-flow between sites,
87 0.08 0.07 260 46 0.9822 0.0029 0.0288 0.0129
no GM within sites
Current gene-flow between
92 0.08 0.07 272 41 0.9817 0.0032 0.0223 0.011
sites, no GM within sites
No gene-flow between sites,
88 0.09 0.07 265 43 0.9839 0.0025 0.0206 0.0108
GM within sites
Current gene-flow between
92 0.09 0.07 274 40 0.9829 0.0026 0.0186 0.0096
sites, GM at Burwood only
Current gene-flow between
92 0.09 0.07 275 39 0.9836 0.0027 0.0152 0.0087
sites, GM at all MK sites
Varying capacity
Baseline (all current sites
92 0.09 0.07 275 39 0.9836 0.0027 0.0152 0.0087
retained)
Loss of Tawharanui 85 0.09 0.06 254 30 0.9828 0.0028 0.0143 0.0089
Loss of Tawharanui and
69 0.10 0.07 209 16 0.9796 0.0027 0.0147 0.01
Motutapu
Loss of Group A only (No MK
71 0.10 0.08 222 39 0.9802 0.0036 0.0138 0.0093
Sites)
Loss of Group B only (MK
50 0.13 0.06 153 5 0.9729 0.0035 0.0165 0.0119
Sites)
Loss of Burwood 57 0.03 0.12 164 46 0.9713 0.0084 0.0234 0.0165
Increasing wild inputs
Baseline (two wild birds every
92 0.09 0.07 275 39 0.9836 0.0027 0.0152 0.0087
seven years)
Two wild birds every five
92 0.09 0.07 276 39 0.9839 0.0027 0.0143 0.0081
years
Two wild birds every two
92 0.10 0.07 274 39 0.9850 0.0025 0.0132 0.0083
years
Stoch-r=mean instantaneous growth rate over 25 years; Nall=mean population size across iterations after 25
years, including populations that went extinct; GeneDiv=expected heterozygosity at 25 years; Inbr=population
average inbreeding coefficient.
6INTRODUCTION
The takahē is the largest living member of the rail family and endemic to New Zealand. As of November 19, 2019,
an estimated 418 birds remain, 251 occupying 1 recovery site3, 12 secure sites4, and 7 advocacy facilities5, with
approximately 167 birds in one remaining wild site6 in the Murchison Mountains (see Figure 1).
Sustained recovery and conservation of the species is currently supported by large-scale intensive breeding at
the Burwood captive breeding centre in Te Anau, followed by strategic translocation to other sites within the
wider meta-population. In 2014, the takahē Recovery Group proposed the management of remaining takahē as
two distinct meta-populations; one focused on the northern islands and the other on southern areas, fostering
adaptation in two contrasting bioclimatic zones and substantially reducing the need for long-distance
translocation of birds. A 10-year strategy and action plan were developed for this by the Team (see Lees et al.,
2014) and this has been actively pursued with a total of 83 birds now residing in the North.
In recent years it has become apparent that some of the secure sites in the North are less suitable for takahē or
more resource intensive for the Recovery Team, than initially envisaged and new sites needed to support
expansion are proving hard to find. At the same time, a large wild site has become available for takahē on the
South Island potentially able to support thousands of birds and others may follow in the near future. The utility
of these sites will depend firstly on whether they provide suitable conditions for takahē survival and breeding
and secondly on whether takahē can co-exist with 1080-based predator control measures. So far, birds released
to the first of these sites (Kahurangi) are doing well. The results of bait trials will be available within the next two
years.
At present the existing North Island Meta-population, along with the Burwood breeding centre in Te Anau,
provides insurance against catastrophic decline of the single remaining wild population in the Murchison
Mountains and against the further erosion of genetic diversity within the Murchison’s population as a result of
its small size. However, maintaining this meta-population is labour intensive. Expanding the takahē meta-
population into larger “recovery sites” could provide a massive leap in the long-term security of the species and,
eventually, a better return on the investment of labour and resources. However, it will not be clear for several
years whether these sites will realise this potential. In the meantime, Recovery Team resources are limited, and
decisions will need to be made about how to invest these resources to ensure the best outcomes for the species.
A balance will need to be struck between maintaining the current labour-intensive but relatively certain
outcomes of the existing meta-population and investing in new directions with potentially much larger but less
certain benefits.
The purpose of the population viability analysis modelling exercise described here was to test scenarios for the
redistribution of effort and to compare their impacts on species abundance, viability and genetic diversity. The
PVA outputs are interpreted here for clarity but management recommendations are not included; this will be
done by the Recovery Team once further information about recovery sites and the bait trials is available and can
be incorporated into decision making.
3
Large, wild, mainland areas within the former range of the South Island Takahē.
4
Predator-free islands and fenced sites.
5
Zoological gardens open to the public.
6
Sites with a continuous history of Takahē presence.
7REVIEW OF CURRENT STATUS
All remaining takahē originate from the South Island population in the Murchison Mountains. The species is
currently listed as Endangered by the IUCN in its Red-List of Threatened Species (IUCN, 2019).
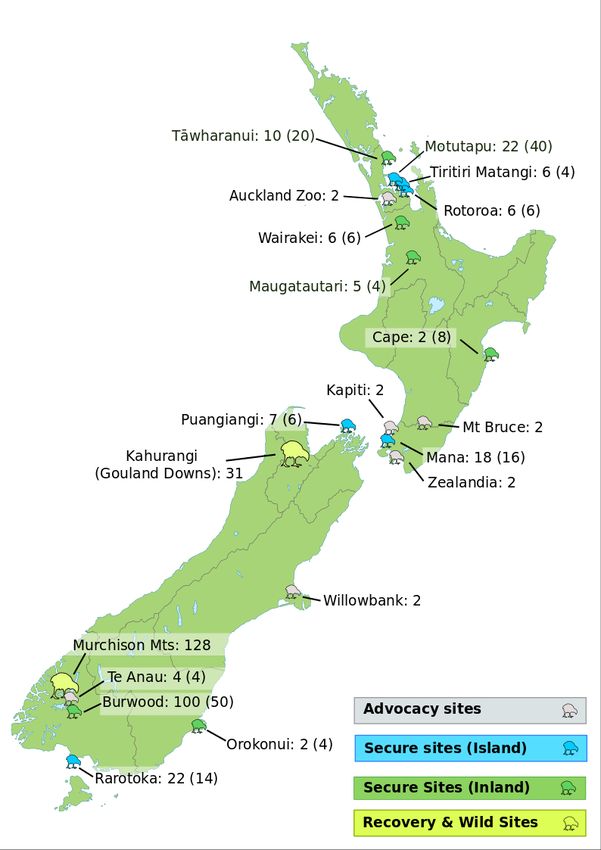
Figure 1. 2019 distribution of Takahē
Each site name is followed by the
estimated adult capacity with the
estimated total capacity in brackets.
In total, as of November 19, 2019, there are 83 birds occupying North Island sites and facilities and 168 birds
occupying South Island sites and facilities (excluding the Murchison Mountains). Within the Murchison
Mountains there is an estimated 167 birds (70 pairs plus offspring). This brings the total estimate for the species
to 418. This is an increase of 132 birds since the 2014 report (Lees, et al., 2014).
8META-POPULATION COMPONENTS
Supporting the species to thrive as a single meta-population currently requires management of and movement
between the following components (see Table 2 for details):
WILD & RECOVERY SITES
Description: genetically and demographically resilient populations under wild conditions and natural selection
pressures. Genetic and demographic management limited to determining the number and selection of birds to
be released to or removed from, those sites. Long-term these sites should require little or no genetic or
demographic management (there may be a need to engineer gene-flow, depending on site sizes and
connectivity).
Purpose: multiple, self-sustaining recovery sites is a conservation endpoint.
Challenges: The only remaining wild site is in the Murchison Mountains. The population there is estimated to
be declining at 3% per year due to predation and requires ongoing supplementation. Kahurangi is new and is
currently the only “recovery site”. It is showing promise, but its long-term security cannot be assessed until the
completion of 1080 bait trials.
BURWOOD BREEDING CENTRE
Description: highly successful captive facility, productive and genetically efficient and protected from predator
incursion. Birds produced here are fit for wild translocation. Demographic and genetic management is highly
intensive with direct control of pairing combinations and reproductive outputs.
Purpose: a source of birds for wild and recovery sites and insurance against catastrophic loss at those sites.
Challenges: single site with a relatively small resident population – not sufficient to be the sole source of both
insurance and of birds for release.
META-POPULATION OF SECURE SITES
Description: predator-managed islands and mainland sanctuary areas with some captive facilities, distributed
mainly in the North Island, providing additional, secure space for birds outside wild and recovery sites and
outside Burwood. Depending on the specific site, demographic and genetic management ranges from highly
intensive (management of pairing combinations to minimise average mean kinship and reduce inbreeding
accumulation, and control of reproductive outputs) to limited intervention. For analysis these are distinguished
as MK Sites and No MK Sites. Some Secure Sites may be designated “Retirement Sites” and allocated only birds
older than 14 years. At present Auckland Zoo is the only designated Retirement Site.
Purpose: spreads risk of loss across several sites; builds numbers to increase resilience to environmental risks;
slows the rate of genetic deterioration in the insurance population and operates as an additional source of birds
for release and for advocacy.
Challenges: the species does not favour northern sites (too warm). As a result, some sites are not performing
well (breeding rates are low). At present, birds bred at these sites need pre-release conditioning at Burwood
(though in future tussock habitat will be de-emphasised in release site choice, potentially making it easier for
northern birds to adapt). At some sites the management burden is high for several reasons. In short, for a
number of these sites and in terms of recovery goals, return on investment is low.
9Table 2. Individual site characteristics and allocation to sub-populations for subsequent modelling.
Model sub-populations Sites N In pairs by K
2022
Wild Murchison Mts 200 128 N/A
Recovery Site Kahurangi 31 N/A N/A
Burwood Burwood 100 50 100
Group A Secure Sites (NoMK)
Breeding sites, without MK Mana 18 16 24
management.
Raratoka 22 14 30
Group B Secure Sites (MK)
Breeding sites with MK Rotoroa 6 6 9
management.
Maungatautari 5 4 6
Tiritiri Matangi 6 4 6
Cape Sanctuary 2 8 12
Orokonui 2 4 6
Puangiangi 7 6 9
Mt. Bruce 2 2 2
Kapiti Island 2 2 2
Te Anau 4 4 6
Wairakei Sanctuary 6 6 7
Willowbank 2 2 2
Zealandia 2 2 2
Tāwharanui 10 20 30
Motutapu 22 40 60
Group C
Retirement sites Auckland Zoo 2 - 2
N= current number of birds (including juveniles); Paired by 2022 = number of adult birds expected to be in established pairs
by 2022; K=total capacity including juveniles; Mean Kinship (MK) Management = preferential pairing of birds with similar
and low levels of relatedness to the wider meta-population.
10DEMOGRAPHIC PROFILE OF TAKAHĒ OUTSIDE THE MURCHISON MTS
This section provides a snapshot of the demographic profile and potential of the current takahē meta-population
excluding the Murchison Mountains. The summaries provided were generated from the Takahē Studbook
(Greaves & Joustra, 2019) using the small population analysis program PMx (Ballou, et al., 2018). Separate
summaries are provided for the North Island Meta-population and for all takahē living outside the Murchison
Mountains and Kahurangi.
As can be seen from Figure 2a the North Island population (as of November 2019) stood at 83 individuals spread
across 12 sites in the North Island. It has an even sex-ratio (41 males to 42 females) and a balanced age-structure.
Figure 2b is a summary of the managed takahē population outside the Recovery and Wild sites. As at November
2019, the wider insurance meta-population (at 20 sites distributed New Zealand-wide) stood at 220 individuals.
The population has a roughly even sex-ratio (102 males and 118 females) and a balanced age-structure.
Estimates of annual population growth rate (lambda), generation length and life expectancy were calculated
from life-table data (see Appendix II) gathered and treated by PMx from studbook-derived age-specific mortality
and reproduction values. Lambda values of less than 1.0 indicate a declining population; those above 1.0 indicate
growth. Vital rates to date in the population predict growth and this is illustrated in the 20-year projections in
Figure 3b.
Figure 2a. Demography overview of the takahē population in the North Island showing age pyramid (Nov
2019). (Note: excludes any additional birds hatched in 2019/20 season).
Total Males Females
Totals 83 41 42
Pre-Reproductive 1 1 0
Breeding Age 82 40 42
Post Reproductive 0 0 0
Proven Breeder 49 23 26
Retired birds 14 7 7
# Sites (including 12
zoos) ¹
Generation length 6.9yrs
(T)
Expected annual 1.047
growth (ʎ)
Life expectancy 10.8yrs
from hatch7
7
Note: at Burwood chicks are counted from hatch, but at other sites they are added to the studbook only after banding at
3-5 months of age. Any deaths prior to this are therefore not included in the studbook. Overall then, PMx analyses of
studbook data will underestimate first year mortality and as a result overestimate life expectancy from hatch. As a
precaution the value presented can be interpreted as life expectancy from 3-5 months.
11Figure 2b. Demography overview of the total managed takahē population in New Zealand (i.e. outside the
Murchison Mts.) showing age pyramid (Nov 2019). (Note: excludes Kahurangi (Recovery Site) and any
additional birds hatched in 2019/20 season).
Total Males Females
Totals 220 102 118
Pre-Reproductive 15 15 0
Breeding Age 205 87 118
Post Reproductive 0 0 0
Proven Breeder 101 50 51
Retired birds 20 10 10
# Sites (including 18
zoos) ¹
Generation length 6.9yrs
(T)
Expected annual 1.047
growth (ʎ)
Life expectancy 10.8yrs
from hatch
Figure 3a. Projections for the North Island
population based on mortality and
reproductive parameters observed up until
2014 assuming no further imports from
Burwood. Black dotted line shows deterministic
projection; blue dotted lines show 95% confidence
intervals for stochastic projections; red solid line shows
mean of stochastic projections.
Figure 3b. Projections for the North Island
population based on mortality and
reproductive parameters observed up until
2019 assuming no further imports from
Burwood. Black dotted line shows deterministic
projection; blue dotted lines show 95% confidence
intervals for stochastic projections; red solid line shows
mean of stochastic projections.
Figure 3c. Projections for the combined
North Island and South Island sites
(excluding Murchison Mts and Kahurangi).
Black dotted line shows deterministic projection; blue
dotted lines show 95% confidence intervals for stochastic
projections; red solid line shows mean of stochastic
projections.
12As illustrated in graphs 3a and 3b, the prognosis for a demographically self-sustaining North Island meta-
population has improved since 2014, with sustained positive growth now predicted even in absence of further
imports from Burwood.
However, vital rates at the Burwood breeding centre continue to out-perform those elsewhere such that adding
Burwood and the other South Island sites (excluding Murchison Mts and Kahurangi) produces an even more
optimistic and more certain picture of growth into the future (see Figure 3c).
GENETIC PROFILE OF TAKAHĒ OUTSIDE THE MURCHISON MTS
Gene diversity is of recognised importance to short-term population health and to long-term adaptability in the
face of environmental change (Frankham, et al., 2010; Frankham, et al., 2013; Jamieson & Allendorf, 2012). The
status of gene diversity can be inferred from analyses of pedigree information from the population or
populations of interest. The Department of Conservation (DOC) currently maintains full pedigree data for birds
held outside the Murchison Mountains (which as the only remaining wild site is too inaccessible for this to be
achievable). These data have been transferred to the studbook records keeping and analysis program SPARKS
(Species360, 2012) and the resulting dataset (Greaves & Joustra, 2019) analysed using the small population
analysis program PMx (Ballou, et al., 2018). Note that in the absence of information to the contrary the analysis
calibrates the relatedness of founder individuals to zero; that is, it assumes that those wild-caught birds
sampled from the Murchison Mountains which form the basis of the North and South Island pedigreed
populations, were sampled randomly and representatively from the wild and were not unusually close relatives
(where “close relatives” is judged relative to the population average). A summary of measures is shown in Table
3. below
Table 3. Genetic characteristics of the managed population in the North Island, the combined population
outside the Murchison Mountains (wild) and the Kahurangi recovery site (Nov 2019).
Characteristics All All Kahurangi Definitions and notes
managed managed recovery
sites in the sites site
North Island outside of
the wild
Number of birds 83 220 31 Number of living birds.
Founder number 44 44 30 Number of birds sampled from the wild
population who have no known relationship to
any other birds in the population except for their
own descendants.
% Ancestry certain 92 % 90.5 % 90.3 % % of the birds’ pedigree that can be traced back
to known founders.
Current Gene 95.98 % 97.07 % 91.53 % The heterozygosity expected in the progeny
Diversity under random breeding.
Potential Gene 98.00 % 98.43 % 96.64 % The GD that could theoretically be achieved by
Diversity adjusting the relative contributions of founders
by optimising pairing.
Founder Genome 12.44 17.09 5.90 The number of wild caught founders that would
Equivalents contain the same amount of gene diversity as the
population.
Potential Founder 25.12 31.80 14.88 The FGE’s that could be achieved by adjusting
Genome Equivalents the relative contributions of founders.
Population Average 0.0323 0.0230 0.0525 The average inbreeding coefficients of all
Inbreeding individuals in the population. A common rule of
Coefficient thumb threshold for captive populations is
F=0.1250
Inbreeding Range 0 – 0.3438 0 – 0.3438 0 – 0.1532 F = 0.3438 in 2 individuals in the population (both
at Tiritiri Matangi Island), F= 0.2813 in 2
individuals (both at Mana Island). Remainder of
the population falls under F= 0.250.
13Characteristics All All Kahurangi Definitions and notes
managed managed recovery
sites in the sites site
North Island outside of
the wild
Population Average 0.0402 0.0293 0.0847 The average of the MK values of all individuals in
Mean Kinship the population (and the expected average
inbreeding coefficient of the progeny under
random breeding).
Ratio of Genetically 0.5283 0.4304 0.3896 Indicates how efficiently the population will
Effective Pop. Size to retain GD from one generation to the next. 0.2 –
Actual Pop. Size 0.4 is common for well-managed captive
populations (Frankham et al. 2002).
(Ne/N)
Note: Living founder birds are included.
The analyses show that both the North Island population and the wider population outside the Murchison
Mountains, are well-founded, have been well-managed and can be expected to have retained high levels of wild
source gene diversity; the standard gene diversity retention target for conservation breeding programs is 90%
for the duration of the program and both subsets considered here sit comfortably above this. Note though that
these figures estimate the amount of wild source gene diversity retained; they make no judgement about the
gene diversity of the wild source population at the time of sampling, which may have been low following many
multiple generations of small size and isolation.
14FUTURE DIRECTIONS FOR TAKAHĒ MANAGEMENT
Over the next 10-15 years, advances in predator control capability and capacity are expected to increase
significantly. This has the potential to mobilise multiple large tracts of natural habitat on the South Island where
takahē could eventually persist safely and in numbers of several thousands. Once multiple sites of sufficient
size and capacity are in place, the species should: require minimal ongoing management; be demographically
and genetically secure; and no longer require close management of a separate insurance meta-population. In
the meantime, management decisions need to be made which, over the next five to ten years, will effectively
bridge the gap between current and likely future approaches to takahē conservation, taking into account the
status and challenges of the current programme, the uncertainty relating to some elements of it and the
resources available to the Recovery Team. To support these decisions, Population Viability Analysis (PVA) tools
were applied using inputs from the takahē Recovery Team, to compare the impact on insurance meta-
population performance of feasible alternative management strategies.
THE 5-10 YEAR SITUATION AND AIMS OF THIS STUDY
The following points describe the challenges relevant to planning over the next 5-10 years of this programme:
1. The programme currently targets 90 pairs in Secure Sites, calculated from PMx to meet
genetic targets over 25 years, but it is proving difficult to achieve this with the sites available
and there are no new secure sites on the horizon.
2. Some secure sites are particularly management-intensive and as a result, return on
investment is low.
3. The new recovery site (Kahurangi) is outperforming some of the Secure Sites but will
remain an uncertain prospect until more information is available on the results of the 1080
bait trials.
4. The takahē population is growing rapidly and founder representation is evening out.
5. Available space will be filled by 2022 and a new recovery site will be mobilised by then.
6. We will soon have the takahē genome sequenced, with ~80% of the current population
sampled, allowing for targeted sampling of new, high-value founders from the Murchison
Mts.
AIMS OF THIS MODELLING PROJECT
To support the Recovery Team to build a species management approach that provides a targeted level of genetic
security, while considering limitations of resources (particularly site availability), medium term recovery goals, and
the various tools at their disposal.
INDICATORS OF SUCCESS
Though circumstances and knowledge may change dramatically for the programme over the next five years,
25-year success indicators are used here to distinguish successful models from unsuccessful ones.
• sustaining or exceeding population growth of at least 10% per annum over the next 25 years(for
combined sites outside the Murchison Mountains);
• maintaining gene diversity at or above 98%8 (for combined sites outside the Murchison Mountains);
• maintaining gene diversity at or above 92% 9 in individual sub-populations (for local health and
viability);
8
The actual target is 95% of wild source gene diversity. The current meta-population sits at 97.07% (calculated
from pedigree data using PMx). Gene diversity is overestimated in these VORTEX models and so a threshold of
98% is applied in evaluating model outputs, to account for the difference.
9
The actual target is 90% but is elevated to 92% to account for the overestimation expected in the models.
15• realistic pair number and distribution given expected site availability (i.e. no more than 90 in Secure
Sites).
The modelling exercise simulates the management options available and measures the performance of each
against these success indicators.
MANAGEMENT STRATEGIES AND SCENARIOS MODELLED
Modelled management strategies are based on the potential ability to either 1) manipulate reproductive output
of birds; 2) genetically optimise pairings; 3) increase, decrease or re-distribute capacity; or 4) change the rate of
input of wild birds. The most successful scenarios will be those that deliver sufficient benefits to growth and
gene diversity with realistic and achievable application of resources. Additional scenarios were also modelled
to explore relationships between variables that while not directly related to current management decisions,
may be relevant to future ones. Table 4. describes the strategies and scenarios tested using PVA models. Not
all are meant to describe real-life management strategies. For example, ceasing inter-site transfers is not a
strategy under consideration, but models of this are run to illustrate the importance of this “business-as-usual”
management and the impact of not doing it on meta-population health and viability. Note that advocacy roles
and aims are not considered in this analysis.
Table 4: Alternative management strategies and scenarios tested, and an outline of the model manipulation
required. Note that outputs from these models refer to the whole meta-population, not just the birds outside
the Murchison Mountains and Kahurangi.
Management strategy Scenarios tested Model manipulation
Varying reproductive output
Females breeding rates at Low rate Annual % females breeding =50%
Burwood
Medium rate Annual % females breeding =75%
High rate Annual % females breeding =100%
Individual female outputs at Very low 0.75 fledged /female/year
Burwood
Low 1.00 fledged /female/year
Current 1.12 fledged /female/year
High 1.25 fledged /female/year
Very high 1.50 fledged /female/year
Varying genetic management intensity (starting kinships meta-population-wide = 0.0261 (current
pedigree average))
Vary rates of inter-site Current rates of dispersal Rates as described in Figure 2.
movement between sites
No dispersal between sites. No dispersal from Year 1 onwards.
Close genetic management Optimise pairings and slow Select pairings to minimise average
at selected sites inbreeding at Burwood only. MK and avoid mean Inbreeding ≥ 0.125
at Burwood.
Optimise pairings and slow As above but with extended to Secure
inbreeding at Burwood AND at Sites with MK management
MK Sites. capability.
Varying capacity
Include, exclude or re- Remove Tāwharanui and K is removed for Tāwharanui. No
purpose sites repurpose Motutapu as a change required for Motutapu as
retirement site. repurposing does not impact K or vital
rates.
Remove Tāwharanui and Total K for these two sites is removed
Motutapu and 15 birds (the excess created) is
transferred to Kahurangi.
16Remove sub-populations Remove MK Sites K=0 for MK SItes, resident birds are
removed from the metapopulation.
Remove No MK Sites K=0 for No MK Sites, resident birds are
removed.
Remove Burwood K=0 for Burwood, resident birds are
removed.
Vary wild inputs
Lower recruitment rate Four birds every 7 years from the wild.
Current recruitment rate Two birds every 7 years fr0m the wild.
Increased recruitment rate Two birds every 14 years from the
wild.
Additional models 1
Impact of 1080 at Kahurangi Current modelled impact Both predation and 1080 negatively
impact survival and reproduction
1080 removed Negative impacts of predation
increase, 1080 impacts stay the same.
1080 poisoning increases Negative impacts of 1080 increase,
predation stays the same.
Additional models 2
Establishing new sites Impact of dispersal and starting Initial population sizes of 5; 10; 15; 20;
size on extinction risk 25; 30; 40 and 50 birds were used and
Impact of dispersal and starting pairs of birds were transferred every
size on gene diversity retention 10; 7; 5; 2 or 1 year
17BUILDING VORTEX MODELS
The simulation software programme VORTEX (v10.3.6.0) (Lacy and Pollak 2017) was used to model alternative
Takahē management strategies using data from previous PVA models (see Lees et al., 2014) updated with
recent data from the studbook (Greaves & Joustra, 2019) and additional expert opinion from the Recovery
Team. VORTEX is a Monte Carlo simulation of the effects of deterministic forces as well as demographic,
environmental, and genetic stochastic events on populations of wildlife. VORTEX models population dynamics
as discrete sequential events that occur according to defined probabilities. The programme begins by creating
individuals to form the starting population and then steps through life cycle events (e.g., births, deaths,
dispersal, catastrophic events), typically on an annual basis. Events such as breeding success, sex at birth, and
survival are determined based upon designated probabilities. Consequently, each run (iteration) of the model
gives a different result. By running the model hundreds of times, it is possible to examine the probable outcome
and range of possibilities. For a more detailed explanation of VORTEX and its use in population viability analysis,
see Lacy (2000) and Lacy et al. (2017).
LIMITATIONS OF THE MODELS
PVA models were built to emulate the composition of the takahē meta-population, the roles and intensity of
management of the different sites and, roughly, the direction and scale of movements between sites. However,
some aspects of dynamics and management were hard to capture because decisions about movements and
management are not directed by a single and constant set of rules. Instead, decisions are in part actively driven
towards project goals and in part reactively driven in response to unexpected events and trends in the meta-
population, to changes in resourcing and to new opportunities. However, given that this reactive feature is
constant across all scenarios the models should still provide a useful tool for comparison between different
strategies.
MODEL STRUCTURE
For the purpose of modelling, the meta-population structure was broken down into a number of “sub-
populations”. Sub-populations are either single sites or facilities or are groups of sites that share characteristics
such as intensity of management, degree of risk, or patterns of movement to and from other sub-populations.
The pattern of flow of birds between sub-populations is illustrated in Figure 4. and Table 2. shows the allocation
of individual sites to the different sub-populations (see Figure 1. for geographic locations).
Figure 4: PVA sub-populations and rules for movements of birds • MURCHISON MOUNTAINS: 1 PAIR
PER GENERATION TO BURWOOD.
RECEIVES SIX 1-YEAR-OLD BIRDS
Secure PER YEAR FROM BURWOOD.
sites with • BURWOOD TOPS UP OTHER SITES:
Recovery MK MURCHISON MTS. > SECURE SITES >
KAHURANGI.
Sites
• MK SITES: TOP UP NO MK SITES
BEFORE BURWOOD IS CALLED ON.
Secure sites
• ONCE ALL SECURE SITES ARE
without MK FILLED, ALL SURPLUS JUVENILES
ARE MOVED TO KAHURANGI.
Murchison
Burwood • ONCE KAHURANGI IS FULL, A
Mts.
SECOND, HYPOTHETICAL SITE IS
MOBILIZED.
18INCORPORATING RISK
Risks are incorporated into the VORTEX model in several different ways. Risks to reproduction and survival that
are a year-round or regular feature of the takahē’s environment or biology are factored into annual, age-specific
mortality and fecundity rates. The extent of year-to-year variation in these rates is added by the user as an
additional modifier, and any additional variation resulting from “sampling error” (i.e. small population size) is
included by the programme itself. There is also an opportunity for the user to include occasional, extreme
fluctuations (catastrophes) in mortality or fecundity resulting from, for example, fires, floods or disease
outbreaks. These were included or excluded on advice from the Recovery Team (see Appendix I. for details).
At Secure Sites, incidental risks are standard across all sites (e.g. firearm misuse, bait station risks, dog attacks)
and so are included in annual rates. No disease issues have been observed to date, though it was noted that this
has been a problem for other bird species. Some protection from disease outbreak is provided by the
fragmented nature of the meta-population, though depending on the disease, the current rates of inter-site
movements may reduce or remove this protection. Disease is included in annual mortality and reproductive
rates however disease outbreaks (extreme disease events) are not included in this round of modelling.
Localised flooding could be a risk at wild or recovery sites but would only be expected to affect one or two pairs
and so is not included in the models. Though none have occurred in 30 years, fire is considered a potential risk
at Burwood and one likely to be increasing with climate change and site visitor numbers.
Predation is an ongoing risk in the Murchison Mountains causing approximately 10% additional mortality every
four years. In Kahurangi, where aerial baiting with 1080 keeps predation down to acceptable levels, 1080
poisoning is a risk. This risk is not yet able to be measured, but a threshold of acceptable risk is set here at 10%
additional mortality once every four years and this is the level of risk included in the Kahurangi model. It is
assumed that if this threshold is exceeded, Kahurangi birds would be moved elsewhere or alternative predator-
mitigation would be used to keep mortality rates at or below this threshold.
THE BASELINE MODEL
A Baseline Model was constructed based on updated parameters from previous analyses (see Lees et al., 2014).
For uncertain parameters a range of values was tested representing pessimistic, best guess and optimistic
estimates. Across the range of values tested and as for previous analyses, growth in the current model is
especially sensitive to the percentage of females breeding annually, the mortality rate of adult females and the
mortality rate of juveniles. Table 7. Shows the
values tested and the annual growth rates (λ)
generated by each. As shown, annual growth
varies between 4.7 and 13.2% per annum but
the Best Guess scenarios sit at 9.7%, which
accords well with the rates recently observed in
the living population (Greaves, pers. comm.).
Figure 5. Radial plot comparing the impact
on modelled population growth of
optimistic (green), best guess (orange) and
pessimistic (red) values for seven different
takahē model parameters.
19Table 5. Pessimistic, Best Guess and Optimistic values tested in the Baseline Model, with the stochastic growth
rates (r) that these variations produced.
Age at last
Age at first
of Breeding
Percentage
depression
Inbreeding
Sex-Ratio
mortality
mortality
mortality
breeding
breeding
Lifespan
Juvenile
females
Female
Male
Growth rate
Pessimistic 0.081 0.073 0.047 0.079 0.072 0.090 0.077 0.095 0.091
Best Guess 0.097 0.097 0.097 0.097 0.097 0.097 0.097 0.097 0.097
Optimistic 0.124 0.129 0.122 0.101 0.132 0.104 0.101 0.101 0.107
Values
Pessimistic 70 45 10 10 4 13 0.6 17 4.7
Best guess 60 30 6 6 3 15 0.5 19 2.35
Optimistic 50 20 2 2 2 17 0.4 21 0
20RESULTS
Models were built for each of the scenarios described in Table 4. Each model was run 500 times, for a period of
25 years. The following pages consider each model in turn, reporting the following information:
• Expected change in population number over time, for different sub-populations, illustrated
as graphs showing mean population size across iterations for each year of the simulation
with shading to show the variation in this (as +/- 1 standard deviations from the mean).
• A summary table showing:
o stochastic growth rate (r), mean and standard deviation;
o probability extinct after 25 years (PEx);
o mean population size at 25 years (N) and standard deviation;
o gene diversity at 25 years (GD), mean and standard deviation;
o mean population inbreeding coefficient at 25 years.
• For a subset of scenarios, accumulation of inbreeding and loss of genetic diversity over time
are presented as graphs.
BASELINE MODEL.
In the Baseline model, all populations are connected as described earlier. This represents “business as usual” in
the meta-population and is used to evaluate the impact of alternative strategies.
Figure 6.
Baseline sub-
population
growth
projections
over 25 years
(graph) and
associated
metrics (table).
Population r SD(r) PEX N SD(N) GD SD(GD) Inb SD(Inb)
Burwood 0.03 0.13 0.00 92.79 9.12 0.97 0.00 0.0070 0.01
Murch Mts 0.02 0.10 0.00 169.38 31.34 0.98 0.00 0.0078 0.01
Sites MK 0.00 0.15 0.00 111.39 40.05 0.96 0.02 0.0150 0.02
Sites No MK 0.02 0.10 0.00 51.92 2.14 0.97 0.01 0.0121 0.02
Kahurangi 0.04 0.09 0.00 343.73 104.69 0.99 0.00 0.0093 0.01
Meta-
0.03 0.05 0.00 769.20 126.91 0.99 0.00 0.0096 0.00
population
21As can be seen, the meta-population performs well under “business as usual” management. Gene diversity
remains above the 98% threshold in the meta-population and at or above 96% in all sub-populations. The lower
value at Sites No MK is due to the small size of this sub-population and consequent rapid loss of gene diversity
through drift. Overall this is a hi9h-performing strategy which meets the genetic target and sees good
growth at Kahurangi with no detriment to the wider insurance meta-population.
VARYING REPRODUCTIVE OUTPUT
The first set of scenarios in this section tests the impact of varying the annual percentage of adult females
breeding at Burwood on meta-population performance. The second set tests the impact of varying the average
individual outputs of the birds that breed, in terms of average number of birds fledged per year.
a. b.
Figure 7. Varying the annual percentage of
c.
females breeding at Burwood (a. 50%; b.75%
and c. 100%)
Varying the percentage of females breeding at Burwood alters the expected meta-population size at 25 years
from a low of N=631 birds (50%), to a high of N=770 (100%). At 75% females breeding N= 736. Extinction risk is
zero for all sub-populations and gene diversity remains above the threshold for success over the 25-year period.
The difference made to individual sites is relatively small.
22Table 6. Summary statistics for meta-population performance at 25 years when varying the annual
percentage of females breeding at Burwood (a. 50%; b.75% and c. 100%)
Sub-population r SD(r) PEX N SD(N) GD SD(GD) Inb SD(Inb)
a. Burwood 0.00 0.10 0.00 88.93 9.80 0.97 0.00 0.0049 0.01
Murch Mts 0.00 0.12 0.00 150.73 37.88 0.98 0.00 0.0074 0.01
MK Sites 0.00 0.14 0.00 118.70 37.11 0.97 0.01 0.0119 0.01
No MK Sites 0.01 0.08 0.00 49.87 4.44 0.95 0.01 0.0203 0.02
Recovery Site 0.05 0.11 0.00 223.10 109.57 0.98 0.01 0.0109 0.01
Meta-
0.02 0.05 0.00 631.33 137.55 0.99 0.00 0.0101 0.01
population
b. Burwood 0.01 0.12 0.00 90.99 8.85 0.97 0.00 0.0064 0.01
Murch Mts 0.02 0.10 0.00 165.04 33.46 0.98 0.00 0.0081 0.01
MK Sites 0.00 0.14 0.00 121.70 33.83 0.97 0.01 0.0117 0.01
No MK Sites 0.01 0.07 0.00 51.46 2.30 0.96 0.01 0.0163 0.02
Recovery Site 0.04 0.09 0.00 306.96 108.31 0.99 0.00 0.0092 0.01
Meta-
0.02 0.05 0.00 736.15 125.81 0.99 0.00 0.0095 0.00
population
c. Burwood 0.03 0.13 0.00 92.79 9.12 0.97 0.00 0.0070 0.01
Murch Mts 0.02 0.10 0.00 169.38 31.34 0.98 0.00 0.0078 0.01
MK Sites 0.00 0.15 0.00 111.39 40.05 0.96 0.02 0.0150 0.02
No MK Sites 0.02 0.10 0.00 51.92 2.14 0.97 0.01 0.0121 0.02
Recovery Site 0.04 0.09 0.00 343.73 104.69 0.99 0.00 0.0093 0.01
Meta-
0.03 0.05 0.00 769.20 126.91 0.99 0.00 0.0096 0.00
population
23Increasing reproductive output of individual females has a significant impact on population size at year 25.
At the lowest rates modelled, expected N at 25 years is 689 but moves to N=825 at the highest rates modelled.
Gene diversity and inbreeding outcomes are good in all cases. This is the highest-performing intervention of
those tested.
a. b.
c. d.
e. Figure 8. Varying the average annual
reproductive output of females at Burwood: a.
1.1 eggs per female (0.75 surviving first year);
b.1.5 eggs per females (1.00 surviving); c. 1.7
eggs per females (1.12 surviving; Baseline); d.
1.9 eggs per females (1.25 surviving; Baseline);
e. 2.3 eggs per females (1.5 surviving)
24Table 7. Varying the average annual reproductive output of females at Burwood: a. 1.1 eggs per female (0.75
surviving first year); b.1.5 eggs per females (1.00 surviving); c. 1.7 eggs per females (1.12 surviving; Baseline);
d. 1.9 eggs per females (1.25 surviving; Baseline); e. 2.3 eggs per females (1.5 surviving)
Sub-population r SD(r) PEX N SD(N) GD SD(GD) Inb SD(Inb)
a. Burwood 0.00 0.11 0.00 91.37 8.14 0.97 0.00 0.0056 0.01
Murch Mts 0.01 0.11 0.00 158.81 34.90 0.98 0.00 0.0071 0.01
MK Sites 0.00 0.13 0.00 118.78 37.29 0.97 0.01 0.0115 0.01
No MK Sites 0.01 0.07 0.00 51.01 3.29 0.96 0.01 0.0178 0.02
Recovery Site 0.04 0.10 0.00 269.06 110.67 0.99 0.00 0.0090 0.01
Meta-
0.02 0.05 0.00 689.03 128.82 0.99 0.00 0.0091 0.00
population
b. Burwood 0.01 0.13 0.00 91.37 8.95 0.97 0.00 0.0068 0.01
Murch Mts 0.02 0.10 0.00 165.12 34.38 0.98 0.00 0.0075 0.01
MK Sites -0.01 0.15 0.00 118.94 36.77 0.97 0.01 0.0124 0.01
No MK Sites 0.02 0.09 0.00 51.68 2.15 0.96 0.01 0.0126 0.02
Recovery Site 0.04 0.09 0.00 337.30 107.13 0.99 0.00 0.0086 0.01
Meta-
0.03 0.05 0.00 764.41 122.86 0.99 0.00 0.0091 0.00
population
c. Burwood 0.03 0.13 0.00 92.79 9.12 0.97 0.00 0.0070 0.01
Murch Mts 0.02 0.10 0.00 169.38 31.34 0.98 0.00 0.0078 0.01
MK Sites 0.00 0.15 0.00 111.39 40.05 0.96 0.02 0.0150 0.02
No MK Sites 0.02 0.10 0.00 51.92 2.14 0.97 0.01 0.0121 0.02
Recovery Site 0.04 0.09 0.00 343.73 104.69 0.99 0.00 0.0093 0.01
Meta-
0.03 0.05 0.00 769.20 126.91 0.99 0.00 0.0096 0.00
population
d. Burwood 0.02 0.16 0.00 90.96 10.06 0.97 0.00 0.0070 0.01
Murch Mts 0.01 0.11 0.00 168.36 31.01 0.98 0.00 0.0072 0.01
MK Sites 0.00 0.14 0.00 118.76 35.90 0.97 0.01 0.0110 0.01
No MK Sites 0.02 0.10 0.00 51.97 2.13 0.97 0.01 0.0119 0.02
Recovery Site 0.05 0.09 0.00 363.90 107.94 0.99 0.00 0.0090 0.01
Meta-
0.03 0.05 0.00 793.96 126.76 0.99 0.00 0.0089 0.00
population
e. Burwood 0.04 0.17 0.00 90.84 10.44 0.97 0.00 0.0094 0.01
Murch Mts 0.02 0.10 0.00 169.96 29.83 0.98 0.00 0.0089 0.01
MK Sites -0.01 0.14 0.00 118.97 36.37 0.97 0.01 0.0115 0.01
No MK Sites 0.03 0.11 0.00 52.10 1.97 0.97 0.01 0.0134 0.02
Recovery Site 0.05 0.09 0.00 393.43 101.03 0.99 0.00 0.0101 0.01
Meta-
0.03 0.05 0.00 825.29 120.88 0.99 0.00 0.0101 0.00
population
25VARYING THE INTENSITY OF GENETIC MANAGEMENT (GM)
Close genetic management can slow the rate of inbreeding accumulation and increase gene diversity retention
in a population. This is important to very small populations for which these factors can be significant
contributors to population declines. As populations become larger, they become less vulnerable to these
factors. As genetic management can require increased investment of resources it is important to have a sense
of when it adds value and how much. In these models, genetic management has two components: 1) managing
rates of gene-flow between sites; 2) optimising pairings within sites (to retain gene diversity while keeping
average inbreeding below 0.125).
MANAGING GENE -FLOW BETWEEN SITES
In the following model there is no movement of birds between sub-populations. This allows us to look at the
resilience of each sub-population to 25 years of isolation, starting in year 1. This is unlikely ever to occur across
the whole meta-population, though it is conceivable that some sub-populations could be isolated for periods
of time due to resource constraints or disease issues.
Figure 9. Sub-
population growth
projections over 25
years with no inter-
site transfers (graph)
and associated
summary statistics
(table below).
Population r SD(r) PEX N SD(N) GD SD(GD) Inb SD(Inb)
Burwood 0.16 0.08 0.00 99.56 4.83 0.96 0.01 0.0171 0.02
Murch Mts -0.01 0.11 0.00 120.09 46.20 0.97 0.01 0.0113 0.01
MK Sites 0.02 0.16 0.01 114.03 44.08 0.96 0.02 0.0174 0.02
No MK Sites 0.03 0.10 0.00 48.09 8.71 0.92 0.02 0.0387 0.03
Recovery Site -0.06 0.17 0.09 18.20 14.24 0.85 0.08 0.0662 0.09
Meta-
0.05 0.06 0.00 399.97 69.48 0.99 0.00 0.0193 0.01
population
In this scenario. the Murchison Mts and Kahurangi sub-populations average negative growth over the period.
For the Murchison Mts this is attributable to the ongoing losses due to predators which are not being
compensated for. Despite this, the sub-population showed no risk of extinction over 25 years at the predation
rates modelled, though mean population size had decreased by the end of the period to N=121 (S.D=46) from
a starting size of 200 birds. At Kahurangi the declining growth is due to the current small size of the population.
which for the next few years and in absence of further supplementation will leave it vulnerable to small
26population effects. The Kahurangi model showed a 9% chance of extinction over the period. The only other
non-zero extinction risk (1%) was for the MK Sites. The stochastic risks allocated to sites within this sub-
population make its performance highly variable and vulnerable to declines. However due to its size (mean
N=114.03 at 25 years) gene diversity at 25 years is still 96%. The No MK sites sub-population grows positively
and at a slightly faster rate than the MK Sites sub-population, though its smaller size retains less gene diversity
over the period (GD at 25 years = 92%)). Burwood exhibits strong growth (r=0.17) throughout because it is not
required to supplement either the Murchison Mountains, Kahurangi or the lower-performing sub-populations.
It loses some gene diversity due to its size but remains above detrimental levels (GD at 25 years=96%). Figure
10. illustrates the 25-year impacts on inbreeding accumulation (a) and gene diversity loss (b). Overall the meta-
population numbers move from a starting size of 447.00 to a mean of roughly 399.97 birds (SD= 69.48). Despite
declines in some sub-populations this strategy meets the overall genetic target but does not advance
conservation of the species; overall growth is low and inbreeding higher than in the baseline.
Figure 10. Impact of shutting off gene-flow between sub-populations for 25 years, on inbreeding
accumulation (a) and gene diversity retention (b).
27You can also read