SOUTH WAIKATO DISTRICT COUNCIL - Waste Assessment For The Waste Management And Minimisation Plan Review
←
→
Page content transcription
If your browser does not render page correctly, please read the page content below
SOUTH WAIKATO DISTRICT COUNCIL

        Waste Assessment

    For The Waste Management
    And Minimisation Plan Review

                                                    April 2011
                               HG Project No. 1012-130738-01
                        HG Document No. R001v1-AK130738-01
HARRISON GRIERSON CONSULTANTS LIMITED Page i
SOUTH WAIKATO DISTRICT COUNCIL

                                Waste Assessment

  For the Waste Management and Minimisation Plan Review

                                                                           April 2011
                                                      HG Project No. 1012-130738-01
                                             HG Document No. R001v1-AK130738-01

CONTENTS
                                                                                 Page

EXECUTIVE SUMMARY                                                                   iv

1.0       INTRODUCTION                                                              1
1.1       SOUTH WAIKATO DISTRICT COUNCIL                                             1
1.2       PURPOSE OF THIS WASTE ASSESSMENT                                           2
1.3       SCOPE                                                                      2
1.3.1     General                                                                    2
1.3.2     Definitions of waste, waste minimisation and diverted material             2
1.3.3     Council controlled and non-Council controlled waste streams                3
1.3.4     Consideration of Solid, Liquid and Hazardous Wastes                        3
2.0       LEGISLATIVE AND STRATEGIC CONTEXT                                         4
2.1       THE NEW ZEALAND WASTE STRATEGY (NZWS)                                      4
2.1.1     Key legislation                                                            4
2.1.1.1   The Waste Minimisation Act (WMA) 2008                                      4
2.1.1.2   The Local Government Act 2002                                              5
2.1.1.3   The Resource Management Act 1991 (RMA)                                     5
2.2       OTHER LEGISLATION                                                          5
2.2.1     The Health Act 1956                                                        5
2.2.2     The Litter Act 1979 (and Amendment Act 2006)                               5
3.0       OVERVIEW OF WASTE MANAGEMENT SERVICES IN SOUTH
          WAIKATO DISTRICT                                                          5
3.1       WASTE SERVICES PROVIDED FOR RESIDENTAIL SECTOR                             5
3.2       TOKOROA LANDFILL AND PUTARURU TRANSFER STATION                             6
3.3       WASTE SERVICES PROVIDED FOR THE COMMERCIAL SECTOR                          6
3.4       OTHER WASTE MANAGEMENT SERVICES                                            6
4.0       WASTE GENERATORS IN SOUTH WAIKATO DISTRICT                                7
5.0       WASTE SERVICES AVAILABLE IN SOUTH WAIKATO DISTRICT                        8
5.1       COUNCIL CONTRACTED SERVICES                                               9
5.1.1     Other Council programs and services                                      10
5.2       PRIVATELY CONTROLLED                                                     10
6.0       WASTE STREAMS                                                           10
6.1       WASTE DATA                                                               10
6.1.1     Composition data of Overall Waste at Tokoroa Landfill                    11
6.1.1.1   Primary Composition of overall waste                                     12
6.1.2     Composition data of general waste                                        13

HARRISON GRIERSON CONSULTANTS LIMITED                                           Page ii
April 2011
HG ref 1012-130738-01
6.1.3 ACTIVITY SOURCE OF GENERAL WASTE 15
6.2 DIVERTED MATERIAL 16
6.2.1 Diverted material within Council 16
6.3 RECYCLING OPERATIONS 19
6.4 PUTARURU TRANSFER STATION 19
6.5 SUMMARY AND CONCLUSION 19
6.5.1 Residential Waste – Dry Recyclables 20
6.5.2 DIVERTED MATERIAL 21
7.0 FUTURE DEMAND AND GAP ANALYSIS 21
7.1 FUTURE DEMAND 21
7.1.1 Factors affecting service demand 21
7.1.2 Expectations for population growth 22
7.1.3 Consumer behaviour 23
7.1.4 Legislation – Waste Levy 24
7.1.5 Waste minimisation programmes, services and future initiatives 24
7.1.6 Demand for increased services 24
7.1.7 Rural waste sources 24
7.2 PROJECTIONS FOR SERVICE DEMAND OF DIVERTED MATERIAL 24
7.3 GAP ANALYSIS 27
7.3.1 Disposal Infrastructure 27
7.3.2 Recycling and Organic Waste Infrastructure 28
8.0 STATEMENT OF OPTIONS 28
8.1 WASTE REDUCTION, COMMUNICATION, CONSULTATION AND
PARTNERSHIPS 29
9.0 STATEMENT OF COUNCIL’S ROLE 34
9.1 BACKGROUND 35
9.2 COUNCIL’S ROLE TO MEET FUTURE DEMAND 36
10.0 STATEMENT OF PROPOSALS 36
10.1 COUNCIL’S PROPOSAL 36
10.1.1 Protection of Public Health 37
10.1.2 Promotion of Effective and Efficient Waste Management and Minimisation 37
HARRISON GRIERSON CONSULTANTS LIMITED Page iii
HG Document No. R001v1-AK130738-01April 2011
HG ref 1012-130738-01
EXECUTIVE SUMMARY
The South Waikato District Council (Council) has a statutory responsibility to promote
effective and efficient waste management and minimisation (Section 42, Waste
Minimisation Act 2008) within the South Waikato District. Council is required to
undertake a Waste Assessment to assist in developing the Council’s Waste Minimisation
and Management Plan.
The report provides a detailed overview of the waste services provided in the District,
composition of waste streams, forecast of future demands, an assessment of options to
meet those demands and includes Council’s statement of proposals to meet the future
demands.
The structure of this report is as follows:
Section 1 provides an introduction to the Waste Assessment Report
Section 2 describes the legislative and policy framework which sets out Council’s
duty to promote waste management and minimisation
Section 3 provides the overview of waste management services within the District
Section 4 details the waste generators
Section 5 describes the waste services available in the District
Section 6 details the waste stream within the District
Section 7 presents an assessment of the current and future demand for waste
services
Section 8 details the options which have been considered for meeting the future
demand
Section 9 details the Council’s intended role in providing waste services to meet the
future demand
Section 10 details the Council’s proposal to meet the future demand
HARRISON GRIERSON CONSULTANTS LIMITED Page iv
HG Document No. R001v1-AK130738-01April 2011
HG ref 1012-130738-01
1.0 INTRODUCTION
1.1 SOUTH WAIKATO DISTRICT COUNCIL
The South Waikato District is located in the centre of the North Island,
comprising a land area of 182,000 hectares. The District is largely surrounded
by native trees, lakes and streams.
The District covers the towns of Tokoroa, Putaruru, Tirau and Arapuni with a
total population count at the 2006 census of 22,641. The district population size
ranks 46th out of 73 in New Zealand.
The economy of the district is based on forestry, pastoral farming, agriculture
and hydro-developments. The rural nature of the district implies the need to
provide an effective waste management and minimisation plan as it may be
more challenging and expensive in comparison to Districts with a greater
population density.
Figure 1: South Waikato District
HARRISON GRIERSON CONSULTANTS LIMITED Page 1
HG Document No. R001v1-AK130738-01April 2011
HG ref 1012-130738-01
1.2 PURPOSE OF THIS WASTE ASSESSMENT
The Waste Minimisation Act 2008 (WMA) aims to reduce the generation and
disposal of waste to minimize environmental harm. Under Section 50 of the
WMA it requires all Territorial Authorities (TA) to prepare a Waste Management
and Minimisation Plan (WMMP) to be completed no later than 1 July 2012 to
ensure that the statutory requirements are fulfilled. A “Waste Assessment” (WA)
is required to identify all key issues and actions as a necessary initial step into
the development of the WMMP.
Section 51 of the WMA outlines the requirements for waste assessment, which
must contain:
A description of the collection, recycling, recover, treatment, and disposal
services provided within the territorial authority’s district
A forecast of future demands
A statement of options
A statement of the territorial authority’s intended role in meeting demands
A statement of the territorial authority’s proposals for meeting the forecast
demands
A statement about the extent to which the proposals will protect public
health, and promote effective and efficient waste management and
minimisation
1.3 SCOPE
1.3.1 General
The WA document is intended to describe all waste services in the District to
enable Council to make effective and informed decisions on waste issues in the
future, as well as fulfilling the statutory requirement under section 51 of the
WMA. The Ministry for the Environment’s “Waste Management and Minimisation
Planning: Guidance for Territorial Authorities”1 has been undertaken as
reference for the waste assessment.
Waste streams managed directly by Council; including an assessment of current
commercial and industrial waste streams, a future demand forecast and the
options available to determine Councils’ intended role to meeting the demands
must be included in the waste assessment.
1.3.2 Definitions of waste, waste minimisation and diverted material
The Waste Minimisation Act 2008 establishes the definitions for waste, waste
minimisation and diverted material as follows:
1
Ministry for the Environment (2009), Waste Management and Minimisation Planning:
Guidance for Territorial Authorities. Wellington
HARRISON GRIERSON CONSULTANTS LIMITED Page 2
HG Document No. R001v1-AK130738-01April 2011
HG ref 1012-130738-01
Waste means:
a. anything disposed of or discarded; and
b. Includes a type of waste that is defined by its composition or source (for
example, organic waste, electronic waste, or construction and demolition
waste); and
c. To avoid doubt, includes any component or element of diverted material, if
the component or element is disposed of or discarded.
Waste minimisation means:
a. The reduction of waste; and
b. The reuse, recycling, and recovery of waste and diverted material.
Diverted Material means,
Anything that is no longer required for its original purpose, but for commercial
or other waste minimisation activities would be disposed of or discarded.
1.3.3 Council controlled and non-Council controlled waste streams
The major fractions of residual waste into the Tokoroa Landfill are collected from
Council controlled activities. Sufficient data on the collections and facilities
operated within the district are held at the Council to prioritise and to outline the
Council’s role in resolving the waste issues relating to domestic and non-
domestic waste. This makes the waste assessment for the entire waste stream
operating in the District relatively simple. The Solid Waste Audit of Tokoroa
Landfill2 completed for the Council obtains essential information that has been
included in this Waste Assessment.
1.3.4 Consideration of Solid, Liquid and Hazardous Wastes
The Ministry for the Environment enforces the importance of Council’s
determining the scope of their WMMP in terms of which wastes and diverted
materials, liquids, gaseous and hazardous wastes which are directly managed by
the Council or are disposed of to Landfill to be considered within the plan.
Disposal of hazardous wastes, special wastes, and bulk wastes over the tip face
at Tokoroa or Putaruru sites is prohibited.
Council operates a hazardous waste disposal facility at Tokoroa Landfill for small
quantities normally contained within domestic waste.. The wastes are recorded,
labelled, and stored in a secure storage facility . The wastes are then collected
and disposed of by a hazardous waste contractor at annual intervals.
Random inspections are made (and recorded) on all vehicles entering the
Tokoroa landfill for potential hazardous and special wastes. Contractors and
2
South Waikato District Council (2008/09), Solid Waste Audit of Tokoroa Landfill.
Prepared on behalf of South Waikato District Council by Environment Waikato
HARRISON GRIERSON CONSULTANTS LIMITED Page 3
HG Document No. R001v1-AK130738-01April 2011
HG ref 1012-130738-01
Council supervisory staff are trained on the identification of hazardous wastes
entering the waste disposal facilities.
Further detail on hazardous and special wastes are contained in the “Solid Waste
Site Management Plans”.
2.0 LEGISLATIVE AND STRATEGIC CONTEXT
This section of the report provides the basic framework of national policy and
legislations that must be considered during the development of the WA and
WWMP.
2.1 THE NEW ZEALAND WASTE STRATEGY (NZWS)
The NZWS provides direction to guide the use of tools that are available to
councils to manage, reduce harm, improve efficiency and minimise waste in New
Zealand.
Tools available include:
Waste Minimisation Act 2008 (WMA)
Local Government Act 2002 (LGA)
Resource Management Act 1991 (RMA)
2.1.1 Key legislation
Key legislation driving waste management and minimisation planning are the
Waste Minimisation Act (WMA) 2008, the Local Government Act (LGA) 2002 and
the Resource Management Act (RMA) 1991.
2.1.1.1 The Waste Minimisation Act (WMA) 2008
The purpose of the WMA (s3) is to “encourage waste minimisation and a
decrease in waste disposal in order to protect the environment from harm; and
to provide environmental, social, economic and cultural benefits”. Also, the Act
consists of responsibilities that the council is obliged to uphold, namely “must
promote effective and efficient waste management and minimisation within their
districts” (s42).
The WMA shifts the focus away from the treatment and disposal of waste to
reducing and recovering waste earlier in its life cycle by the creation of the
national waste disposal levy ($10 plus GST per tonne paid by Landfill operators).
The levy does not provide a large economic burden to dispose waste to Landfill.
The benefit of a waste levy increases economic incentive for waste generators to
avoid disposing waste directly to Landfill and to divert waste to beneficial use.
Economic incentive of increasing Landfill costs includes the improvement of
economic viability of alternative waste minimisation services to Landfill, and an
increase in demand of recycling services.
HARRISON GRIERSON CONSULTANTS LIMITED Page 4
HG Document No. R001v1-AK130738-01April 2011
HG ref 1012-130738-01
2.1.1.2 The Local Government Act 2002
The Act requires Council to implement effective and efficient waste management
plan and requires to assess the collection and reduction, reuse, recovery,
recycling and treatment and disposal of waste within the District.
2.1.1.3 The Resource Management Act 1991 (RMA)
Under the RMA Council is required to provide sustainable management and
includes responsibility to control effects of land-use activities that have the
potential to have adverse effects on physical and natural resources within the
District. These responsibilities are attended to through regional planning and
discharge consent requirements.
2.2 OTHER LEGISLATION
The following is a summary of other legislation that is to be considered with
respect to waste management and minimisation planning.
2.2.1 The Health Act 1956
The Health Act 1956 identifies certain waste management practices to
emphasise the obligations of TA’s to provide sanitary works during the collection
and disposal of refuse, for the purpose of public health protection.
2.2.2 The Litter Act 1979 (and Amendment Act 2006)
The Litter Act empowers Council’s to employ Litter Enforcement Officers. These
officers have the authority to issue citizens who have committed a litter offence
with a fine.
3.0 OVERVIEW OF WASTE MANAGEMENT SERVICES IN SOUTH
WAIKATO DISTRICT
The Council is the sole provider of public waste disposal facilities in the district
that provides kerbside collections, public recycling and food waste disposal.
3.1 WASTE SERVICES PROVIDED FOR RESIDENTAIL SECTOR
Refuse disposal services are available for the residential areas within the
District. A weekly collection of refuse for approximately 8,000 households in
Arapuni, Putaruru, Tirau and Tokoroa is provided by the Council. Household
refuse is collected from the kerbside in Council refuse bags by Council’s
contractor, Greenfingers Garden Bags and is sent to the Tokoroa Landfill.
The Council provides fortnightly kerbside recyclable collection through a
targeted rate on each separately used or inhabited portion of a rating unit. The
recycling service is provided in Arapuni, Putaruru, Tirau and Tokoroa. The South
HARRISON GRIERSON CONSULTANTS LIMITED Page 5
HG Document No. R001v1-AK130738-01April 2011
HG ref 1012-130738-01
Waikato Achievement Trust holds the contract for road side collection of
recyclable material from residents and commercial operators.
A privately operated waste service, Pete’s Bins provides kerbside collection for
urban and some rural residents that are not serviced by the Council waste
collection system. “Citywide” also provide an urban kerbside wheelie bin
service.
In addition, a trial of food waste collections from 1,900 households in Putaruru
will be undertaken by Earthcare Environmental. The trial will offer weekly
collection of food waste, with each household provided with a ventilated kitchen
caddy and a 23 litre roadside container. The collected compostable material will
be transported to Envirofert in Tuakau for processing.
3.2 TOKOROA LANDFILL AND PUTARURU TRANSFER STATION
Council owns and operates operational Landfill in Tokoroa and a transfer station
in Putaruru. The Landfill and Transfer Station are operated under contract to
Council by Materials Processing Ltd. All waste collection and disposal services
are managed for Council by private operators in accordance with Council’s
Landfill Management Plan.
Since the closing of the Putaruru Landfill in 2007 the waste disposal at the
Tokoroa Landfill has decreased. It is expected that the Landfill may close
between 2015 and 2021. However, there is sufficient land area to form a new
Landfill when the first lined cell is full.
There are four wastewater treatment plants located within the District. The
largest wastewater treatment plant produces approximately 1,000 tonnes of
sewage sludge that is disposed at the Landfill annually. The dewatered sludge is
mixed with stockpiled greenwaste to become manageable for it to be spread and
establish grass cover on areas of closed Landfill, or alternative beneficial reuse.
3.3 WASTE SERVICES PROVIDED FOR THE COMMERCIAL SECTOR
The commercial sector is able to use the kerbside bagged refuse collection
provided by the Council. In addition to the Council service provided to the
commercial sector, businesses and industries dispose their waste by using
services provided by commercial waste operators or by transporting their waste
themselves directly to the Tokoroa Landfill.
3.4 OTHER WASTE MANAGEMENT SERVICES
New recycling bins have been placed recently in the Tokoroa CBD. The Litter
Collection service is funded through Uniform Annual General Charge and
additional dwellings rate.
Also, the Council has introduced an anti-littering anti-dumping campaign called
“Biff it in the Bin” to educate and promote environmental awareness. The
HARRISON GRIERSON CONSULTANTS LIMITED Page 6
HG Document No. R001v1-AK130738-01April 2011
HG ref 1012-130738-01
campaign is sponsored by Carter Holt Harvey Pulp and Paper, Kinleith, Hancock
Forest Management, South Waikato News and Mighty River Power.
4.0 WASTE GENERATORS IN SOUTH WAIKATO DISTRICT
The tables in this section provide a summary of key waste generators of
households and businesses in the South Waikato District.
Table 1: Summary of Waste Generators
Waste generation services Waste generated
Residual waste reported by EW as 23,000
Carter Holt Harvey Pulp and Paper
TPA disposed of into Smythe Rd Landfill.
Dumped 3,907 Tonnes into Tokoroa
Landfill 2008/2009, but from November
2009 waste has been diverted to Waitomo
Landfill near Te Kuiti. Petes Bins Limited
Petes Bins Ltd. (Envirowaste Ltd.) market share has declined so
approximately 3,500 TPA currently
shipped out of district. They operate a
complete refuse and greenwaste disposal
service district wide.
Council’s current kerbside refuse
contractor that operates a kerbside
wheelie bin service with the “Citywide”
Greenfingers Garden Bags Ltd. brand. Total waste stream for these two
activities was 2,347 TPA (2009/10). They
also operate a greenwaste garden bag
collection service in South Waikato.
Hold the current litter collection contract
Transpacific Industrial Solutions with Council. Tonnages last year were 270
Tonnes.
The current contractor for local road
maintenance. Tonnages last year into
Tokoroa Landfill was approximately 150
Tonnes. Downer produces a significant
Downer Edi Works volume of waste which is stockpiled or
clean filled around the District. Its
subcontractor “Unicus” undertakes road
sweeping (circa 1,000 TPA) which is
currently “cleanfilled”.
Contributes on average 1,060 TPA of
sewage sludge stockpiled for beneficial
South Waikato District Council
reuse at the Landfill, and approximately
100 TPA of general waste.
HARRISON GRIERSON CONSULTANTS LIMITED Page 7
HG Document No. R001v1-AK130738-01April 2011
HG ref 1012-130738-01
Table 1: Summary of Waste Generators
Waste generation services Waste generated
Council’s open space maintenance
RYH Contracting Ltd.
contractor, produced 120 Tonnes (2010).
Tokoroa Landfilled approximately 110
Allan Wilson Builders Ltd.
Tonnes (2010).
Pacific Pine Industries Timber
Generates a range of lumber products and
manufactures furniture, joinery,
Kiwi Lumber (Putaruru) Ltd. mouldings and the building industry. Pine
timber is milled entirely from renewable
plantations.
Suppliers and bottlers of pure spring
NZ Quality Waters Ltd.
water.
Suppliers and bottlers of the Coca Cola
Coca Cola Amatil (NZ)
range.
Current solid waste disposal contractor
that has an interest in actively diverting
waste from the tipping head. It has a
large commercial composting facility on
Wawa Road Kinleith, and manages the
Kinleith Recycling Centre. Their interests
Materials Processing Ltd.
are recycling, with streams of greenwaste
and “hog fuel” (untreated timber) being
moved over District Council boundaries.
Some volumes of reject compost are
being used at the Tokoroa Landfill for
daily cover.
5.0 WASTE SERVICES AVAILABLE IN SOUTH WAIKATO DISTRICT
The tables in this section provide a summary of key waste services currently
available to households and businesses in the South Waikato District.
HARRISON GRIERSON CONSULTANTS LIMITED Page 8
HG Document No. R001v1-AK130738-01April 2011
HG ref 1012-130738-01
5.1 COUNCIL CONTRACTED SERVICES
Table 2: Council Contracted Services
Service Provision Service Provider
Fortnightly from the
kerbside in Arapuni,
South Waikato
Putaruru, Tirau and
Achievement Trust (SWAT)
Recycling service Tokoroa. Collected from
under contract to COUNCIL
both residential and
until 30 June 2011
commercial street
frontages
Public recycling, at Waotu,
Dreghorn Car Park, South Waikato
Drop-off points
Tokoroa Landfill, Putaruru Achievement Trust under
recycling service
Transfer Station, and contract to COUNCIL
Depot Street in Tirau
Food waste collections
Earthcare Environmental
from 1,900 households in
Food waste collections by agreement with
Putaruru for a trial period
COUNCIL
of one year.
Weekly kerbside collection
from defined areas
(Putaruru, Arapuni,
Residential waste Greenfingers Garden Bags
Tokoroa and Tirau) to
disposal Ltd
about 8,000 households
disposed at Tokoroa
Landfill
Weekly pre paid official
bag collection in Arapuni,
Greenfingers Garden Bags
Commercial kerbside Putaruru, Tirau and
Ltd
Tokoroa - disposed of at
Tokoroa Landfill
Litter bins, Council Disposed of at Tokoroa Transpacific Industries,
facilities, and parks Landfill and RYH Contracting Ltd.
Waste collected in 30m³
hook bins, and transported
Waste disposal – to Tokoroa Landfill every
Materials Processing Ltd
Putaruru transfer 2/3 days. Greenwaste
under contract to COUNCIL
station separated and mulched
before transport to
Tokoroa outlets.
Storage facility at Tokoroa
Household hazardous for paints, batteries, oil,
Various service providers.
wastes household chemicals,
sharps, fluorescent tubes.
HARRISON GRIERSON CONSULTANTS LIMITED Page 9
HG Document No. R001v1-AK130738-01April 2011
HG ref 1012-130738-01
5.1.1 Other Council programs and services
In addition to the Council contracted and privately controlled services, there are
other programs or services provided by Council. These cover the following:
The Council undertakes community education through the anti-littering anti-
dumping campaign called “Biff it in the Bin”
The Waste Exchange Campaign
5.2 PRIVATELY CONTROLLED
There are a number of services available in the District that are privately
controlled. Pete’s Bins, Citywide, Waste Management, Envirowaste and
Transpacific are brands that provide waste collection, and recycling services to
residents that are not serviced by the Council waste facilities, and to commercial
and industrial sectors.
6.0 WASTE STREAMS
This section of the Waste Assessment Report aims to fulfil the requirements as
provided in section 51(1) (a) of the Waste Minimisation Act:
“a description of the collection, recycling, recovery, treatment and disposal
services provided within the territorial authority’s district (whether by the
territorial authority or otherwise)”.
6.1 WASTE DATA
Council holds historical data from the 2008/09 financial year onwards for waste
collected through recycling collections and waste collected and sent to Landfill
from Putaruru Transfer Station. The solid waste audit of Tokoroa Landfill was
undertaken by “Waste not Consulting” for Environment Waikato in February,
2008 and released in November, 2008 (ref Document 1281790).
Table 3: Total Waste Streams Annually
Year 2008/09 2009/10
Solid waste to Tokoroa
16,267 10,681
Landfill
Recycling 2,589 2,511
Total 18,856 13,192
The solid waste sent to Tokoroa Landfill from the District includes the kerbside
refuse collections, and all residual waste delivered directly to the Transfer
Station at Putaruru.
It is predicted that the solid waste disposed at the Tokoroa Landfill in 2010/11
will be 8,500 tonnes, which in comparison to the previous year is 20% less.
HARRISON GRIERSON CONSULTANTS LIMITED Page 10
HG Document No. R001v1-AK130738-01April 2011
HG ref 1012-130738-01
The reduction in solid waste tonnages and income are due to:
Valuable businesses being lost. Pete's Bins Ltd (Envirowaste) during
2008/09 contributed 3,907 Tonnes which produced an income of
$304,653+GST. Currently their waste is disposed of at the Waitomo Landfill
near Te Kuiti.
Higher Landfill fees and the introduction of National Waste Levy of
$10+GST. This has resulted in the loss 2,803 TPA of waste bark from CHH
Kinleith used as initial cover, as well as the loss of 1,012 Tonnes of Council
road sweepings traditionally landfilled as “waste”. Currently these products
are diverted to “cleanfills” in the district without payment of the waste levy.
A slowdown in the economy resulting from the global financial crisis.
6.1.1 Composition data of Overall Waste at Tokoroa Landfill
Waste being discharged at Tokoroa Landfill, includes:
Greenwaste disposed of at separate drop-off point and other materials
designated as “cover” material
Steel, and untreated wood waste (diverted by Contractor)
General waste
Kerbside collections of refuse (both Council and private)
Sewage sludge (designated a “special” waste – classified as “potentially
hazardous”)
Waste from Putaruru Transfer station
Table 4: Material Types to Landfill – Average Weekly Flow 2008/09
Material type % of weight Tonnes/week
Cover material 7% 19 T/week
General Waste 52 % 141 T/week
Kerbside collections 29 % 80 T/week
Special waste 7% 18 T/week
Transfer station 6% 15 T/week
Total 100 % 273 T/week
Table 5: Material Types to Landfill – Average Weekly Flow 2009/10
Material type % of weight Tonnes/week
Cover material 8% 17 T/week
General Waste 46 % 95 T/week
Kerbside collections 22 % 45 T/week
HARRISON GRIERSON CONSULTANTS LIMITED Page 11
HG Document No. R001v1-AK130738-01April 2011
HG ref 1012-130738-01
Table 5: Material Types to Landfill – Average Weekly Flow 2009/10
Material type % of weight Tonnes/week
Greenwaste 6% 12 T/week
Special waste 11 % 22 T/week
Transfer station 7% 14 T/week
Total 100 % 205 T/week
Table 4 and 5 demonstrate the average weekly quantities of waste received at
the Tokoroa Landfill.
6.1.1.1 Primary Composition of overall waste
The composition of the waste from Putaruru Transfer Station is assumed to be
the same as the general waste being discharged at Tokoroa Landfill. The
primary composition of overall waste consists of:
Bark from CHH Kinleith mill (until mid 2010)
Greenwaste discharged at separate drop-off point (classed as “Putrescibles
– Greenwaste”),
Material classed as “cover” at the weighbridge (classified as “Rubble –
Multimaterial/other).
Sewage sludge (the special waste) is classified as “Potentially hazardous”.
Table 6: Primary Composition of General Waste – by Activity Source
Primary category Proportion of total Tonnes per week
Paper 8.4% 23 T/week
Plastics 8.8% 24 T/week
Putrescibles 39.8% 108 T/week
Ferrous metals 4.6% 13 T/week
Non-ferrous metals 0.9% 3 T/week
Glass 4.8% 13 T/week
Textiles 4.0% 11 T/week
Nappies and sanitary 2.7% 7 T/week
Rubble 7.9% 22 T/week
Timber 9.7% 27 T/week
Rubber 0.6% 2 T/week
Potentially hazardous 7.7% 21 T/week
Total 100.0% 273 T/week
HARRISON GRIERSON CONSULTANTS LIMITED Page 12
HG Document No. R001v1-AK130738-01April 2011
HG ref 1012-130738-01
Figure 3: Primary Composition of Overall Waste
Putrescible (includes kitchen/food, greenwaste and other organic matter such as
meat processing waste, dead animals) material comprised the largest
percentage of the overall waste stream, representing 40% of the total. All other
materials comprised less than 10% of the total. The putrescible component was
confirmed at 40% in a recent (February 2011) survey of household refuse in
Putaruru in preparation for the food waste trial.
6.1.2 Composition data of general waste
The general waste being disposed at the Tokoroa Landfill excludes:
Kerbside collections of refuse (both council and private)
Sewage sludge (special sludge – is classified as “Potentially hazardous”),
Greenwaste disposed of at separate drop-off point,
Waste from Putaruru Transfer Station
Bark and other materials designated as cover material.
HARRISON GRIERSON CONSULTANTS LIMITED Page 13
HG Document No. R001v1-AK130738-01April 2011
HG ref 1012-130738-01
Table 7: Primary Composition of General Waste – November 5/11/2007
Proportion of total %
Primary category (margins of error for 95% Tonnes per week
confidence level)
Paper 8.1% (± 3.8) 11 T/week
Plastics 9.1 % (±3.7) 13 T/week
Putrescibles 39.2 % (±16.8) 55 T/week
Ferrous materials 6.3 % (±2.3) 9 T/week
Non-ferrous metals 1.0 % (±0.3) 1 T/week
Glass 4.3 % (±1.5) 6 T/week
Textiles 5.7 % (±2.8) 8 T/week
Nappies and sanitary 0.6 % (±0.3) 1 T/week
Rubble 12.4 % (±14.0) 17 T/week
Timber 10.9 % (±3.7) 15 T/week
Rubber 0.9 % (±0.5) 1 T/week
Potentially hazardous 1.5 % (±1.5) 2 T/week
Total 100.0 % 141 T/week
Figure 4: Primary Composition of General Waste - November 5/11/2007
HARRISON GRIERSON CONSULTANTS LIMITED Page 14
HG Document No. R001v1-AK130738-01April 2011
HG ref 1012-130738-01
Figure 4 shows that putrescibles comprises nearly 40% of the total general waste
stream. Further, both rubble and timber consisted of similar general proportions
of general waste of approximately 12% and 11%, respectively. The rest of the
materials comprised less than 10% of the total general waste.
6.1.3 ACTIVITY SOURCE OF GENERAL WASTE
The table summarises key the primary four activity sources undertaken within
the District. The four activities include:
Construction and Demolition (C&D)
Industrial/commercial/institutional (ICI)
Landscaping
Residential
Table 8: Activity Source General Waste – Tonnes/Week Generations
Activity Source Tonnes/week
C&D 7 T/week
ICI 60 T/week
Landscaping 47 T/week
Residential 26 T/week
Total 141 T/week
Table 8 demonstrates that ICI is a key waste stream where several commercial
facilities are available. However in comparison, C&D does not generate a large
proportion of general waste therefore suggesting a low profile in the local
economy or alternatives are available for disposal..
Table 9: Primary Composition of General Waste – by Activity Source
Primary category C&D ICI Landscaping Residential
Paper 4.8% 15.5% 0.1% 8.6%
Plastics 6.4% 16.4% 0.4% 11.5%
Putrescibles 4.5% 16.4% 68.4% 30.3%
Ferrous metals 9.2% 8.3% 0.1% 13.9%
Non-ferrous metals 2.0% 1.6% 0.0% 1.3%
Glass 4.0% 8.0% 0.0% 4.9%
Textiles 9.3% 9.7% 0.0% 7.7%
Nappies and sanitary 0.0% 0.8% 0.0% 1.3%
Rubble 21.2% 3.0% 29.6% 4.2%
Timber 34.2% 15.9% 1.3% 14.1%
HARRISON GRIERSON CONSULTANTS LIMITED Page 15
HG Document No. R001v1-AK130738-01April 2011
HG ref 1012-130738-01
Table 9: Primary Composition of General Waste – by Activity Source
Primary category C&D ICI Landscaping Residential
Rubber 2.6% 1.4% 0.0% 1.2%
Potentially hazardous 1.7% 3.1% 0.0% 1.1%
Table 9 demonstrates that ICI is largely comprised of plastics and paper, in
comparison to C&D waste which is comprised mostly of rubble and timber. Both
landscaping and residential waste generated primarily putrescible waste of
68.4% and 30.3%, respectively.
6.2 DIVERTED MATERIAL
The term diverted material applies to the discarded materials that are recovered
from the waste stream through activities such as recycling or composting. A
requirement of the WA is to indicate waste minimisation activities and facilities
undertaken within the District. The waste management and minimisation
activities include:
Reduction refers to a decrease in waste generation as a result of activities
undertaken by organisations such as efficiently utilising products.
Reuse implies the continuation to use diverted material in its original form
for the existing or similar purpose
Recycling implies the re-utilisation of the diverted material to produce new
material
Recovery is the removal of materials or energy material to process the
waste or diverted material further for use or processing
Treatment includes treating the waste physically, biologically or chemically
to alter its characteristics to allow disposal of waste with no or little harmful
effects to the environment
Disposal implies the deposition of waste onto a disposal area that is
particularly set for that purpose
6.2.1 Diverted material within Council
The tables in this section provide a summary of diverted material generated
within key waste organisations in the District. The organisations that have been
identified as a significant industry in the District were sent a questionnaire and a
brief telephone interview was conducted regarding diverted material generation,
disposal and waste minimisation practices.
HARRISON GRIERSON CONSULTANTS LIMITED Page 16
HG Document No. R001v1-AK130738-01April 2011
HG ref 1012-130738-01
Table 10: Diverted Material
Waste
management and
Types of
minimisation Where the diverted
Waste diverted
activities materials are being
Generators material
undertaken sent
generated
within the
organisation
Greenwaste –
Private greenwaste Northern Waikato and
collection 100% sold to agricultural and
In South Waikato recycling, provide horticultural
Greenfingers – no diverted waste services South Waikato –
Garden Bags Ltd material is (kerbside recycling, partnered with South
generated materials recycling Waikato Achievement
(earth)), focus on Trust (provide
education commercial and
kerbside collection)
No waste to recycle,
Scrap metal, all waste gets sent Management are
plastic waste to general waste unsure where the
(plastic strapping rubbish collection, recyclable material is
Kiwi Lumber
and plastic food waste gets being sent. Scrap
wrapping used to used as fuel for metal is sent to a local
cover the timber) boilers and bark is place in Tirau
sold
PET, cardboard,
strapping, stretch
Follow the National
strap, wooden
CTA policy Internal waste vendor
pallets, waxed
(IS014001)- (delivery trucks daily),
Coca Cola Amital paper, chemical
Environmental South Waikato
(NZ) Ltd (water containers, tin,
Management Achievement Trust in
bottlers) glass, food
System, the Tokoroa (cardboard
scraps, other
organisation is and plastics)
plastics (plastic
audited every year
lids, anything not
PET)
Confidential papers
Recycle paper and
(documents
Waste paper, plastic containers,
Hancocks Forest destruction collect in
newspaper, reuse of paper is
Management Ltd bins), milk
plastic milk minimal,
(office) containers/newspapers
containers Envirowaste collects
taken to recycling
from office
station
HARRISON GRIERSON CONSULTANTS LIMITED Page 17
HG Document No. R001v1-AK130738-01April 2011
HG ref 1012-130738-01
Waste
management and
Types of
minimisation Where the diverted
Waste diverted
activities materials are being
Generators material
undertaken sent
generated
within the
organisation
Package strapping –
reusable (gets
circulated
Steel, plastic, internally), Steel – Hamilton,
Pacific Pine
glass (very Strapping/PET – plastic/PET/wrap –
Industries
minimal) recycled, steel Tokoroa recycling
waste sold to scrap
dealers, plastic
wrap – recycled
Plastic, cardboard,
Plastic filters (2m
paper, rubber,
x 2m), wooden
metal, glass are
pallets, rubber Collected by
Fonterra recycled
seals/belt, 40l Contractor SATS
POD’s, containers
screw top plastic
(return to supplier)
containers, metal
are reused
Organic
RYH Contracting Organic/composted in
Green Waste composting/ wood
Ltd Contractors yard
chipping
South Waikato
NZ Quality Plastic (produce Recycling – plastic
Achievement Trust
Waters Ltd very little waste) and cardboard
(Tokoroa)
Stockpiling on the
Downer Edi Concrete/footpath Materials Processing
seal as sub-base
Works concrete Ltd., and local quarry.
material (bitumen)
Crushed concrete
aggregates, and
Steel, timber, Kinleith Recycling compost sold on site;
Carter Holt cardboard, non Centre operated on steel exported;
Harvey ferrous metals, site by Materials cardboard, and
concrete Processing Ltd. untreated timber
diverted back to the
adjacent Kinleith site.
Table 10 highlights certain recyclables where additional waste minimisation
efforts could be focused – PET in particular, along with paper and steel. Most of
the diverted material is collected and processed by Materials Processing Ltd
followed by South Waikato Achievement Trust.
HARRISON GRIERSON CONSULTANTS LIMITED Page 18
HG Document No. R001v1-AK130738-01April 2011
HG ref 1012-130738-01
Studies have indicated the potential of a 15% diversion from the kerbside waste
collection (excluding organic (kitchen, garden) wastes). There is potential for a
further 880 Tonnes per annum of diversion material.
6.3 RECYCLING OPERATIONS
The recyclable tonnage in 2008/09 and 2009/10 were 2,589 and 2,511 tonnes,
respectively. To increase recycling growth rate there is a need to raise the
average participation rate at the kerbside recycling above the current 50% rate.
The current support was measured at 44% in March 2010, with a range of 37%
in Tirau to 64% in Arapuni. Continued encouragement for recycling can be
achieved by appropriate publicity and reflecting the true cost of refuse disposal.
The recycling tonnages forecast are assumed to be approximately 3,000 Tonnes
per annum for recyclables from municipal waste stream. Banning wheelie bins
and improving pre-sorting at the kerbside recyclable collections would also
assist potential recycling within the District.
6.4 PUTARURU TRANSFER STATION
At the Putaruru Transfer Station, small loads of refuse are collected and
transported to Tokoroa Landfill for disposal. The facility contains a separate
drop-off point for greenwaste, which is mulched on site and transported to
Tokoroa outlets. The weighbridge records for greenwaste for the year ending
November 2009 were 857 Tonnes in Tokoroa and 898 Tonnes in Putaruru.
Potential exists for a further diversion of greenwaste from the Council waste
disposal facilities from the current 1,455 TPA to 2,455 Tonnes and 3,455 Tonnes
in 2011/12 and 2012/13, respectively.
6.5 SUMMARY AND CONCLUSION
Per capita waste generation was calculated to be 208 kg/capita/annum for
kerbside collection which includes both Council and private collections from
residential and commercial properties, and 541 kg/capita/annum in total
(excluding cover materials and special waste).
Table 11: Per Capita Waste Generation 2008/09
Per capita waste T/week T/annum Kg/capita/annum
disposal rates
Kerbside collections 80 T/week 4,154 T/annum 208 kg
General and transfer 156 T/week 8,090 T/annum 357 kg
station waste
Overall (excluding 236 T/week 12,244 T/annum 541 kg
cover materials and
special waste)
HARRISON GRIERSON CONSULTANTS LIMITED Page 19
HG Document No. R001v1-AK130738-01April 2011
HG ref 1012-130738-01
Table 11: Per Capita Waste Generation 2008/09
Per capita waste T/week T/annum Kg/capita/annum
disposal rates
Overall (including 273 T/week 14,187 T/annum 627 kg
cover materials and
special waste)
Table 12: Local Authority Area - Overall Waste to Landfill
Overall waste 2006 population Waste Tonnes per capita
(cover materials generated - per annum
and special waste tonnes
excluded)
Kapiti Coast District 46,000 20,362 0.443
2005
Hauraki District 2006 17,190 7646 0.445
Lower and Upper 135,000 99,530 0.737
Hutt 2005
Matamata-Piako 30,500 15,952 0.523
District 2006
Porirua City 2005 47,700 31,830 0.667
Rodney District 2006 89,200 34,788 0.390
Rotorua 2007 70,400 52,126 0.740
South Waikato 22,641 12,244 0.541
District 2007
Wellington City 2005 183,500 125,138 0.682
The calculated disposal rate of 541 kg/capita/annum for the District is
approximately similar to other local authorities with similar population size.
Clearly, higher disposal rates are evident within Districts such as Rotorua that
are predominantly urban areas with no kerbside recycling, higher levels of
commercial activities, and subsidised Landfill costs.
6.5.1 Residential Waste – Dry Recyclables
The overall average weekly flow waste of kerbside collection from household
waste stream shows a significant amount of recyclable material that is disposed
of in the Tokoroa Landfill.
Analysis of the waste data shows that there is a large proportion of paper,
plastics and glass disposed of; 23 T/week, 24 T/week and 13 T/week,
respectively. Therefore, it is important to target residents and to educate them
about the importance of recycling and the environmental benefits.
In addition to increasing recycling awareness within the District, there would be
a significant reduction in waste to Landfill through relatively little additional
collection service provision.
HARRISON GRIERSON CONSULTANTS LIMITED Page 20
HG Document No. R001v1-AK130738-01April 2011
HG ref 1012-130738-01
6.5.2 DIVERTED MATERIAL
The additional 880 Tonnes per annum of divertible materials from the kerbside
collection indicates that diversions should be undertaken at the kerbside by
increased participation from household residents to recycle and pre-sorting at
the kerbside to eliminate the need for expensive sorting equipment. Also,
providing a Materials Recovery Facility at the Tokoroa Landfill would assist
diversions prior to the waste being sent to the tip face. Separation at source (or
kerbside) is the ideal environment for diversion of recyclable products.
Activity sources within the District such as ICI and C&D generate a large
proportion of plastic and packaging that are disposed at the Tokoroa Landfill.
Organisations need to ensure that waste management and minimisation
practices are embarked within their organisations to decrease waste at the
Landfill. One of the main reasons of waste being sent to the Landfill is due to
the lack of diverted material services available. Several organisations have
identified other plastic recycling services are required to ensure waste
minimisation occurs. Providing diverted material services to aid organisations to
undertake waste minimisation practices is crucial.
Additionally, data analysis shows the largest practical divertible material
remaining in the kerbside collected waste is organic waste- putrescibles (food
waste/green waste). If compostable waste is disposed at the Landfill, the waste
will decompose to produce methane which can lead to potential environmental
issues.
7.0 FUTURE DEMAND AND GAP ANALYSIS
7.1 FUTURE DEMAND
This section of the Waste Assessment Report has been prepared to fulfil section
51(1) (b), namely:
“a forecast of future demands for collection, recycling, recovery, treatment, and
disposal services within the district.”
7.1.1 Factors affecting service demand
Future demand for waste and resource recovery services is affected by several
factors which can create uncertainties when predicting for the future. Key
factors in South Waikato context are likely to include the following:
Population Growth
Economic Growth
Consumer Behaviour
Recycling Markets
Local and Central Government Policy
HARRISON GRIERSON CONSULTANTS LIMITED Page 21
HG Document No. R001v1-AK130738-01April 2011
HG ref 1012-130738-01
Waste minimisation programmes, services and future initiatives
Demand for increased services
Rural waste sources
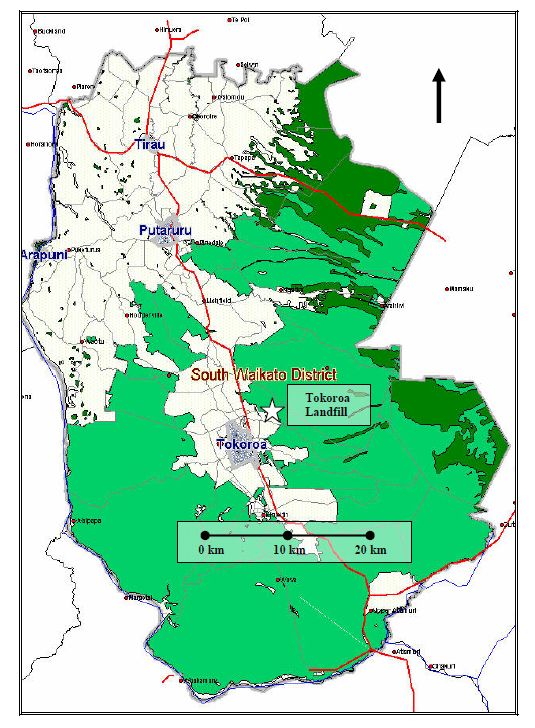
7.1.2 Expectations for population growth
To predict and compare future growth in the district population, statistics and
future predictions have been taken from the 2008 Asset Management Plans.
In the foreseeable future, the District is unlikely to show a significant increase in
waste volumes. Predictions for the South Waikato’s population show that all of
the population growth options of high, medium and low indicate a decrease in
population size.
Table 12 illustrates the total population growth across the different growth
scenarios.
Table 13: Proposed South Waikato Population Scenario
Change 2006-
Variant As at 30 June
2031
Average
Total annual
2006 2011 2016 2021 2026 2031
Number %
change
High 23,300 23,100 22,800 22,300 21,700 -1,600 -0.3
Medium 23,200 22,700 21,900 20,900 19,800 18,400 -4,800 -0.9
Low 22,000 20,600 19,000 17,300 15,300 -8,000 -1.7
University
23,100 22,900 23,200 24,100 25,000 na
Waikato
COUNCIL
22,641 23,000 23,200 23,200 23,100 22,750 +109
Analysis
HARRISON GRIERSON CONSULTANTS LIMITED Page 22
HG Document No. R001v1-AK130738-01April 2011
HG ref 1012-130738-01
South Waikato District Council Population Projections
27000
25000
Population
23000
21000
19000
17000
15000
2006 2011p 2016p 2021p 2026p 2031p
Year
Statistics NZ High Statistics NZ Medium
University Waikato SWDC Analysis
Figure 5: Population Projections
7.1.3 Consumer behaviour
Household waste generation is driven by consumer behaviour. Research
conducted by OECD3 indicated several factors that influence household waste
generation which includes:
Family composition e.g. household numbers and children
Household income and size
Attitude toward the environment and recycling
Presence of volume-based charging systems for waste
Frequency of waste collection
Technological shifts/product supply changes
Increased product packaging
Presence of infrastructure and services to enable resource recovery
Clearly, there are some factors that are beyond Council’s influence such as
family size and household income. However from the factors identified there are
positive correlations that can be associated between waste generation and the
attitudes towards the environment. Other crucial factors impact on behaviour
are the presence of volume-based charging systems such as economic
disincentives (waste levies).
3
From Towards Sustainable Household Consumption, OECD 2002
HARRISON GRIERSON CONSULTANTS LIMITED Page 23
HG Document No. R001v1-AK130738-01April 2011
HG ref 1012-130738-01
A community based social marketing campaign “Biff it in the Bin” has been
implemented in the District as part of its waste minimisation education
programmes to educate and influence consumers about the importance of waste
minimisation.
7.1.4 Legislation – Waste Levy
The WMA legislation enforces reducing waste to Landfill by the waste levy. If the
waste levy is increased over time, a levy would provide a disincentive to Landfill
waste. A large increase in levy rates would be expected to reduce demand for
Landfill services and increase waste minimisation services.
7.1.5 Waste minimisation programmes, services and future initiatives
Introducing waste minimisation programmes and services within the District
increases the demand for waste minimisation services and infrastructure and
reduces the demand for Landfills.
Attributing the reduction of waste generated and deposited at the Tokoroa
Landfill to some waste minimisation programmes can be difficult. However the
kitchen food waste collection that is currently undertaken would have a
quantifiable reduction of waste generated and deposited to the Landfill.
7.1.6 Demand for increased services
Demand for services such as capacity of services, or the service type may
increase in the future due to:
Community expectations are changed therefore leads to additional services
being provided
Changes in legislative or national policy changes would require additional
services being required
7.1.7 Rural waste sources
Waste management practices of rural residents seem unclear however it is
known that some rural residents who are not serviced by the Council use private
waste operator Pete’s Bins that provide a kerbside collection of domestic waste
using 240-litre wheelie bins.
The lack of information regarding farm waste in the District suggests that there
is a need to identify farm waste issues and responses.
7.2 PROJECTIONS FOR SERVICE DEMAND OF DIVERTED MATERIAL
The tables in this section provide a summary of future demand of diverted
material services in the District and the businesses and/or waste management
required to be established to support the organisations efforts to minimise
waste. The organisations that have been identified as a significant industry in
HARRISON GRIERSON CONSULTANTS LIMITED Page 24
HG Document No. R001v1-AK130738-01April 2011
HG ref 1012-130738-01
the District and likely to have waste activities that need to be generally
understood by the Council were sent a questionnaire and a brief telephone
interview was conducted.
Table 14: Projections for Service Demand of Diverted Material
Based on the expected
future quantities and
composition of diverted
Businesses and/or
material generated from
waste management
Waste Generators your organisation, what
should be established to
is the likely future
support your efforts
demand of the diverted
material services in the
District?
Increase – with more
Easier to manage recycling
generation of timber
Pacific Pine Industries and more people required
production but unlikely to
to collect plastic
change in the future
One-stop strapping depot
rather than several
contractors for different
material.
Fonterra Will remain the same The basic recycling by the
SWAC is adequate however
the diverted recycling by
SATS is not.
Remains the same - Any
More effort at local waste
RYH Contracting Ltd product produced is used
disposal site
on Council Gardens
Hancocks Forest Not expected to change N/A – needs are met by
Management significantly current services
Demand will increase –
There are plenty of
running 24/7 produces a
services available for PET
lot of cardboard. Not many
in Auckland however a
Coca Cola Amatil (NZ) services that are currently
general plastic collection
Ltd (water bottlers) present/available (small
system (other PET –
vehicles come once or
bottles and milk bottles/
twice a week with not
closures) is required.
enough space)
Kiwi Lumber Increase More recycling promotion
Increase – partnered with Council should: provide
Greenfingers Garden
Council (food waste in more services of food
Bags
Putaruru) 2-3 waste collection to urban
HARRISON GRIERSON CONSULTANTS LIMITED Page 25
HG Document No. R001v1-AK130738-01April 2011
HG ref 1012-130738-01
Table 14: Projections for Service Demand of Diverted Material
Based on the expected
future quantities and
composition of diverted
Businesses and/or
material generated from
waste management
Waste Generators your organisation, what
should be established to
is the likely future
support your efforts
demand of the diverted
material services in the
District?
kg/household/week – over areas. Crate base system
a year. Approximately 187 to collect recyclables
tonnes PA diverted from should be established –
Putaruru, and sent to advantages: rate payers to
commercial composting store recyclables, increase
operation to be processed of volume of waste
collected and educational
(Dual crate is
recommended as it
provides a larger volume of
storage of approximately
20-30% increase in
recyclable wastes)
Basic recycling, more
NZ Quality Water Ltd Increase
education
Recycling concrete,
concern with regards to
transport cost as it is
Downer Slight change
expensive – no incentive to
recycle concrete as quarry
is cheaper.
These projections indicate that the demand for material services in the District
will increase in the future, with five out of nine organisations predicting an
increase. This suggests there is a greater need for future services to be provided
for these organisations to meet their requirements, and to allow the
continuation of waste management and minimisation practices.
Organisations that are currently undertaking waste minimisation practices have
strongly indicated the need for incentives from the Council to provide cost
effective recycling benefits such as lower transportation cost of divertible
material.
Economic fluctuations also have an impact on the supply of and demand for
diverted materials. Recycling and other resource recovery activities rely on the
source and a market demand for these sources. Clearly, a positive correlation
HARRISON GRIERSON CONSULTANTS LIMITED Page 26
HG Document No. R001v1-AK130738-01April 2011
HG ref 1012-130738-01
will be evident because a demand to increase recycling services will project the
reduction of waste to Landfill.
Diverted material or waste generation can be affected by a variation of factors
such as population and economic growth and production and consumption
patterns. However there are other various factors that can impact significantly
on the market demand for diverted materials which would either lead to an
increase or reduction to divert material from Landfill. These factors include
product quality, transport cost and community and waste minimisation
programmes. With demand and supply determining the competitive market
price on diverted material, it can be expected that with an increase of price for
diverted material, this will also increase the supply and hence more material will
be diverted.
7.3 GAP ANALYSIS
The District data has been analysed, taking into consideration population growth
rates and household projections. The conclusion from this analysis revealed the
total volume of waste produced over the next 10-15 years will remain constant.
This is reliant on a continuation of waste diversion services within the District.
Should the district wish to reduce the quantity of waste to Landfill, this would be
achieved by the introduction of new waste services targeted towards solid and
organic waste, with increased recycling and green waste processing. Decreasing
the amount of waste produced within the District will lead to economic benefits
and fulfilling the requirements of the WMA.
As noted in Section 5, the largest fraction of the waste stream in the collected
refuse is organic material. This material should therefore be targeted to further
reduce the amount of material sent to Landfill.
Although there is sufficient capacity to recover more recyclable materials from
the waste stream any significant increases may need to introduce new
operational services as noted in section 7.2. This may include the introduction of
specialised plastic waste collection.
7.3.1 Disposal Infrastructure
As noted in Section 3.0, the closing of the Putaruru Landfill in 2007 has ironically
coincided with a general decrease in waste tonnages at the Tokoroa Landfill. The
closure will have little effect on the capacity of the Landfill within the next 10 to
15 years as the additional volumes from Putaruru has been outweighed by the
significant downturn in residual tonnages at Tokoroa. This general decline in
tonnages over the past 3 years is well represented in the Table which follows.
Disposal infrastructure in the District presents an issue for the ratepayers and
must be addressed later this decade before the expiry of the principal waste
disposal resource consent (102446) on 31st October 2020.
HARRISON GRIERSON CONSULTANTS LIMITED Page 27
HG Document No. R001v1-AK130738-01April 2011
HG ref 1012-130738-01
7.3.2 Recycling and Organic Waste Infrastructure
The provision of separate collection facilities of organics and recyclables waste
would assist in a significant reduction of waste disposed at the Tokoroa Landfill
thereby supporting the Waste Minimisation Act. Also a reduction of waste
disposed at the Landfill would extend the effective life of the current lined
Landfill cell.
Transportation costs are a key issue for some organisations to ensure diverted
material are recycled. Development of local recycling infrastructure would
reduce ongoing cost. Provision of crates, and specialised collection vehicles
would also increase volumes of clean recyclables from the municipal kerbsides.
There is a current trial collection of kitchen waste by Earthcare Environmental in
Putaruru. Compostable material collected from the trial is taken to the
“Envirofert” facility in Tuakau for processing.
8.0 STATEMENT OF OPTIONS
This section of the Waste Assessment Report identifies options which are
available to meet the forecast demands of the District as set out in section 7 to
fulfil the requirements of section 51(1)(c) of the Waste Minimisation Act:
HARRISON GRIERSON CONSULTANTS LIMITED Page 28
HG Document No. R001v1-AK130738-01You can also read