DEVELOPMENT CONTRIBUTIONS PLAN - FORSTER DISTRICT ADOPTED 28 OCTOBER 2014 - MIDCOAST COUNCIL
←
→
Page content transcription
If your browser does not render page correctly, please read the page content below
Section 94 Development Contributions Plan

                                              Section 94
                                            Development
                                            Contributions
                                                    Plan

                                              Forster District

                                            Adopted 28 October 2014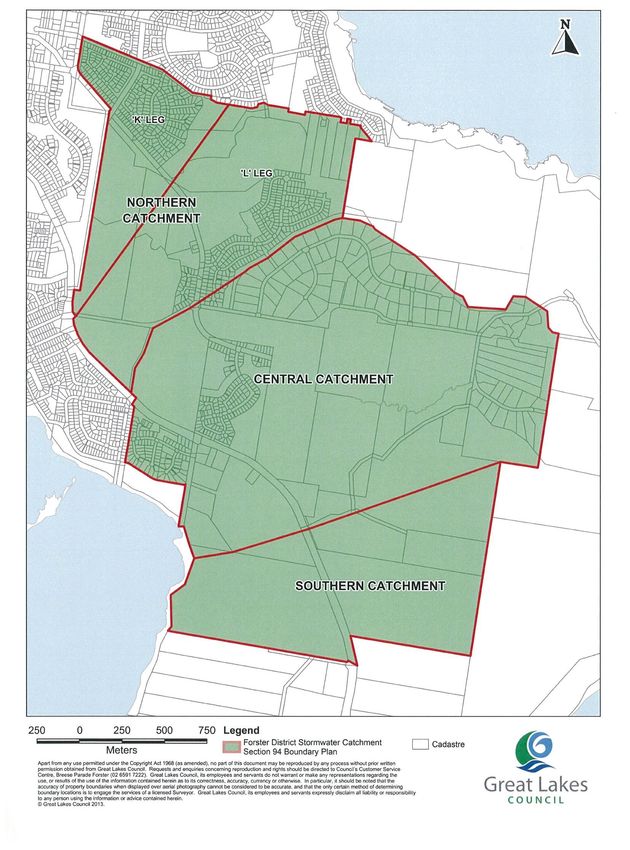
Summary Schedules
These are provided as summary tables only. Details are contained within the plan.

Summary Schedule of Contributions at 2014-15 (Dec 2013 CPI =104.8)
                     Forster, Tuncurry, Green         South Forster Northern   Pacific Palms, Smiths        Bungwahl,
                          Point, Failford                  Catchment               Lake, Nabiac            Coomba Park
  Major Roads
$ per “one-way”                       $651.95                      $651.95                   $488.96                  $325.98
       trip
 Aquatic Centre
    $/person
                                      $295.51                      $295.51                   $295.51                  $295.51
Surf Life Saving
    $/person
                                       $78.95                        $78.95                   $78.95                   $78.95
 South Forster
    Drainage                                                     $2,857.74
    $/person
Library Facilities
    $/person
                                      $488.99                      $488.99                   $488.99                  $488.99
  Open Space
    $/person
                                     $1,413.23                   $1,413.23                $1,413.23                $1,413.23
   Community
    Facilities                        $533.76                      $533.76                   $533.76                  $533.76
    $/person

Motor Vehicle (MV) and Bicycle (Bike) Parking Contributions where the developer is unable to provide
parking as required by Council policy in CBD’s and surrounding Zone B4 areas:
Forster - MV: $17,946.49, Bike: Rail- $1,081.91 or Enclosure - $2,162.78
Tuncurry - MV: $13,560.30, Bike: Rail- $1,081.91 or Enclosure - $2,162.78

Summary Schedule of Works (based on 2009-10 using CPI = 166.0 except where indicated)
(Costs shown are net of grants)
       Facility                          Works                                 Cost Summary      Timing/ Thresholds
       Forster Tuncurry Major Roads      Wallis Lake Bridge duplication          $11,995,000           2022
       (updated in 2012 based on         Improvements to road network            $10,245,800         2015-2025
       CPI = 174.0)                      Improvements to intersections           $12,381,800         2012-2026
                                         Traffic Studies                             $97,800           2015
                                         Present Value of borrowing costs         $6,020,820           2012
       Aquatic Centre                    Recoupment of construction cost          $1,450,805         2009-2031
       (updated in 2012 based on         Enhancement works                        $2,845,455         2012-2031
       CPI = 174.0)
       Surf Life Saving                  Equipment                                  $200,000           2009-2031
                                         Building                                  $1,200,000          2009-2031
       South Forster Drainage            Northern Catchment                        $3,225,000          2009-2016
       Forster District Library          Building program                          $6,300,000          2010-2021
                                         Present Value of borrowing costs          $2,230,000          2010-2031
       Forster District Open Space       Foreshore Development                     $8,404,000          2009-2031
                                         Sports Fields                             $8,780,000          2009-2031
                                         Linkages                                  $1,770,000          2009-2031
                                         General Park Improvements                 $3,044,000          2009-2031
                                         Land Acquisition Program                  $7.850,000          2009-2031
       Community Facilities              Community Facility                        $6,400,000          2009-2031
                                         Present Value of Borrowing Costs          $2,305,000          2009-2031
       Forster Parking(CPI = 102.0)      Acquisition and development               $3,074,238          2006-2017
       Tuncurry Parking(CPI = 102.0)     Acquisition and development               $2,771,567          2006-2017

The above amounts include Council’s apportioned liability in respect of benefit to existing population, as follows:

Forster District Open Space       Council Liability                             $6,800,500         2009-2031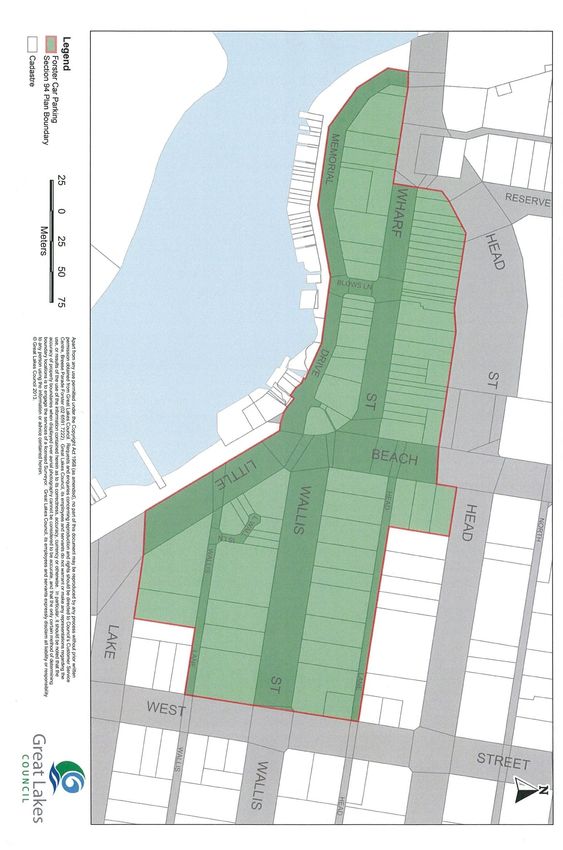
FORSTER DISTRICT
                                                      S94 CONTRIBUTIONS PLAN

Table of Contents

Summary Schedules ..................................................................................................................... 1
  Summary Schedule of Contributions at 2014-15 (Dec 2013 CPI =104.8) ................................................... 1
  Summary Schedule of Works (based on 2009-10 using CPI = 166.0 except where indicated) ................ 1
1 Forster District Plan ................................................................................................................... 4
  1.1 Purpose of the Forster District Plan ......................................................................................................... 4
  1.2 Land to which the Forster District Plan Applies ....................................................................................... 4
  1.3 History of the Forster District Plan ........................................................................................................... 4
2 Development Forecasts ............................................................................................................. 5
  2.1 Residential Development .......................................................................................................................... 5
  2.2 Non-Residential Development .................................................................................................................. 6
  2.3 New Traffic Generated .............................................................................................................................. 6
3 Major Roads Plan ....................................................................................................................... 7
  3.1 Purpose of the Major Roads Plan ............................................................................................................ 7
  3.2 Land to which the Major Roads Plan Applies .......................................................................................... 7
  3.3 Effect of Development on Major Roads ................................................................................................... 7
  3.4 History of Major Roads Plans in the Forster District ............................................................................... 7
  3.5 Major Roads Program ............................................................................................................................... 8
  3.6 Major Roads Contribution Rates .............................................................................................................. 9
4 Aquatic Centre Plan ................................................................................................................. 10
  4.1 Purpose of the Aquatic Centre Plan ....................................................................................................... 10
  4.2 Land to which the Aquatic Centre Plan applies..................................................................................... 10
  4.3 Effect of Development on the Aquatic Centre ....................................................................................... 10
  4.4 History of the Aquatic Centre Plan ......................................................................................................... 10
  4.5 Aquatic Centre Program and Contribution Rates .................................................................................. 12
5 Surf Life Saving Plan ............................................................................................................... 13
  5.1 Purpose of the Surf Life Saving Plan ..................................................................................................... 13
  5.2 Land to which the Surf Life Saving Plan applies ................................................................................... 14
  5.3 Effect of Development on Surf Life Saving Facilities ............................................................................ 14
  5.4 History of Surf Life Saving Plans in the Forster District ........................................................................ 14
  5.5 Surf Life Saving Facilities Program and Contribution Rates ................................................................ 15
6 South Forster Drainage Plan ................................................................................................... 16
  6.1 Purpose of the South Forster Drainage Plan ........................................................................................ 16
  6.2 Land to which the South Forster Drainage Plan applies ...................................................................... 16
  6.3 Effect of Development on South Forster Drainage ............................................................................... 16
  6.4 History of the South Forster Drainage Plan ........................................................................................... 16
  6.5 Revised South Forster Drainage Program and Contribution Rates..................................................... 17
7 Forster District Library Plan .................................................................................................... 18
  7.1 Purpose of Plan ....................................................................................................................................... 18
  7.2 Land to which plan applies ..................................................................................................................... 18
  7.3 Effect of Development on Library Facilities ........................................................................................... 18
  7.4 History of Forster Library Plans .............................................................................................................. 18
  7.5 Proposed Extension of Facilities ............................................................................................................ 18
  7.6 Derivation of contribution rates ............................................................................................................... 20
8 Forster District Open Space Plan ........................................................................................... 20
  8.1 Purpose of the Forster District Open Space Plan ................................................................................. 20
  8.2 Land to which the Forster District Open Space Plan Applies .............................................................. 20
  8.3 Effect of Development on Forster District Open Space Facilities ........................................................ 21
  8.4 History of Forster District Open Space Plans ........................................................................................ 21
  8.5 Program of Works.................................................................................................................................... 22
  8.6 Program Summary .................................................................................................................................. 26
  8.7 Apportionment and Calculation of Contribution Rates .......................................................................... 26
9 Forster District Community Facilities Plan ............................................................................ 27
  9.1 Purpose of Plan ....................................................................................................................................... 27
                                                                                                  Great Lakes Council - Adopted 28 October 2014
                                                                                                                                   Page 2 of 42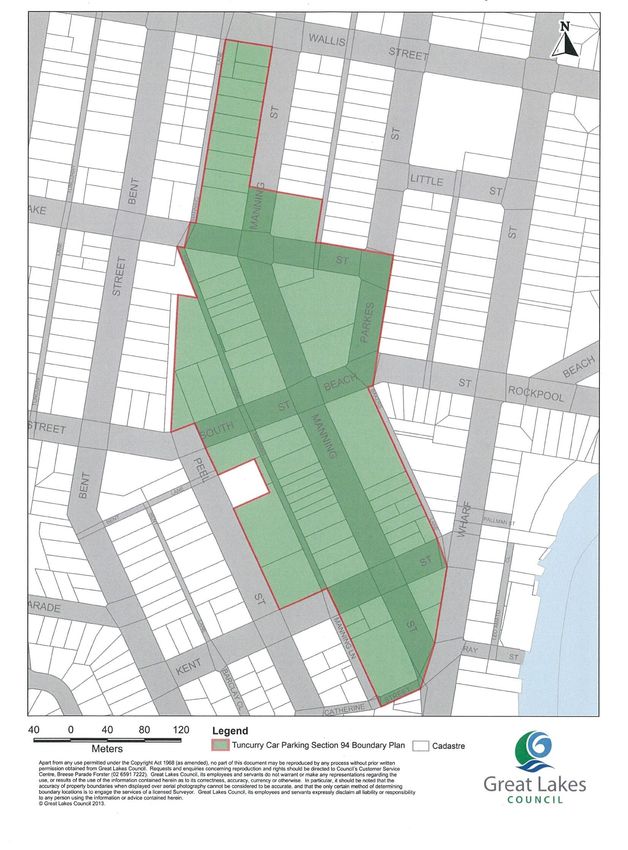
FORSTER DISTRICT
                                                    S94 CONTRIBUTIONS PLAN
  9.2 Land to which plan applies ..................................................................................................................... 27
  9.3 Effect of Development on the need for Community Facilities .............................................................. 27
  9.4 Existing Community Facilities ................................................................................................................. 27
  9.5 Proposed Extension of Facilities ............................................................................................................ 27
  9.6 Derivation of contribution rates ............................................................................................................... 28
10 Forster Parking Plan .............................................................................................................. 28
  10.1 Purpose of the Forster Parking Plan .................................................................................................... 28
  10.2 Land to which the Forster Parking Plan applies .................................................................................. 28
  10.3 Effect of Development on Forster Parking .......................................................................................... 28
  10.4 History of the Forster Parking Plan ...................................................................................................... 29
  10.5 Forster Parking Program and Contribution Rates ............................................................................... 30
11 Tuncurry Parking Plan ........................................................................................................... 31
  11.1 Purpose of the Tuncurry Parking Plan ................................................................................................. 31
  11.2 Land to which the Tuncurry Parking Plan applies ............................................................................... 31
  11.3 Effect of Development on Tuncurry Parking ....................................................................................... 31
  11.4 History of the Tuncurry Parking Plan ................................................................................................... 31
  11.5 Tuncurry Parking Program and Contribution Rates ............................................................................ 32
12 Payment of Contributions ..................................................................................................... 33
  12.1 Application of Contributions to Various Developments ...................................................................... 33
  12.2 Timing of Payments .............................................................................................................................. 34
  12.3 Pooling of Contributions ........................................................................................................................ 34
  12.4 Concessions/Discounts/Exemptions/Variations/Credits to Contributions ......................................... 35
13 References ............................................................................................................................. 36
14 Appendices ............................................................................................................................ 37
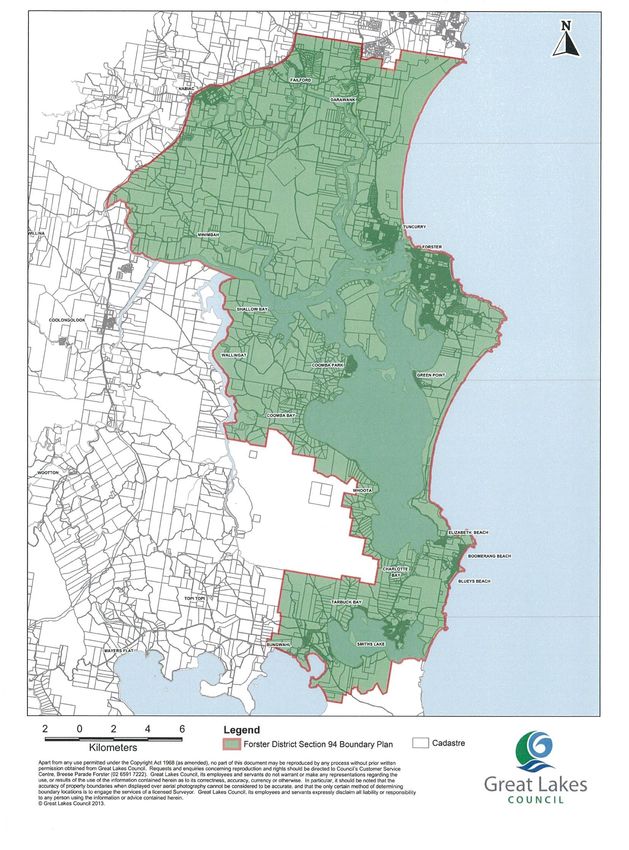
    1.   "S94 Plan: Forster District – Great Lakes 2013 Catchment Boundary" Amended Map
    2.   "S94 Plan: Forster District - Stormwater Catchment Great Lakes 2013 Catchment Boundary” Map
    3.   "S94 Plan: Forster Car Parking - Great Lakes 2013 Catchment Boundary” Amended Map
    4.   "S94 Plan: Tuncurry Car Parking - Great Lakes 2013 Catchment Boundary” Amended Map
    5.   “Non-Residential Developments S94 ‘One-Way’ Trips Table” – 18 November 2013

                                                                                               Great Lakes Council - Adopted 28 October 2014
                                                                                                                                Page 3 of 42
FORSTER DISTRICT
                                     S94 CONTRIBUTIONS PLAN

1 Forster District Plan

1.1 Purpose of the Forster District Plan
The purpose of this plan is to enable contributions to be levied as a condition of consent for development
that increases the demand for infrastructure in the Forster District.

1.2 Land to which the Forster District Plan Applies
This plan applies to development in the area for which the Forster-Tuncurry urban area is the main service
centre. It is defined in "S94 Plan: Forster District – Great Lakes 2013 Catchment Boundary" Amended
Map in Section 14 - Appendices.

1.3 History of the Forster District Plan
  Event                                           Date
  First Exhibited by Council                      1 May 2002 to 31 May 2002
  First Adopted by Council:                       25 June 2002
  Plan first became effective:                    11 July 2002
  Revisions:
  Amended to change occupancy rates to those      Exhibited 9 July 2003
  shown in Council’s “Standard Schedule for S94   Adopted by Council resolution 26 August 2003
  Plans.”
  Revise population forecasts                     Exhibited (Advertised in Great Lakes Advocate and Nota): 8
  Add Forster District Major Roads                March 2006
  (consequently repeals South Forster Roads       Adopted by Council 23 May 2006
  and Drainage,                                   Effective Date (Advertised in Advocate and Nota): 31 May 2006
  Town of Forster Roads & Drainage, Nth
  Tuncurry Release Area)
  Revise Aquatic Centre & Surf Life Saving
  Add Library Facility                            Exhibited (Advertised in Great Lakes Advocate and Nota): 5 July
                                                  2006
                                                  Adopted by Council 22 August 2006
                                                  Effective Date (Advertised): 31 August 2006
  Add Forster Car Parking and Tuncurry Car        Exhibited (Advertised in Great Lakes Advocate and Nota): 4 Oct
  Parking                                         2006
                                                  Adopted by Council 28 November 2006
                                                  Effective Date (Advertised): 6 December 2006
  Forster District Nov 07                         Exhibited (Advertised in Great Lakes Advocate and Nota):
  Contributions defined for tourist               19 September 2007
  accommodation and added for smaller units.      Adopted by Council: 30 October 2007
  (Section 12.1)                                  Effective:           8 November 2007
  Add Open Space                                  Exhibited (Advertised in Great Lakes Advocate and Nota): 18
  Add Community Facilities                        March 2009
  Revise generally                                Adopted by Council: 9 June 2009
  Repeal Forster Tuncurry Neighbourhood           Effective Date (Advertised): 1 July 2009
  Space Plan (1993)
  Repeal Pacific Palm O S Plan (1993)
  Indexed Contribution Rates for 2014-15,         Conditionally Approved by Council:   25 Mar 2014
  Updated Works Program for Roads, Tuncurry       Advertised and Exhibited:              31Mar - 30 Apr 2014
  Parking and Aquatic Centre, Amended             Adopted by Council                    28 Oct 2014
  Proposed Extension of Community Facilities,     Effective Date (Advertised):          1 Jan 2015#
  Added Bicycle Parking, Amend Non-
  Residential Trips Related Contributions,
  Updated CBD and South Forster Drainage
  Catchment Maps, Costs and Contributions for
  Car Parking in Forster and Tuncurry,
  Amended Plan Catchment Maps, Application
  of S94 Credits and Amendments for Approval
  of S94 Concessions/Discounts/Variations

# This plan will apply to all development consents issued on or after the most recent effective date.

                                                                     Great Lakes Council - Adopted 28 October 2014
                                                                                                      Page 4 of 42
FORSTER DISTRICT
S94 CONTRIBUTIONS PLAN
2 Development Forecasts
2.1 Residential Development
Future residential development
This is based on the following reports issued by Council’s Strategic Planning Branch.
The Forster Tuncurry Conservation and Development Strategy (2003)
The Rural Living Strategy (2004)
The Forster Tuncurry Land Use Study (2005) with respect to medium and high density zones
Household size
The gross population generated by all future development is estimated by applying an average household
size of 2.1 to each dwelling. This is based on the average household size for Great Lakes at the 2006
census being 2.2 persons, and assuming a 5% permanent vacancy rate. The contributions payable depend
on population generated according to dwelling size (ranges from 1.0 to 2.4 persons/ dwelling) and the
weighted average of all these is also 2.1 persons/ dwelling.
Although household size has declined steadily over the past 60 years, it does not follow that the trend will
continue. No further decline is predicted in this contributions plan. This plan will however be reviewed
periodically to take account of future population data.
Gross Population
Contributions are payable equally on developments intended for tourism and for residential use. Because the
Forster District is a holiday destination, many dwellings ore occupied for less than the whole year. On census
night 2006, only 77% of Forster-Tuncurry houses and flats were occupied.
This means that the gross population represented by contributions paid is greater than the residential
population.
This gross population, that could only occur if all dwellings were occupied, is fairly close to the average
population in January, when visitor population is at its peak.
Estimates of Leviable Population
vacant
total Total future
2008 lots with New leviable
Count of Private Dwellings 1996 2001 2006 dwellings dwellings
est dwelling dwellings
levies paid (2041)
potential
Forster-Tuncurry 9,060 9,898 10,715 11,100 396 11,496 8,011 19,507
Pacific Palms 623 720 911 950 147 1,097 36 1,133
Smiths Lake 484 562 663 700 360 1,060 49 1,109
Coomba Park 230 247 311 330 389 719 0 719
Green Point 217 244 267 280 48 328 28 356
Nabiac 195 216 232 240 61 301 140 441
Darawank, Failford 263 284 364 380 83 463 40 503
Bungwahl, Tarbuck Bay 263 292 321 340 78 418 0 418
Coomba Rural CD1092408 117 154 162 170 18 188 4 192
Nabiac Rural CD1091607 104 135 151 160 33 193 0 193
Wallis Lake, Booti Booti
33 29 61 70 5 75 0 75
CD1092401
SUB-TOTAL 11,589 12,781 14,158 14,720 1,618 16,338 8,308 24,646
Allowance for dwellings not
1,200 1,400 1,600 1,700 1,700 300 2,000
counted at census
Allowance for dwellings not
0 200 200
included above
TOTALS 12,789 14,181 15,758 16,420 1,618 18,038 8,808 26,846
Gross population at
34,482 3,398 37,880 18,497 56,377
2.1/dwelling
Great Lakes Council - Adopted 28 October 2014
Page 5 of 42FORSTER DISTRICT
S94 CONTRIBUTIONS PLAN
2.2 Non-Residential Development
Estimated Estimated Estimated
Existing Future floor additional
floor area sq area sq m trips
m
Retail 80,000 20,000 2,000
Commercial 50,000 20,000 400
Industrial 80,000 20,000 200
Sub-Total Non-Residential 210,000 60,000 2,600
Other (now includes Special Unknown 26,000 2,600
Uses)
Total Non-Residential 210,000+ 86,000 5,200
Note: As a consequence of our recent Economic Development studies, detailed travel demand modelling
and Council's desire to change the apportionment of "one-way" trips to closer reflect actual "Non-Residential"
Developments' travel demand, we have herein removed the counting of "one-way" trips that can now be
justifiably apportioned to the residential developments within the Great Lakes Council area. Accordingly the
above table has been modified to include a relatively large "Special Uses" component and it now better
reflects the "one-way" trips that are considered to be directly attributable to the listed types of "Non-
Residential" developments.
2.3 New Traffic Generated
The updated RMS Guide to Traffic Generating Developments is used to estimate traffic generated by a
development. The traffic is expressed as a number of daily “one-way” trips so that a return trip counts as two
trips.
The following table is an estimated projection of future traffic generated up to 2041.
Development type units Number Total trips
Residential dwellings Dwellings 8,808 61,656
Motel units Units 1,000 3,000
Non-Residential Sq metres 60,000 2,600
Other N-R (includes Special Uses) Sq metres 26,000 2,600
Total 69,856
Notes:
1. The above table was modified in November 2013 when amendments were made to this Plan
subsequent to a thorough 3-year internal to GLC re-assessment/update of the Non-Residential and
Residential "one-way" trips' apportionment for this Plan which included changes to S94 Plans Major
Roads Contributions' Apportionment, detailed travel demand modelling and the adoption of a new S94
Contributions Assessment policy.
2. The total figure in the above table is only the aggregate of all "one-way" trips generated and is used in
deriving an equitable sharing of infrastructure cost among all generators. It is not a figure that can be
used in traffic engineering since, in many cases, it includes both ends of the same trip.
Great Lakes Council - Adopted 28 October 2014
Page 6 of 42FORSTER DISTRICT
S94 CONTRIBUTIONS PLAN
3 Major Roads Plan
3.1 Purpose of the Major Roads Plan
This plan is to enable funding for improvements to Forster-Tuncurry Major Roads so that, as further
development and consequent increases in motor, pedestrian and cycle traffic occur, Council will be in a
position to increase the capacity of the major roads and intersections.
3.2 Land to which the Major Roads Plan Applies
The Major Roads plan covers all the Forster District as defined in "S94 Plan: Forster District – Great
Lakes 2013 Catchment Boundary" Amended Map in Section 14 - Appendices. Residents of this
catchment access most of their business, shopping, educational, entertainment and sporting requirements in
Forster-Tuncurry.
3.3 Effect of Development on Major Roads
As development occurs anywhere in the Forster District, the traffic on the Forster-Tuncurry major road
network increases because Forster-Tuncurry is a service centre for the surrounding district.
The network is at present, that is, March 2014, still considered to be adequate, so any increase in traffic will
result in a need for upgrade. Accordingly there is no need for any Council apportionment or Council
Contribution for this plan to succeed and this assumption results in all the plan's listed roads improvements
being funded by the various developments that occur during the projected life of this plan.
3.4 History of Major Roads Plans in the Forster District
The 2006 Plan repealed the North Tuncurry Roads, South Forster Roads and the Town of Forster Roads
plans and created the Forster District major Roads Plan.
It included the derivations of the amounts to be transferred from the repealed accounts
Amount transferred from repealed North Tuncurry Roads Plan - 31 May 2006 $27,348
Amount transferred from repealed Town of Forster Roads Plan - 31 May 2006 $50,404
Amount transferred from repealed South Forster Roads Plan - 31 May 2006 $486,823
Amount collected June 2006 including interest earned $17,749
Amount spent Traffic Study GHD $92,679
Balance at 30 June 2006 $489,645
Amount collected 2006-07 including interest earned $543,772
Amount spent roundabout Manning St/ Wallis St Tuncurry $502,566
Balance at 30 June 2007 $530,851
Amount collected 2007-08 including interest earned $133,719
Spent 2007-08 -$149,349
Further transfer from Town of Forster Roads $999
Balance at 30 June 2008 $516,220
Great Lakes Council - Adopted 28 October 2014
Page 7 of 42FORSTER DISTRICT
S94 CONTRIBUTIONS PLAN
3.5 Major Roads Program
3.5.1 Schedule of Works
The works are on the Lakes Way and its major feeders.
Estimate Start
Location Scope of work
(2011 values) Date
Road Network Improvement
Tuncurry Rd from 250m N of Chapmans Rd Construct 2 additional lanes 1.3km
$1,467,200 2021
R1 to Grey Gum Rd length
Beach St extension North St to Northern
Construct 1.6km of 9m carriageway $1,896,500 2027
R2 Parkway
R3 Wallis Lake Bridge incl approaches duplication, total cost $23,910,000 $11,955,000 2025
Construct 2 additional lanes 1.0km
The Lakes Way Kularoo Dr to Breese Pde $391,300 2018
R4 length
The Lakes Way Breese Pde to Cape Hawke Construct 2 additional lanes 1.4km
$2,323,600 2022
R5 Dr length
The Lakes Way Cape Hawke Dr to Southern Construct 2 additional lanes 1.5km
$1,467,200 2028
R6 Parkway length
Southern Parkway Breese Pde to Cape Road Connection 330m part
$745,000 Done
R7 Hawke Dr construction
Southern Parkway Cape Hawke to The Land Acquisition and construction of
$1,700,000 2026
R8 Lakes Way centre travel lanes
The Lakes Way Southern Parkway to Sweet Construct improved alignment
$1,000,000 2027
R9 Pea Road (Needed for new developments)
Intersection Improvement
I1 Manning St/ Grey Gum Rd Roundabout $608,600 2017
I2 Manning St/ Chapmans Road Roundabout $1,100,000 2017
I4 Manning St/ Kent St Intersection Treatment $30,000 Done
Local Area Traffic Management
Off-Manning St improvements $2,934,400 2016
I6 Scheme
I7 Head St/ Beach St Traffic signals $608,600 2029
Local Area Traffic Management
Beach St/Wallis Street/Memorial Drive $429,300 2020
I8 Scheme
Local Area Traffic Management
Wharf Street / Beach Street $304,300 2018
I9 Scheme
I10 Head St/ West St Intersection Treatment $918,400 2020
I11 Macintosh St/Strand St Intersection Treatment $244,500 2015
I12 Macintosh St/ South St Intersection Treatment $244,500 2015
I13 Macintosh St/ Kularoo Dr Traffic signals $608,600 2023
I14 The Lakes Way/ Bright St Roundabout $733,600 2018
I15 The Lakes Way/ Goldens Rd Roundabout $733,600 2022
I16 Cape Hawke Dr/ Southern Parkway Roundabout $733,600 2022
I17 The Lakes Way/ Southern Parkway Roundabout $856,400 2024
I18 Kularoo Dr/Boundary St Roundabout $489,100 2014
I19 The Lakes Way /Breese Pde Property purchase $304,300 2016
I20 The Lakes Way / Sweet Pea Road Intersection Treatment $500,000 2027
Traffic Studies
T1 GHD study April 2005 reimburse general account $92,679 Done
T2 Traffic engineering design software $0 Done
T3 Detailed study for Bridge duplication $97,800 2018
Total works value $35,518,079
Note: With respect to the bridge duplication, only 50% of the estimated $23,910,000 cost is being recovered
through contributions, it being Council’s expectation that the balance will be funded by RMS/Government
grants. It is reiterated here that there is no need for any Council contributions towards the funding of the
bridge's major upgrade as it was and still is quite adequate for the traffic generated by the existing population
at the start and subsequent review points for this plan.
Great Lakes Council - Adopted 28 October 2014
Page 8 of 42FORSTER DISTRICT
S94 CONTRIBUTIONS PLAN
3.5.2 Annual Account Forecast
Annual Account Forecast (Amounts are in $,000)
Inflation rate 4%
Interest rate on credit balance 5%
Interest rate on debit balance 8%
Total contribution 2011 values (Estimate) 40,741
income,
expenditure income, expenditure, net income
2011 interest balance end
2011 values indexed indexed indexed
values
Total 40,741 -35,518 79,897 -50,398 29,499 -30,140 -641
3.6 Major Roads Contribution Rates
Grant Funds
Except in the case of the major duplication of the bridge already mentioned in 3.5 above, it is not expected
that grant funds will be available to support the remainder of the major roads program.
Therefore a 2011-indexed amount of $40,741,000 will need to be raised from contributions.
Proportional Distribution
In deriving a rate for contributions, the net amount required is shared by future development in proportion to
the estimated daily traffic generated by each development. The aggregate of these daily traffic estimates will
of course be higher than actual traffic since the same trip can be shared by two developments. This does not
mean there is double-counting in the formula. The total sum being collected is fixed. Traffic generated is
simply a measure of apportionment.
It should be clearly understood that Council, via its then current Section 94 Plans, has the authority and
responsibility to establish and/or change the actual apportionment of any specific S94 Plans' Contributions
as it determines based on NSW Councils' Approved Section 94 practices, Council's Strategic Plans,
Objectives and Policies in place at that time.
With respect to geographical apportionment, no attempt is made to differentiate between various parts of
Forster-Tuncurry. However Council is of the opinion that, as the more outlying areas will visit Forster-
Tuncurry less frequently, the contributions should be proportionately less.
A fair apportionment is considered to be as follows:
Up to 15km from Bridge Forster, Tuncurry, Green Point, Failford 100%
15-30km from Bridge Pacific Palms, Smiths Lake, Nabiac 75%
Over 30km from Bridge Bungwahl, Coomba Park 50%
Calculation of rate
The number of additional "one-way" trips (see chapter 2) is 69,856.
The estimated spread of trips among the zones is estimated as follows;
Inner zone 90% of trips
Middle zone 7% of trips
Outer zone 3%of trips
The equivalent number of inner zone trips is therefore
(90% + 75%x 7%+50%x3%) x 69,856
= 96.75% x 69,856
= 67,586
The contribution rate for inner zone is therefore $40,741,000/67,586= $602.80
Great Lakes Council - Adopted 28 October 2014
Page 9 of 42FORSTER DISTRICT
S94 CONTRIBUTIONS PLAN
The rate for various localities shall be as follows, per additional “one-way” trip:
Inner Zone (Up to 15km from Bridge) Forster, Tuncurry, Green Point, Failford $602.80
Middle Zone (15-30km from Bridge) Pacific Palms, Smiths Lake, Nabiac $452.10
Outer Zone (Over 30km from Bridge) Coomba Park, Bungwahl $301.40
The above rate is applicable to the 2011-12 (using CPI = 96.9/174.0).
The rate will be indexed on each 1 July thereafter in accordance with the change in the CPI for the year to
the previous December quarter. The CPI is the All Groups Consumer Price Index, weighted average of 8
capital cities.
The CPI value for December quarter 2012 is 102.0 thereby giving the following contribution rates per “one-
way” trip for 2013-14:
Inner Zone (Up to 15km from Bridge) Forster, Tuncurry, Green Point, Failford $634.53
Middle Zone (15-30km from Bridge) Pacific Palms, Smiths Lake, Nabiac $475.90
Outer Zone (Over 30km from Bridge) Coomba Park, Bungwahl $317.27
4 Aquatic Centre Plan
4.1 Purpose of the Aquatic Centre Plan
This plan aims to recoup expenditure by Great Lakes Council on the Forster Aquatic Centre, and to
undertake enhancement during the life of the plan.
4.2 Land to which the Aquatic Centre Plan applies
The facility is patronised by residents in the Forster District, being the area shown on "S94 Plan: Forster
District – Great Lakes 2013 Catchment Boundary" Amended Map in Section 14 - Appendices.
4.3 Effect of Development on the Aquatic Centre
As the population grows in the Forster district the demand for the facility will increase and the need for
enhancement will increase. Contributions will be levied on new development in the district and will cover that
portion of the costs attributable to new population, with the remainder being met by Council in proportion to
the number of residents existing at the time of provision of the facility.
4.4 History of the Aquatic Centre Plan
The Forster Aquatic Centre (FAC), also known as the Great Lakes Aquatic and Leisure Centre is
situated on Lake Street. It contains an indoor heated swimming pool, gymnasium, change rooms, meeting
and other indoor facilities. The FAC adjoins a major outdoor sporting venue that includes playing fields, an
oval and courts.
The FAC was opened in 1991.
The first contributions plan was in 1993 as a component of each of various Open Space Plans. It sought to
recover the $1,450,000 borrowed to fund Council’s contribution to the construction of the centre. In addition,
Council had used other sources of funds, including sport and recreation grants and community fund raising
revenue to construct the FAC. However amounts from those other sources cannot be recovered under s94.
Great Lakes Council - Adopted 28 October 2014
Page 10 of 42FORSTER DISTRICT
S94 CONTRIBUTIONS PLAN
The first contribution rate was derived by dividing $1,450,000 by 60,000 persons ($24.16) then applying a
discount to the more distant localities. The 1993 contributions were Forster-Tuncurry $24.16 per person,
Green Point $18.12 Nabiac $12.08 Pacific Palms $12.08. The total amount collected from 1993 to 2001 was
$109,364.
The 2002 Plan
The 2002 contributions plan took the construction of the centre out of the Open Space plans and placed it in
the Forster District Plan. The plan aimed to recoup the interest component of the construction cost as well as
the principal amount. The aim also was to collect the amount by 2031 being estimated end of the economic
life of the centre.
Other new elements in the 2002 plan were enhancements to the centre and the finance charge for the
enhancements.
The contributions for 2002-2003 were derived as follows:
Recoupment Of Construction Cost
Principal amount of loans $1,450,000
Interest on loans $1,260,889
Paid from Council reserves $620,000
Total amount expended by Council $3,331,389
Council’s apportioned liability (1991 population divided $1,478,532
by 2031 population) (16,880/38,034 = 44.38%)
Balance to be recouped at 1991 $1,852,857
Amount foregone through under-collection 1993-2001. -$348,523
Result of over-estimating growth and not including
interest. Rate should have been $87.59, not $24.16.
Amount collected 1993-2001 including interest -$109,364
Total amount to be collected at 2001 $1,394,970
Population change 2001 – 2031 (assumed “capital life” 15,910
of 40 years)
Contribution to be collected from 2002 $87.68 per person
Enhancement of Aquatic Centre
According to the 2002 plan:
“Some features of the FAC were designed or constructed to minimise capital cost. Council has identified
three enhancements it wishes to provide to increase the use and enjoyment of the FAC:
Internal lining of the sports hall (presently unlined Colorbond) to improve user comfort and allow a
greater range of indoor sport activities to be held;
Shade cover for outdoor seating areas to improve user comfort and safety;
Extension of the upstairs gymnasium over the sports hall to increase floorspace and provide user
benefits.”
Lining $136,092
Shade cover $16,883
Gym extension $206,200
Total $359,175
Population 2031 38,034
Population 2001 22,124
Council’s apportioned liability (2001 population divided $208,927
by 2031 population) (22,124/38,034 = 58.17%)
Balance to be collected at 2001 $150,248
Population change 2001 – 2031 15,910
Contribution to be collected $9.44 per person
Great Lakes Council - Adopted 28 October 2014
Page 11 of 42FORSTER DISTRICT
S94 CONTRIBUTIONS PLAN
Enhancement Finance Charge
Finance charge $96,365
Population 2031 38,034
Population 2001 22,124
Population change 2001 – 2031 15,910
Contribution to be collected $6.06 per person
Summary of Rates
Construction $87.68
Enhancement $9.44
Enhancement finance charge $6.06
Total $103.18
The May 2006 Plan combined the three contributions into a single rate of $108.25 per person
4.5 Aquatic Centre Program and Contribution Rates
Review from 1 July 2011- 30 June 2013
Recoupment of Construction Cost
Recoupment progress since 2002 plan
Financial CPI previous indexed amount at recouped Outstanding at 30
Year Dec qtr 1 July during year June
2003 135.4 $1,394,970
2004 139.5 $1,437,211 $54,126 $1,383,085
2005 142.8 $1,415,803 $65,000 $1,350,803
2006 146.5 $1,385,803 $22,545 $1,363,258
2007 150.6 $1,401,411 Nil $1,401,411
2008 155.5 $1,447,008 Nil $1,447,008
2009 160.1 $1,489,813 Nil $1,489,813
2010 166.0 $1,544,715 Nil $1,544,715
2011 94.3/169.5 $1,577,284 $164,000 $1,413,284
2012 96.9/174.0 $1,450,805 Nil $1,450,805
2013 99.8 $1,494,224 Nil $1,494,224
2014 102.0 $1,527,163 TBA TBA
Council Apportioned Liability
Council’s liability was estimated in the 2002 plan at $208,927 in 2002 values, and has been discharged by
expenditure on various enhancements to the Centre, including car parking and air-conditioning, as follows:
Financial CPI previous indexed amount at Paid during
Year Dec qtr 1 July year Outstanding at 30 June
1993-
2003 $182,090
2003 135.4 $208,927 $4,000 $204,927
2004 139.5 $211,132 Nil $211,132
2005 142.8 $216,127 Nil $216,127
2006 146.5 $221,727 Nil $221,727
2007 150.6 $227,932 Nil $227,932
2008 155.5 $235,348 Nil $235,348
2009 160.1 $242,310 Nil $242,310
2010 166.0 $251,240 Nil $251,240
2011 94.3/169.5 $256,537 $256,537 Nil
2012 96.9/174.0 Nil Nil Nil
Great Lakes Council - Adopted 28 October 2014
Page 12 of 42FORSTER DISTRICT
S94 CONTRIBUTIONS PLAN
2013 99.8 Nil Nil Nil
2014 102.0 Nil Nil Nil
Program and Calculation of Rates (Using 2011 Values)
Recoupment to be transferred to Council (as at 1/7/2011) $1,450,805
Council remaining liability Nil
Building Extensions/Enhancements undertaken in 2011-12 to cater for 1,060,455
increased demand (S94 Portion = 41.83% x $2,535,155)
Remaining Ventilation of Sports Hall $35,000
Car Park Lighting $100,000
Staff accommodation $200,000
Additional equipment $100,000
Additional Program Pool, Related Equipment & Building to House $1,000,000
Enlargement of Kiosk, Crèche and Change Room Facilities $250,000
Unscheduled enhancement works $100,000
Less balance held -$6,543
Total Contributions required $4,289,717
Contribution per person (15,700 based on growth 2011 to 2041) $273.23
Note: Population Growth of 15,700 based on adjusted Forecasts from “.id - Great Lakes Council Population
Forecasts – 2031”
The above rate is applicable to 2011-12 using CPI = 96.9/174.0).
The rate will be indexed on each 1 July thereafter in accordance with the change in the CPI for the year to
the previous December quarter. The CPI is the All Groups Consumer Price Index, weighted average of 8
capital cities.
The CPI value for December quarter 2012 is 102.0 thereby giving the following contribution rates per person
for 2013-14: $287.61
5 Surf Life Saving Plan
5.1 Purpose of the Surf Life Saving Plan
This plan is to enable funding for improvements to surf life saving (SLS) facilities as required for the
expanding population.
Surf Life Saving Clubs are largely volunteer-run organisations that patrol certain beaches to protect public
safety. They also assist other groups during coastal emergencies. To provide needed expertise in surf
rescue, clubs practise extensively and organise competitions with other clubs.
Surf Life Saving Clubs are organised under Surf Life Saving NSW Incorporated. The State organisation and
local councils provide a portion of their capital funding, but some expenses are met by voluntary fund raising.
Council has an obligation under State legislation to ensure safety of users of public beaches. This Plan
considers that such an obligation requires Council, among other things, to provide facilities to surf life saving
clubs located on public land, and equates to the provision of a public facility or amenity that can be
recovered under s94.
There are three Surf Life Saving Clubs in the Forster District:
1. Forster Surf Life Saving Club, which is presently located on the headland at the end of North Street at
Forster Main Beach;
2. Cape Hawke Surf Life Saving Club, which is located at the southern end of One Mile Beach, Forster;
3. Pacific Palms Surf Life Saving Club, which is located on Lakeside Crescent at Elizabeth Beach;
Great Lakes Council - Adopted 28 October 2014
Page 13 of 42FORSTER DISTRICT
S94 CONTRIBUTIONS PLAN
5.2 Land to which the Surf Life Saving Plan applies
The catchment area contributing to the three SLS clubs is the Forster District as shown in "S94 Plan:
Forster District – Great Lakes 2013 Catchment Boundary" Amended Map in Section 14 - Appendices.
5.3 Effect of Development on Surf Life Saving Facilities
The need for Surf Life Saving Equipment has grown over the years, in direct proportion to increasing
patronage and also to greater community expectation of safety at major beaches. Council anticipates that
future residents will expect a life saving service equivalent at least to the present standard. The incoming
population will be similar in age structure and mobility to the existing population, and is therefore likely to
benefit from life saving services.
Council therefore expects that the incoming population will require a similar provision of surf life saving
services as the existing population. The increased demand on each Club caused by the incoming population
can be partly satisfied by extending the provision of capital equipment and facilities needed to provide surf
life saving services.
5.4 History of Surf Life Saving Plans in the Forster District
The first contributions plan for surf life saving facilities in the Forster District commenced on 11 July 2002.
The Plan was based on the following information:
Existing Major Capital Equipment
Facility Forster Cape Pacific
Hawke Palms
IRBs 3 4 2
Rescue PWC 0 0 0
Rescue Vehicles 1 1 1
Forecast needs to 2011
Facility Forster Cape Pacific
Hawke Palms
Admin Equipment (bundle) 3 2 3
Add’l IRB 1 1 1
Rescue PWC 1 1 1
Add’l 4 x 4 Rescue Vehicles 1 1 1
Forster and Cape Hawke SLSCs
2002 plan 2006 revision
Total Cost $126,000 $142,000
Population at 2001 18,500 18,522
Est pop Dec 2005 20,190
Population at 2011 22,800 22,023
Population increase 4,300 2,733
Contribution rate per person $29.30 $26.39
Great Lakes Council - Adopted 28 October 2014
Page 14 of 42FORSTER DISTRICT
S94 CONTRIBUTIONS PLAN
Pacific Palms SLSC
2002 plan 2006 revision
Total Cost $65,000 $74,000
Population at 2001 2,100 2,440
Est pop Dec 2005 2,966
Population at 2011 3,000 3,418
Population increase 900 452
Contribution rate per person $72.22 $110.72
At 30/6/2008, no purchases had been made and the status of the accounts was as follows:
Forster and Cape Hawke - amount collected including interest earned $53,540
Pacific Palms- amount collected including interest earned $27,483
Total available $81,023
5.5 Surf Life Saving Facilities Program and Contribution Rates
This revision of the plan aims to extend the catchment to the whole district, extend the program to 2041 and
apply a single contribution rate to meet the needs of all three clubs.
Existing equipment in the 3 clubs has an estimated replacement value of $400,000 and includes the
following items:
Facility Existing Number
Forster Cape Hawke Pacific Palms
IRB, complete 2 4 4
Jet Ski 2 1
4WD 1 1 1
Rhino (ATV) 1 1
Tractor 1
As the district population, and the workload of the clubs, are expected to increase by 50% during the life of
the plan, an allowance is made for $200,000 of additional purchases. The actual items to be purchased will
depend on available equipment and needs at the time.
In addition to the capital equipment requirement, some enhancement of facilities will be required as follows:
New club building at Forster (part cost) $800,000
Extension to building at Cape Hawke $300,000
Site improvement at Pacific Palms $100,000
Total $1,200,000
Contributions are calculated as follows:
Equipment $200,000
Buildings $1,200,000
Total $1,400,000
Amount collected -$81,023
Contributions required $1,318,977
Estimated contributing population (see chapter 2) 18,497
Contribution rate per person $69.61
The above rate is applicable to the year 2009-10 (using CPI = 92.4/166.0).
The rate will be indexed on each 1 July thereafter in accordance with the change in the CPI for the year to
the previous December quarter. The CPI is the All Groups Consumer Price Index, weighted average of 8
capital cities.
Great Lakes Council - Adopted 28 October 2014
Page 15 of 42FORSTER DISTRICT
S94 CONTRIBUTIONS PLAN
The CPI value for December quarter 2012 is 102.0 thereby giving the following contribution rates per
person for 2013-14: $76.84.
6 South Forster Drainage Plan
6.1 Purpose of the South Forster Drainage Plan
This plan aims to fund major drainage works in South Forster.
6.2 Land to which the South Forster Drainage Plan applies
This plan applies only to developments whose stormwater drains into the South Forster catchments shown in
"S94 Plan: Forster District - Stormwater Catchment Great Lakes 2013 Catchment Boundary” Map in
Section 14 - Appendices.
6.3 Effect of Development on South Forster Drainage
As development occurs in the catchment, with the resultant increase in impervious areas, the natural
drainage system is placed under stress. Accordingly the need for remedial works is in proportion to the land
areas developed.
6.4 History of the South Forster Drainage Plan
Town of Forster Plan – account 929 – adopted 4/5/94 and South Forster Plan – account 925 – adopted
4/5/94 were based on the GHD drainage strategy report presented to Council on 28 July 1992.
The schedule of works using estimates by GHD was as follows:
adopted Indexed
GHD Adopted developable Contribution contribution contribution
estimate works area (ha) $/ha $/ha 2005-06
Northern Catchment K leg
K1 Ponds 204000
K2 Ponds 414000
GPTs (3) 110000
channel 1150m 280000
culverts (4) 270000
Estimated land cost 70000
Total cost K leg $1,348,000 $1,348,000 50 $26,960 $26,858 $29,019
Northern Catchment L leg
L1 Pond 700800
GPTs (1) 100000
channels 1400m 1015000
culverts (1) 410000
Estimated land cost 58000
Total cost L leg $2,283,800 $2,283,000 85 $26,859 $26,858 $29,019
Central Catchment
Upstream retarding basin 295920
Downstream control pond 1716000
GPTs (2) 280000
channels 3600m 2036200
culverts (7) 741900
land cost 921000
Total Central Catchment $5,991,020 $6,063,000 155 $39,116 $39,116 $42,310
Southern Catchment
channels 1520400
land cost 22500
Total Southern Catchment $1,542,900 $854,500 35 $24,414 $24,414 $25,357
Present situation
At present drainage works and development are substantially complete in the Northern Catchment “K Leg.”
Great Lakes Council - Adopted 28 October 2014
Page 16 of 42FORSTER DISTRICT
S94 CONTRIBUTIONS PLAN
Contributions collected including interest (excluding non-cash contributions) $1,187,055
Amount spent (Keylim, Lulbrunt, Davglade) $ 607,647
Amount held in fund $ 579,408
6.5 Revised South Forster Drainage Program and Contribution Rates
Northern Catchment
The work required consists of:
(a) completion of K leg works comprised of:
Water Quality Treatment System $115,000
Channel Widening Downstream of $150,000
Southern Parkway
$265,000
(b) elements of the recommendations in “Review of Stormwater Management Strategy for L Leg Catchment
South Forster” by WBM Pty Ltd and dated 13-09-06.
Costs of the adopted elements are as follows (WBM Table 5-1):
3.9ha wetland $1,773,000
Pond A $391,000
Golden Pond upgrade $210,000
GPTs $86,000
Total $2,460,000
Central and Southern Catchments
Council no longer proposes to levy contributions for major drainage in these two catchments. Each
development will need to provide its own facilities to ensure unaltered volumes and quality of discharge.
Calculation of Rates Northern Catchment
Estimated cost of works $2,725,000
Estimated land cost $500,000
Less amount held -$579,408
Contributions required $2,645,592
Estimated population in 33ha new 990
development
Estimated population increase from 60
redevelopment
Total contributing population 1,050
Contribution rate per person $2,519.61
The above rate is applicable to the year 2009-10 (using CPI = 92.4/166.0).
The rate will be indexed on each 1 July thereafter in accordance with the change in the CPI for the year to
the previous December quarter. The CPI is the All Groups Consumer Price Index, weighted average of 8
capital cities.
The CPI value for December quarter 2012 is 102.0 thereby giving the following contribution rates per
person for 2013-14: $2,781.39.
Great Lakes Council - Adopted 28 October 2014
Page 17 of 42FORSTER DISTRICT
S94 CONTRIBUTIONS PLAN
7 Forster District Library Plan
7.1 Purpose of Plan
This plan aims to provide funding for the expansion of library facilities in the Forster District to meet the
additional demand of the population growth to the estimated capacity development of the district.
7.2 Land to which plan applies
The library facilities are patronised by residents in the Forster District, being the area shown on "S94 Plan:
Forster District – Great Lakes 2013 Catchment Boundary" Amended Map in Section 14 - Appendices.
Contributions will be payable for any residential development.
7.3 Effect of Development on Library Facilities
The NSW State Library sets the standards for libraries in New South Wales. Floor space requirements are
calculated using a recommended Bookstock rate of 2 items per capita. Therefore the library facilities needed
will increase in proportion to the population served. Consequently it is intended that all residential
development will be liable for contributions.
7.4 History of Forster Library Plans
The Forster Library section 94 plan commenced on 6 January 2000 and was included in the “Great Lakes
Wide” plan. It aimed to collect $2,419,633 being the amount needed for expansion of the library from its
present 770 sq m to the calculated 2016 requirement of 1,428 sq m.
The plan was revised in 2006 to fund, over a longer period, the Forster District Library facilities required for
the assessed ultimate population of the catchment.
There have been no firm decisions on forward planning since the 2006 plan. Therefore this new revision
maintains the 2006 plan, but adjusts cost estimates. The contribution rate is virtually unchanged.
7.5 Proposed Extension of Facilities
7.5.1 Floor Areas
The existing floor area in the Forster Library is 770 sq m.
Using the State Library formulas for floor space requirements, the growth in library facilities is calculated in
the following table:
year 2006 2041 approx
Resident population 25500 45030
bookstock per capita 2 2
bookstock 51000 90060
number number
number of on items per sq metres number of on items per sq metres
items shelves sq metre reqd items shelves sq metre reqd
per cent of bookstock (70%) (70%)
books 85% 43350 30345 100 303 76550 53590 100 536
magazines 5% 2550 1785 110 16 4500 3150 110 32
non-print 10% 5100 3570 100 36 9010 6310 100 63
terminals 14 14 0.2 70 25 25 0.2 125
Net Bookstock Area (sq m) 425 756
Great Lakes Council - Adopted 28 October 2014
Page 18 of 42FORSTER DISTRICT
S94 CONTRIBUTIONS PLAN
Relative Area Factors
Collection 100% 100%
Study 15% 15%
Browsing 5% 5%
Catalogues 10% 10%
Service Desk 15% 15%
Staff Work area 15% 15%
Storage Areas 5% 5%
Foyer 10% 10%
Toilets 5% 5%
Plant and Equipment 5% 5%
Children's Story Telling 5% 10%
Young Adult Area 5% 10%
Central Work Area 5% 5%
Central Community Office 5% 5%
Meeting Room 10%
Local History Collection 15%
Audio Visual Collection 20%
Coffee 10%
Vending 5%
Total RAF (B) 205% 275%
Floor space reqd (A x B) 870 2080
Note: In the above table certain additional features are included that are not presently in the library facility
but are considered necessary for the larger population, as follows:
Provision of a Meeting Room
Council would, in the future, seek to provide a meeting room where people congregate or study individually
in privacy. After hours access could be provided and would benefit the Great Lakes community.
Genealogy/Local History Collection
The Great Lakes Library Service houses a Genealogical collection but shelf and equipment space is limited.
As the population increases, there is a need to accommodate more genealogical material and a grater range
of technological access. This expanded service should be provided in a room dedicated to genealogical
resources. It would be integrated with a developing local history collection.
Multipurpose Training and Audiovisual Room
As the population grows, provision should be made for a separate room where training can be conducted.
This training could cover a wide range of subject areas. It may be conducted by Library staff or members of
the public who are experts in the training topic. Technology, include Internet access, should be an integral
part of this room.
Coffee Facility
Increasingly modern libraries provide some form of access to food and drinks. This requires dedicated
space to do so. This has been incorporated into the new facility.
7.5.2 Options
There are five options for increasing the floor area from 770 sq m to 2080 sq m.
1. Expand the present Forster library to say 1500 sq m (adequate to 2021) then develop a branch library of
580 sq m in the district.
2. On a new site, build a library of say 1500 sq m and develop the existing building as a branch library.
3. Expand the present Forster library to 2080 sq m.
Great Lakes Council - Adopted 28 October 2014
Page 19 of 42FORSTER DISTRICT
S94 CONTRIBUTIONS PLAN
In the event of the existing library building being required for Council office building expansion:
4. On a new site, build a library of say 1500 sq m receive a credit to the library fund on the sale of the
existing 770 sq m building and then develop a branch library on a new site of 580 sq m.
5. On a new site, build a library of 2080 sq m, receive a credit to the library fund on the sale of the existing
770 sq m building.
7.5.3 Costs
When an option has been decided, a detailed estimate will be done. For the purposes of this plan the
estimated cost of option 1 is used, which at 2008 is as follows:
Extensions to Forster Library $3,400,000
Purchase land for branch library $600,000
Construct Branch Library $2,500,000
Loan Costs. Assume 20yr loan of $5.8m, $2,230,000
8% interest rate, 4% discount rate
Total Cost $6,500,000
7.6 Derivation of contribution rates
Capital Cost (2008 values) $8,730,000
Grants -$200,000
Amount collected to 30/6/2008 -$555,275
Future contributions required $7,974,725
Estimated contributing population (see chapter 2) 18,497
Contribution rate per person $431.14
The above rate is applicable to the year 2009-10 (using CPI = 92.4/166.0).
The rate will be indexed on each 1 July thereafter in accordance with the change in the CPI for the year to
the previous December quarter. The CPI is the All Groups Consumer Price Index, weighted average of 8
capital cities.
The CPI value for December quarter 2012 is 102.0 thereby giving the following contribution rates per
person for 2013-14: $475.93.
8 Forster District Open Space Plan
8.1 Purpose of the Forster District Open Space Plan
This plan is to enable funding for improvements to Forster District open space facilities so that, as further
development and consequent increases in demand for facilities occur, Council will be in a position to fund
the necessary work.
8.2 Land to which the Forster District Open Space Plan Applies
This plan applies to residential development in the whole of the Forster District as shown on "S94 Plan:
Forster District – Great Lakes 2013 Catchment Boundary" Amended Map in Section 14 - Appendices.
Great Lakes Council - Adopted 28 October 2014
Page 20 of 42You can also read


