Report on Hansen Bailey - www.ageconsultants.com.au ABN 64 080 238 642
←
→
Page content transcription
If your browser does not render page correctly, please read the page content below
Report on

Underground Water Impact Report
       Ironbark No.1 Mine

                     Prepared for
                    Hansen Bailey

            Project No. G1915F March 2019
     www.ageconsultants.com.au ABN 64 080 238 642
Document details and history

                                                  Document details
                Project      G1915F
        numberG1915
        Document   title     Underground Water Impact Report Ironbark No.1 Mine
          Site address
             File name       G1915F_UWIR_v01.02.docx

                                           Document status and review

  Edition                     Comments                   Author          Authorised by                Date
  v01.01                           Draft                  DWI                 JST                 14/03/2019
  v01.02                           Final                  DWI                 JST                 21/03/2019

 This document is and remains the property of AGE, and may only be used for the purpose for which it was
 commissioned and in accordance with the Terms of Engagement for the commission. Unauthorised use of
 this document in any form whatsoever is prohibited.

                                      Australasian Groundwater and Environmental Consultants Pty Ltd

AGE Head Office                            AGE Newcastle Office                AGE Townsville Office
Level 2 / 15 Mallon Street,                4 Hudson Street                     Unit 3, Building A, 10 Cummins Street
Bowen Hills, QLD 4006, Australia           Hamilton, NSW 2303, Australia       Hyde Park, QLD 4812, Australia
T. +61 7 3257 2055                         T. +61 2 4962 2091                  T. +61 7 4413 2020
F. +61 7 3257 2088                         F. +61 2 4962 2096                  F. +61 7 3257 2088
brisbane@ageconsultants.com.au             newcastle@ageconsultants.com.au     townsville@ageconsultants.com.au
Table of contents

                                                                                                                                                                                     Page No.

Document details and history ................................................................................................................................................. i

1         Introduction...................................................................................................................................................................... 1
          1.1              Mine Overview and Setting ...................................................................................................................... 1
          1.2              Background .................................................................................................................................................... 2
          1.3              UWIR Scope and Structure....................................................................................................................... 2

2         Regulatory Requirements ........................................................................................................................................... 4

3         Assessment Methodology ........................................................................................................................................... 6
          3.1              Desktop Study ............................................................................................................................................... 7
          3.1.1            Database and Government Mapping Reviews for Water Bores ...................................................... 7
          3.1.2            Database and Government Mapping Reviews for Sensitive Environmental Features ......... 7
          3.1.3            Previous Groundwater Studies ....................................................................................................................... 8
          3.1.4            Review of Groundwater Monitoring Data ................................................................................................. 8
          3.1.5            Fitzroy groundwater monitoring network ............................................................................................... 8
          3.2              Numerical Modelling ............................................................................................................................... 10

4         Groundwater regime .................................................................................................................................................. 12
          4.1              Overview ...................................................................................................................................................... 12
          4.2              Alluvium ....................................................................................................................................................... 13
          4.2.1            Distribution .......................................................................................................................................................... 13
          4.2.2            Hydrogeological parameters ....................................................................................................................... 13
          4.2.3            Recharge, flow, and discharge ..................................................................................................................... 13
          4.2.4            Groundwater quality........................................................................................................................................ 13
          4.2.5            Groundwater yields and use ......................................................................................................................... 14
          4.3              Tertiary Sediments................................................................................................................................... 14
          4.3.1            Distribution .......................................................................................................................................................... 14
          4.3.2            Hydrogeological parameters ....................................................................................................................... 14
          4.3.3            Recharge, flow, and discharge ..................................................................................................................... 14
          4.3.4            Groundwater quality........................................................................................................................................ 14
          4.3.5            Groundwater yields and use ......................................................................................................................... 14
          4.4              Rewan Group .............................................................................................................................................. 14
          4.4.1            Distribution .......................................................................................................................................................... 14
          4.4.2            Hydrogeological parameters ....................................................................................................................... 15
          4.4.3            Recharge, flow, and discharge ..................................................................................................................... 15
          4.4.4            Groundwater quality........................................................................................................................................ 15
          4.4.5            Groundwater yields and use ......................................................................................................................... 15
          4.5              Permian Sediments .................................................................................................................................. 15
          4.5.1            Distribution .......................................................................................................................................................... 15
          4.5.2            Hydrogeological parameters ....................................................................................................................... 16
          4.5.3            Recharge, flow, and discharge ..................................................................................................................... 16
          4.5.4            Groundwater quality........................................................................................................................................ 16

                                                                                Australasian Groundwater and Environmental Consultants Pty Ltd
                                                                     Underground Water Impact Report for Ironbark No.1 Mine - v01.02 (G1915F) | i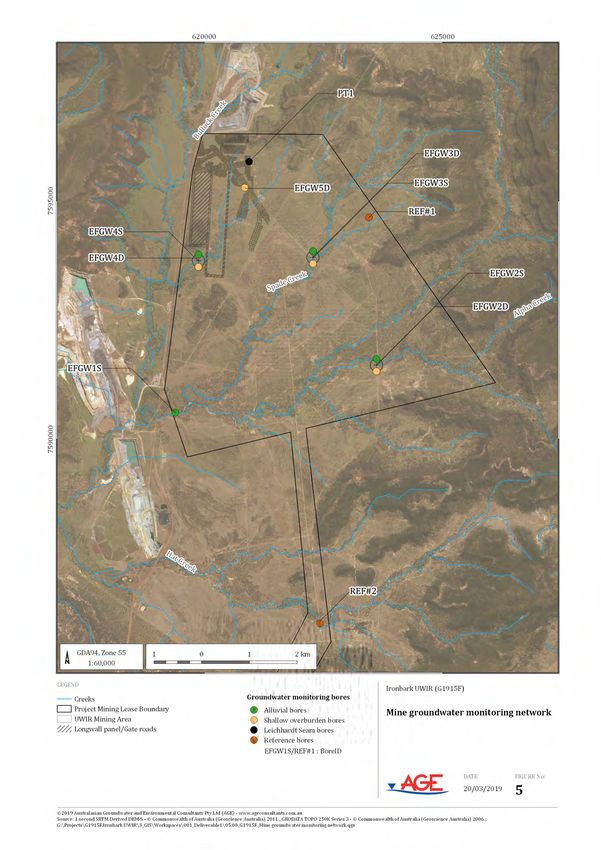
Table of contents
                                                                          (continued)

                                                                                                                                                                                Page No

    4.5.5            Groundwater yields and use ......................................................................................................................... 16

5   Groundwater Impact Assessment ........................................................................................................................ 17
    5.1              Introduction ................................................................................................................................................ 17
    5.2              Groundwater take..................................................................................................................................... 17
    5.3              Groundwater drawdown during the UWIR Period..................................................................... 18
    5.4              Groundwater drawdown over the mine life .................................................................................. 18
    5.5              Environmental Impacts .......................................................................................................................... 18
    5.5.1            Impacts on Groundwater Resources ......................................................................................................... 18
    5.5.2            Impacts on Groundwater Users................................................................................................................... 19
    5.5.3            Impacts on Surface Drainage....................................................................................................................... 20
    5.5.4            Impacts on Springs............................................................................................................................................ 20
    5.5.5            Impacts on Groundwater Dependent Ecosystems .............................................................................. 20
    5.5.6            Impacts on Groundwater Quality............................................................................................................... 21

6   Groundwater Monitoring Program ...................................................................................................................... 22

7   UWIR Review and Updates ...................................................................................................................................... 23
    7.1              Roles and Responsibilities .................................................................................................................... 23
    7.2              Review and Revision ............................................................................................................................... 23
    7.3              Reporting and Record Keeping ........................................................................................................... 23

8   Conclusions .................................................................................................................................................................... 24

9   References ...................................................................................................................................................................... 25

B   Numerical Modelling ..................................................................................................................................................... 1
    B.1              Model code...................................................................................................................................................... 1
    B.2              Model domain................................................................................................................................................ 1
    B.3              Model boundary conditions .................................................................................................................... 2
    B.4              Recharge and evapotranspiration ........................................................................................................ 2
    B.5              Rivers ................................................................................................................................................................ 2
    B.6              Mining progression ..................................................................................................................................... 2
    B.7              Hydraulic parameters ................................................................................................................................ 2
    B.8              Modelling results ......................................................................................................................................... 3
    B.9              Hydraulic heads ............................................................................................................................................ 3
    B.10             Water budgets ............................................................................................................................................... 3
    B.11             Model Setup for Impact Assessment.................................................................................................... 4
    B.12             Sensitivity ....................................................................................................................................................... 4

                                                                         Australasian Groundwater and Environmental Consultants Pty Ltd
                                                             Underground Water Impact Report for Ironbark No.1 Mine - v01.02 (G1915F) | ii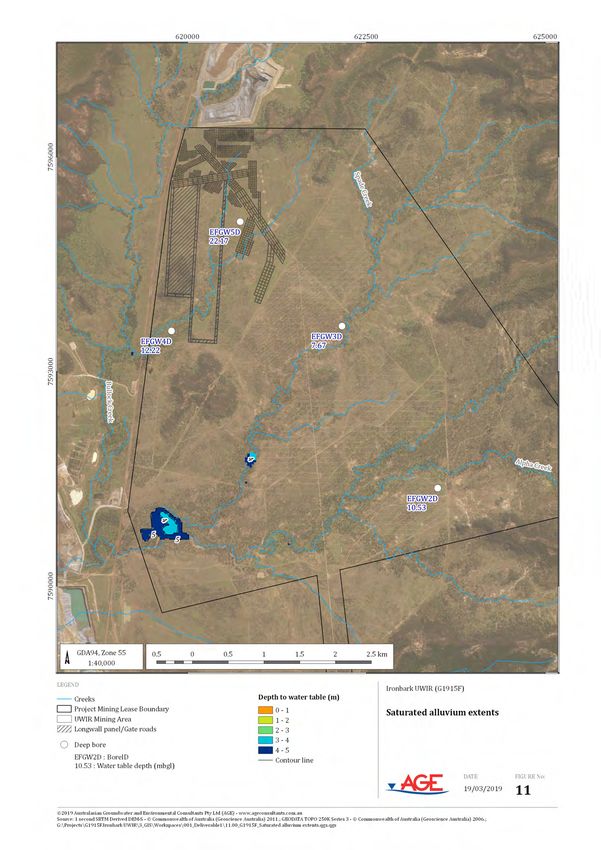
Table of contents
                                                                (continued)

                                                                                                                                                                 Page No

                                                               List of figures
Figure 1     Mine location and setting ...................................................................................................................... 26
Figure 2     Mine layout .................................................................................................................................................. 27
Figure 3     Topography and drainage ..................................................................................................................... 28
Figure 4     DNRM Registered bores ......................................................................................................................... 29
Figure 5     Mine groundwater monitoring network ......................................................................................... 30
Figure 6     Piper diagram ............................................................................................................................................. 31
Figure 7     Conceptual hydrogeological model ................................................................................................... 32
Figure 8     Interpreted depth to water table ....................................................................................................... 33
Figure 9     Interpolated groundwater contours ................................................................................................. 34
Figure 10    Surface geology .......................................................................................................................................... 35
Figure 11    Saturated alluvium extents ................................................................................................................... 36
Figure 12    Drainage line photographs in Project area .................................................................................... 37
Figure 13    Bowen Basin geology .............................................................................................................................. 38
Figure 14    Predicted Depressurisation in the Leichardt Seam at the end of UWIR Year 1 .............. 39
Figure 15    Predicted Depressurisation in the Leichardt Seam at the end of UWIR Year 2 .............. 40
Figure 16    Predicted Depressurisation in the Leichardt Seam at the end of UWIR Year 3 (IAA) .. 41
Figure 17    Predicted Depressurisation in the Leichardt Seam at the end of mining (LTAA) .......... 42

                                                                List of tables
Table 1      UWIR Content Requirements ................................................................................................................. 4
Table 2      UWIR Water Monitoring Strategy Content Requirements ......................................................... 6
Table 3      Groundwater bore details ........................................................................................................................ 9
Table 4      Salinity Classification Scale................................................................................................................... 10
Table 5      Predicted volume of groundwater take ........................................................................................... 17

                                                          List of appendices
Appendix A   Laboratory analysis results
Appendix B   Numerical modelling

                                                              Australasian Groundwater and Environmental Consultants Pty Ltd
                                                  Underground Water Impact Report for Ironbark No.1 Mine - v01.02 (G1915F) | iii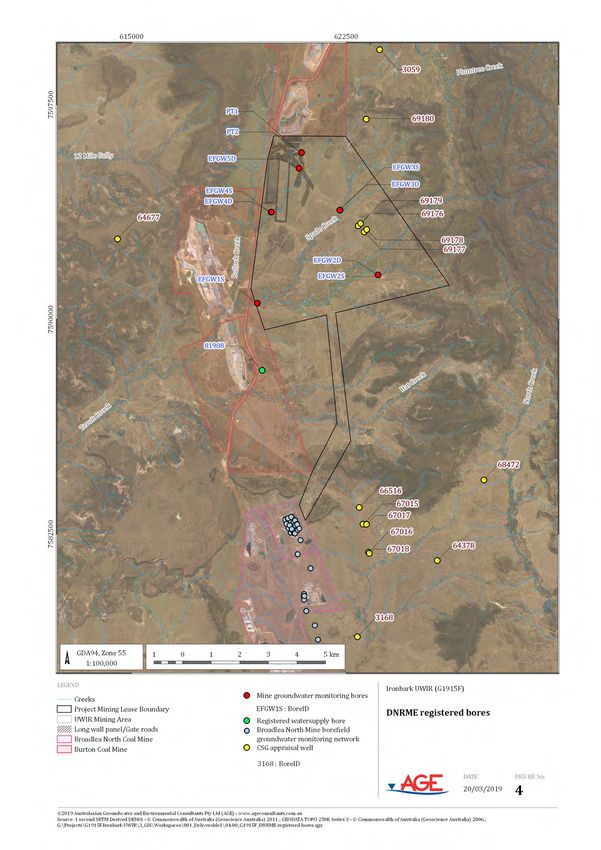
Report on

                        Underground Water Impact Report
                                    Ironbark No.1 Mine

1      Introduction
Australasian Groundwater and Environmental Consultants Pty Ltd (AGE) was commissioned by Hansen
Bailey on behalf of Fitzroy Australia Resources Pty Ltd (Fitzroy) to prepare an Underground Water
Impact Report (UWIR) for the Ironbark No.1 Mine (the mine).

This section provides an overview of the mine, explains the background to the UWIR and describes the
scope and structure of the UWIR.

1.1    Mine Overview and Setting
The project involves the development of an underground coal mine approximately 35 km north-east of
Moranbah Township (Figure 1). Fitzroy acquired the mine in November 2016 and obtained an
Environmental Authority (EA0001299) for the mine on 13 July 2018.

Construction of the mine is currently scheduled to commence in April 2019. The mine life will be
approximately 20 years.

The mine will produce up to approximately 6 Million tonnes per annum (Mtpa) of Run of Mine (ROM)
coal. Coal will be extracted from the Leichardt coal seam using longwall and bord and pillar mining
methods.

ROM coal will be hauled by truck to the existing Carborough Downs Coal Mine (CDCM) coal handling
and preparation plant (CHPP). Product coal will be loaded onto trains at the CDCM train loading facility
for transport to port, and exported to overseas markets.

The project site is located adjacent to the Burton open cut coal mine to the north and west, and the
Broadlea open cut coal mine to the south (Figure 1).

The topography of the mine site consists of low-lying gently undulating terrain generally of less than
2% gradient (Figure 3). Ephemeral drainage lines cross the site from east to west with the majority of
the project site located within the catchments of Bullock Creek, Spade Creek and Alpha Creek
(Figure 3).

The geology of the mine site comprises the Permian Rangal Coal Measures and overlying Triassic Rewan
Group sediments. These sediments outcrop at the surface or are overlain by Tertiary sediments.
Localised deposits of unconsolidated alluvium occur within the creek beds that traverse the mine site.

                                                 Australasian Groundwater and Environmental Consultants Pty Ltd
                                     Underground Water Impact Report for Ironbark No.1 Mine - v01.02 (G1915F) | 1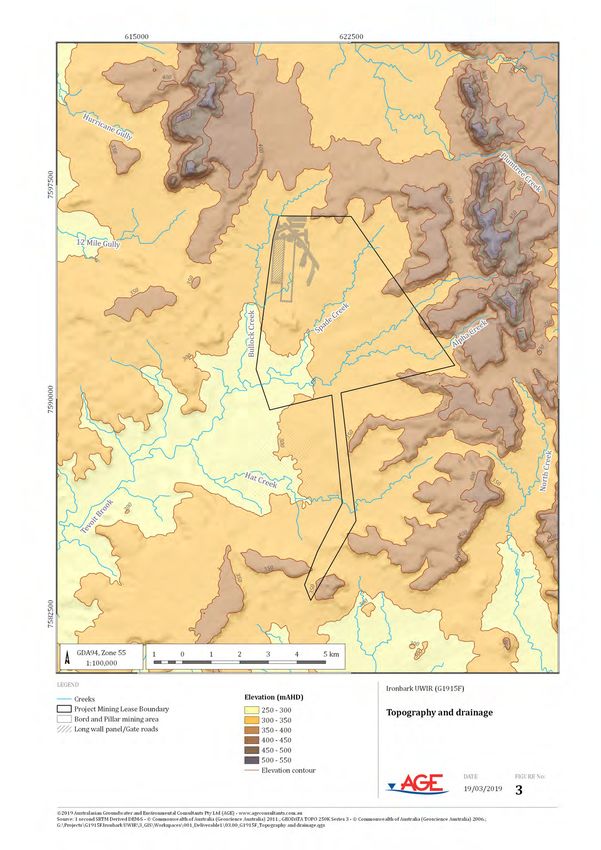
1.2    Background
Fitzroy acquired the Ironbark No.1 Project (the project) from Ellensfield Coal Management Pty Ltd,
a subsidiary of Vale, in November 2016. Prior to this time an Environmental Impact Statement (EIS) had
been prepared by Ellensfield Coal Management Pty Ltd, an EIS Assessment Report was issued in 2012
and the project approval process had subsequently been placed on hold by Vale. The EIS included
a groundwater impact assessment (discussed in Section 3.1.3).

Fitzroy recommenced the EA approval process in 2017 and obtained an EA for the project on
13 July 2018.

Fitzroy subsequently completed a feasibility assessment and detailed mine design in preparation for
the commencement of mine construction. The detailed design process resulted in minor changes to the
project. The proponent submitted an application for a minor EA amendment to address these changes.
The DES approved the minor EA amendment on 17 January 2019. The EA amendment application was
supported by a groundwater assessment (discussed in Section 3.1.3).

The current EA (EA0001299) therefore authorises the mining activities and the associated
groundwater impacts described in the EIS and subsequent EA amendment application. It was issued by
the Department of Environment and Science (DES) under the Environmental Protection Act 1994
(EP Act). The EA imposes environmental management conditions on mining activities undertaken on
the mine site. The EA conditions set the environmental performance requirements that the project must
comply with. Failure to comply with the EA conditions is a breach of the EA and there are various
compliance enforcement actions available to DES under the EP Act.

1.3    UWIR Scope and Structure
The UWIR is a requirement of the groundwater management framework legislated under Chapter 3 of
the Water Act 2000 (Water Act). The main purpose of the UWIR is to describe the groundwater take due
to mining (and any associated impacts) over a three year period (the UWIR period).

This UWIR addresses the initial three years of the project from the commencement of construction.
Construction is currently scheduled to commence on 1 April 2019. The planned mining activities during
this UWIR period include the construction of a single box cut in the north-west corner of the mine site
in the area where the coal seam is shallowest, and the extraction of coal from the longwall and bord and
pillar mining areas shown in Figure 2. The mine has not produced any groundwater or exercised its
rights to take groundwater prior to this UWIR period.

The UWIR has been prepared in accordance with Section 376 of the Water Act and the Department of
Environment and Science (DES) guideline Underground water impact reports and final reports
(the UWIR guideline), where relevant.

                                                 Australasian Groundwater and Environmental Consultants Pty Ltd
                                     Underground Water Impact Report for Ironbark No.1 Mine - v01.02 (G1915F) | 2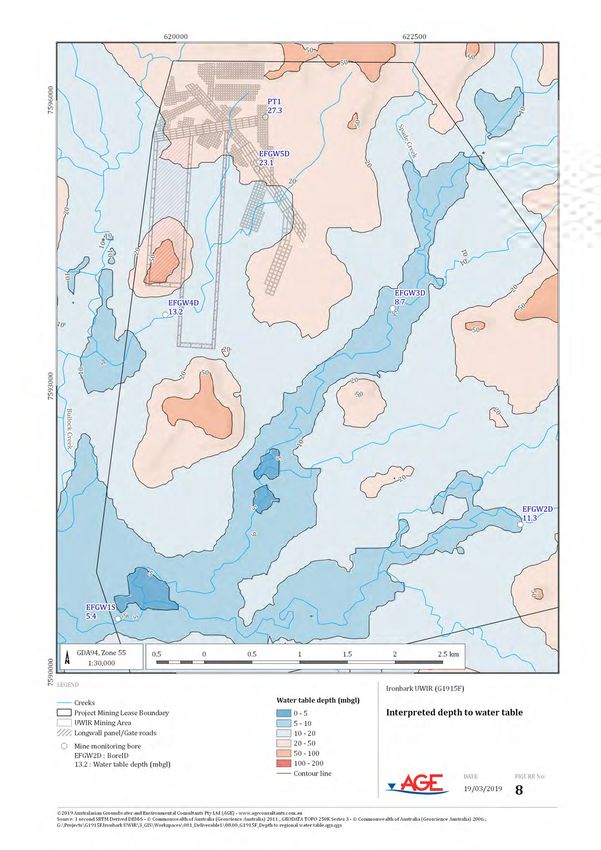
Consistent with the UWIR guideline, the information supplied in support of the EA approval process
under the EP Act has been used as the basis for the UWIR. Hence, the scope of work for the UWIR is
generally limited to a minor update of the existing approved groundwater assessments to allow
information specific to the UWIR period to be presented. The specific scope of the UWIR includes:
   •   A review of relevant groundwater, project development, geological and environmental reports
       from the mine site to develop an appreciation of the hydrogeological setting of the project;
   •   An updated review of hydrogeological data held on the Department of Natural Resources, Mines
       and Energy’s (DNRME’s) Groundwater Database to identify water supply bores;
   •   An updated census of water supply bores to confirm the extent of groundwater use in the area
       and collect relevant groundwater monitoring data;
   •   Confirmation of the conceptual model of the groundwater regime of the mine site and its
       surrounds, based on all available data;
   •   Refinement of the existing numerical groundwater model to allow the mining effects on
       groundwater levels to be presented for the first three years of mining only;
   •   Confirmation of the groundwater impacts over the first three years of mining;
   •   Confirmation of the existing approved EA groundwater monitoring program and management
       measures.

The UWIR includes:
   •   An introduction to the UWIR (Section 1);
   •   A description of the relevant regulatory UWIR requirements (Section 2);
   •   A description of the assessment method (Section 3);
   •   A description of the groundwater regime and sensitive environmental features (Section 4);
   •   An assessment of the mine’s groundwater impacts (Section 5);
   •   A description of the groundwater monitoring program (Section 6);
   •   A description of the process for reviewing and updating the UWIR (Section 7); and
   •   The key conclusions of the UWIR (Section 8).

                                                Australasian Groundwater and Environmental Consultants Pty Ltd
                                    Underground Water Impact Report for Ironbark No.1 Mine - v01.02 (G1915F) | 3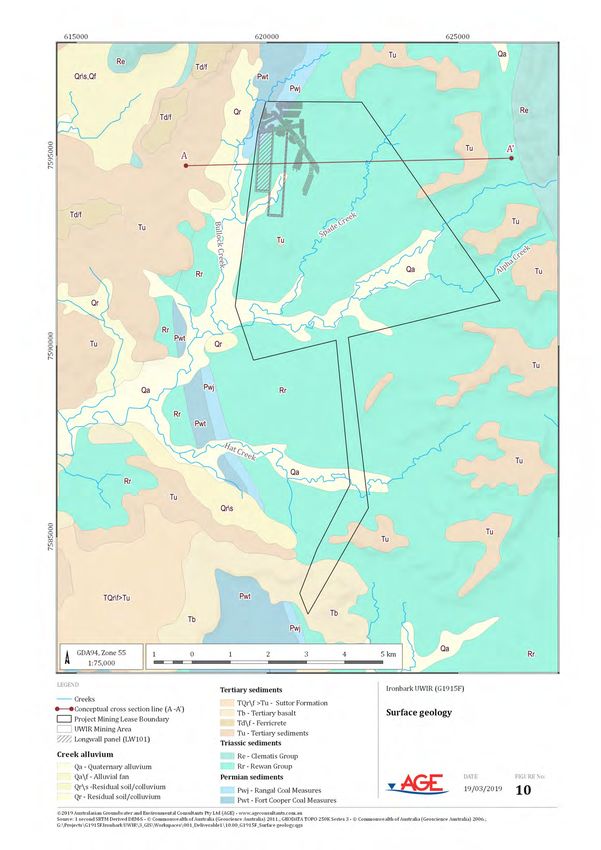
2        Regulatory Requirements
Section 376 of the Water Act specifies the UWIR content requirements. Table 1 lists the specific content
requirements and provides an explanation of where each requirement is addressed in this UWIR.

                            Table 1         UWIR Content Requirements
  Water Act
                             Water Act Section Content                           UWIR Cross Reference
 Section No.
                An underground water impact report must include
                each of the following—
                                                                           (i) No groundwater has been
                for the area to which the report relates—                  produced or taken from the
                    (i) the quantity of water produced or taken            mine site due to the exercise of
                         from the area because of the exercise of any      underground water rights to
    376(1)(a)
                         previous relevant underground water               date.
                         rights; and
                    (ii) an estimate of the quantity of water to be
                                                                           (ii) Section 5.2 describes the
                         produced or taken because of the exercise
                                                                           estimated groundwater take
                         of the relevant underground water rights
                                                                           over the UWIR period.
                         for a 3-year period starting on the
                         consultation day for the report;
                For each aquifer affected, or likely to be affected, by
                the exercise of the relevant underground water
                rights—
                    (i) a description of the aquifer; and
                                                                           (i) and (ii) Section 4.1 describes
                    (ii) an analysis of the movement of
                                                                           the groundwater regime in the
                         underground water to and from the aquifer,
                                                                           relevant aquifers.
                         including how the aquifer interacts with
                         other aquifers; and
                    (iii)an analysis of the trends in water level          (iii) There has been no previous
                         change for the aquifer because of the             exercise of underground water
                         exercise of the rights mentioned in               rights.

    376(1)(b)
                         paragraph (a)(i); and
                    (iv) a map showing the area of the aquifer             (iv) Figure 14 to Figure 16 show
                         where the water level is predicted to             the areas where
                         decline, because of the taking of the             depressurisation due to mining
                         quantities of water mentioned in paragraph        is predicted to exceed the bore
                         (a), by more than the bore trigger threshold      trigger threshold during the
                         within 3 years after the consultation day for     UWIR period.
                         the report; and
                    (v) a map showing the area of the aquifer              (v) Figure 17 shows the areas
                         where the water level is predicted to             where depressurisation due to
                         decline, because of the exercise of relevant      mining is predicted to exceed
                         underground water rights, by more than            the bore trigger threshold
                         the bore trigger threshold at any time;           during the life of the mine.
                A description of the methods and techniques used
                                                                           Section 0 describes the UWIR
    376(1)(c)   to obtain the information and predictions under
                                                                           methodology.
                paragraph (b);

                                                   Australasian Groundwater and Environmental Consultants Pty Ltd
                                       Underground Water Impact Report for Ironbark No.1 Mine - v01.02 (G1915F) | 4
Water Act
                           Water Act Section Content                          UWIR Cross Reference
Section No.
                                                                        Sections 3.1.1 and 5.5.2
              A summary of information about all water bores in
                                                                        describes the water bore census
              the area shown on a map mentioned in paragraph
                                                                        undertaken for the UWIR and
376(1)(d)     (b)(iv), including the number of bores, and the
                                                                        confirms that there are no
              location and authorised use or purpose of each
                                                                        water bores within the area of
              bore;
                                                                        predicted depressurisation.
                                                                        There has been no previous
              A description of the impacts on environmental
                                                                        exercise of underground water
              values that have occurred, or are likely to occur,
376(1)(da)                                                              rights and hence, no previous
              because of any previous exercise of underground
                                                                        groundwater impacts due to
              water rights;
                                                                        groundwater take.
              An assessment of the likely impacts on
              environmental values that will occur, or are likely
              to occur, because of the exercise of underground          Section 5.5 presents an
              water rights—                                             assessment of potential
376(1)(db)
                  (i) during the period mentioned in paragraph          groundwater impacts due to
                       (a)(ii); and                                     groundwater take.
                  (ii) over the projected life of the resource
                       tenure;
              A program for—
                  (i) conducting an annual review of the
                       accuracy of each map prepared under
                       paragraph (b)(iv) and (v); and                   Section 7.2 describes the UWIR
                  (ii) giving the chief executive a summary of the      review and reporting process
                       outcome of each review, including a              for the affected aquifers.
                       statement of whether there has been a
                       material change in the information or
                       predictions used to prepare the maps;
                                                                        Section 6 describes the
 376(1)(f)    A water monitoring strategy;                              groundwater monitoring
                                                                        program.
                                                                        There are no springs within the
                                                                        mine site or its surrounds.
376(1)(g)     A spring impact management strategy;
                                                                        Hence, a strategy for spring
                                                                        management is not justified.
              If the responsible entity is the office—
                       (i)     a proposed responsible tenure
                   holder for each report obligation mentioned in
                   the report; and
376(1)(h)              (ii)    for each immediately affected            Not applicable.
                   area—the proposed responsible tenure holder
                   or holders who must comply with any make
                   good obligations for water bores within the
                   immediately affected area;
                                                                        No other relevant information
              The information or matters prescribed under a
 376(1)(i)                                                              or matters have been
              regulation.
                                                                        prescribed under a regulation.

                                                Australasian Groundwater and Environmental Consultants Pty Ltd
                                    Underground Water Impact Report for Ironbark No.1 Mine - v01.02 (G1915F) | 5
Water Act
Water Act Section Content UWIR Cross Reference
Section No.
However, if the underground water impact report
does not show any predicted water level decline in
any area of an affected aquifer by more than the
Section 5.3 describes the UWIR
bore trigger threshold during the period
376(2) review and reporting process
mentioned in subsection (1)(b)(iv) or at any time
for the affected aquifers.
as mentioned in subsection (1)(b)(v), the report
does not have to include the program mentioned in
subsection (1)(e).
Section 378 of the Water Act lists the content requirements for the water monitoring strategy.
Table 2 lists the specific content requirements and provides an explanation of where each requirement
is addressed in this UWIR.
Table 2 UWIR Water Monitoring Strategy Content Requirements
Water Act
Water Act Section Content UWIR Cross Reference
Section No.
A responsible entity’s water monitoring strategy must
include the following for each immediately affected area
and long-term affected area identified in its underground
water impact report or final report—
(a) a strategy for monitoring—
(i) the quantity of water produced or taken from the
area because of the exercise of relevant
Section 6 describes the
378(1) underground water rights; and
groundwater monitoring program.
(ii) changes in the water level of, and the quality of
water in, aquifers in the area because of the
exercise of the rights;
(b) the rationale for the strategy;
(c) a timetable for implementing the strategy;
(d) a program for reporting to the office about the
implementation of the strategy.
The strategy for monitoring mentioned in subsection
(1)(a) must include—
Section 6 describes the
378(2) (a) the parameters to be measured; and
groundwater monitoring program.
(b) the locations for taking the measurements; and
(c) the frequency of the measurements
If the strategy is prepared for an underground water
impact report, the strategy must also include a program Not applicable. Sections 3.1.1 and
for the responsible tenure holder or holders under the 5.5.2 describes the water bore
report to undertake a baseline assessment for each census undertaken for the UWIR
378(3) water bore that is— and confirms that there are no
(a) outside the area of a resource tenure; but water bores within the area of
(b) within the area shown on the map prepared under predicted depressurisation.
section 376(b)(v).
If the strategy is prepared for a final report, the strategy
378(4) must also include a statement about any matters under a Not applicable.
previous strategy that have not yet been complied with.
Australasian Groundwater and Environmental Consultants Pty Ltd
Underground Water Impact Report for Ironbark No.1 Mine - v01.02 (G1915F) | 63 Assessment Methodology
This section describes the methodology adopted for the collection of hydrogeological data to inform the
UWIR.
3.1 Desktop Study
3.1.1 Database and Government Mapping Reviews for Water Bores
A search of relevant Queensland databases was undertaken to identify the presence of current water
bores within and surrounding the mine. A water bore is a groundwater supply bore.
The following databases and mapping were searched:
• The DNRME Groundwater Database of registered water bore data from private water bores and
Queensland Government groundwater investigation and monitoring bores. Data accessed
includes bore location, groundwater levels, construction details, stratigraphic logs,
hydrogeological testing and groundwater quality.
• The Queensland Spatial Catalogue (QSpatial), via Queensland Globe. Records of petroleum and
coal seam gas (CSG) exploration, production and monitoring wells are contained within this
database.
These searches identified 46 registered groundwater bores within 5 km of the project mining area
(Figure 4). Bore installation records available for these bores identify:
• 10 are the mine groundwater monitoring bores;
• One “water supply” bore (RN81908) located on the Burton Mine site which intersects “salty”
water with bore casing into the Rewan Group. This bore was identified in the 2008 groundwater
impact assessment (AGE, 2008) which concluded that there was no reliance on groundwater for
stock watering; and
• 35 are Broadlea North Mine bores and include monitoring bores and water supply bores.
Fitzroy is the owner of Broadlea Mine.
There are 15 records of CSG exploration and appraisal wells installed around the mine area, all of which
are not operational and identified as “suspended/capped/shut-in” or “plugged and abandoned”.
The location of these CSG bores are shown in Figure 4.
3.1.2 Database and Government Mapping Reviews for Sensitive Environmental Features
The potential for groundwater dependent ecosystems (GDEs) to be present within the project site was
reviewed, with the review consisting of:
• A search of the Queensland Springs Database;
• A search of the Bureau of Meteorology’s (BoM) GDE Atlas;
• Groundwater field investigations; and
• A desktop review of groundwater monitoring data and modelling results.
The Queensland Springs Database indicated that no spring wetlands are located within the project site
or its surrounds.
The BoM GDE mapping indicates several potential GDEs in the project site, namely:
Australasian Groundwater and Environmental Consultants Pty Ltd
Underground Water Impact Report for Ironbark No.1 Mine - v01.02 (G1915F) | 7• Terrestrial vegetation along the northern and eastern extents of the mining lease which are
mapped as low to moderate potential GDEs;
• Terrestrial vegetation along Alpha Creek and to a lesser extent Bullock Creek which are mapped
as low to moderate potential GDEs; and
• Aquatic wetland/riverine habitat within watercourses associated with Bullock, Spade and
Alpha Creeks that are mapped as high potential GDEs.
A desktop review of the spring inventories has been undertaken using the springs database within the
GDE Atlas (Queensland Wetland Data – Springs). The nearest mapped spring is located approximately
130 km northeast of the project site. No springs have been identified with 10 km of the project site.
This is consistent with field observations from the creeks which show that there are no perennial pools
associated with creeks traversing the project site and its surrounds. On the basis, springs are extremely
unlikely to be affected by the project mining activities. Hence, there is no technical justification for
a spring management strategy.
3.1.3 Previous Groundwater Studies
The hydrogeology of the Ironbark site was first assessed by AGE as part of feasibility studies and
approvals for the former owner of the project (Vale). This assessment included a field program to
investigate the local hydrogeology and numerical modelling to assess the project impacts. Monitoring
bores were installed adjacent to the ephemeral drainages that traverse the mining lease and indicated
an alluvial aquifer does not occur on the project site, with groundwater occurring within the weathered
zone of the underlying Rewan Group. Laboratory analyses indicated the groundwater was brackish to
saline limiting the beneficial use of the water. No usage of groundwater was identified.
In 2012, additional investigation of groundwater was undertaken by URS. This work included installing
two bores and conducting pumping tests to measure yields and estimate hydraulic properties of the
Leichardt Seam. This work indicated the Leichardt Seam forms a low yielding groundwater system
confined by the overlying Permian overburden and Triassic Rewan Group. Further groundwater
modelling provided refined estimates of groundwater take to the project during operations.
In 2018, additional groundwater investigations were undertaken in response to queries from the DES.
This work included measuring groundwater levels, collecting water samples and further groundwater
modelling. The fieldwork confirmed previous conclusions that groundwater occurred primarily within
the weathered bedrock and was brackish to saline. As part of this work, the numerical model was
recalibrated and updated to ensure it represented the influence of subsidence induced fracturing as
accurately as possible. This included utilising an empirical method to estimate the height of the fracture
network above longwall mining areas. The updated numerical model predicted a reduced seepage rate
of groundwater into the mining areas. Updated maps indicating the zone of depressurisation within the
coal seam and shallow overburden were developed as part of this work.
3.1.4 Review of Groundwater Monitoring Data
All relevant data was collated and analysed to develop a conceptual understanding of the groundwater
regime. Groundwater data collected from the mine monitoring bores has been used to inform this
groundwater conceptualisation.
3.1.5 Fitzroy groundwater monitoring network
The groundwater monitoring network for the project site originally comprised eight narrow diameter
bores at five sites (EFGW series) and two test pumping bores (PT series). Four bores are screened
within the alluvium, four within the Triassic Rewan Group and one in the Leichhardt Seam.
Fitzroy recently installed two reference bores (Ref Bore #1 and Ref Bore #2) in October 2018. Ref Bore
#1 targets the shallow overburden and Ref Bore #2 targets the alluvium. Table 3 summarises the
bore construction details with Figure 5 showing the location of the monitoring bores at the project site.
Australasian Groundwater and Environmental Consultants Pty Ltd
Underground Water Impact Report for Ironbark No.1 Mine - v01.02 (G1915F) | 8Table 3 Groundwater bore details
Ground Screen
Screened Bore depth
Bore ID Elevation interval
stratigraphy (mbGL)
(mAHD) Ground (mbGL)
EFGW1S Alluvium 288 8.7 - 11.7 11.7
EFGW2S Alluvium 323 1.9 - 4.9 4.9
EFGW2D Overburden sediments 326 25.6 - 28.6 25.6
EFGW3S Alluvium 310 1.2 - 4.2 4.2
EFGW3D Overburden sediments 310 27.4 - 30.4 30.4
EFGW4S Alluvium 302 1.5 - 4.5 4.5
EFGW4D Overburden sediments 305 37.5 - 40.5 40.5
EFGW5D Overburden sediments 325 56 - 59 59.1
PT1 Leichardt Seam * 126 - 138 138
Ref Bore
Overburden sediments * 41 – 47 50
#1
Ref Bore
Alluvium * 18 - 24 30
#2
Notes: Coordinates are GDA 94 zone 55 – note the site historically used ADG84 and coordinates in previous reports have used
this datum
* No elevation recorded
Spatially distributed groundwater level data were used to characterise groundwater flow directions,
gradients and velocities. In addition, time variant variations in groundwater level were used to interpret
the rate and distribution of recharge/discharge, depressurisation influence from mining, and
pre-development variability in groundwater level.
Groundwater quality data provides useful information on the hydrogeological regime, as it is influenced
by interaction with the aquifer matrix, and groundwater recharge/discharge processes.
Salinity is a key constraint to the usability of groundwater resources for productive applications such
as potable supply, irrigation, stock watering and industrial applications. If waters with elevated salinity
levels are used for incompatible purposes or applications it may result in impacts to agricultural
productivity, health and the environment.
A categorisation scheme for salinity proposed by FAO (2013) is presented in Table 4.
Groundwater salinity in each project monitoring bore sampled during the field campaign has been
categorised using these criteria. DNRME bores within 5 km of the project mining area with available
groundwater quality data were also categorised.
There are no records indicating that ‘fresh’ groundwater has been encountered near the project site.
Australasian Groundwater and Environmental Consultants Pty Ltd
Underground Water Impact Report for Ironbark No.1 Mine - v01.02 (G1915F) | 9Table 4 Salinity Classification Scale
# project bores
# DNRME-registered bores within
Range with
Salinity 5 km with corresponding salinity
(TDS mg/l) corresponding
data
salinity
Fresh 35,000 0 0
Total 7 27
Major ion data for water quality data collected to date from the project monitoring bores are
summarised on a Piper plot (Figure 6) which categorises water type based on the normalised, relative
proportion of each major cation and anion. The data shows minimal variation the groundwater quality
within the project area which can be classified as sodium-chloride type water. The piper diagram is
based on the relative proportions of the major cations and anions. The results of the groundwater
quality data collated for the project are summarised in Appendix A.
3.2 Numerical Modelling
The mine has an existing 3D numerical groundwater model that was developed as part of the previous
groundwater impact assessments described in Section 3.1.3. The groundwater model results have been
used to support the EA application and subsequent EA amendment.
The groundwater model has also been used to inform the UWIR. The model has specifically been used
to predict groundwater take and resulting groundwater depressurisation. These predictions have been
used to identify Immediately Affected Areas (IAA) and Long Term Affected Areas (LTAA) and assess the
impacts of the project on groundwater users and the surrounding environment.
To increase the accuracy of the UWIR, the model was updated to incorporate additional details of the
mine layout over the first 3 years of mining (as shown in Figure 2). No other changes to the existing
groundwater model have been made as part of the UWIR.
The key aspects of the model are detailed as follows:
• The numerical groundwater model was developed from the collated dataset
(described in Sections 4.2 to 4.5) using MODFLOW software and represents the conceptual
groundwater regime described in Section 4.1.
• The model represents the key geological units using 23 model layers and extends 35 km
north-south and 27 km east west. The project mining area was located in the centre of the model
domain.
• Model development was supplemented by published geological maps, digital geology surfaces
and information from mining operations near the project mining area and data from the DNRME
groundwater database.
Australasian Groundwater and Environmental Consultants Pty Ltd
Underground Water Impact Report for Ironbark No.1 Mine - v01.02 (G1915F) | 10• The Australian Groundwater Modelling Guidelines (Barnett et al., 2012) were used to frame the
calibration process. A detailed description of the calibration method is provided in Appendix B.
The groundwater model was initially calibrated to groundwater level records from 36 bores
intersecting a variety of aquifers and aquitards; which included the monitoring bores installed
during the project mining area investigation. The calibration was guided by water level
measurements and site specific measurements of hydraulic conductivity from packer tests and
pumping tests within the coal seam, as well as operational observations of groundwater inflow
into the neighbouring Carborough Downs Coal Mine.
• A steady state calibration achieved a 13.7% scaled RMS error indicating the model can suitably
replicate steady state water levels and is an acceptable calibration metric as recommended by
the Australian Groundwater Modelling Guidelines (Barnett et al. 2012). Furthermore, the
calibrated groundwater levels, vertical gradients, and flow patterns replicate measured data
and groundwater trends. The model calibration is therefore considered robust.
• The numerical model was used to predict the effects of the project mining activities on the
groundwater regime for the UWIR period. The modelling results were used to inform
assessments of the project impacts on groundwater users and the surrounding environment.
Section 5 describes the predictions of the groundwater model.
• The sensitivity of the model predictions to the input parameters was tested, and involved
varying key model parameters in isolation and assessing the influence the change made on
predictions of drawdown and groundwater take. Key model parameters were selected based on
their potential to most influence model predictions. Sensitivity analysis included testing the
range of likely uncertainty in key hydraulic parameters for horizontal hydraulic conductivity,
vertical hydraulic conductivity, specific yield and specific storage.
• The changes used to test the model sensitivity include extremes in the potential parameter
ranges and encompass the full range of relevant measured values for these parameters.
• The analysis found that predicted groundwater take was most sensitive to an increase in specific
yield, while other parameters do not cause deviations as far from the baseline. The model is
least sensitive to a decrease in specific storage.
• Changes to these parameters within the model was associated with an increase in the model
error. This indicates that the magnitude of these changes reduced the ability of the model to
reliably predict measured groundwater levels, and indicates that the changes made during the
sensitivity analyses are likely to represent conservative extremes for these parameters.
• Overall, the results of the sensitivity analysis confirmed that the sensitivity of the model
calibration and predictions to changes in model input parameters is in all instances acceptable
and the model is fit for purpose.
Appendix B provides the model parameters.
Australasian Groundwater and Environmental Consultants Pty Ltd
Underground Water Impact Report for Ironbark No.1 Mine - v01.02 (G1915F) | 114 Groundwater regime
4.1 Overview
The project site is located on the north-western flank of the Bowen Basin, a sedimentary basin
comprising Permian to Triassic age geology (Figure 13). A veneer of more recent weathered sediments
typically overlies the Bowen Basin strata (Figure 10). Localised basalt and alluvium deposits are also
present within the project site and its surrounds.
The relevant hydrogeological units of the project site and its surrounds broadly comprise:
• Thin localised Quaternary alluvium associated with Bullock Creek, Spade Creek, Alpha Creek
and Hat Creek;
• A thin, highly weathered and heterogeneous veneer of semi-consolidated sandstone, mudstone
and other minor sediments associated with the Tertiary Suttor Formation, duricrusted
palaeosols at the top of deep weathering profiles, colluvium and regolith;
• Low permeability sediments of the Rewan Group; and
• Permian sediments of the Rangal Coal Measures (including the target Leichardt Seam) and the
deeper Fort Cooper Coal Measures and Moranbah Coal Measures.
Figure 7 shows a conceptual cross-section of the geology and groundwater regime within the project
site and its surrounds. This illustrates the main hydrogeological processes and mechanisms relevant to
the project groundwater regime, including recharge, flow directions, discharge, and anthropogenic
activities (i.e. mining).
The main groundwater-bearing formations are the coal seams of the Permian sediments. The coal seams
have been significantly depressurised and impacted by mining and gas production activities at nearby
operations. The Rewan Group is a low permeability formation that is a regionally recognised aquitard.
The alluvium and Tertiary sediments do not form permanent, saturated aquifers, and persistent
groundwater occurs only where these sediments extend below the regional water table.
The Tertiary sediments include the Tertiary Suttor Formation which is predominantly a quartzose
sandstone/conglomerate unit with minor multicoloured claystone and mudstone and bands of
ironstone and silcrete. The Suttor Formation unconformably overlies the Permian and Triassic strata
and forms a capping on the hills and ridges (prominent ridge escarpments), rising up to 40 m above the
surrounding land surface. These escarpments occur on the eastern boundary and part of the northern
and southern boundaries, and as remnant knolls within the project area. They do not form permanent,
saturated aquifers, as they occur above the regional groundwater table.
The Clematis Group and basalt are not a significant feature of the local groundwater regime due to their
distance from the mining activities.
Recharge occurs predominantly via direct and diffuse rainfall to the Tertiary sediments, localised areas
of alluvium, and weathered Permian coal measures. A portion of the rainfall moves downwards to the
groundwater table then moves through the system following the hydraulic gradient. This interaction
will be enhanced during periods of creek flow (e.g. resulting from significant rain events). Recharge to
the Tertiary sediments, Rewan Group and Permian sediments will occur where these units sub-crop
below the alluvium.
Australasian Groundwater and Environmental Consultants Pty Ltd
Underground Water Impact Report for Ironbark No.1 Mine - v01.02 (G1915F) | 12The regional water table varies within 5 m to 13 m of the surface along the creeks where they are incised into the topography. In areas of higher topographic elevation, the water table deepens from 20 m to over 60 m below the ground surface. That is, the regional groundwater flow is a subdued reflection of the topography from northeast to the southwest (as shown on Figure 9), towards lower lying areas and the existing the Broadlea North Coal Mine to the south. A shallow groundwater gradient of approximately 0.005 has been calculated from local groundwater levels. Groundwater quality within the project site and its surrounds ranges from moderately saline to highly saline. Regionally, groundwater generally is saline within the Triassic and Permian sediments. There are no known groundwater users in the project site or its surrounds. Similarly, and as discussed in Section 3.1.1, there is no take of groundwater from the surrounding CSG wells which are all exploration and appraisal wells of which none are operational. 4.2 Alluvium 4.2.1 Distribution As discussed in Section 4.1, alluvium is mapped as occurring along parts of Bullock Creek, Spade Creek and Alpha Creek. The distribution of mapped alluvium is shown on Figure 10. However, monitoring bores drilled within the mapped alluvium extents did not intersect alluvial sediments except in EFGW2S and EFGW1S. Similarly, alluvium was not encountered elsewhere within the project site. Its occurrence is confined to a narrow band along the creeks and tributary channels and is relatively thin between
4.2.5 Groundwater yields and use
There are no water supply bores targeting the alluvium within 5 km of the project site.

4.3    Tertiary Sediments
4.3.1 Distribution
As discussed in Section 4.1, the Tertiary sediments which include remnant Tertiary sandstone that
outcrop east of the project site, are elevated well above the surrounding land surface and are expected
to be unsaturated. Elsewhere, these sediments therefore comprise a shallow, highly weathered and
heterogeneous veneer of low permeability Tertiary sediments that do not contain any significant
volumes of groundwater and are often dry. The distribution of mapped Tertiary sediments are shown
on Figure 10.

The Tertiary sediments are not a significant aquifer for the purposes of this assessment.

4.3.2 Hydrogeological parameters
The Tertiary sediments have a low hydraulic conductivity range due to a predominantly low hydraulic
conductivity bulk unit that is dominated by clay (regionally it would be comparable to that for the
underlying weathered Rewan Group).

4.3.3 Recharge, flow, and discharge
The Tertiary sediments are recharged by direct infiltration from rainfall where these sediments are
present at the surface. Recharge also occurs via seepage from the alluvium, where present.
Recharge rates are low due to the predominately clayey nature of the formation. Within the project, the
Tertiary sediments were assessed to be dry with groundwater not intersected in any of the monitoring
bores drilled on site.

4.3.4 Groundwater quality
Where present, regional groundwater quality within the Tertiary sediments is typically brackish to
saline. The groundwater quality is therefore be broadly comparable to the underlying Rewan Group.

4.3.5 Groundwater yields and use
The Tertiary sediments are commonly regarded as an aquitard and typically exhibit very low yields
(less than 0.1 L/s).
No groundwater supply bores are known to target the Tertiary sediments within 5 km of the project
site.

4.4    Rewan Group
4.4.1 Distribution
As discussed in Section 4.1, the Rewan Group sub-crops within the project site. The mapped extents of
the Rewan Group are shown on Figure 13.
The Rewan Group is uniformly saturated at depth (i.e. below the groundwater table) and may become
unsaturated where it outcrops or sub-crops above the regional groundwater table. The Rewan Group
typically host the regional groundwater table in the vicinity of the project site and is therefore typically
saturated within the project site and its surrounds.

                                                  Australasian Groundwater and Environmental Consultants Pty Ltd
                                      Underground Water Impact Report for Ironbark No.1 Mine - v01.02 (G1915F) | 14
The Rewan Group is a recognised regional aquitard and acts as a confining unit overlying the Permian
sediments.
4.4.2 Hydrogeological parameters
In-situ permeability testing at the project site as part of the initial studies in 2008 indicated a low
permeability for the Rewan Group, and hydraulic conductivity values between 0.03 and 0.08 m/d
(AGE, 2008).
The Rewan Group is characterised by low primary porosity and as a result, groundwater movement is
controlled by local fracture sets. Where fractures are intersected this unit shows slightly higher
permeability, and conversely, where limited fractures are intersected this unit shows lower
permeability associated with the primary porosity. Bulk permeability of this unit is therefore
constrained by the degree of connection between any localised fractures.
4.4.3 Recharge, flow, and discharge
The Rewan Group is recharged via direct rainfall infiltration in outcropping areas and via seepage from
overlying units including the Tertiary sediments and alluvium, where present.
The rates of recharge are considered to be relatively low, compared to the alluvial aquifer.
Regionally, the groundwater flow direction follows the regional topography toward the southwest
where it slowly discharges to the underlying Permian sediments (Figure 9).
4.4.4 Groundwater quality
Groundwater monitoring data shows that groundwater quality at the project site and its surrounds is
brackish to saline and neutral to slightly alkaline with low concentrations of metals. The groundwater
quality is therefore broadly comparable to the Permian sediments. The low permeability of this
formation and long groundwater residency times are reflected in the concentrations of dissolved
minerals that are elevated in comparison to the alluvium.
4.4.5 Groundwater yields and use
The Rewan Group exhibits low yields within the project site and its surrounds (typically less than 1 L/s)
that would commonly be regarded as characteristic of an aquitard.
No groundwater supply bores are known to target the Rewan Group within 5 km of the project site.
4.5 Permian Sediments
4.5.1 Distribution
As discussed in Section 4.1, the Permian sediments include the Rangal Coal Measures and the underlying
Fort Cooper Coal Measures. The mapped extents of these Permian sediments are shown on Figure 13.
Groundwater storage and movement occurs within fractures and cleats that intersect the coal seams.
Other sediments in the coal overburden and interburden sequence exhibit very low permeability and
form discrete confining units between the coal seams. The Permian sediments may therefore be
categorised into the following hydrogeological units:
• Hydraulically "tight" and hence very low yielding to essentially dry sandstone and siltstone that
comprise the majority of the inter-burden/overburden; and
• Low to moderately permeable coal seams which are the primary water bearing strata within
the Permian sediments.
Australasian Groundwater and Environmental Consultants Pty Ltd
Underground Water Impact Report for Ironbark No.1 Mine - v01.02 (G1915F) | 15You can also read