Economic Analysis of the 2015 Drought For California Agriculture
←
→
Page content transcription
If your browser does not render page correctly, please read the page content below
Economic Analysis of the 2015 Drought
     For California Agriculture

                           Richard Howitt
                         Duncan MacEwan
                       Josué Medellín-Azuara
                              Jay Lund
                          Daniel Sumner

              UC Davis Center for Watershed Sciences
                         ERA Economics
                  UC Agricultural Issues Center

                           August 17, 2015

                                 Funded by
               California Department of Food and Agriculture
                       University of California – Davis
      With assistance from California Department of Water Resources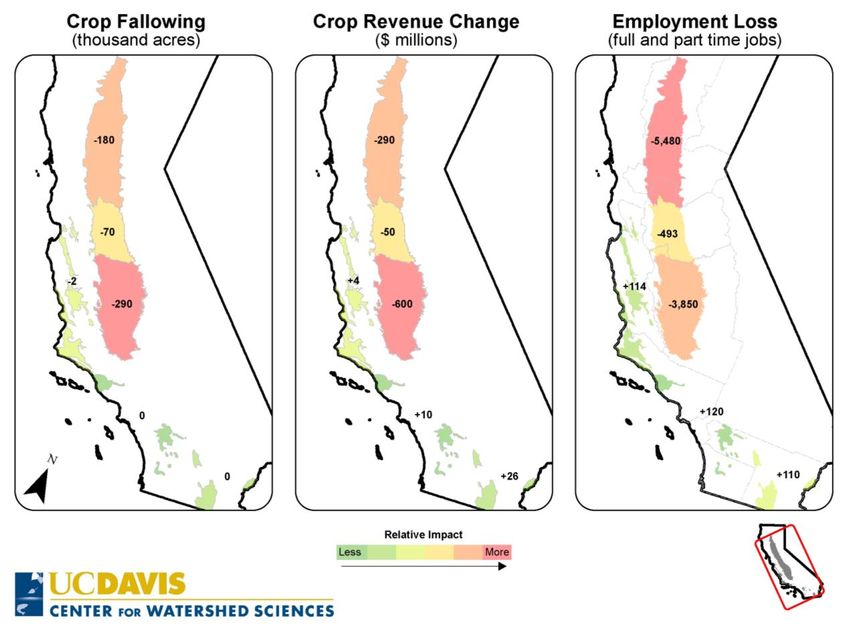
Economic Analysis of the 2015 Drought for California Agriculture
                                              Executive Summary
In 2015 California agriculture is facing its fourth year of severe drought. As in 2014,
irrigation districts and farmers are showing more resilience to the drought than many
had anticipated.
Groundwater substitution has again greatly reduced crop fallowing and job losses.
Water trading and operational flexibility also have significantly reduced the costs of the
drought, and preservation of the most valuable crops has helped buffer economic
impacts.
However, the effects of drought are unevenly distributed over regions. In some regions
with limited groundwater reserves the economic and employment impacts are very
severe. In others, there is an increased cost of expanded groundwater use which is
partially offset by high crop prices.
Just as the economic impacts of the drought have grown modestly since 2014,
continuation of the drought to 2016 or beyond with similar intensity is likely to slowly
erode the state’s agricultural production and employment.
                    Table ES-1. Summary of impacts of the 2015 California drought
 Description                                                   Impact              Base year       Percent
                                                                                   levels          change

 Surface water shortage (million acre-ft)                      8.7                 18.0            -48%

 Groundwater replacement (million acre-ft)                     6.0                 8.4             72%

 Net water shortage (million acre-ft)                          2.7                 26.4            -10%

 Drought-related idle land (acres)                             540,000             1.2 million*    45%

 Crop revenue losses ($)                                       $900 million        $35 billion     2.6%

 Dairy and livestock revenue losses ($)                        $350 million        $12.4 billion   2.8%

 Costs of additional pumping ($)                               $590 million        $780 million    75.5%

 Direct costs ($)                                              $1.8 billion        NA              NA

 Total economic impact ($)                                     $2.7 billion        NA              NA

 Direct job losses (farm seasonal)                             10,100              200,000#        5.1%

 Total job losses                                              21,000              NA              NA
* NASA-ARC estimate of normal Central Valley idle land.
# Total   agriculture employment is about 412,000, of which 200,000 is farm production.

                                                                                                           ES-1
Our estimation of economic impacts controls for confounding factors. Changes in
irrigation water deliveries, derived from reported deliveries and a survey of irrigation
districts, were used to estimate the economic responses of farmers, including additional
groundwater pumping, water market purchases, and planting and fallowing decisions.
By using changes in water availability to estimate economic impacts, we avoid
problems from ascribing all changes in aggregate economic production and
employment to the drought. Changes in business conditions, commodity prices and
other factors also affect agricultural revenues and employment, regardless of hydrologic
conditions. It is important to control for these factors to isolate the impact of drought.
Table ES-1 summarizes our estimates of the impact of the 2015 drought.
California agriculture’s resilience to surface water shortages is likely to continue through
2015. The ability to irrigate permanent crops with groundwater or marketed water will
largely prevent the sector from more expensive fallowing of higher-valued crops and
permanent crops. Some major conclusions:
Surface water shortages of nearly 8.7 million acre-feet will be mostly offset by
increased groundwater pumping of 6 million acre-feet. Groundwater offsets
almost 70% of the drought water shortage. Virtually all water shortages will be in
the Central Valley.
Net water shortages of 2.7 million acre-feet will cause roughly 542,000 acres to
be idled – 114,000 more acres than the 2014 drought estimate. Most idled land is
in the Tulare Basin. Temperature control and other regulations may exacerbate
the projected land idling, particularly in future years.
Direct agricultural costs of drought will be about $1.84 billion and 10,100 direct
seasonal jobs. When multiplier effects are considered, losses to all economic
sectors will be as high as $2.74 billion and nearly 21,000 total jobs.
The effects of continued drought through 2017 (assuming continued 2014 water
supplies) will likely be 6% worse than in 2015, with the net water shortage
increasing to 2.9 million acre-feet per year. Gradual decline in groundwater
pumping capacity and water elevations will add to the incremental costs of a
prolonged drought.
Increased groundwater overdraft during drought will slowly deplete groundwater
reserves at an incremental cost. New groundwater regulations could eventually
reverse this trend and force groundwater basins towards sustainable yields. The
transition will cause some increased fallowing or longer crop rotations, but will
preserve California’s ability to support more profitable permanent and vegetable
crops through drought.
Suggested Citation: Richard E. Howitt, Duncan MacEwan, Josué Medellín-Azuara, Jay R.
Lund, Daniel A. Sumner (2015). “Economic Analysis of the 2015 Drought for California
Agriculture”. Center for Watershed Sciences, University of California – Davis, Davis, CA, 16 pp.
Cover photo by Chris Austin
ES-2
Introduction
California is in a fourth year of drought – with the last two years being among the driest
and warmest individual years on record – raising concerns at all levels, especially in
agriculture. Many water districts are intensively using carryover surface and
groundwater reserves to ease surface water scarcity. Active ad hoc water markets and
other innovations have further softened the economic impacts. Overall, California
agriculture remains resilient to this drought thanks to continued growth in value of
products, successful local, regional and statewide water management actions, and the
state’s vast, yet slowly declining groundwater reserves.
We estimate the economic impact of the 2015 drought on agriculture and the effects of
continued severe drought in 2016 and 2017. Our research team assessed water
availability for agriculture based on groundwater access estimates, recent surveys of
more than 80 irrigation districts, and announcements from federal, state and local
projects.
We briefly describe the modeling approach and assumptions and summarize the
results. Water availability assessment and groundwater information are detailed in the
report appendices.
Modeling Approach
The study employed a suite of models using primary data from irrigation district surveys
and secondary information from public sources. The approach follows methods
described in Medellín-Azuara et al. (2015) and used in the 2014 drought impact study
on California agriculture (Howitt et al., 2014). Water availability assessments and
access to groundwater are key inputs to the SWAP model (Howitt et al., 2012), which is
the backbone of the study. SWAP simulates decisions by farmers in the statewide
agricultural market across 20 crop groups in 38 regions, representing most of
California’s farm commodities and irrigated acreage.
We use results from the surface-groundwater simulation model C2VSim in the SWAP
economic model. The C2VSIM model simulates water table depths using pumping
quantities based on the SWAP crop mix and surface water allocations. The cost to
pump groundwater for irrigation increases as the water table falls. The direct economic
cost of the drought is primarily driven by the increased pumping costs, changes in the
crop mix, land fallowing, and corresponding livestock and dairy losses. We use the
IMPLAN input-output model to estimate the statewide multiplier effects and job losses
resulting from these direct economic costs.
Data for this economic assessment came from the following sources:
A survey of irrigation districts during spring and mid-summer 2015 (see summary
in Appendix A)
Announced Central Valley Project (CVP) and State Water Project (SWP)
deliveries
1 Estimated changes in groundwater levels using DWR’s C2VSim groundwater
model
Estimated water market transfers between and within districts.
Changes in Water Availability
Changes in water availability for the 2015 drought are based on announced deliveries
from the CVP and SWP, surveys of irrigation districts, the ability to replace surface
water with groundwater in the short-term (using 2006-2010 well-pumping data), and the
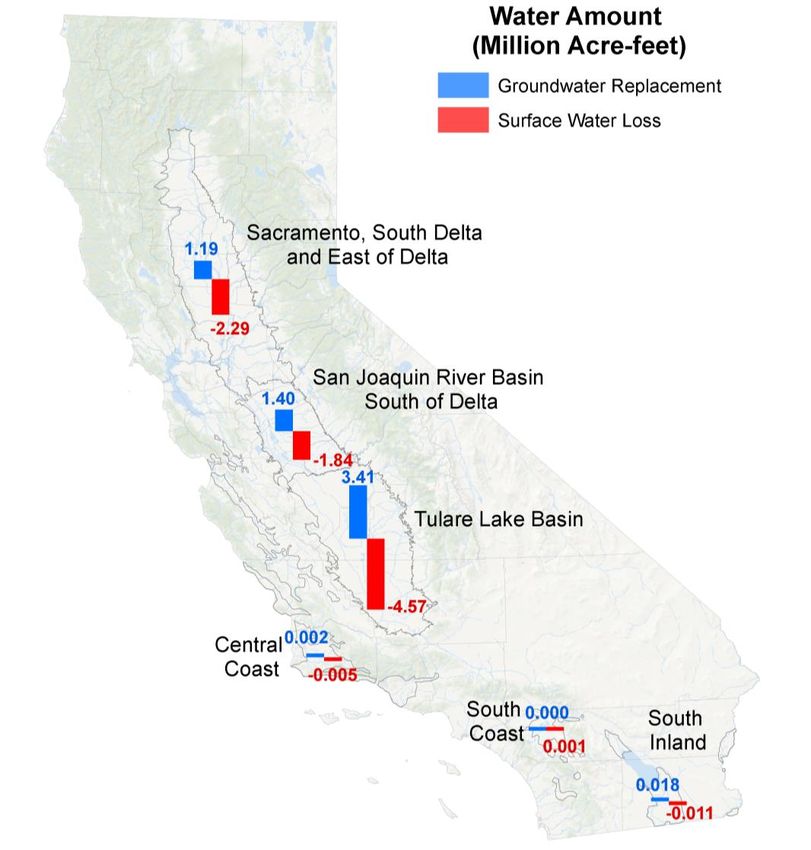
C2VSim model. Figure 1 below summarizes reductions in agricultural water availability.
Figure 1. Estimated changes in water availability for 2015 drought by region.
We estimate the 2015 drought has reduced surface water by 8.7 million acre-feet
statewide. This shortage has been partially offset by a 6 million acre-foot increase in
2groundwater pumping for an estimated net shortage of 2.7 million acre-feet. Table 1
shows estimated surface water shortages by region and the estimated ability to replace
lost surface water with groundwater.
We additionally consider the economic impacts if the drought continues in 2016 and
2017. We model the impact of 2016 and 2017 drought under the current (2015) surface
water availability. We make some additional adjustments for additional curtailments,
changes in groundwater availability and elevations, and transfers discussed more
below. Table 1 summarizes the surface water availability under the 2015 and 2016-
2017 droughts.
Table 1. Estimated Change in Water Use, 2015 drought (million acre-feet)
2015
Region Surface Water Groundwater Net Delivery
Shortage
Sacramento -2.29 1.19 -1.1
San Joaquin -1.84 1.40 -0.44
Tulare -4.57 3.41 -1.16
Central Coast and So. Cal. -0.02 0.02 0.01
Total -8.72 6.02 -2.7
2016
Net Delivery
Region Surface Water Groundwater
Shortage
Sacramento -2.35 1.23 -1.12
San Joaquin -1.87 1.40 -0.47
Tulare -4.57 3.36 -1.22
Central Coast and So. Cal. -0.02 0.02 0.01
Total -8.80 6.00 -2.80
2017
Region Net Delivery
Surface Water Groundwater
Shortage
Sacramento -2.40 1.28 -1.12
San Joaquin -1.90 1.40 -0.50
Tulare -4.57 3.31 -1.26
Central Coast and So. Cal. -0.01 0.02 0.01
Total -8.88 6.01 -2.87
3Sacramento River Temperature Management Plan
The Sacramento River Water Temperature Management Plan monitors water
temperatures at Shasta Reservoir to ensure flows are cool enough to support fish
habitat. If the water temperature exceeds certain threshold levels, then irrigation districts
must curtail surface water diversions. This could have significant economic costs
depending on when these curtailments occur.
We finalized this drought impact report in the late summer of 2015 and at the time of
publication there were no temperature curtailments in effect. This late in the irrigation
season, mid-August, it is unlikely that any curtailments would have a significant
economic impact. Many crops are ready for harvest and could get by on residual soil
moisture and skip the final irrigation. Alternatively, fields that do need additional
irrigation would likely secure that water from other growers in the district. In our analysis
of 2016 and 2017 extended drought impacts we do allow for water temperature
curtailments.
Water Transfers and Crop Shifts
Water transfers and shifts in crop contracts have an important effect on the impact of
drought. We have found that these factors are most important in the Sacramento Valley
where significant water transfers, an increase in processing tomato production, and
increased perennial plantings has significantly shifted field crop and rice acreage.
In 2015 the accepted price for water is an average of $650 per acre-foot in our district
surveys. This generates substantially more revenue per acre than rice or other field
crops grown in the Sacramento Valley. While farmers have shown some reluctance to
transfer large amounts of water there are some active transfers in the Sacramento
Valley, and this is one reason for the decline in rice acreage in that region.
Processing tomato contracts have shifted north from the San Joaquin to the
Sacramento Valley, also pushing out some rice acreage. Favorable weather, strong
prices, and low disease pressure in 2015 are likely to result in another increase in
processing tomato production this year.
Almond and walnut acreage has increased by more than 200,000 acres statewide since
2010. These new plantings were previously planted mostly to fields growing cotton,
irrigated pasture, grains, and hay. Young orchards require less water than many of
these field crops and older established orchards. This market-driven shift to perennial
crops is not a result of drought.
Modeling Results
This section provides estimates of the costs of drought to crop farming, livestock and
dairies statewide. We estimate the impact of 2015 drought and extended drought in
2016 and 2017 using the modeling framework described above. The SWAP model
4estimates the profit-maximizing crop mix for a three-year drought starting in 2015. We
express drought impacts in terms of revenue losses, additional pumping costs, and
jobs.
Irrigated Crop Areas
We estimate the 2015 drought may result in the fallowing of 542,000 irrigated acres,
almost all (99.5 %) in the Central Valley. Table 2 summarizes changes in irrigated
acreage by region. These figures differ from estimates in the May 2015 preliminary
analysis because water transfers, groundwater pumping, and surface water deliveries
have changed since our preliminary analysis.
Increased prices for some crop groups will add to the total revenues in areas less
affected by drought and with access to groundwater, especially in the central and south
coast regions. Feed, grain, and field crops have the largest proportional cuts in irrigated
acreage under drought conditions because they hold a lower value per unit of water.
Continued drought through 2016 and 2017, assuming 2015 water conditions for both
years, shows a slow decline in the water tables, and fallowing increasing by a few
thousand acres, reaching nearly 550 thousand acres by 2017. If access to groundwater
were to decrease or agriculture were to face additional curtailments for environmental
flows, temperature, salinity, or other factors, the impact of drought in 2016 and 2017
would increase substantially.
5Table 2. Estimated Change in Irrigated Crop Acreage from Drought (thousands of Acres)
2015
Region Vegetables Orchards and Feed Crops Other Grain Total
Vines Field
Sacramento -0.3 -4.4 -37.0 0.6 -138.1 -179.2
San Joaquin 0.1 -4.5 -38.2 -8.4 -21.4 -72.5
Tulare -22.3 -27.3 -58.5 -90.1 -89.9 -288.0
Central Coast -1.2 0.2 2.0 -2.0 -1.4 -2.5
and So. Cal.
Total -23.6 -36.0 -131.7 -99.9 -250.9 -542.1
2016
Region Vegetables Orchards and Feed Crops Other Grain Total
Vines Field
Sacramento -0.4 -4.5 -37.4 0.5 -138.4 -180.2
San Joaquin -0.1 -4.6 -38.9 -9.3 -21.6 -74.6
Tulare -22.1 -27.3 -58.8 -89.9 -89.9 -288.1
Central Coast -1.2 0.2 2.0 -2.0 -1.4 -2.5
and So. Cal.
Total -23.8 -36.2 -133.2 -100.8 -251.4 -545.4
2017
Region Vegetables Orchards and Feed Crops Other Grain Total
Vines Field
Sacramento -0.5 -4.7 -38.0 0.4 -139.0 -181.8
San Joaquin -0.3 -4.9 -39.8 -10.4 -21.7 -77.1
Tulare -22.1 -27.3 -59.1 -90.0 -90.1 -288.5
Central Coast -1.3 0.2 2.1 -2.0 -1.5 -2.5
and So. Cal.
Total -24.2 -36.6 -134.8 -102.1 -252.3 -549.9
6Direct costs of drought
Economic impacts for crop farming can be divided into crop revenue losses, livestock
losses, and additional pumping costs. These economic losses are described below.
Crop revenue losses
We estimate total crop revenue losses of $902 million in 2015. Table 3 summarizes the
change in total crop revenues by region and crop group for the three year drought.
Following the trend in the drought fallowing for 2016 and 2017, we estimate total gross
revenue losses from crops under a continued drought increase to nearly $940 million by
2017.
Table3. Estimated Change in Crop Revenues due to Drought, 2015 (millions of dollars)
2015
Region Vegetables Orchards and Feed Crops Other Grain Total
Vines Field
Sacramento 8 12 -18 1 -293 -289
San Joaquin 4 17 -19 -8 -43 -49
Tulare -101. -111 -90 -172 -131 -604
Central Coast -4 16 24 6 -2 39
and So. Cal.
Total -93 -66 -103 -173 -469 -903
2016
Region Vegetables Orchards and Feed Crops Other Grain Total
Vines Field
Sacramento 8 12 -18 1 -295 -292
San Joaquin 2 16 -20 -11 -44 -57
Tulare -101 -112 -92 -174 -134 -612
Central Coast -4 16 25 6 -2 40
and So. Cal.
Total -95 -68 -105 -178 -475 -921
2017
Region Vegetables Orchards and Feed Crops Other Grain Total
Vines Field
Sacramento 7 12 -18 1 -298 -296
San Joaquin -1 14 -23 -13 -45 -67
Tulare -101 -113 -95 -175 -135 -618
Central Coast
and So. Cal. -4 16 26 6 -2 42
Total -99 -71 -110 -181 -480 -939
7Central Coast and Southern California regions benefit from slightly higher commodity
prices due to decreased production in other parts of the state. For example, lower hay
production in the Central Valley increases hay revenues for Southern California and
somewhat lower berry and wine grape production in the Central Valley increases berry
and wine grape revenue slightly in the Central Coast relative to normal conditions.
The impact on labor differs between regions. For example, the direct labor impacts in
the Sacramento Valley for the grain crop group are substantially higher than in the
Tulare region. However the indirect and induced effects are higher for employment in
the Tulare Lake basin.
Livestock and Dairies
Losses to California’s dairy and cattle and calf industries derive primarily from higher
costs and lower availability of California-produced forage, including hay, silage and
pasture. Some of the hay and silage is produced on livestock farms where the forage is
used, but significant amounts are also sold in spot markets for which prices are
recorded. Most high quality alfalfa and most silage, including corn and small grain
silage are used on dairy farms. Much non-irrigated rangeland pasture is owned by the
cattle operations themselves, but some pasture also is leased to cattle operations, with
payments per animal unit grazed. Irrigated pasture is used by cattle operations as
supplemental feed during part of the year and by dairy operations for replacement
heifers prior to entering the milk cow herd.
Despite low milk prices in 2015, the dairy industry generates more revenue than any
other farm commodity in California. The drought has reduced availability of California
hay and silage and raised prices above where they would otherwise be in a year with
very low milk prices. Alfalfa hay shipments to the dairy region (the San Joaquin Valley)
are down relative to 2013 and 2014, although the lower ability to pay by dairy farmers
has caused lower prices than the 2014 peaks by more than 10 percent. The drought
has accelerated milk cow culling rates and reduced milk output on top of depressed milk
prices. Milk production in California has dropped from 2014, whereas national
production outside California has remained high. This partly reflects drought, but also
the greater reliance of the California dairy industry on exports to Asia, which are
depressed as well. We project drought-induced loss in milk production to cause about
$250 million in losses to the dairy industry compared to a normal water year with low
milk prices.
The cattle and calf industry depends on pasture (both rain-fed range and irrigated
pasture). Lack of rain in early 2015 caused cow and calf numbers to be lower than
normal and the shift away from irrigated pasture will decrease forage for feeder cattle.
Pasture conditions varied widely with some pasture receiving normal precipitation and
others very little precipitation and thus little forage. According to USDA more than three
quarters of cattle in California are in areas with exceptional drought in 2015. The low
forage per acre again in 2015 has caused continued low stocking rates. Irrigated
8pasture acreage also fell as deliveries were cut and water diverted to tree, vine, and
vegetable crops.
The California feedlot industry relies primarily on grain from the Midwest, which is not
influenced by the drought. But, California feedlots fatten beef calves and dairy steers
from California, so will again have a lower supply of cattle. Overall, we expect losses in
2015 to be about $100 million.
Other livestock industries, which, measured by value of output is primarily poultry and
eggs, will be minimally affected by the drought because most of their feed is shipped
into California.
Prospects for livestock and dairies for 2016 and 2017 under drought
A continued drought would mean continued higher forage prices than normal relative to
milk and cattle prices. The result for the dairy industry would be continued pressure to
reduce cow numbers and some further shift back to alfalfa hay, which can be shipped in
from other regions relative to silage, which is grown very near where it is used. The
result may also be lower milk production per cow.
Continued drought would cause further deterioration of pasture conditions, which means
further declines in the cattle herd in California. In addition, with smaller irrigation water
deliveries, irrigated pasture acreage may be eliminated in many areas as any remaining
water is diverted to trees, vines, and vegetables or high quality silage and hay. Irrigated
pasture would remain in areas where water transfers were not feasible. For this analysis
we estimate the cost of drought to livestock and dairies in 2016 and 2017 is the same
as 2015.
Statewide Economic Impacts of Drought
The direct costs of drought are threefold: revenue losses to crop farming estimated in
SWAP, estimated revenue losses in dairies and livestock, and increased pumping
costs. We use the IMPLAN model to estimate the corresponding statewide economic
drought impacts. Economic impacts include direct, indirect, and induced effects. Direct
effects correspond to the estimated direct costs from crop revenue losses, dairies and
livestock revenue losses, and increased pumping costs. The indirect effects occur when
those parts of agriculture directly affected by drought reduce purchases of inputs from
other indirectly affected sectors such as fertilizers, agrochemicals, and farm services.
The induced effects account for the overall changes in household income due to the
drought. The sum of direct, indirect, and induced effects is known as the total or
multiplier effect. For simplicity, only direct and total effects are reported in terms of total
sector output (sales), value added (sales minus non-labor business expenses), and
employment (seasonal jobs).
Statewide Economic Impacts
Table 4 summarizes our estimated statewide economic impacts of drought on
employment, value added, and sector output. Direct costs for 2015 include $902 million
in gross crop revenue losses, $250 million for dairies, and $100 million for other
9livestock. When we include the farm income losses due to increased pumping costs
($587 million) and multiplier effects, the statewide impact to agriculture and related
industries is $2.74 billion. Direct job losses in agriculture are estimated to be nearly
10,100 seasonal jobs.
We estimate that total job losses due to the drought are close to 21,000 jobs statewide.
These job loss estimates do not include estimates of changes in labor intensity (hours of
work per job) or other non-agricultural impacts of the drought. Losses in value added, a
measure of the California’s Gross Domestic Product (GDP), are estimated to equal $1.3
billion for the 2015 drought. We estimate the corresponding decrease in statewide labor
income, which includes salaries and proprietor income, of $720 million.
Table 4. Estimated Regional Agriculture Economic Impacts due to Drought, 2015.
2015
Impact Jobs Value Added Sector Output
(seasonal)
($ millions) ($ millions)
Direct -10,100 -400 -1,300
Total -21,000 -1,300 -2,700
2016
Impact Jobs Value Added Sector Output
Direct -10,200 -400 -1,300
Total -21,400 -1,300 -2,800
2017
Impact Jobs Value Added Sector Output
Direct -10,300 -400 -1,300
Total -21,700 -1,400 -2,900
Economic Impact Summary
We estimate that the 2015 drought may result in 540,000 acres fallow, costing $900
million in gross crop revenue losses, and 10,100 direct seasonal job losses. Figure 2
illustrates our estimated cropland fallowing, crop revenue losses, and employment
losses during the 2015 drought by region. Total impacts accounting for the spillover
effects are $2.7 billion in sector economic impact and 21,000 total jobs.
10Figure 2. Estimated impacts of the 2015 California drought on crop fallowing, revenues
and employment.
Comparisons with the 2014 drought
Some comparisons with the 2014 drought estimates can be calculated in terms of
irrigated areas, and direct employment. Appendix C provides estimates of land idling
based on remotely sensed information. Appendix D provides a more in depth analysis of
agricultural employment in the past years with emphasis on 2014. A summary is
presented below.
Irrigated Areas
This analysis compares the economic impacts to California’s agriculture of the 2015
drought to an average water supply year. These show that the 2015 drought is worse
than the 2014 drought in terms of surface water shortage to agriculture. We estimate
that agricultural surface water allocations will be 25% lower in 2015 than in 2014. Net
water shortage to agriculture, after additional groundwater pumping, in 2015 is nearly
67 percent, or 1 million acre-feet, more than in 2014. Cropland fallowing due to drought
has increased by 33 percent over 2014. The impact on direct farm-gate revenues is
11expected to decrease by a further 6 percent. Groundwater pumping costs are expected
to increase by a further 31 percent compared to 2014, due to increased pumping
volumes and increased unit pumping costs as groundwater tables decline.
The ability of California’s agriculture to adjust to drought conditions is driven by several
factors. Increased groundwater pumping is the largest response to drought, as with
most drought years, reducing the overall water shortage by over 70%. Regional crop
shifting in 2014 was significant. For example, processing tomato contracts shifted to the
Sacramento Valley resulting in a small net increase in the statewide tomato harvest,
given strong yields in 2014. Water market transfers are also an important adjustment to
drought and relieved some of the impact on perennial crops throughout the Central
Valley. Early reports this year show some transfers from senior water right holders to
east-side perennial crop producers. In addition, our survey of water districts suggests
that there will be more transfer of groundwater within districts than in 2014. Taken
together, these adjustments blunt much of the economic costs of drought to the
agricultural community and food consumers.
Livestock and Dairies
Milk prices are much lower in 2015 than 2014. Losses in production due to the drought
are similar in percentage terms to 2014, but with low milk prices the dollar loss is
smaller. Cattle and beef prices remain high in 2015 by historical standards, but this is
unrelated to the California drought. Losses are similar to 2014 relative to a normal year
with high cattle prices.
Employment
The 2014 analysis of the California drought (Howitt et al. 2014) projected a loss of
17,100 jobs in California due to the drought, with about 7,500 jobs lost in agriculture
directly. Aggregate agricultural employment statistics for 2014 from the State of
California Employment Development Department (EDD) show an overall increase in
agricultural employment for California in 2014. While this information seems to
contradict the projected job losses, agriculture in California has shown an expansion
both in value and in labor over the past years. Using a finer resolution employment
database provided by the California Employment and Development Department,
several facts can be noticed. First, most of the employment growth for 2014 occurred
during the non-irrigation season and in many cases in areas out of the Central Valley
such as the Central Coast. Second, a decline in the year to year growth rate of
agricultural employment occurred in 2014. It went down from 15,000 jobs from 2012 to
2013, down to 117 jobs during the irrigation season. Third, contract labor including farm
management seems to be the most affected during the 2014 drought. A more detailed
analysis is provided in Appendix D of this report.
12Policy Implications
The severity and adjustments required by the current long-term drought suggest several
areas where public policy could be improved.
1. Groundwater management. Given the unprecedented rate of groundwater
depletion during the current drought, the present 27 year timeline for stabilizing critical
groundwater basins under Sustainable Groundwater Management Act (SGMA) of 2014
is likely to be too long to ensure replacement of the cumulated overdraft under the
current drought (approximately 15 million acre-feet so far). Groundwater increasingly
has a critical role in future agricultural business prospects, particularly with shifts to
more permanent and high-valued crops, and will bring pressure to speed the
implementation of SGMA.
2. Data. Assembling a data-based report, such as this one, on water use and
drought impacts highlights the lack of up-to-date and consistent statewide data on water
and land use. Given advances in the analysis of remotely sensed data to estimate both
water and land use, developed and implemented in states such as Idaho, an investment
in similar information systems for California’s water managers would be a valuable step
forward for many management and policy purposes.
3. Water Market Transfers. Both intra- and inter-district water transfers and sales
between farmers and other users are flexible and equitable adjustment mechanisms for
drought conditions. Our survey of irrigation districts suggests that intra-district markets
for water between individual growers are flourishing, and press reports on water sales
suggest that sales are occurring at very high prices. In particular, the initiative taken by
some water districts to use the existing surface water distribution network to facilitate
trading groundwater between district members is a valuable innovation. Transfers will
become more important if the drought continues. However, markets require information
on market clearing prices and quantities at any given time, to ensure a more equitable
and efficient exchange of scarce water resources. A central clearinghouse of
information on the quantities being traded, such as an eBay for water or a “Water ISO”
(similar to California’s electrical energy market) would provide this service to buyers and
sellers. Of course, it is essential that these systems do not attempt to set prices, but
they must also operate within restrictions on transfer capacity and defined
environmental constraints.
4. Rural Domestic Supplies. The analysis of predicted changes in groundwater
elevation due to current rates of overdraft shows that in many areas of the Central
Valley, rural domestic and community water supplies that rely on shallow wells are
threatened. In the 2014 drought, several rural communities and many individuals
suffered from rapid and unexpected cuts in water supply. Public policy response in the
form of emergency support for such communities has improved significantly, and the
recent publication of well logs will allow better prediction of areas at risk for domestic
supply interruption.
135. Water Temperature Requirements and Curtailments. High temperatures in the
Sacramento River led to significant loss of salmon in 2014, causing the State Water
Resources Control Board to promulgate potential curtailments of Sacramento River
releases in 2015. Careful analysis of the likely curtailment levels and the irrigation
needs of crops at the end the season show that, in 2015, these curtailments are unlikely
to have a large direct impact on agricultural production in the region. If the drought
continues through 2016 and 2017 these curtailments could significantly reduce in the
ability to divert water from Sacramento River and significantly reduce agricultural
production in these regions under continuing drought conditions.
6. Conservation Trades in the Delta. In May of 2015 a group of senior riparian Delta
water users reached an agreement with the State Water Resources Control Board to
reduce their water diversions by 25% from 2013 levels, in exchange for assurance that
their riparian rights would not be further curtailed from June through September 2015.
This negotiated hedging of water use provided greater economic security for the water
users while reducing water diversions overall. While it remains too early to assess the
water made available by these actions, this program is a fine example of innovative and
equitable institutional changes which allow for both more flexibility and increased
predictability in drought response, with a likely reduction in overall environmental and
economic risk. This principle of trading risk and uncertainty for use reduction could be
applied in other situations.
7. Agricultural losses from environmental flows. Environmental restrictions for fish
have had some effects on agricultural production, but are generally less than might be
expected (Mount and Hanak 2015). Outflows from the Delta for endangered species
have only modestly reduced water availability, and farmers seem likely to be able to
work around some of the abrupt water losses due to Shasta Dam outflow restrictions
needed to preserve cold water for winter-run salmon. There may be long-term water
shortage impacts from the endangerment of additional native species due to this
drought and greater agricultural losses with more prolonged drought.
8. Local and regional employment impacts. The employment impacts of the drought
in agriculture are mostly in the Tulare basin, where water scarcity and land fallowing are
greatest. These impacts are buffered locally and statewide by continued shifting of
agricultural land to higher valued crops which generate more employment per acre.
Nevertheless, the employment impacts of the drought can be locally severe, and public
action to relieve these pockets of unemployment should be implemented.
Limitations and Extensions
1. Estimates of water availability. Our estimates of the reductions in surface water
allocations for the 2015 drought seem relatively accurate and well-corroborated.
However, the net effect of surface cuts on overall water supply depends heavily on the
ability of water users to increase groundwater pumping. Clearly groundwater extraction
14is limited by installed pumping capacity, and the rates of flow and elevations in aquifers.
We base our maximum pumping capacity in each region on the highest estimate of
groundwater extraction by the California Department of Water Resources between the
years of 2006 and 2010. This basic data level is modified by two conflicting changes.
First, the reduction in elevation of groundwater increases pumping costs, lowers flows,
and, in some cases, dries up wells. A second counter effect is the installation of new
wells which tend to be larger and deeper. Currently there is no quantitative information
on expansion of pumping capacity due to new wells. This is despite the widely agreed
fact that there is difficulty getting new wells drilled because of high current demand for
well drilling.
2. Changes in crop demands and agricultural sector growth. A study that attempts
to measure incremental losses from drought must isolate the effect of changing
demands and prices for agricultural products from those caused by drought. Over the
past four years California crops have been facing very strong demand shifts and
increasing prices in real terms. These strong market conditions have induced expansion
in some crops, especially nut crops. This crop expansion confuses the impact of
drought, both on farm profits and labor employment, if it is measured solely by gross
output statistics (Medellin et al 2015b). Our approach of driving the impacts directly from
changes in the effective water supply mostly isolates these market forces and focuses
on drought related impacts.
3. Multiplier analysis limitations. Impact analysis using models like IMPLAN have
some inherent limitations including fixed prices and lack of flexibility in production factor
use. In reality prices change in response to market conditions and economic events if
the impacts are large enough. Furthermore, intensity of production factors in agriculture
such as labor, water and agrochemicals can be also adjusted in response to external
events such as drought. Whereas some of this is captured by the SWAP model, input-
output models like IMPLAN assume fixed proportions which can be especially important
for labor impact estimation. Thus input-output models tend to underestimate the ability
of the regional economy to accommodate labor and other factor use among sectors.
4. Downstream impacts on California’s economy. The focus of this report is on
agricultural production including crops, livestock and dairies. These three sectors and
farm services (mostly contract labor) altogether represent a relatively small proportion of
California’s state economy. However products from agriculture serve as production
inputs for much larger value added sectors like food processing which have a higher
share in the economy.
5. Remote sensing. While there is good confidence in the precision of our water
supply driven crop model analysis and the resulting economic impacts, it is useful to
cross-check results for consistency with information on cropping from USDA surveys
and remotely sensed measures. We note that USDA and remote sensing generate
information on total land idling, which is different than land fallowing due to drought.
The USDA NAAS surveys farmers on their cropping intentions for fodder and field
crops. Given the highly heterogeneous pattern of California crop production, the survey
15is subject to sample size limits and response bias. A second comparison uses remotely
sensed measures of greenness of fields to compare the total area of idle land with that
in a normal base year of 2011. NASA preliminary estimates for this year range from 580
to 730 thousand acres idled in the Central Valley SWAP regions with a confidence of
95%. The research team of this report also conducted an assessment using the green
normalized vegetation index scored for wet fields. Results from this approach indicate
an increase in idle land with respect to last year in the order of 60 thousand acres. A
detailed discussion of these two alternative crop data sets is found in Appendices C and
D of this report.
Conclusions
Several conclusions arise from this and the 2014 analysis:
1. Surface water shortages of nearly 8.7 million acre-feet will be mostly offset by
increased groundwater pumping of 6 million acre-feet. Groundwater offsets almost
70% of the drought surface water shortage. Most of water shortages will be in the
Central Valley.
2. Net water shortage of 2.7 million acre-feet will cause 540,000 acres to be fallowed in
2015, 114,000 acres more than in 2014. Most fallowed land is in the Tulare Basin.
3. The direct costs of drought to agriculture will be $1.84 billion for 2015, and 10,100
direct seasonal jobs. When multiplier effects are considered, the total economic
sector impact will be as high as $2.74 billion and potentially 21,000 jobs statewide.
4. The effects of continued drought through 2017 based on continued 2015 water
supplies may be 6% worse than 2015, with net water shortage increasing to 2.9
million acre-feet per year. Gradual loss of groundwater pumping capacity and water
elevations will add to the incremental costs of a prolonged drought.
5. Increased groundwater overdraft during drought will slowly deplete groundwater
reserves at an incremental cost. New groundwater regulations could eventually
reverse this trend and force groundwater basins towards sustainable yields, at the
expense of some increased fallowing or longer crop rotations by preserving
California’s ability to support more profitable permanent and vegetable crops through
drought.
16References
Howitt R, Medellín-Azuara J, MacEwan D, Lund J, Sumner DA (2014) Economic
Analysis of the 2014 Drought for California Agriculture Center for Watershed
Sciences, University of California, Davis, California, pp. 16.
Howitt RE, Medellín-Azuara J, MacEwan D, Lund JR (2012) Calibrating disaggregate
economic models of agricultural production and water management.
Environmental Modelling & Software 38: 244-258 DOI
http://dx.doi.org/10.1016/j.envsoft.2012.06.013
Medellín-Azuara J, MacEwan D, Howitt RE, Koruakos G, Dogrul EC, Brush CF, Kadir
TN, Harter T, Melton FS, Lund JR (2015) Hydro-economic analysis of
tgroundwater pumping for irrigated acrigulture in California's Central Valley.
Hydrogeology Journal, Vol. 23, Issue 6, pp 1205-1216.
Medellín-Azuara, J., R. Howitt, D. MacEwan, D. Sumner and J. Lund (2015b), "Drought
killing farm jobs — even as they grow," CaliforniaWaterBlog.com, Posted on
June 8, 2015
Martin P, Taylor E (2013) Ripe with Change: Evolving Farm Labor Markets int he United
States, Mexico and Central America Migration Policy Institute, Washington, D.C.
Mount, J. and E. Hanak (2015)," Managing Tough Trade-offs in the Delta", PPIC Blog,
April 15, 2015,
17Appendix A: Water Availability Assessment
Jennifer Scheer and Kabir Tumber
Our team surveyed over 80 irrigation districts, mostly through personal interviews,
during the spring and the mid-summer of 2015 to assess the water supply outlook for
agricultural irrigation. We asked district managers about the following topics:
1. Estimated fallowing in 2014
2. Expected fallowing in 2015
3. Increases in irrigation water charges (fixed and volumetric)
4. Dry wells and whether these were domestic, municipal, industrial (M&I) or
agricultural
5. Groundwater substitution, on-farm and within the district
6. Transfers in and out of the district: volume, price, and import/export region
Many irrigation districts reported that groundwater substitution and water transfers
ameliorated some of the 2014 drought impacts. In addition, surface storage, banking,
and within-district transfers were used extensively. Most districts reported that some
domestic and M&I wells went dry, but few agricultural wells went dry because they are
typically drilled deeper than domestic wells, and far below existing groundwater
elevations. Most districts confirmed new, deeper wells are currently being drilled at a
rapid pace.
Water rates in most of the districts we surveyed did not increase significantly during
2015. At the extremes, one district reported lowering rates from 2014 to 2015 and one
district increased rates by over 75%. Most rate increases were in the range of 3-10%,
reflecting normal growth in rates rather than a response to the drought.
Most districts reported uncertainty about 2015 fallowing. Many districts are delivering
smaller allotments of water to growers, with deliveries ranging from one-tenth of an inch
to 36 inches per acre, typically less than normal crop irrigation water use. Other districts
are delivering no water to growers but are allowing growers to wheel groundwater
through their system for a fee. Growers with private wells can also transfer water to
other growers within these districts. Many growers have standby wells for early and late
season irrigations and to increase irrigation scheduling flexibility. Growers with standby
wells can use them to move water through the system (if the district permits it),
supplement reduced district deliveries, or depending on the size of their standby wells,
run the wells to fully irrigate their crops. In most areas the energy cost to the grower to
lift and pressurize groundwater is significantly more expensive than district surface
water. Groundwater substitution allows growers to avoid fallowing land, but the higher
pumping cost reduces profits and is an important economic cost.
Water transfer volumes vary significantly between districts. The average price across all
of the districts surveyed was reported to be $650 per acre-foot. Sacramento River
settlement contractors were perhaps the most active in water market transfers this year,
sending water to Sacramento River service contractors with zero allocation and to users
south of the Sacramento-San Joaquin Delta. Feather River contractors with senior
A-18water rights initially planned to transfer water south of the Delta, however a reduced
allocation of 75 percent caused most districts to rescind the transfer. Early in the
irrigation season San Joaquin River Exchange Contractors agreed to transfer water to
Friant Canal users, effectively increasing Friant surface water deliveries from 0 to about
5 percent. Due to late season rains in the Sierra Nevada the Exchange Contractors are
now receiving additional water supplies from Millerton Lake.
Even this late in the irrigation season water supplies are still uncertain in some areas.
Sacramento River contractors have faced challenges in both water availability and
timing due to operational restrictions on Shasta Reservoir implemented to maintain
sufficiently cool temperatures for winter-run salmon. The change came after cropping
decisions were made and fields were planted for the year, leaving farmers and irrigation
districts scrambling to fill the gap in supply with groundwater. With releases limited for
Shasta Reservoir, system operators depend more on Lake Oroville for fresh water
releases to manage salinity in the Sacramento-San Joaquin Delta. Feather River
contractors surveyed expressed some concern about the Department of Water
Resources’ ability to deliver their allocations.
On May 22, 2015, the State Water Resources Control Board approved a program for
Sacramento-San Joaquin Delta riparian water right holders to voluntarily reduce water
consumption by 25% compared to 2013 levels. In exchange, participating water users
received assurance that their riparian rights would not be further curtailed from June
through September 2015. Participating growers can achieve the 25% reduction in water
use through fallowing, reduced diversions, or a combination of approaches. The State
Water Board has said it will enforce the program by conducting spot checks throughout
the irrigation season. Growers who elected to enroll in the program were required to
submit an application by June 1 and to provide information regarding their water rights,
acreage and crops farmed, and their plan to reduce water use.
A-19Appendix B: USDA Acreage Projections
Jennifer Scheer, Duncan MacEwan, and Richard E. Howitt
The USDA surveys growers annually before the planting season (Prospective Plantings
Survey), in the middle of the growing season (June Plantings Survey), and after the
growing season. The USDA survey primarily covers commodity crops and does not
include the specialty crops that make up much of California agriculture. The CDFA and
specialty crop producer associations, such as the California Almond Board and the
California Avocado Commission, also survey producers and generate their own annual
planted acreage reports. We use these surveys to supplement the remote sensing
analysis and as a useful cross-check of the SWAP model estimates, with some
important caveats.
Crop surveys estimate the acreage planted for major crops in California on a state or
county-wide basis. By comparing acreage across years we can estimate the change in
total irrigated area for these major crops. The change in irrigated acreage between
years is driven by several factors and consequently does not represent only the effects
of drought. An observed decrease in acreage for a specific crop during drought years
might not be a result of the drought. Crop prices, disease, shifts to perennial crops, and
other market conditions are just some of the other factors that also may affect planting
decisions. Our modeling approach using the SWAP model controls for these other
factors to isolate the effect of drought. That is, the crop acreage estimates in annual
surveys should not match up with the drought impacts estimated by the SWAP model,
and are only useful as a cursory cross-check of broader trends in crop acreage.
We compared the changes in acreage due to drought and the USDA planting surveys.
The SWAP model land use data are from the California DWR and use different crop
definitions than the USDA, CDFA, and other surveys. In fact, and this may come as a
surprise to the reader, California does not have a consistent statewide crop acreage
dataset. The estimated irrigated area by crop differs between USDA, remote sensing,
County Crop Reports, DWR, and GIS surveys, to name a few. We do not attempt to
reconcile these differences here, but rather point them out so that the reader
understands the USDA surveys and DWR data in SWAP have different baselines. In
particular, for commodity crops reported by USDA the irrigated area in SWAP can be as
much as +12% or -10% of the area estimated by USDA. In total, the irrigated area in
SWAP (DWR data) is 2.6% less than the USDA numbers for these crops.
Our analysis finds that our drought fallowing estimates using the SWAP model are
consistent with the USDA planting surveys having taken account for the effects of water
transfers and crop shifting.
A-20Appendix C: Remote Sensing Analysis of Fallowing
Quinn Hart, Nadya Alexander-Sánchez, Forrest Melton, Josué Medellín-Azuara and
Andrew Bell
In addition to USDA statistical information, remotely-sensed data was employed to
estimate idle land in agricultural during 2011, 2014 and 2015. Multispectral satellite
imagery from Lansdsat 7 and 8 was used covering the Central Valley during the
irrigation season. Several methods were considered to estimate idle land mostly
involving normalized difference indexes. Furthermore, idle land estimates of summer
idle land for 2011, 2014 and 2015 were provided by a research team from the NASA
Ames Research Center as part of an ongoing research effort in collaboration among
NASA-ARC, DWR, USDA and the USGS. Estimates from both UC Davis and the
NASA-ARC lab show an increase in summer idle land in 2015 with respect to both 2011
and 2014 (Table C-1). A brief description of the methods and the preliminary results is
provided below.
Remote sensing estimates of idle land do not necessarily indicate drought-related crop
fallowing. Idling land in agriculture may be the result of yield-related rotations and other
farm practices. For 2011, a year with higher than normal precipitation, NASA-ARC
estimates 1.2 million acres idled in the SWAP central valley coverage area (about 6.7
million acres in NASA-ARC land layer). In addition to water availability, market
conditions and other factors highly influence California’s agricultural landscape.
NASA Ames Research Center Estimates
NASA-ARC employed time series of Normalized Difference Vegetative Index (NDVI)
data from various satellites including Terra, Aqua, Landsat 5, Landsat 7 and Landsat 8
to create 8-day composites to generate winter and summer idle crop land estimates.
Overall accuracy is 95% based on comparisons with 670 field validation sites.
For summer fallowing in the 2014 drought, estimates indicate 525,600 acres for all land
use categories (470,450 for SWAP crop groups). For 2015, NASA-ARC estimates an
increase in fallowing for all land use classes up to 670,000 until by end of July with
bounds of 585,500 and 726,700 acres and a 95% confidence level. Updates of these
estimates will be available as the irrigation season closes.
UC Davis idle land estimates based on remote sensing
A remote sensing and GIS based methodology was developed to obtain an initial
estimate and a trend for idled land for California’s central valley between 2014 and
2015. The approach will at this point will only indicate whether there is a trend in idle
land between the two years. Further refinement of the method will provide acre-
estimates of idle land. Data products employed in the estimation include:
A-21 Landsat 8 - Landsat imagery for the years 2014 and 2015, between 6/1 and 8/1
were used to estimate cultivation in the valley
USDA Cropland Database - Years 2013 and 2014 were used to estimate the
areas under cultivation for rice and cotton crops.
CA’s DWR Landuse - These maps delineate Agricultural fields, and was used to
determine what areas in the central valley are farmed.
Using the Landsat imagery, two indices were calculated for every cloud free pixel over
every image in time intervals described above. A Green Vegetation index (NIR/Green -
1) (GCVI) and the Normalized Difference Water Index (NDWI). For each scene, the
higher of the two indices was taken as the “cropped” score. NDWI was used for fields
like rice that were highly watered late into the season, where they potentially masked
the greenness of the crops. At 14 day intervals, the scores were calculated as the
average score from the closest cloud free pixel before and after the interval. The final
score was the summation of each interval score. Using this method allowed a
normalized score, and proper weighting of scenes, even in the presence of intervals
with scenes that contained clouded imagery over parts of the valley.
Table C-1: Comparison of idle land estimates
Region SWAP NASA-ARC
Sacramento 179,195 206,105
San Joaquin 72,461 108,689
Tulare Lake Basin 287,984 362,486
Central Valley 539,639 677,280
Figure C-1 shows this “cropped” score over all Agricultural lands in the Central Valley.
The low end of the score are the idled areas. Since the score changes gradually over
the region, determining an exact threshold for idled lands is challenging, and probably
varies from crop type to crop type. However, looking at thresholds in the range of 6 to 8
gives a general idea of the total fallowed lands. The higher greener bars indicate
increase in this low scores from 2015 over 2014. The approach is to be refined in the
following weeks to provide acre estimates of idle land yet indicates increased fallowing
between 2014 and 2015 of at least 60,000 acres.
A-22Figure C-1. Comparison of Green Vegetation Index (GVNI) between 2014 and 2015 for all
crops.
A-23Appendix D: Agricultural Employment Analysis
Josué Medellín-Azuara, Duncan MacEwan, Richard Howitt, Jay R. Lund
Agricultural employment during drought is a concern particularly for areas in the Central
Valley where agriculture is a higher proportion of total employment.
This Appendix reviews farm employment since 2010 at the county level using data from
the California Employment and Development Department (EDD)
Drawing inferences and trends from these data is challenging for several reasons:
The workforce migrates between regions, following schedules for planting,
harvesting and other activities in the cycle of farm production
Commodity prices can override water scarcity and cost in planting decisions
A high proportion of farmworkers in many places is undocumented and it is
estimated that for each full time equivalent job there are two employees.
These challenges merit more in-depth analysis using statistical methods to control for
these confounding factors and adjust for undocumented workers.
A preliminary analysis of the raw state agricultural labor data for crop farming, livestock
and dairies, and support services for agriculture (e.g. contract labor), shows that during
the irrigation season (April to September) there is an increase of roughly 120 jobs
statewide from 2013 to 2014, and 8120 during the non-irrigation season. A breakdown
by region shows that most of the growth occurred in the less drought-impacted Central
Coast region with monthly average 1,850 jobs during the irrigation season and 2,520
jobs during the non-irrigation season.
Figure D-1. Changes in average monthly farm employment, 2013-2014. Source:
authors calculations using California Employment and Development Department (EDD)
data.
A-24In contrast, the San Joaquin Valley shows a decline of 1,620 jobs during the irrigation
season and an increase of 2,320 jobs during the non-irrigation season. The South
Coast shows average monthly losses of 475 in both seasons and other areas in the
state have modest increases in the hundreds. Figure D-1 above shows these findings.
Part of the increase in labor can be attributed to a growth in summer farm labor in the
Sacramento Valley and coastal regions, which had better water availability, and
increasing prices of high-value vegetable and field crops during the 2014 drought.
Figure D-2 Year-to-year change in farm employment during irrigation season for
selected regions. Source: authors calculations using California Employment and
Development Department (EDD) data.
More important, the pattern of agricultural labor is consistent with a longer term trend
towards more agricultural employment in California, driven largely by shifts to crops that
yield higher revenue per acre and per acre-foot of irrigation water (Medellin et al
2015b). Figure D-2 below shows the discussed decline in year to year employment for
all three areas in the Central Valley for the irrigation season. A sharp decline in growth
in the Tulare Lake basin could be attributed in part to drought conditions. Figure E-3
below shows quarterly employment from 2010 to 2013 for the Central Valley the coastal
areas an inland southern California.
A-25You can also read


