Impact of Hijlan Creek springs on water quality of the Euphrates River and the Hydrochemical characterization of the contamination plumes
←
→
Page content transcription
If your browser does not render page correctly, please read the page content below
Impact of Hijlan Creek springs on water quality of the Euphrates River and the Hydrochemical characterization of the contamination plumes Muwafaq Ayesh Rabeea University of Anbar Ahmed J. R. Al-Heety University of Anbar Mahmmoud Ismail Mohammed University of Mosul Adnan Mohammed Fayydh University of Anbar Mohamed Elhag ( melhag@kau.edu.sa ) King Abdulazziz University https://orcid.org/0000-0001-9048-0084 Research Article Keywords: Balneotherapy, Contamination, Spring waters, River-Creek con uence, Re-aeration Posted Date: June 2nd, 2021 DOI: https://doi.org/10.21203/rs.3.rs-338406/v1 License: This work is licensed under a Creative Commons Attribution 4.0 International License. Read Full License Version of Record: A version of this preprint was published at Environmental Earth Sciences on July 19th, 2021. See the published version at https://doi.org/10.1007/s12665-021-09749-6.
Impact of Hijlan Creek springs on water quality of the Euphrates River and the

 Hydrochemical characterization of the contamination plumes

 Muwafaq Ayesh Rabeea*1, Ahmed J. R. Al-Heety2, Mahmmoud Ismail Mohammed3,
 Adnan Mohammed Fayydh4 and Mohamed Elhag*5,6,7,

1
 Department of Applied Chemistry, College of Applied Sciences, University of Anbar. Hit,
 Anbar 31007. Iraq.
 2
 Seismic Processing Center/ Oil Exploration Company/ Baghdad-Iraq.
 3
 Department of Biology, College of Science, University of Mosul, Iraq
 4
 Department of Chemistry, College of Pure Sciences, University of Anbar.
 5
 Department of Hydrology and Water Resources Management, Faculty of Meteorology,
 Environment & Arid Land Agriculture, King Abdulaziz University
 Jeddah, 21589. Saudi Arabia.
 6
 Institute of Remote Sensing and Digital Earth (RADI), Chinese Academy of Science
 (CAS), Beijing, 100094, China.
7
 Department of Applied Geosciences, Faculty of Science German University of Technology
 in Oman, Muscat, 1816, Oman.
 *Corresponding emails: muw88@uoanbar.edu.iq; and melhag@kau.edu.sa

Abstract

This work aims to present the hydrochemical mechanisms describing the system of the
Euphrates River before and after mixing with groundwater from the springs of Hijlan (western
Iraq). Continuously, the data generated from these springs' water have been adapted to provide
an updated assessment for future water therapeutic purposes. Physicochemical characteristics
of water in the mixing plume of Hijlan Creek and the Euphrates indicate the multi
Hydrochemical plumes as revealed by the spatial variation of important parameters related to
the ecological parameters including K+, Na+, Ca+2, Mg+2, HCO3-, SO4-2, Cl-, NO3-, PO4-3, Pb,
Zn, Cd, Fe, Mn, Temp, DO, BOD5, H2S, Turbidity, EC, pH, and TDS. The re-aeration (k2)
and de-oxygenation rate (k1) coefficients, as well as the self-purification factor (f) of the
mixing plume, are 0.51 sec-1, 2.03 sec-1, and 0.25, respectively. The Cl- concentration in the
confluence zone changes, due to the chloride content mixing rates of 7.1% and 92.9% for
Euphrates and Hijlan creek water, respectively, with water discharge of 316,224 m 3/day and
chloride load discharge of 420 tons/day. The assessment of the water quality indicates
unsuitability for aquaculture purposes. However, the water can be used for therapeutic
purposes and to cure multiple diseases.

 1
Keywords: Balneotherapy; Contamination; Spring waters; River-Creek confluence; Re-

 aeration

 1. Introduction

Environmental concerns are growing with variations in water resource pollutants. Numerous rivers

are vulnerable to disasters due to the increase of pollutants (Gurnell et al., 2020; Muwafaq et al.,

2020). Rivers water has traditionally been seen as a disposal site for waste coming from a variety

of activities, believing that a large amount of water by dilution leads to detoxification (Tuyet et

al., 2020; Vandana et al., 2020). Contamination of the rivers is one of the greatest challenges facing

the new world, which is creating an unsettling situation. Increased human activities and natural

resources (groundwater and spring water) flowing into rivers make it necessary to evaluate the

current water quality of rivers and predict potential improvements (Gao et al., 2019; Fregoso-

López et al., 2020). The water quality indexes may be divided into specified indicators, public

indicators, planning and designing indicators, and statistical indicators. Statistical models are

significantly important when evaluated water quality (Marta et al., 2010; Jena et al., 2013; Cruz et

al., 2019).

 The surface and groundwater resources of the study area have been covered by several previous

 reports (Fayadh et al., 2016; Bayan et al., 2020). Techno promo export (1978) studied the

 groundwater and surface water resources in the study area, which was the basis for establishing

 Haditha Dam. The Consortium Yugoslavia (1981), performed hydrogeological tests to explore

 the water resources within block 7 in the Western Desert. Al-Hadithi (1994) studied the hydrology

 of the Haditha reservoir and pointed out the contribution of Haditha lake and groundwater

 recharge. Al Jabbari et al., (2002) studied the Euphrates basin within the national monitoring

 program, which includes the groundwater adjacent to the Euphrates River. Al-Hadithi (2005)

 reported the variation in the hydrochemical characteristics of Hijlan springs and some wells in

 2
the Haditha area. Hussein (2010) utilized the intersection of groundwater with surface water to

describe the movement and levels of the groundwater along the Euphrates river in Al-Anbar

province. A statistical study of the source and origin of the hydro-chemical constituents in the

Euphrates River from Al-Qa'im District to Al-Baghdadi city was conducted via government

observation during water surplus and deficit periods in 2007 (Al Hamdani et al., 2012).

The Euphrates River has been exposed to decades-old hazards of contamination from continuous

groundwater discharge as flowing springs (Hijlan springs) dispose into the river. A feasible

program of field monitoring was conducted to obtain the ambient water quality data in the mixing

zone of the Euphrates, which was formed in a restricted confluence region due to Hijlan creek

discharge. The Creek water behaves as a plume of a point source or minero-medicinal water but

can be considered a point source of pollution due to the inflow of salts additives, ions, and other

elements into the Euphrates. Therefore, it is necessary to assess the degradation degree of the

river contamination in the confluence zone. This study is an attempt to determine the

characteristics of the Euphrates River water before and after mixing with Hijlan springs creek

(statistical and spatial evaluation). Besides, investigate the amount of total load added to the

Euphrates and the mixing case using the chloride concentration. Continuously, the variation of

the concentration of chemical components within the deterioration plume, the aeration

phenomenon using the dissolved oxygen concentration, the possibility of using spring mineral

water for therapeutic purposes, recreation after improvement, and environmental regulation of the

Hijlan Creek are investigated.

2. Study area

Hijlan Springs are found in the confluence region of Hijlan Creek with Euphrates River, locating

at a distance of approximately 3 Km north of Haqlaniyah town, Haditha provinces, Al-Anbar

Governorate, bounded by UTM Northing of 255000 to 260000 and Easting of 3773000 and

 3
3777000, (Figure 1). The mean annual temperatures, rainfall, evapotranspiration during (1970-

2017) of Hijlan Springs were 21.9 °C, 138.9 mm, and 3088 mm, respectively. The climate in the

study area is arid based on the classification of Mather (1974).

Aridity index (AI) = {( / ) − 1)}/100 (1)

Where: AI denotes Aridity Index, P signifies rainfall (138.9 mm), PE represents

Evapotranspiration (3088 mm).

Geologically the area covered by sedimentary rocks is aged from the late Oligocene to Early

Miocene (Sissakian and Hafidh, 1994), represented by the Anah and Euphrates Formations that

are exposed near Haqlaniyah town in the deep cutting of Hijlan valley. Anah Formation (Upper

Oligocene is composed mainly of massive bedded and hard dolomitic limestone and cavernous

limestone, which are locally strongly Karastified resulting in the formation of differently sized

cavities (Sissakian and AL-Mousawi, 2007). The exposed formation has an approximate

thickness of 6–10m. The Anah formation is overlain unconformably by the Euphrates formation

(Lower Miocene), which is composed of early Miocene sediments. Euphrates formation is

exposed along both banks of the Euphrates River.

The formation changes in both horizontal and vertical directions. It consists of two members.

Lower Member consists of basal conglomerate, which plays a big role in water circulation and

development of the sinkholes. The conglomerate is overlain by well-bedded and hard dolomitic

limestone, dolomite, and limestone; followed by thickly bedded chalky limestone; upwards

become thinly bedded. This succession forms all the flat areas and all the sinkholes are developed

in the succession (Mahdi, et al. 1985), with a thickness range of 5 to 25m. The upper member

consists of brecciated and highly deformed limestone, dolostones, and dolomitic limestone with

horizons and lenses of green mud, and a thickness range of 7 to 15 m (Figure 1). These Formations

are covered by residual soil and/or alluvial soil (Gypsious and Calcareous soils). Karst

 4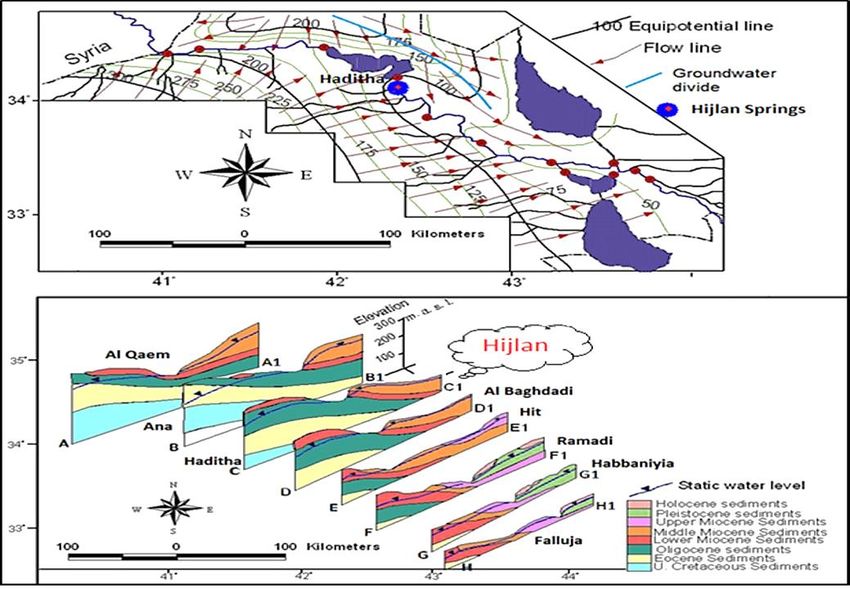
phenomenon including landforms, Sinkholes karst types, caves is the most common karst forms

in the study area. Surface karstification is manifested as numerous sinkholes and shallow holes

of regular shapes and vertical wells depressions (Abdul Razzak and Zaynal, 2012).

 Figure 1. Geological map of the study area. (Modified from Sissakian and Fouad 2012).

The Euphrates River incises its course through the Miocene and Oligocene sediments in the sight

of Wadi Hijlan springs between Haditha and al-Baghdadi sections CC1 and DD1 (Figure 2). The

Euphrates and Anah Formations are considered major aquifers with semi-confined conditions and

their water flow towards the discharge zone as springs. It is important to note that the water-

bearing horizons of the Quaternary sediments are characterized by bank storage conditions and

 5
serve as a control in the relationship between the groundwater of aquifers and the surface waters

of the Euphrates.

 Fig. 2 Regional hydrogeologic sections and groundwater movement (Fayadh et al. 2016)

3. Material and methodology

3.1. Study site description and sampling

The equipment used in the hydrographic survey is Trimble Global Positioning System AG122

(GPS), Surfer software, and field notebook computer. GPS is used to determine exact locations

(XY coordinates) on the earth’s surface with approximately five to seven satellites locked in on

the receiver at one time to ensure the highest level of accuracy. Surfer software was used to map

the positions of the survey grids (UTM-zone-38) within the study area and during boat travels

across the river surface. Thirty-five points were fixed for the sampling of water and the various

measurements. Data collection was performed in Nov. (2019). Data generated from the

monitoring procedure were used to produce an updated view of Hijlan Springs Creek. A total of

 6
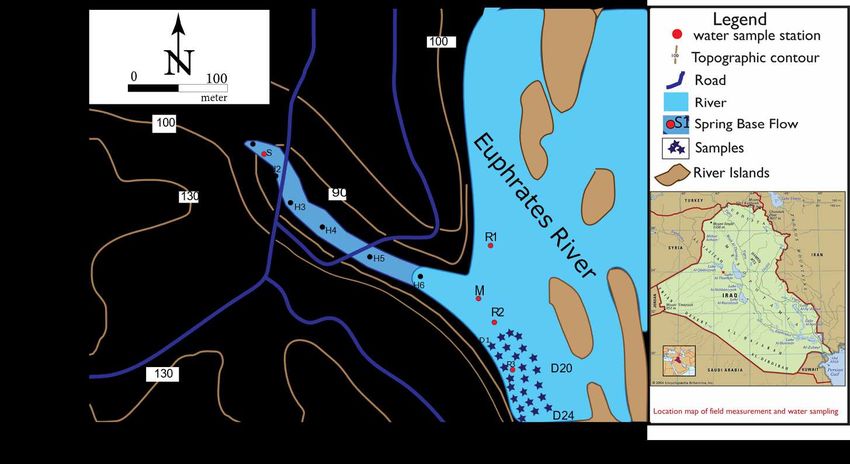
286 different readings were recorded during the monitoring period (Tables S1-S2 in

supplementary file).

Five water samples (S1, R1, M1, R2, and R3) were collected from Hijlan Creek and Euphrates

(Figure 3) for the analysis of major cations, anions, minor anions, and trace elements. Six sites

(H1, H2, H3, H4, H5, and H6) in the Hijlan (Table S1 in supplementary file) Creek were

identified for the field analysis. Continuously, twenty-four field measurements numbered (D1-

D24) have been monitored along 250 m at the confluence of Hijlan Creek and the Euphrates to

meet the research objectives (Table S2 in supplementary file).

Water samples were collected using polyethylene bottles according to the procedures of USEPA

(2000). The samples were carefully sealed and tagged. The equipment used for sample collection

was cleaned using deionized water (Barcelona et al., 1985; Shelton, 1994).

 Figure 3. Location map of field measurement and water sampling

 7
3.2. Physico-chemical and Heavy metal analysis

The collected samples were transferred to a Quality control laboratory to analyze for all ions (K+,

Na+, Ca+2, Mg+2, HCO-3, SO4-2, Cl-, NO-3 and PO4-3), using the standard methods of the American

Public Health Association (APHA, AWWA, WEF, 1995; APHA, 2012). Trace elements (Pb, Zn,

Cd, Fe, and Mn) were determined using Flame Cont. AA-7000 SHIMADZU (ROM Version,

1.03, S/N, A30945100295). The field analyzes (Temperature, pH, EC, TDS, and DO) were

achieved using a portable multi-digit device (Aquaread AP-800-P). The H2S dissolved in Hijlan

Creek was determined by the addition of lead acetate to precipitate as lead sulfide for analysis

(Robert, 1973). Turbidity values were expressed as nephelometric turbidity units (NTU) using a

HACH 2100P field turbid-meter. The rank correlation coefficient of Spearman was used to

determine the degree of the importance and the value of the relationship between studied

variables (Helsel and Hirsch, 2002).

3.3. Self-purification factor

The model of space-time evolution of the concentration of dissolved oxygen (DO) and biological

oxygen demand (BOD5) towards downstream after contaminated discharges (Streeter and Phelps,

1925), was described as:

Dt = Cs − C (2)

Where: Dt denotes dissolved oxygen deficit, Cs represents saturated DO concentration (mg/l),

and C stands for concentration of DO detected in DO plume.

3.4. Contaminants Loads

The discharge is directly calculated from velocity and cross-sectional area of the Creek using the

formula (3):

 L3 L
Q= = V ( ) ∗ A(L2 ) (3)
 t T

 8
Calculating the discharge is crucial for the prediction of contaminant transport and load. Using

the HOL procedure (Brikowski, 2011), an Impeller flow meter was utilized to determine average

velocity across the entire Creek (Hijlan estuary) and right bank of the Euphrates river. The

morphometric feature, velocity, and water discharge results are listed in Table2.

Table 1. Physico-chemical analysis of Euphrates River and Hijlan Creek water

 S1 R1 M1 R2 R3
 Hijlan creek Euphrates before mix Mixing zone Euphrates after mix Euphrates after mix
 Variables
 X; 257225 X; 257286 X; 257258 X; 257275 X; 257291
 Y; 3775130 Y; 3775167 Y; 3775118 Y; 3775104 Y; 3775052
 pH 7.0 7.5 7.7 7.37 7.4
 EC µS/cm 5076 985 1281 1350 1277
 Temp °C 25.2 21.5 21.2 21.4 22
 Turb. NTU 1.02 0.7 0.38 0.84 1.02
 TSS mg/l 4 2 2 1 4
 HT mg/l 1694 343 530 520 635
 TDS mg/l 3220 673 1000 923 730
 K+ mg/l 36 2.5 33 3.2 8.5
 Na+ mg/l 556 76 105 119 190
 Mg++ mg/l 207 37 74 65 80
 Ca++ mg/l 338 77 90 101 123
 Cl- mg/l 1330 152 190 230 403
 SO4-- mg/l 555 157 377 253 321
 HCO3- mg/l 199 135 130 150 133
 CO3-2 mg/l 0.4 0.2 0.3 0.2 0.1
 NO3- mg/l 1.0 0.2 1 2 1
 PO4-3 mg/l
4. Results and discussion

4.1. Contamination Plume Behavior and Characterization

A statistical comparison of the concentrations of ions versus total dissolved solids and the

physicochemical components against DO and H2S concentration was performed, according to the

Spearman correlation coefficient equation (4):

 d2i
(rs ) = 1 − 6 ∑ 〖 ) (4)
 n(n2 − 1〗

Where dᵢ = xᵢ - yᵢ represents the difference in ranks for the i-th individual and n denotes the number

of individuals (Helsel and Hirsch, 2002).

Positive associations of ranks are observed between TDS and H2S for all parameters, except for

Co and Mn (Table 3) due to the impact of H2S on their concentration via precipitation mechanism.

Both Co and Mn are confirmed by a linear positive relationship to the DO concentration. The

emergence of a close correlation between the measured physicochemical variables is a

contamination indicator and it trends the active effect of the spring water on surface water.

Table 3. Statistical correlations according to the results of Spearman Rank Coefficient

 Spearman Rank Spearman Rank Spearman Rank
 Variable Variable Variable
 Coefficient (rs) Coefficient (rs) Coefficient rs
 TDS mg/l 1.0 DO mg/l 1.0 H2S mg/l 1.0
 K mg/l 0.9 Temp °C -0.6 Temp °C 0.5
 Na mg/l 0.9 pH -0.525 pH 0.875
 Mg mg/l 1 Turb. NTU -0.125 Turb. NTU 0.175
 Ca mg/l 0.9 BOD5 mg/l -0.9 BOD5 mg/l 0.9
 Cl mg/l 0.9 H2S mg/l -0.7 DO mg/l -0.7
 SO4 mg/l 0.9 NO3 mg/l -0.3 NO3- mg/l 0.2
 HCO3 mg/l 0.2 PO4 mg/l 0.5 PO4 mg/l 0.6
 Cu mg/l 0.5 Cu mg/l -0.6 Cu mg/l 0.9
 Co mg/l 0 Co mg/l 0.8 Co mg/l -0.3
 Mn mg/l -0.425 Mn mg/l 0.575 Mn mg/l -0.575
 Cd mg/l 0.7 Cd mg/l -0.7 Cd mg/l 0.5

 10
4.2. PH, Dissolved oxygen, Biological oxygen demand, and Nitrate Plume
Physico-chemical parameters, such as pH, BOD5, DO, dissolved ions and metals, etc., were used
as a dilution indicator to produce a Geo-referenced contamination plume for minero-medicinal
spring water discharge. The pH is influenced by the dissolved species and various chemical
reactions that differentially occur through the water column. The major reactions that affect the
magnitude of pH are reactions that occur in aerobic/oxic conditions (Wetzel, 1983; Morel and
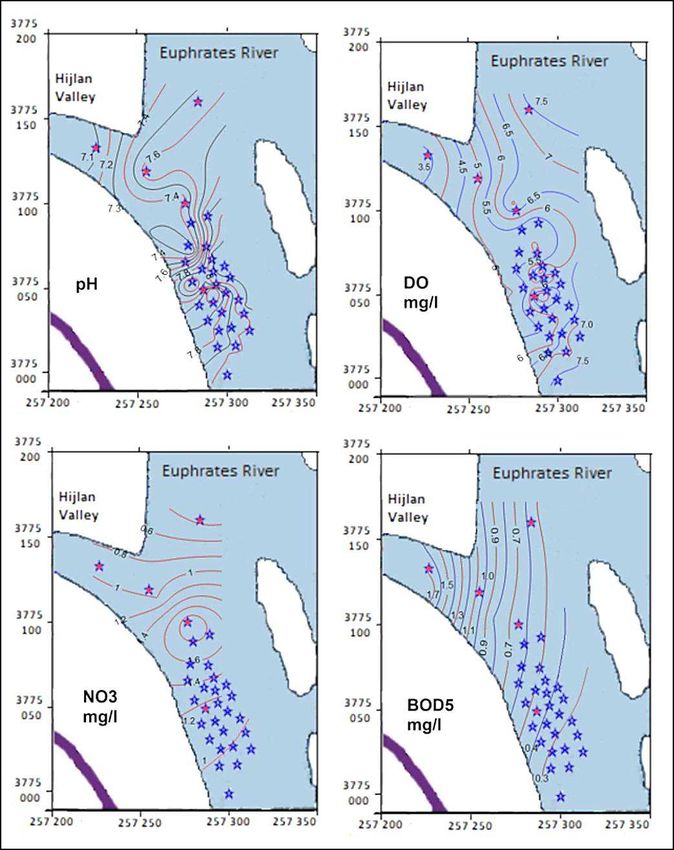
Hering, 1993). Figure 4 shows the measured pH values increase from 7 to 7.2 from springs
locations towards downstream, under oxidation reactions and limited by reducing reactions
(Stumm and Morgan, 1981). A plume with pH of 7.4 emerged in the confluence zone, which can
be attributed to the mixing of water of the Euphrates River (pH range of 7.6 - 7.8) with that of
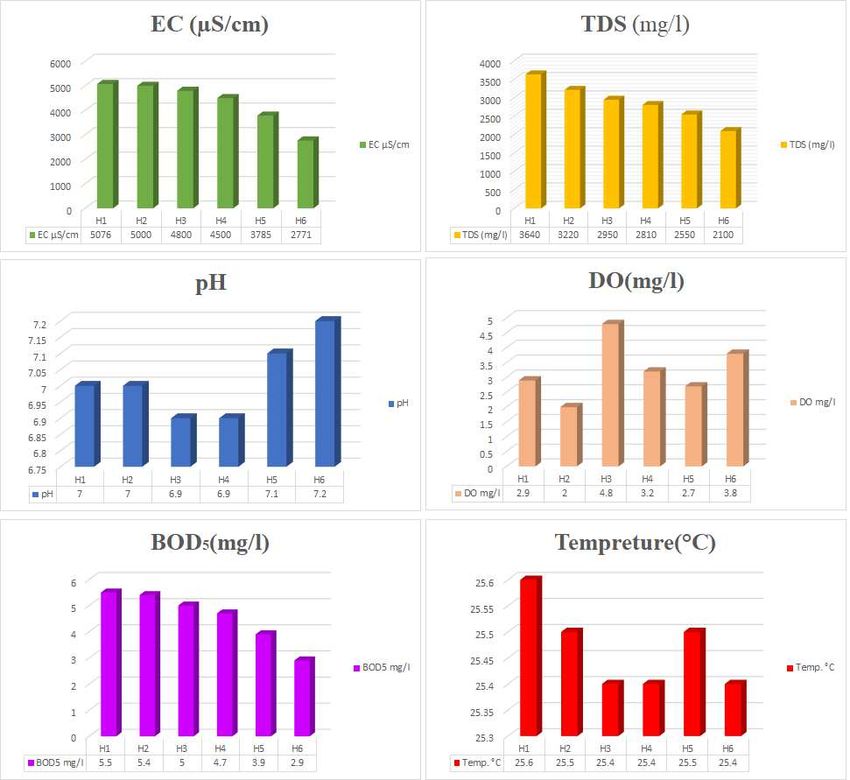
Hijlan Creek (pH range of 7.0 - 7.2). A drop in pH is detected upstream (Figure 5, pH). The DO
dynamics of Hijlan Creek is not typical for a natural stream with storm runoff. The DO
concentration range of 2 to 2.9 mg/l is attributed to the groundwater origin (oxygen consumption
by bacterial decomposition). Afterward, the gradual increase in DO concentration to 3.8 mg/l
towards the confluence zone (Figure 4) is due to the external contribution of oxygen from the
solubilization of atmospheric oxygen.
The rate of reaeration is assumed to be proportional to the difference between the saturation and
observed concentrations of DO (mg/l). The reaeration rate coefficient K2 (1/time) is a sensitive
parameter that can be calculated using the following equations (5) (Van Pagee, 1978; Delvigne,
1980):
water velocity 0.5
{0.065(WindVelocity)2 + 3.86 [ water depth ] }
2 = (5)
Water depth
{ }
110.31 0.5
{0.065(1)2 + 3.86 [0.563] }
2 = = {5.32 sec −1 } Hijlan Creek
0.563
{ }
0.21 0.5
{0.065(1)2 + 3.86 [2.37] }
2 = = {0.51 sec −1 } Euphrates River
2.37
{ }
Figure 4. Hijlan water Physico-chemical fluctuations
The onset of anoxic conditions is proximately followed by DO mixing zone (Figure 5, DO),
initiated by the water of Euphrates main body, which is defined as three eddies of DO plume
ranging from 4.5 to 6.5 mg/L. At the end portion of the DO plume, Euphrates water was re-
12oxygenated by an aeration rate (K2) of 0.51(sec-1) until the DO concentration reached 7.5 mg/l. The reverse phenomenon of BOD5 concentration occurs in Hijlan Creek, as the concentration decreases from 5.5 mg/l to 1.8 mg/l towards the mixing zone (Figure 4), due to air oxygenation in the direction of streamflow. This is followed by mixing-dilution in the Euphrates water of less than 1mg/l of BOD5 concentration (Figure 5, BOD5). Comparison of the measured BOD5 values with the water quality standard indicates the water in the monitored zones is fair for the purposes of aquatic life but not recommended for drinking. Figure 5. Spatial distribution map of pH, DO, BOD5, and NO The observed concentration of nitrate (0.2 to 2 mg/l) in the zone of Hijlan inflow and Euphrates River is less than the permissible limit for drinking (Figure 5, NO3). No observable phenomena 13
of spatial mixing and dilution were detected because of alternative Redox reactions (water column

oxygenation), bacterial nitrification to nitrate, and/or denitrification to atmospheric as N2 is

dependent on the amount of organic matter (Stumm and Morgan, 1981). However, the phosphate

concentrations were not measured at or above the detected analysis limit of 0.05 mg/l.

4.3. Self-purification factor

Dissolved oxygen deficit, saturated DO concentration, and concentration of DO (downstream)

detected in DO plume (Figure 5 DO) were used to investigate the self-purification factor

depending on equation (2). Therefore, the deoxygenation coefficient and the reaeration

coefficient must be calculated in order to obtain a self-purification factor as shown in

equations 6,7, and 8.

 = 1 − 2 (6)

Where: bt denotes ultimate first stage BOD5 of the mix at the point of discharge (1.1 mg/l) detected

in BOD5 plume (Figure 5 BOD5), k1 deoxygenation coefficient (sec-1), k2 reaeration coefficient

(sec-1), t; time (sec).

 distance of mixing(m) 50
time(sec) = m = =21 sec
 water velocity( ) 2.37
 sec

The model uses the coefficient k1, which is dependent on the contaminant characteristics while

the re-aeration coefficient k2 is dependent on water temperature, velocity, and depth of the river.

The reaeration coefficient (k2) value is 0.51 sec-1 as previously calculated. From equation (6) (k1)

is:

 [( ) + 2 ]

 1 = (7)

 9−5
 [( 21 ) + 0.51 ∗ 4]
k1 = = 2.03 sec −1
 1.1

 14
After integration, Equation 6 (Waite et al., 1977; Kiely, 1998; Omole and Longe, 2012) gives: (f)

= Self-purification factor, which is defined by equation (8):

 k
 f = k2 (8)
 1

0.51
 = 25%
2.03

The ability of the river water self-purification is a significant measure of river quality. When the

contaminants in the waterways are outside the purification capacity of the river, they create

significant pollution of the water system (Tien et al., 2019). The result of self-purification

indicated that the Euphrates river has a good ability to purify the pollutants coming from the

Hijlan springs due to the velocity of the water flow in the study area. In addition, the algae in the

Euphrates river help water to recover the rate of dissolved oxygen values that caused self-

purification.

4.4. Temperature and Turbidity Plume

Water temperature is frequently being used as a “tracer” to indicate the dilution and spatial

distribution of other important water quality parameters that may occur within a mixing zone

if the water temperature differential occurs. Domestic and/or wastewater is often warmer than

the ambient environment. Therefore, thermal detection could be used to monitor the effects of

sewage discharges on recreational areas. The water temperature of Hijlan Creek is 25.6°C

(hypothermal water), which decreases gradually to 24.6 °C with the flow direction (Figure 4)

as it is affected by air temperature (18 °C). Here and in the last 50 meters of Hijlan valley, a

mixed zone appears as shown in Figure 6 (Temp). This zone was characterized by a water

temperature range of 22.6 °C to 24.6 °C, which is formed due to water mixing between Hijlan

Creek (>24.6 °C) and the main body of Euphrates River (
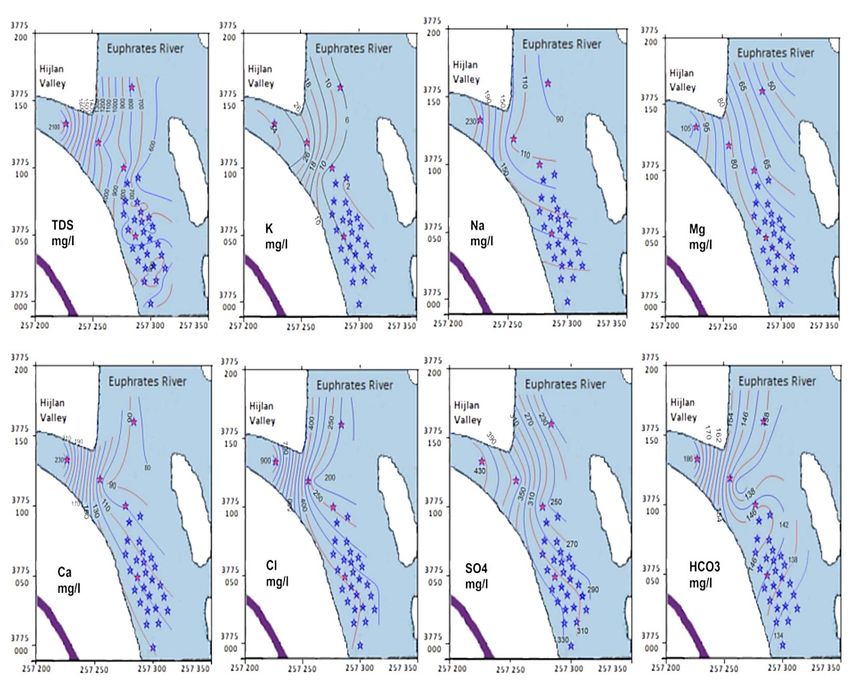
the Euphrates River. The recovery zone of tepid water with a temperature of < 23.4 °C was

detected in the last monitored water points.

Turbidity is a water clarity measure that indicates the amount of debris in the water, which limits

the passage of light. It is expressed by the nephelometric unit (NTU). Light scattering turbidity

measurements were taken at depths ranging from 10 to 35 cm. The lowest turbidity value of less

than 0.7 NTU was recorded during low wind speed in the confluence zone, which gradually

increased downstream reaching 1.02 NTU (Figure 7, Tur). Comparison of the turbidity values

with the water quality standard indicates the healthy limit for aquatic life. Normally, well-run

municipal supplies have less than 0.5 NTU before disinfection and should be regulated to an

average of 0.2 NTU or less.

 Figure 6. Spatial distribution map of Temp, Tur, EC, TH, Cd, Co, Cu and Mn

 16
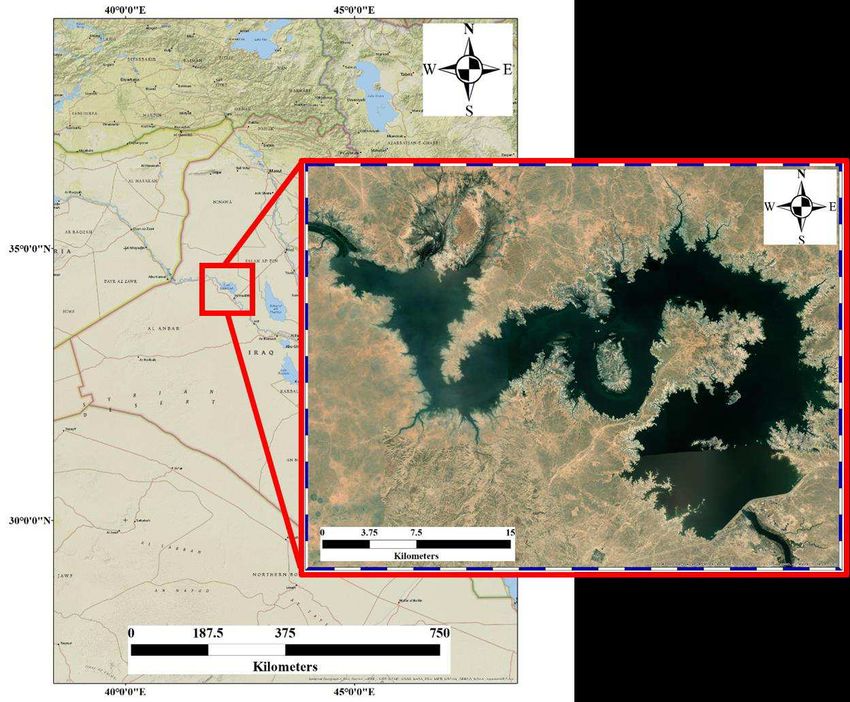
4.5. Electrical conductivity (EC) and Total Dissolved Solids (TDS) Plumes

The mixing of the Euphrates River with Hijlan Creek water, which possesses different electrical

conductivities, can also exhibit TDS differentiation. The electrical conductivity values ranged

from 2771 to 5076 µS/cm, while the TDS values vary between 2100 and 3640 mg/l, within a

Hijlan stream (Figure 4). Under a condition of dilution gradient of 11.2 µS/cm per meter and 10

mg/l per meter, the EC and TDS exhibit a range of 800 - 2700 µS/cm and 600 - 2100 mg/l,

respectively (Figure 6, EC and Figure 7, TDS). The results show a direct relationship between the

TDS plume and conductivity measures. Similar to conductivity, higher TDS concentrations were

measured at the shoreline of the Euphrates River, where the shallow depth of the confluence zone

causes water to mix vertically with rapid linear dilution. The confluence zone also exhibits full

lateral dilution towards downstream sectors, depending on river bathymetry, water velocity, and

discharge, to form the plume boundary interaction.

The total hardness is a measure of the calcium (Ca2+) and magnesium (Mg2+) content of water

and is mainly used to assess the quality of water supply as an industrial water source. Variations

in hardness reflect changes in dissolved water constituents, induced by water chemistry changes

(Langmuir 1997). The water that flows from Hijlan Creek exhibits a higher hardness value (very

hard water) than river water at the upstream site. A decrease in hardness concentration caused by

discharge dilution was visibly observed at the site of mixing, indicated by the decline in TDS

value from1600 mg/l to 500 - 600 mg/l (Figure 6, TH).

The mixing-dilution gradient of cationic water chemistry, such as K, Na, Mg, and Ca within the

beginning part of the contaminated plume was 0.8, 0.66, 0.83, and 0.5 ppm/meter respectively

with an average of 0.69 ppm/meter (Figure 7). The identified enrichment gradient relative to the

river upstream in the mid and the tail of the plume reached 0.11, 1.06, 0.26, and 0.27 ppm/meter

with an average of 0.43 ppm/meter. The difference between concentration dilution mechanisms

in the onset of mixing, which is higher than the enrichment mechanism, is attributed to the water
 17
velocity and discharge differences, where the concentrations of the chemical ions are highly

influenced by river flow dilution (Pasquini and Sacchi, 2012).

 Figure 7. Spatial distribution map of TDS, K, Na, Mg, Ca, Cl, SO4, and HCO3

The iso-concentration contour maps of the anionic water chemistry (Cl, SO4, and HCO3) (Figure

7) closely follow the spatial distribution TDS content (positive relation) and pH values (an inverse

relationship). This is likely due to alternate impacts of dilution and oxygenation mechanisms. The

mixed water is slightly alkaline due to buffer bicarbonate (concentration range of 134 to 186

mg/l), caused by changes in water chemistry. Despite the low concentration of trace elements of

copper and cadmium, their distribution is similar to that of dissolved ions, while no effect of

spring water on the Euphrates was observed for manganese (Mn) and cobalt (Co). The changes

in their concentrations are attributed to the conditions of river water movement and may be
 18
consistent with re-suspension of sediments from the bottom and solubilization of Mn and Co

elements present in the sediment.

4.6. Contaminants Loads and Mixing Mechanism

The Euphrates has been subjected to chemical hazards contamination resulting from springs

outflow. Thus, it is important to assess the degradation degree of the river and its effects of

contamination on human health and fishery survival. The daily load discharge of contaminants to

the Euphrates was calculated using a standard flux-based algorithm according to the metrics of

instantaneous discharge and concentration (Little and Marsh, 2005; Johnes, 2007), where:

 ℎ ( )

 3
 = ℎ ( ) ( ) ( ) ( ) 10 − 6 (9)

The daily loads of contaminants observed during the monitoring phase are listed in Table 4. The

concentrations of anions and cations account for
(230 / − 152 ⁄ )
 % = { } 100 = 7.1%.
 (1330 / − 230 / )

The results imply that 7.1% of Cl- in the confluence zone is derived from the Euphrates upstream

and 92.9% comes from Hijlan Springs Creek with no storm runoff. The multi-source water

condition is attributed to enrichment caused by direct brackish disposal water. These percentile

results were calculated under the following conditions:

 1- Hijlan Creek water discharged into Euphrates River was 316,224 m3/day, with 420 tons/day

 and 1020 tons/day for chloride and TDS load discharge, respectively.

 2- The upstream water discharge during the period of observation was 5.7 x 10⁶ m3 /day,

 with 867 ton/day and 3836 ton/day for Cl and TDS load discharge, respectively, passes

 through the Euphrates River in the upstream sector.

 3- The downstream discharge during the period of observation was 6.02 x 10⁶ m3 /day, with

 1287 tons/day and 4856 tons/day for Cl and TDS load discharge, respectively passes

 through the upstream river sector.

Table 4 Daily and annual disposed loads of Hijlan Springs Creek to the Euphrates River
 Variables Conc. Load. tons Contaminants Load Total loads disposal
 mg/l /day %
 K+ 36 11.384 1.116
 Na+ 556 175.820 17.237
 Mg++ 207 65.458 6.417
 Ca++ 338 106.883 10.478 Average Water Discharge (Q)
 Cl- 1330 420.577 41.232 =316224 m3/day
 SO4-- 555 175.504 17.205
 HCO3- 199 62.828 6.159
 NO3- 1 0.316 0.031
 PO4-3
in the enrichment of ions. Carbonate rocks (limestone, dolomitic limestone, and dolomite) of Ana and Euphrates Formations were partially dissolved, thus releasing Ca, Mg and HCO3 into the aquifer. The high concentration of Na and Cl in the spring water is attributed to partial mixing of connate water with the meteoric water. Springs are resultant features of topography and crosscutting of the Abu Jir Fault Zone (Awadh and Abdul Al-Ghani, 2013; Bayan et al., 2020), where a set of aquifers are found along the fault planes. A Balneological water quality assessment was conducted according to the minero–medicinal Spa definitions (Jordana and Batista, 2004), since the chemical properties of the spring water and its mixing with the Euphrates water can significantly affect human health. According to Komatina (2004); Agishi and Ohatsuka, (1998), a minero–medicinal water can be classified based on total mineralization, ion concentrations and trace composition, acidity or alkalinity, and temperature. For Balneo-therapeutic assessment, some physicochemical parameters are compared with the well-known guidelines such as the European Union, (2009) and US Spas (Lund, 1996 and Eaton, 2004). Consequently, values of pH, TDS, TH, Ca+2, Mg+2, Na+, SO4=, Cl-, HCO3-, NO3-, Pb, Zn, Fe, Mn, Cu, and Cd in the spring and the mixture of Hijlan Creek with the Euphrates waters are consistent with those of international Spas. Hence, the sample waters can be used for therapeutic purposes, beneficial for human well-being, and remedy for multiple diseases. The temperature of Hijlan water is described as being tepid to hypothermal (21.2-25.6°C), which means it requires heating to be used as thermal water (38 – 44 °C) for therapeutic application (Matz et al., 2003). H2S measurements of water flowing from Hijlan springs indicate a small amount of H2H dissolved in water which appears at H1 and fades away at H5 (Table 2). These concentrations could be beneficial in the use of Creek Hijlan water as a balneological therapy. Generally, the water of Hijlan Creek is unsafe to drink due to the higher concentration of major cations and anions in comparison to the standard limits set by the World Health Organization (WHO, 2011). 21
Hijlan Springs Creek was assessed for aquatic life purposes using the physicochemical

parameters, such as temperature and existent metals (iron, nickel, copper, zinc, cadmium, and

lead), as provided by Svobodova et al., (1993). The recommended guideline limit values for fish

farming including the optimal pH range of 6.5 – 8.5 and a water temperature of approximately 15

°C. The tepid hypothermal water of Hijlan springs is unsuitable for aquaculture, given that its

nitrate content (about 1 mg/l) is lower than the guideline limits, and the H2S concentration (1 – 2

mg/l) exceeds the guideline limit (0.002). Based on the results, the Hijlan springs water appears

unsuitable for fish farming. The toxic Fe content for fish cyprinid culture is accepted for

concentrations less than 0.2 mg/l. Therefore, the water of Hijlan Creek is acceptable since it has

a Fe concentration of zero (0). The water is also healthy in terms of the concentration of Ni, Cu,

Zn, and Pb, except for Cadmium, which exceeds the guideline limit.

5. Conclusions

This study focuses on an active hydrodynamic confluence zone with a water residence time of <

5 minutes, which is subjected to mixing of the water discharges of Hijlan Creek (316,224 m3/day)

and Euphrates River (5.7 x 10⁶ m3/day). A mass transport plume of minero-medicinal water was

detected at a distance of 150 meters from the mouth of the confluence, which acts as a single point

source of 1020 tons/day discharge for total dissolved load into receiving water. Although the base

flow water of Hijlan Creek is classified as minero-medicinal water and can be used for water

therapeutic purposes, the Creek water discharge is considered a point source of pollution, which

adds different contaminants of up to 372,300 tons/year. The discharged load attenuated

downstream due to a mixing discharge rate of 5.5% from Hijlan Creek versus 94.5% from

Euphrates River. Accordingly, the concentration dilution rate calculated from Cl- plume show

that 92.9% of Cl- is derived from Hijlan Creek and 7.1% comes from the Euphrates upstream.

The mixing-dilution processes within DO and BOD5 plumes were generated in a condition of

 22
self-purification factor equal to 0.25, de-oxygenation coefficient (k1) equals to 2.03 sec-1 and re-

aeration coefficient (k2) equals to 0.51 sec-1.

Numerous Physico-chemical plumes were detected, including plumes originating from the Creek

collector springs. Water temperature and other important water quality variables are used as a

“tracer” to define the dilution-enrichment boundaries and the spatial distribution of their

concentration within the mixing zone. The mass transfer of the TDS concentration within the

mixing TDS plume as represented by a dilution gradient reached 10 mg/l per meter with the flow

direction. The chemical mixing occurred when parcels of Creek brackish water meet parcels of

the Euphrates freshwater under different water velocity conditions, causing changes of ionic

concentration. Neutral water of Hijlan Creek mixed with slightly alkaline water of the Euphrates

River forming a plume of 7.4 pH in the confluence zone. It returns to its pH values as observed

at the upstream site. Three anomalies of dissolved oxygen concentration plumes of 4.5 to 6.5 mg/l

were observed at the same site of temperature plume. At the end portion of the DO plume the

Euphrates water was oxygenated at the rate of 7.5 mg/l to create an opposite trend phenomenon

of BOD5 concentration then decreases downstream reaching 1.8 mg/l. The decreasing

phenomenon in BOD5 values is attributed to the external input of oxygen from the solubilization

of atmospheric oxygen and discharge dilution mechanism, where most of the chemical ions and

trace elements concentration are highly influenced by river flow dilution.

Acknowledgments

The authors are deeply grateful for Prof. Bayan Muhie Hussien's significant contribution to this

work. Prof. Hussien's passed away (may his soul rest in peace) during the final stage of this work.

 23
References

Abdul Razzak, M.I., & Zaynal, M.S.(2012). The use of tri-geophysical methods for concealed
 karst cavities location near Haqlaniyah town. Iraqi J. of Science, 53(2), 341-352.
Agishi, Y., & Ohatsuka, Y (1998) Presents features of Balneo therapy in Japan. Global Environ
 Res 2:177–185
Al Hadithi, Kh. I, (1994). Hydrology and Hydro geochemistry of Al Qadisiyia Reservoir Dam,
 Unpublished Thesis, Iraq, Baghdad University, College of Science. 208 p.
Al Hamdani, M.A., Fayadh, A. S., & Hussien, B, M, (2010), Probable pollution study in
 Euphrates River between Qa’im and Falluja during (2007 – 2008) water years. Ministry of
 Higher Education and Scientific Research, University of Al –Anbar, Center of Desert
 Studies. Unpubl. Study
Al Hamdany, M. A., Fayadh, A. S., Hussien, B. M., Salim, S. A., & Abed, M. A, (2012). Sources
 of Ions and Trace Elements in the water of Euphrates River from Qaem to Baghdadi
 (statistical study). I.B.G.M, ISSN 1811-4539. S.C OF G.S. M., 8(1).
Al Jabbari, M, H, Hassen, Q, M, Emad, M, A, (2002); National Programme in the best used of
 water resources within Euphrates basin. Ministry of Agriculture, Baghdad, 520 p.
APHA, (American Public Health Association), 2012. In: Eaton, A.D., Clesceri, L.S., Greenberg,
 A.E. (Eds.), Standard Methods for the Examination of Water and Wastewater, twentysecond
 ed. APHA, Washington, ISBN: 978-087553-013-0, p. 1360.
APHA, AWWA, WEF, (1995). Standard methods for the examination of water and wastewater,
 (19th edition), Washington.
Awadh, S. M, & Abdul Al-Ghani, S, (2013). Assessment of sulfurous springs in the west of Iraq
 for balneotherapy, drinking, irrigation and aquaculture purposes. Environmental
 Geochemistry and Health, ISSN 0269-4042, DOI 10.1007/s10653-013-9555-6., 35 (4).
Barcelona J, Gibb, P, Helfrich A, Garske E, (1985). Practical Guide for Groundwater Sampling,
 EPA 600u2-85 104, US, Environmental Protection Agency, Robert S. Kerr Environmental
 Research Laboratory, Ada, OK, pp. 78 -80.
Bayan, M. H; Muwafaq, A. R and Husam, N. M. 2020. Estimation of Corrosion and Encrustation
 from Groundwater Chemistry of the Aquifers: A case study of Al Hammad Zone.
 Environmental Nanotechnology, Monitoring & Management.
 https://doi.org/10.1016/j.enmm.2020.100334.

 24
Bayan, M.H., Muwafaq, A.R., Marwan, M.F. (2020). Characterization and behavior of Hydrogen
 Sulfide plume sreleased from activesulfide-tarsprings,Hit-Iraq.
 AtmosphericPollutionResearch. 11. 894 -902.
Brikowski, T, (2011). Lab Notes, Hydrogeology Outdoor Laboratory. GEOS 4430, Geosciences
 Dept., U. Texas-Dallas, 51 p.
Consortium, Y, (1981). Regional hydro geological study for block No.5 (Rutba area) & for block
 No.7 (Ramadi-Ana-K-160), Unpubl. Study. Ministry of Irrigation.
Cruz, M. A. S., Gonçalvez, A. A., de Aragão, R., de Amorim, J. R. A., de Mota, P. V. M.,
 Srinivasan, V. S., et al. (2019). Spatial and seasonal variability of the water quality
 characteristics of a river in Northeast Brazil. Environmental Earth Sciences, 78, 68.
Delvigne, G. A. L. (1980). Natural reaeration of surface water. WL/Delft Hydraulics, Report on
 literature study R1149 (in Dutch), Delft, NL.
Eaton J (2004). Balneotherapy, hydrotherapy–therapeutic study. The healing properties of the
 Tecopa hot spring manual water. http://www.delightshotspringsresort,balneotherapy.
European Union. (2009). Directive 2009/54/EC of the European parliament and the council, of
 18 June 2009, on the exploitation and marketing of natural mineral waters. Official Journal
 of the European Union, OJ L 164, p. 58.
Fayadh, A. S., Hussien, B. M., Al-Hamdani, M. A., Saifuldeen, A., Salim, S. A., Mukhlef, H. N,
 & Abed, M. A, (2016). Hydrologic System of Euphrates River (Spatial Analysis) Between
 Qaem and Falluja. I.B.G.M, ISSN 1811-4539. SCGSM. 12(1) 1-18.
Fregoso-López, M.G., Armienta-Hernández, M.A., Alarcón-Silvas, S.G. et al. Assessment of
 nutrient contamination in the waters of the El Fuerte River, southern Gulf of California,
 Mexico. Environ Monit Assess 192, 417 (2020). https://doi.org/10.1007/s10661-020-
 08354-7.
Gao, Y., Yu, J., Song, Y., Zhu, G., Paerl, H. W., & Qin, B. (2019). Spatial and temporal
 distribution characteristics of different forms of inorganic nitrogen in three types of rivers
 around Lake Taihu, China. Environmental Science and Pollution Research, 26, 6898–6910.
Gurnell AM, Scott SJ, England J, et al. Assessing river condition: A multiscale approach designed
 for operational application in the context of biodiversity net gain. River Res Applic. 2020;1–
 20. https://doi.org/10.1002/rra.3673
Helsel, D.,& Hirsch, R, (2002). Chapter A3, statistical methods in water resources. Techniques
 of Water-Resources Investigations of the United States Geological Survey, Book 4,
 Hydrologic Analysis and Interpretation, 510 p. http://water.usgs.gov/pubs/twri/twri4a3/
 25
Hussien, B.M, (2010). Hydrogeological Condition within Al -Anbar Governorate.J. of Anbar
 Univ. for Pure Science, 4(3) 97-111.
Jena V, Dixit S, Gupta S. Assesment of Water Quality Index of Industrial Area Surface Water
 Samples Int. J. Chem, Tech. Res. 2013; 5(1):278-283.
Johnes, P.J., (2007). Uncertainties in annual riverine phosphorus load estimation: Impact of load
 estimation methodology, sampling frequency, base flow index and catchment population
 density. J. Hydro. 332, 241–258.
Jordana, S., & Batista, E, (2004). Natural ground water quality and health. Geologia Acta
 2(2):179–188.
Kiely, G. Environmental Engineering; McGraw Hill (U.K.) Ltd (1998).
Komatina, M. M, (2004). Medical geology: Effects of geological environments on human health
 (Vol. 2, p. 502). Amsterdam: Elsevier Science.
Langmuir, D., (1997). Aqueous Environmental Geochemistry, Colorado School of Mines.
 Prentice Hall. Upper Saddle River, New Jersey 07458, 618 p.
Little wood, I.G., & Marsh, T.J., (2005). Annual freshwater river mass loads from Great Britain,
 1975–1994: Estimation algorithm, database and monitoring network issues. J. Hydro., 304,
 221–237.Water 2014, 6 179
Lund, J (1996). Balneological use of thermal and mineral waters, 25(1). Elsevier Science, Great
 Britain, 103–147
Mahdi, A.H.I., Sissakian, V.K., Amin, R.M., Salman, B.S & Hassan, F.A. (1985). Geological
 Report on the Haditha area. Part 1, GEOSURV, Int. Rep. No.1523.
Marta T, Damia B, Roma T. Surface Water Quality indices for the analysis of data generated by
 automated sampling networks. TrAc Trends. Anal. Chem, 2010; 29(1):40-52.
Mather, J. R, (1974). Climatology, Fundamental and application. Mc Graw Hill, USA.
Matz, H., Orion, E., & Wolf, R. (2003). Balneotherapy in dermatology. Dermatologic Therapy,
 16, 132–140.
Morel, F. M.M., & Hering, J.G, (1993). Principles and Applications of Aquatic Chemistry. J.
 Wiley & Sons, New York. 588 p.
Mullaney, J. R., Lorenz, D.L., & Arntson, A.D., (2009). Chloride in Groundwater and Surface
 Water in Areas Underlain by the Glacial Aquifer System, Northern United States National
 Water-Quality Assessment Program, Scientific Investigations Report 2009–5086. U.S.G. S,
 Reston, Virginia.

 26
Muwafaq A. Rabeea; Ahmed S. Al-Rawi; Osama J. Mohammad; Bayan M. Hussien. (2020). The
 residual effect of fish farms on the water quality of the Euphrates River, Iraq. Egyptian
 Journal of Aquatic Biology & Fisheries. 24(4): 549 – 561
Omole, D., & Longe, E., (2012). Re-aeration Coefficient Modeling: A Case Study of River
 Atuwara in Nigeria. Research Journal of Applied Sciences, Engineering and Technology,
 4, 1237-1243.
Pasquini, A.I., & Sacchi, G.A., (2012). Hydrochemistry and nutrients dynamic in the Suquía
 River urban catchments, Córdoba, Argentina, Environ. Earth Sci, 65, 453–467.
Robert M. Bethea (1973) Comparison of Hydrogen Sulfide Analysis Techniques, Journal of the
 Air Pollution Control Association, 23:8, 710-713, DOI: 10.1080/00022470.1973.10469832.
Shelton, L., (1994). Field Guide for collecting and processing stream- water samples for the
 National Water Quality Assessment Program. USGS Open-File Report 94-455. Sacramento,
 California. U.S. Geological Survey. NAWQA Field Technical Support. Placer Hall 6000J
 Street. Sacramento, Ca. 95819-6129.
Sissakian, V.K. and Fouad, S.F., 2012. Geological Map of Iraq, scale 1:1000000, 4th edition. Iraq
 Geological Survey Publications Baghdad Iraq.
Sissakian, V.K., & AL-Mousawi, H, A. (2007). Karstification and related problems, examples
 from Iraq. Iraqi Bull of geology and mining, 3(2) 1-17.
Sissakian, V.K., & Hafidh, S.Q. (1994). The geology of Haditha Quadrangle. GEOSURV, Int.
 Rep.no.2257.
Streeter, H., & Phelps, H., (1925). A study of the pollution and natural purification of the Ohio
 River. U. S. Public Health Service .
Stumm, W., & J.J. Morgan. (1981). Aquatic Chemistry. An Introduction Emphasizing Chemical
 Equilibria in Natural Waters. 2nd Edition. J. Wiley & Sons, New York. 780 pp.
Svobodova, Z., Lloy, R., Machova, J., & Vykusova, B. (1993). Water quality and fish health.
 EIFAC, technical paper 54, FAO, Rome, p. 71.
Techno promo export (1978). The project on the Euphrates River, Republic of Iraq, Technical
 Design, Vol.1, Natural condition, Moscow.
Tien Zubaidah, Nieke Karnaningroem, Agus Slamet. (2019). The Self-Purification Ability in the
 Rivers of Banjarmasin,Indonesia. Journal of Ecological Engineering,20(2): 177–182.
 https://doi.org/10.12911/22998993/97286.
Tuyet T.N. Nguyen; Julien Némery; Nicolas Gratiot; Josette Garnier; Emilie Strady; Dan P.
 Nguyen; Viet Q. Tran; An T. Nguyen; Son Tung Cao; Trang P.T. Huynh. Nutrient budgets
 27
in the Saigon–Dongnai River basin: Past to future inputs from the developing Ho Chi Minh
 megacity (Vietnam). (2020). River Research and Applications, 36(6): 974-990.
 https://doi.org/10.1002/rra.3552.
USEPA, (2000); National water quality inventory: 2000 report. EPA-841-R-02-001.
Van Pagee, J. A. (1978). Natural reaeration of surface water by the wind. WL/ Delft Hydraulics,
 Report on literature study R1318-II (in Dutch).
Vandana Singh; Nem Kumar Nagpoore; Jaichand; Alok Lehri. (2020). Monitoring and assessment
 of pollution load in surface water of River Ganga around Kanpur, India: A study for
 suitability of this water for different use. Environmental Technology & Innovation, 18,
 100676. https://doi.org/10.1016/j.eti.2020.100676.
Waite, T.; Freeman, N. Mathematics of Environment Processes. Lexington Books, London.
 (1977).
Wetzel, R.G. (1983). Limnology. 2nd Edition. Saunders College Publishing, Philadelphia. 767
 pp.
WHO (2011) “Guidelines for Drinking-water Quality” 4th Edition, 541 p. WHO Library
 Cataloguing-in-Publication Data. (NLM classification: WA 675). Cover designed by WHO
 Graphics, Switzerland. Typeset by Value Chain, India. Printed in Malta by Gutenberg.

 28
You can also read