Source-Detector Spectral Pairing-Related Inaccuracies in Pulse Oximetry: Evaluation of the Wavelength Shift - MDPI
←
→
Page content transcription
If your browser does not render page correctly, please read the page content below
sensors
Article
Source–Detector Spectral Pairing-Related
Inaccuracies in Pulse Oximetry: Evaluation of the
Wavelength Shift
Olivier Tsiakaka 1,2, *,† , Benoit Gosselin 1,2     and Sylvain Feruglio 3, *,†
 1    Department of Computer and Electrical Engineering, Université Laval, 1065 Avenue de la Médecine,
      Quebec, QC G1V 0A6, Canada; benoit.gosselin@gel.ulaval.ca
 2    CERVO Research Center, Quebec, QC G1J 2G3, Canada
 3    Sorbonne Université, CNRS, LIP6, F-75005 Paris, France
 *    Correspondence: olivier.tsiakaka.1@ulaval.ca (O.T.); sylvain.feruglio@lip6.fr (S.F.)
 †    These authors contributed equally to this work.

 Received: 5 May 2020; Accepted: 5 June 2020; Published: 10 June 2020

 Abstract: Pulse oximetry enables oxygen saturation estimation (S p O2 ) non-invasively in real time
 with few components and modest processing power. With the advent of affordable development
 kits dedicated to the monitoring of biosignals, capabilities once reserved to hospitals and high-end
 research laboratories are becoming accessible for rapid prototyping. While one may think that
 medical-grade equipment differs greatly in quality, surprisingly, we found that the performance
 requirements are not widely different from available consumer-grade components, especially
 regarding the photodetection module in pulse oximetry. This study investigates how the use of
 candidate light sources and photodetectors for the development of a custom S p O2 monitoring system
 can lead to inaccuracies when using the standard computational model for oxygen saturation without
 calibration. Following the optical characterization of selected light sources, we compare the extracted
 parameters to the key features in their respective datasheet. We then quantify the wavelength shift
 caused by spectral pairing of light sources in association with photodetectors. Finally, using the
 widely used approximation, we report the resulting absolute error in S p O2 estimation and show that
 it can lead up to 8% of the critical 90–100% saturation window.

 Keywords: pulse oximetry; wearable sensors; spectrum distribution; wavelength shift; sensor shift;
 calibration; Beer–Lambert Law; LED

1. Introduction
      Oxygen saturation measured in blood (Sa O2 ) has been assessed non-invasively by pulse oximetry
for decades. Pulse oximetry is a relatively easy technique that acquires photoplethysmographs (PPG),
which are important bio-signals for physiological assessment. This technology, employed in intensive
care units as well as in ambulatory procedures, enables the monitoring of the respiratory condition
of the patients and the evaluation of the state of their cardiovascular systems over time. Among its
advantages, this technique requires few low-cost components and can give results using a minimal
setup [1]. Its ease of use and the derived related patient data (respiratory rate, blood pressure, arterial
stiffness, etc.) open the way for advanced applications regarding neurovascular coupling [2–4],
thus making pulse oximetry an essential tool in hospital routine for rapid patient diagnosis. From basic
bedside monitoring in everyday care, its use has extended to diverse applications such as measuring
physical exercise performance [5–7], oxygen supply at high altitude [8,9], and quality of sleep [10,11].
Capabilities once reserved to high-end facilities are currently becoming widely accessible through
dedicated, low-cost, wearable biomedical sensor development kits to replicate the same systems that

Sensors 2020, 20, 3302; doi:10.3390/s20113302                                  www.mdpi.com/journal/sensors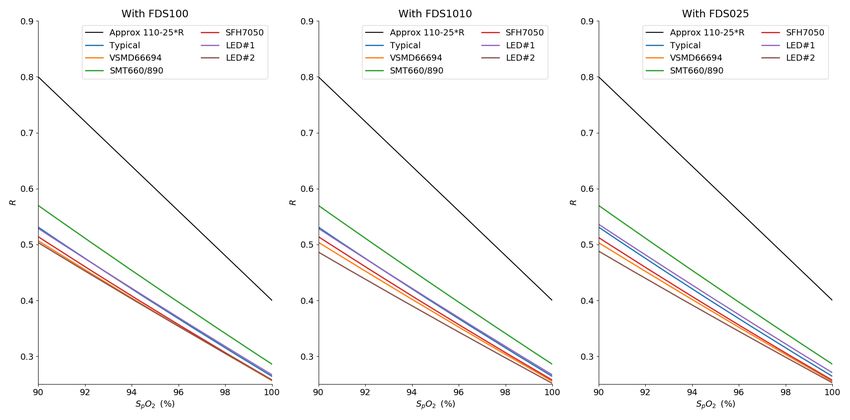
Sensors 2020, 20, 3302                                                                              2 of 17

are currently used in hospitals [12–17]. However, there is a a potential for inaccuracy in its primary
application for oxygen concentration quantification.
     The use of pulse oximetry has long been viewed with some suspicion regarding potential false
readings. Indeed, biological sources of inaccuracy such as skin pigments as well as intravenous dyes
and non-functional compounds of hemoglobin (the dyshemoglobins) are known to hinder the oxygen
saturation measurement optically, leading to falsely low or high readings [1,18]. Several attempts to
overcome this limitation have been investigated, but with no means of reducing the influence of such
light absorbents in typical dual wavelength pulse oximetry, designers have to include a certain error
margin in their systems and follow performance guidelines according to the standard in place [19].
     The generally accepted discrepancy claimed by manufacturers of pulse oximeters, between the
invasive measurement involving blood sampling and S p O2 , is typically contained within an error
margin of 4%, when healthy values of S p O2 range between 96% and 100%. It is admitted that this
level of accuracy is sufficient for regular applications (e.g., respiratory patients with a significant
decline in oxygenation) [20]. However, the notable inaccuracy prevents its utilization in advanced
research applications as long as the calibration process is performed according to the empirical
method (i.e., blood measurement on healthy, young volunteers) [1,21] on typical monitoring sites
(finger, ear lobes, tongue). Thus, this 4% margin raises concerns when this technique is applied to
fine monitoring or to investigate unusual locations such as the central nervous system [22–25] for
example, mainly because it relies on device-specific characteristics, including the optoelectronic parts
and the optical and geometrical properties of the tissues [26,27]. Moreover, the incorrect use of this
empirical computational model is not device-specific, therefore inducing additional inaccuracies in
the estimation of oxygen saturation. Although sensor testers can be used to validate manufactured
systems’ performances [28], we did not find any device-specific methods in the literature dedicated to
wavelength shift prediction in the conception phase for oxygen saturation error reduction.
     In this paper, we aim to raise awareness among designers that do not have access to calibration
data to guide the choice of optoelectrical components in pulse oximetry systems and to shine light
on the implications regarding the computational accuracy of S p O2 . To this end, we address the
discrepancies between the Beer–Lambert equation and the handy linear approximation with regards to
the real spectrum of light sources, far from the ideal narrow spectral width, and different photodetectors
with non-uniform responses. Moreover, in order to assist future designs, a simple evaluation of the
disagreement between the previous calculations is produced. Using few parameters available directly
in the datasheet of the components, the designer is guided in the choice of components to develop
a custom pulse oximeter with improved accuracy and performance. The datasets and the custom
scripts used to analyze the models during this study are made publicly available in a dedicated Gitlab
repository: https://gitlab.com/otsiakaka/wavelength-shift.
     This paper first introduces the theoretical background regarding pulse oximetry and the technological
choices. In the next section, we show the experimental setup utilized for this study, and we explain the
method used to produce the subsequent results before concluding.

2. Theoretical Background
     This section introduces the concept of operation for the non-invasive estimation of oxygen
concentration in peripheral blood using pulse oximetry. The underlying equations behind the
estimation are presented with their typical implementation in systems. The corresponding spectral
hypotheses supporting these equations are explained in the second part, and the link with the selection
of optoelectrical components is established.

2.1. Pulse Oximetry
     Pulse oximetry aims at quantifying the overall oxygenation of the monitored subject by measuring
the peripheral oxygen saturation (S p O2 ) non-invasively. As such, this method tries to approximate
Sensors 2020, 20, 3302                                                                                 3 of 17

the arterial oxygen saturation (Sa O2 ), which is the ratio of oxygenated hemoglobin (oxyhemoglobin)
concentration [HbO2 ] to the total hemoglobin concentration in the blood [ Hbtotal ] as follows:

                                                              [ HbO2 ]
                                             Sa O2 = 100 ∗                                                (1)
                                                             [ Hbtotal ]

Pulse oximetry is one of the optical spectroscopy techniques which attempts to quantify the chromophores
of the blood based on their distinct spectral signature regarding optical absorption. By using optoelectronic
components to cast a light flux onto tissues and detecting the transmitted (or reflected) light, an
oximeter is capable of estimating the HbO2 concentration in the capillaries relative to the rest of
the compounds of hemoglobin. The Beer–Lambert Law (BLL) allows the quantification of any
chromophore in a media—in the present case, hemoglobins in the tissues—-by relating at a certain
wavelength λ the absorbance of the media A(λ), or its corresponding transmittance T (λ), with the
incident light on the tissues I0 (λ) and the measured output intensity I (λ), as shown in Equation (2):

                                                              I (λ)
                              A(λ) = −ln ( T (λ)) = −ln             = ε X (λ)[ X ]d(λ)                    (2)
                                                             I0 (λ)

where ε X (λ) is the molar extinction coefficient of the chromophore X, [ X ] its concentration in the
media and d(λ) the optical path length. Applied to pulse oximetry, the variation of attenuation of the
light in time is considered mainly to be due to the blood. Thus, all the compounds of hemoglobin are
quantified to yield an accurate estimation of blood oxygenation. However, most pulse oximetry systems
only consider oxyhemoglobin and deoxygenated hemoglobin (deoxyhemoglobin, Hb), as shown in
Equation (1). The BLL is then extended as follows:

                                A(λ) = ε HbO2 (λ)[ HbO2 ] + ε Hb (λ)[ Hb] d(λ)                            (3)

The pulsatile arterial blood and other present tissues absorb and modulate the incident light passing
through them. This phenomenon forms the photoplethysmogram (PPG) signal, illustrated in Figure 1.
The variable portion (AC) of the signal is due to the light that is absorbed by the pulsatile blood (heart
rate modulation). A large constant (DC) component is superimposed on it, originating from the light
absorbed by soft tissues (e.g., bone, derma, fat, etc.), which is almost invariant in time compared to the
period of the heart rate. The AC to DC ratio, referred to as the perfusion index (PI), has long been used
to assess tissue blood flow [29].
      In order to discriminate the concentration of hemoglobin, a minimum of two light sources is
required to solve this equation for two unknowns (see Equation (3)). In the visible and near infrared
(NIR) range, considering the blood as the sole variable in time is useful when relating the attenuation
of light in the tissues with the oxygenation. One must use two distinct wavelengths where the molar
extinction coefficients are sufficiently different, thus measuring two PPG signals at λ1 and λ2 to
compute the ratio of PIs at each wavelength, defined by

                                                      AC (λ1 )/DC (λ1 )
                                             R(t) =                                                       (4)
                                                      AC (λ2 )/DC (λ2 )

where, as shown in Figure 1, AC (λi ) and DC (λi ) are the peak-to-peak component and the mean
value of PPG (λi ) over one cardiac cycle, respectively. This method, referred to as the peak and valley
method, is convenient when designing an oximeter as one can easily work with the PPG signal to
give an estimate of the S p O2 without having to compute the distinct concentration values first. Theory
shows that this ratio of ratios R(t) is related with the modulation of absorption in time and the change
of hemoglobin concentrations in

                                        ε HbO2 (λ1 )[ HbO2 ](t) + ε Hb (λ1 )[ Hb](t) ∆d(λ1 )

                           dA(λ1 , t)
                    R(t) =            =                                                      ,            (5)
                                        ε HbO2 (λ2 )[ HbO2 ](t) + ε Hb (λ2 )[ Hb](t) ∆d(λ2 )

                           dA(λ2 , t)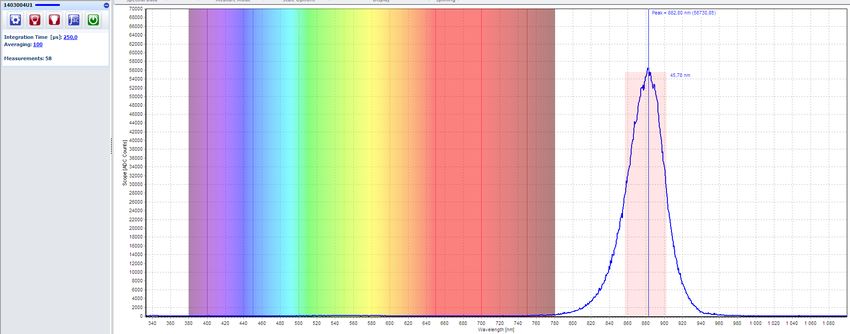
Sensors 2020, 20, 3302                                                                               4 of 17

provided that the modulated difference of the optical path lengths can be approximated as equal for all
the wavelengths; i.e. ∆d(λ1 ) ≈ ∆d(λ2 ). Finally, oxygen saturation can be computed with the following
equation, according to the BLL:

                                                         ε Hb (λ1 ) − ε Hb (λ2 ) R(t)
                         S p O2 (t) =                                                                 (6)
                                        ε Hb (λ1 ) − ε HbO2 (λ1 ) + ε HbO2 (λ2 ) − ε Hb (λ2 ) R(t)

      Figure 1. The photoplethysmogram (PPG) signal exhibits a large constant attenuation (DC) and a
      variable portion (AC) due to the heart rate modulation [22].

     In practice, other computational approaches are preferred in place of the absolute quantification
of oxygen saturation defined by the previous equation. Following a necessary calibration phase of the
system (which conducts to a lookup table), designers may use those hard-coded values in memory to
produce the S p O2 estimation corresponding to the measured R(t) value [21,30]. However, without
access to preliminary measurements on healthy subjects or a suitable reference adapted to the object of
study for device-specific calibration, present systems base their estimation on empirical data through
curve fitting (i.e., indirect calibration). To facilitate the implementation at low computational cost,
the estimation of Sa O2 uses different degrees of approximation, with the simpler and most used form
being the following linearized equation:

                                                   S p O2 (t) = aR(t) + b                               (7)

where a and b are fitting parameters of Equation (6). They are typically extracted from Figure 2.
The widely used values for the previously mentioned parameters correspond to extinction coefficients
at the typical wavelengths values of 660 nm and 940 nm [1,31], resulting in the following S p O2
calculation for a great number of oximetry systems:

                                                S p O2 (t) = 110 − 25 ∗ R(t)                            (8)

     Note that in the BLL and the definition of the ratio of ratios, several hypotheses must be made
to yield Equation (8); mainly, the light sources are presumed to be monochromatic, which means
that the illumination spectrum is assumed to be very narrow, and moreover, that the photodetector
responsivity is the same across all considered wavelengths.
     In the rest of this paper, we first report how the use of the derived values at the typical
wavelengths of those parameters induces an error due to the incorrect corresponding value of the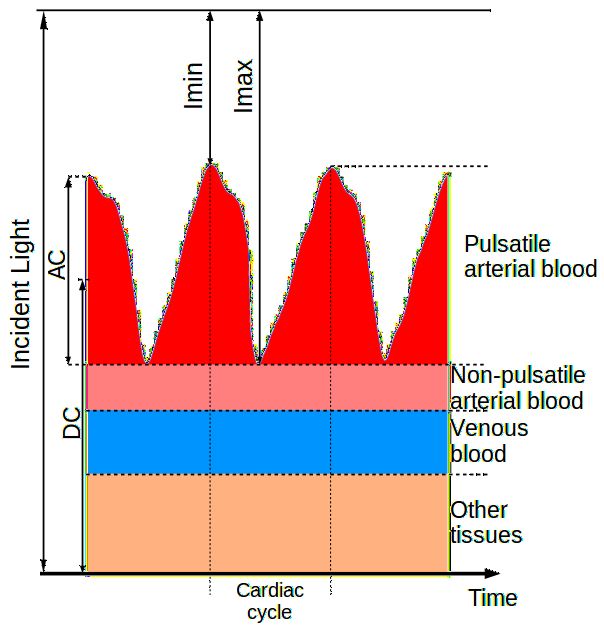
Sensors 2020, 20, 3302                                                                                5 of 17

molar extinction coefficients ε X (λ (i )). Secondly, we show that the distribution spectra shifts the
effective peak wavelengths, even for light sources at 660 nm and 940 nm, which can conduct to a
significant error of the S p O2 estimation that must be taken into account when using photodetectors
with non-uniform responses.

      Figure 2. Extinction coefficients spectra of oxyhemoglobin and deoxyhemoglobin in the visible and
      NIR range, adapted from [32].

2.2. Modeled Spectra
     In this section, the spectral response of silicon photodetectors and the emission spectra of
light-emitting diodes (LED), both typically employed for pulse oximetry, are presented and their
impacts are discussed. Both spectra are dependent on temperature, process and supply variations.
These unwanted effects are not the topic of this paper, but can be taken into account in the following
proposed generic models.
     An illustration of a typically used light source in oximetry can be found in Figure 3a, where
a Gaussian curve models the actual spectral distribution. In contrast with the infinitely narrow
monochromatic spectrum that would resemble that of a tabletop laser, a typical LED has the advantages
of being consumer-available, low-cost, chip-scale and power-efficient. For the optical measurement,
the drawbacks are visible in the resulting bell shape of the emitted intensity ILED (λ), fitting the
maximum value of the curve at λ peak , and its symmetrically spreading distribution spectrum around
that peak according to the full width at half maximum (FWHM), denoted as ∆λ, in the following
normalized equation:
                                                                              2
                                                                    λ−λ peak
                                                      −4ln(2)       ∆λ LED
                                       ILED (λ) = e                                                       (9)

Therefore, in contrast to the monochrome hypothesis of the light sources for the use of the BLL resulting
in Equation (6), the molar extinction coefficient for one LED is now a function of the wavelengths,
thus impacting the oxygenation estimation [33,34].
Sensors 2020, 20, 3302 6 of 17
(a) (b)
Figure 3. (a) Gaussian model typically used for source distribution spectra, compared to the idealistic
narrow spectrum (b) Relative spectral sensitivity of a typical silicon photodiode [35].
Moreover, the spectral sensitivity of the photodetector HPD (λ) is not ideally flat. In reality, it is
not constant along the wavelengths and exhibits a maximum according to the material characteristics.
For the purpose of this paper, and due to the lack of a closer yet simple model, we also modeled this
response by a Gaussian curve in
λ − λ 2
p
−4ln(2) ∆λ PD
HPD (λ) = e (10)
where λ p is the wavelength of peak sensitivity and ∆λ the range of spectral bandwidth. Figure 3b shows
the spectral distribution of the popular BPW34 photodiode used for low-cost oximeters, where the
peak sensitivity and the FWHM can be extracted for the model. It is important to keep in mind that
the photodetector response will sum all the wavelength contributions in the same PPG. Consequently,
the resulting photocurrent generated by the optoelectronic spectral responses affects the ratio defined in
Equation (4). In summary, the effective value of the extinction coefficient, denoted as εe f f , is described
by the following:
∑ ε X (λi ) ILED (λi ) HPD (λi )
ef f
ε X (λ) = (11)
i
The product of two Gaussian curves is a bell curve of the same type with a resulting
FWHM and center wavelength. One can estimate the effective parameters of this curve using the
following equation:
∆λ
∆λe f f ≈ p LED (12)
8ln(2)
The shift from the initial illuminating value δλ can be approximated using the following equation
for the resulting effective centre wavelength:
∆λ LED 2
λe f f ≈ λ LED + λ PD (13)
∆λ PD
| {z }
=δλ
Note that, in Equation (13), the applicable sign of the shift depends on the value of (λ LED − λ PD ), as it
tends to bring the center wavelengths together.
Since evaluating that the error induced by the wavelength shift strictly depends on the extinction
coefficients, computing the effective value of ε X cannot be directly integrated in the S p O2 estimation.
However, using the optical parameters of the components, we show in Figure 4a the effective values of
the shift for ε Hb and ε HbO2 using the selected light sources of this study. We paired them with regard toSensors 2020, 20, 3302 7 of 17
oximetry measurements; thus, one is in the red region of the spectrum and one in the NIR. Note that,
here, the generic pair refers to a generic red and infrared pair with a peak emission at 660 nm and 940 nm,
respectively, and with a spectral width of 20 nm and 50 nm, respectively. As illustrated, in contrast to
the ideal case in which the two sources in the pair have a monochromatic distribution (FWHM = 1 nm),
all pairs result in a different value for the extinction coefficient of Hb and HbO2 , thus producing an
incorrect estimation of the oxygenation if the linear Equation (8) is used in conjunction in the system.
Here, we use the TSL12T photodiode’s extracted characteristics [36], where each pair lends to an
absolute maximum shift for ε Hb of 174 L · mol−1 · cm−1 when the absolute maximum shift for ε HbO2 is
limited at 54 L · mol−1 · cm−1 . This difference in magnitude is explained by the fact that LEDs in the
NIR spectrum tend to exhibit a wider wavelength distribution than their counterparts in the visible
range, as we present in the optical characterization work shown later in this paper.
(a)
(b)
Figure 4. (a) Evaluation of the differential shift from the standard values of ε Hb and ε HbO2 for
different pairs of sources (red dots for the red source and grey dots for the IR source) with the
TSL12T photodetector. (b) Simulation of the deviation from the linear approximation according to the
Beer–Lambert Law (BLL) for different R-IR sources, zoom in the 90–100% region of saturation.
In Figure 4b, we evaluate the result of the effective molar extinction coefficients on the estimation
of S p O2 . As illustrated, we can see the difference between the widely used linear approximation and
the effective BLL curve for each pair according to the ratio of perfusion indexes. This representation,
zoomed in the 90–100% region of saturation, gives an insight into the absolute error produced by pulseSensors 2020, 20, 3302 8 of 17
oximetry systems when using the linear approximation. Our results show that in this critical saturation
area, where an error of 2% in the estimation of the saturation can already lead to an incorrect medical
diagnosis [28], the S p O2 can be overestimated by the linear approximation by up to 7%.
3. Materials and Methods
In the previous section, we have shown how the LED spectra and the photodetector sensitivity,
with their Gaussian-like broad peaks, can lead to shifted oxygenation measurements. In this section,
we introduce our experimental setup for the collection of real emission spectra from our selected light
sources, and we present the key optical parameters extracted.
3.1. Experimental Setup
The experimental setup is illustrated in Figure 5a. Each device under test (DUT) is placed at the
tip of the optical fiber using a customized holder to ensure a precise axial alignment with the core of
the optical fiber FC-UVIR1000-2-ME (Avantes, Inc., Apeldoorn, The Netherlands). The light sources are
driven with a stable current source, following the conditions in the respective datasheet, if mentioned;
if not, the standard forward current IF = 20 mA is used as the driving parameter value.
(a)
(b)
Figure 5. (a) Experimental measurement diagram of the setup used for spectra collection, (b) Screenshot
of an emission spectrum visualized through the software Avasoft with live identification of the full
width at half maximum (FWHM) and the peak emission.
The emitted photons are collected by the AvaSpec-ULS2048XL-USB2 spectrophotometer.
This equipment has a spectral resolution of 0.6 nm and covers the spectral range from 333 nm to
1100 nm, which suits our purposes for the near infra-red (NIR) range. Figure 5b shows the companion
software Avasoft used to configure the acquisition, with an example of an acquired spectrum presented,
plotted along with the wavelength with the visible spectrum in the background for reference. Since each
source has a different quantum efficiency, we selected a suitable integration time for each one to allow
the collection of an appropriate number of photons (arbitrary count unit in the software) to visualize
the spectrum with no saturation. The measurements are averaged 100 times to reduce the variability.
A dark correction is also applied to remove the influence of eventual light noise. The user is able toSensors 2020, 20, 3302 9 of 17
visualize in real time the emission spectrum of the device under test (DUT), as well as identifying the
peak wavelength and the FWHM of the source.
After visualization, the spectrum can be stored in a comma-separated values file for further
computation. For our study, we imported the spectra for manipulation with Spyder (Python 3.7).
All spectra, modeled and imported, are aligned on the same wavelength vector and normalized
for comparison. We over-sampled the sensitivity spectra of the extinction coefficients and the
photodetectors to reach the same resolution as the source spectra.
3.2. Selected Components
Table 1 summarizes the optical characteristics of the light sources that we selected for this
study. The LEDs characterized in this paper cover the typical range for pulse oximetry, starting
from around 620 nm up to 950 nm. One green light source is also included for completeness, as it
is part of a triple-wavelength device and could be used to extract the respiratory rate of the subject
from the corresponding PPG, thus providing an example of the main artifact of PPG for subsequent
removal [37,38]. The parameters mentioned in their respective datasheet are presented to evaluate the
impact of the actual spectra relative to the manufacturer’s data and the Gaussian modeling.
Table 1. Selected suitable LEDs for pulse oximetry. All LEDs were tested at room temperature
(25◦ C), under the same conditions mentioned in their respective datasheet to compare the spectral
measurements (i.e., if the forward current specified was 20 mA, we set our current source in the setup
as If = 20 mA) [39–48]. Values marked “x” were not reported in the corresponding datasheet.
From Datasheet Measured
Reference Manufacturer Package
λdom (nm) λ peak (nm) ∆λ (nm) λ peak (nm) ∆λ (nm)
LHQ974 OSRAM SMD 643 660 20 657 19
SFH4050 OSRAM SMD 850 860 30 857 21
SFH4248 OSRAM SMD 940 950 42 956 35
x 660 ± 10 20 662 16
VSMD66694 Vishay SMD
x 940 ± 20 40 934 57
x 650 ± 10 20 657 16
SMT660/890 Marubeni SMD
x 890 ± 15 75 883 46
530 ± 10 525 34 532 33
SFH7050 OSRAM SMD 655 ± 3 660 17 664 15
940 ± 10 950 42 954 44
660 x x 660 21
LED #1 “M” SMD
905 x x 899 68
x x x 664 22
LED #2 “D” SMD
x x x 895 62
In some cases, manufacturers report two specific wavelengths for a light source, λdom and λ peak ,
which are the dominant wavelength and the wavelength at peak emission, respectively. In our study,
when both are reported, the former is used in the Gaussian model, as it typically corresponds to
the highlighted optical key feature for an LED. In the case of the VSDM66694 and the SMT660/890,
only the peak emission is reported, so we used this value in our models. In the case of the commercial
devices, few values could be found for the parameters of the Gaussian curve; thus, only the measured
values could be used in our models.
We compare in this table the manufacturer’s values with our measured parameters on the
right-hand side, where the peak emission and the FWHM are extracted with the spectrophotometer
companion software. The dominant corresponding wavelength is not computed as its value is subject
to interpretation.
The last lines of our table present two commercial double-wavelength light sources used in everyday
care routines. Although their optical performances are comparable to our consumer-availableSensors 2020, 20, 3302 10 of 17
components, as we show here, the simulation using their characteristics underlines how the calibration
step is a valuable tool for correcting S p O2 estimation errors, when available.
As mentioned above, some manufacturers provide a better description of the spectrum of the
LED with two separate wavelengths. We do not consider multiwavelength sources or secondary peaks
here; instead, those two distinct parameters, namely λdom and λ peak , highlight the skewness of the
spectrum distribution. When provided, the dominant wavelength, otherwise noted as the centroid
wavelength λcentroid or center wavelength λcenter , represents the weighted mean of the spectrum. Thus,
an accurate model of the light distribution shifts from a Gaussian bell to a skewed Gaussian. The use
of this model has instead been applied to better shape the light source distribution [49]. Figure 6 shows
how these parameters fit into the skewed model.
Figure 6. The real model of the distribution spectra of a 940 nm LED source is a skewed Gaussian (left
or right leaning), modified from [46].
However, the different terms used to mathematically shape the tail and the decay do not fit all
cases. Thus, it is still recommended to use a bell curve as best overall representation [50]. Nonetheless,
in the absence of a fit for all skewed models, we used the manufacturer’s spectral sensitivity data
available for three typical cases of silicon photodiodes with our measured spectra of the LEDs to
evaluate the impact on the typical computation of oxygen saturation.
Figure 7. Normalized real sensitivity spectra of three commercial photodetectors (FDS100, FDS1010
and FDS025), adapted from [51].
Figure 7 illustrates real sensitivity spectra extracted from the manufacturers’ measurements.
The normalization allows us to appreciate the spectral shape of the selected photodiodes. The curves
of the FDS100 and FDS1010 differ greatly from the bell shape. Indeed, the FDS1010 shows a quasi
linear ramp along the wavelengths of interest, whereas the FDS025 exhibits a symmetry between the
typical chosen wavelengths. This feature has an impact on the sign of the shift presented earlier (see
Equation (13)) as the peak sensitivity is located between 660 nm and 940 nm.Sensors 2020, 20, 3302 11 of 17
Finally, we compute the absolute error in oxygen saturation measurement with pulse oximetry
considering the following equation:
BLL − Approx
∆SpO2 = ∗ 100% (14)
BLL
Here, we compute the error of the approximation (see Equation (8)) in relation to the effective BLL
(see Equation (6)) for each selected pair of sources, meaning that the error of the approximation is
computed along the R axis, taking the effective—i.e., shifted—values of the extinction coefficients.
4. Results
We first show in this section the results of our optical characterization for our selected LEDs.
The acquired spectra are plotted to illustrate the difference between the ideally narrow distribution
and the actual emission. Subsequently, we report the induced errors of these spectra for pulse oximetry
measurements, relative to the typical linear approximation.
4.1. Measured Spectra
The results presented in this section are computed for each source pair. Dual LEDs and commercial
devices are considered as such. One pair, the LHQ974 and SFH4248, is presented as a model for a
typical red and typical IR source, regarding their optical specifications, which are common among
their respective wavelength range for LED sources.
We show in Figure 8 the normalized measured spectra of the light sources selected in this study.
Once again, the spectra are paired with consideration to a typical oximetry measurement setup; i.e.,
one red source is paired with an infrared one. From this point on, the first pair (LHQ974-SFH4248) will
be considered as representative of a typical LED pair for oximetry with regard to their spectrum and
will be denoted as the typical pair.
Figure 8. Measured distribution spectra of our light sources by Red–IR pair.
As expected, all measured spectra exhibit several differences with the Gaussian model. First,
we can observe that the distributions are asymmetrical; indeed, all curves express a skew to the left
or the right for all sources. This observation is in agreement with the previously mentioned model
(see Figure 6).
Second, almost all of the LEDs have a secondary peak, whether close to the primary peak with a
similar intensity (IR LED VSDM66694 at the top center) or less dominant (IR LED SFH4248 at the topSensors 2020, 20, 3302 12 of 17
left, IR LED SFH7050 at the bottom left). This secondary wavelength can also be distant to the primary
peak, as seen with the LHQ974 (at the top left), where the red main emission is accompanied by a small
infrared feature. Although observable thanks to the optical characterization, we did not take these
stray peaks into consideration in our initial models. Indeed, those are not reported in the datasheet
by the manufacturers when the light source is not considered to be multiwavelength (two distinct
peaks at equivalent magnitudes in different color ranges). However, in practice, they contribute in the
effective value of the extinction coefficient (see Equation (11)).
Even though these deviations from the datasheet specifications (see Table 1) can be attributed
to the fabrication process, or the driving voltage-current variations, it appears clear that these
non-uniformities call for device-specific calibration.
4.2. Related Error in Quantification
The absolute extinction coefficient difference is presented in Figure 9a, where each LED pair is
evaluated as an emitter in pulse oximetry, with the aforementioned photodetectors (see Figure 7).
As expected in Equation (11), the different spectral sensitivities of the photodiode have an impact on
the effective extinction coefficient for each hemoglobin compound. Here also, the absolute maximum
shift is seen on ε Hb . However, one can see that the shift is maximal for light sources with a peak distant
from the standard 660 nm and 940 nm but also with a larger FWHM, as anticipated by Equation (13).
In Figure 9b, we illustrate the related deviation from the linear model along the R axis. In the
worst case with the FDS1010 photodetector, this deviation reaches 8% in the critical 90–100% saturation.
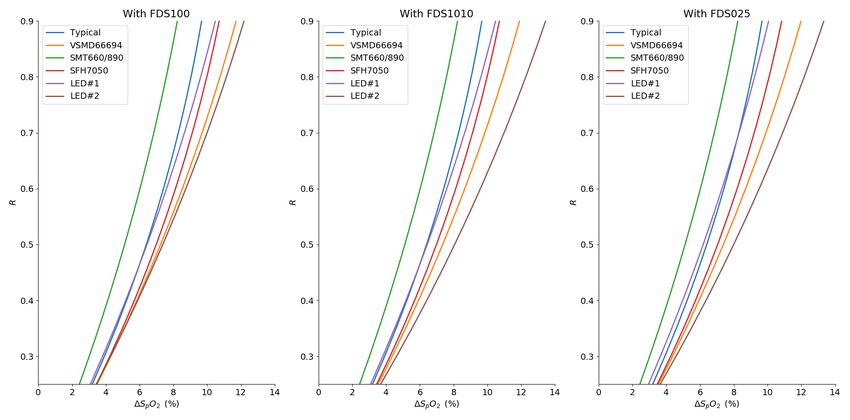
Finally, we show the absolute produced error in Figure 10 in the same R range, relative to the linear
approximation. As displayed, no configuration reaches an absolute error below 2% in the critical window.
(a)
Figure 9. Cont.Sensors 2020, 20, 3302 13 of 17
(b)
Figure 9. (a) Evaluation of the differential shift from the standard values of ε Hb and ε HbO2 for our
selected source pairs (red dots for the red source and grey dots for the IR source) (b) Simulation of the
deviation from the linear approximation according to the BLL for four our selected R/IR source pairs,
zoom in the 90–100% region of oxygen saturation.
Figure 10. Model prediction of the absolute error of S p O2 quantification for selected source pairs with
different photodetectors.
5. Discussion and Conclusions
Pulse oximetry is a versatile tool to quantify blood oxygen concentration in a non-invasive fashion.
It gives access to a vital bio-signal for rapid assessment of the overall condition of the patient as
well as local specific hemodynamics. However, in critical conditions, pulse oximetry lacks a general
calibration process. With this crucial phase being tissue and device-dependent at the component level,
a one-size-fits-all approach is hardly conceivable.
We showed in this paper that, taking into account the effect of the imperfections of the building
blocks of a pulse oximeter—namely the light source and the photodetector—one can predict how the
measurement will deviate from the absolute quantification provided by the BLL when using linear
approximation. In our study, we experimented with several pairs of LED to show how disregardingSensors 2020, 20, 3302 14 of 17
their optical characteristics can lead to computational inaccuracies. We revealed a S p O2 estimation
error up to 8% in the 90–100% range of the oxygen saturation. Moreover, through the evaluation of the
shift generated by this spectral mismatch and the source–detector pairing, we showed how this pitfall
can be avoided at the design phase with the few parameters provided in the datasheets.
Although calibration-free methods are explored, their implementation still remains outside of a
reasonable error margin or relies on complex setups. Furthermore, they mostly rely on more expensive
light sources such as Vertical-Cavity Surface-Emitting Lasers (VCSELs) for a spectral emission closer
to the ideal model [34,52,53]. Despite offering a better optical power to the driving current rate than
typical LEDs, these devices require specific care regarding local heating, thus hindering their use
in wearables.
In any case, pulse oximetry remains incomplete as long as dyshemoglobin concentrations are
not quantified. The shift toward co-oximetry, also named Multi-Wavelength pulse oximetry [1,54],
addresses this limitation and improves overall accuracy. However, an interesting additional alternative
could be its association with specific multi-layer Si photodetectors, which are well-known to yield
a better spectral discrimination and signal-to-noise ratio than usual photodiodes, without real
additional manufacturing costs thanks to their fabrication with standard Complementary Metal-Oxide
Semiconductor (CMOS) technologies [55–57].
Future work may also include a more accurate representation of LED emission distribution to
better model the complexity of the spectrum and its variations [50,58]. The photodetector’s sensitivity
may also incorporate more complexity, starting with photo-response non-uniformity.
Finally, even though this paper focused on the linear approximation of S p O2 estimation, which is
widely used due to its simplicity, our considerations regarding emission and reception spectra remain
equally valid for more complex approximation models. By placing our attention to wavelength shift,
we hope that future designs in critical monitoring systems will take special care in mitigating accuracy
issues due to component pairing.
Author Contributions: Conceptualization, O.T. and S.F.; methodology, O.T.; software, O.T.; validation, B.G. and
S.F.; formal analysis, O.T.; investigation, O.T.; resources, O.T. and S.F.; data curation, O.T.; writing—original
draft preparation, O.T.; writing—review and editing, B.G., O.T and S.F.; visualization, O.T.; supervision, S.F.;
project administration, S.F.; funding acquisition, S.F. All authors have read and agreed to the published version of
the manuscript.
Funding: This research received no external funding.
Conflicts of Interest: The authors declare no conflict of interest.
Abbreviations
The following abbreviations are used in this manuscript:
BLL Beer Lambert Law
CMOS Complementary Metal-Oxide Semiconductor
DUT Device Under Test
FWHM Full Width at Half Maximum
LED Light-Emitting Diode
NIR Near Infra-Red
PI Perfusion Index
PPG PhotoPlethysmoGram
SMD Surface Mount Device
VCSEL Vertical-Cavity Surface-Emitting LaserSensors 2020, 20, 3302 15 of 17
References
1. Webster, J. Design of Pulse Oximeters; Series in Medical Physics and Biomedical Engineering, Taylor & Francis:
Philadelphia, PA, USA 1997.
2. Yousef, Q.; Reaz, M.; Ali, M.A.M. The analysis of PPG morphology: Investigating the effects of aging on
arterial compliance. Meas. Sci. Rev. 2012, 12, 266–271. [CrossRef]
3. Schwartz, T.H. Neurovascular coupling and epilepsy: Hemodynamic markers for localizing and predicting
seizure onset. Epilepsy Curr. 2007, 7, 91–94. [CrossRef] [PubMed]
4. Phillips, A.A.; Krassioukov, A.V.; Zheng, M.M.Z.; Warburton, D.E. Neurovascular coupling of the posterior
cerebral artery in spinal cord injury: A pilot study. Brain Sci. 2013, 3, 781–789. [CrossRef] [PubMed]
5. Cheung, A.; Tu, L.; Sahragard, F.; Shadgan, B. Comparison of forearm muscle oxygenation dynamics during
isometric and isotonic contractions monitored by near-infrared spectroscopy. Biophotonics in Exercise
Science, Sports Medicine, Health Monitoring Technologies, and Wearables. Proc. SPIE 2020, 11237. [CrossRef]
6. Wilkins, B.W.; Schrage, W.G.; Liu, Z.; Hancock, K.C.; Joyner, M.J. Systemic hypoxia and vasoconstrictor
responsiveness in exercising human muscle. J. Appl. Physiol. 2006, 101, 1343–1350. [CrossRef] [PubMed]
7. Smith, K.J.; Billaut, F. Tissue oxygenation in men and women during repeated-sprint exercise. Int. J. Sports
Physiol. Perform. 2012, 7, 59–67. [CrossRef] [PubMed]
8. Tannheimer, M. The Use of Pulse Oximetry at High Altitude; Crimson Publishers: New York, NY, USA, 2020.
9. Naeije, R.; Huez, S.; Lamotte, M.; Retailleau, K.; Neupane, S.; Abramowicz, D.; Faoro, V. Pulmonary artery
pressure limits exercise capacity at high altitude. Eur. Respir. J. 2010, 36, 1049–1055. [CrossRef] [PubMed]
10. Netzer, N.; Eliasson, A.H.; Netzer, C.; Kristo, D.A. Overnight pulse oximetry for sleep-disordered breathing
in adults: A review. Chest 2001, 120, 625–633. [CrossRef] [PubMed]
11. Choi, D.J.; Choi, M.S.; Kang, S.J. A wearable device platform for the estimation of sleep quality using
simultaneously motion tracking and pulse oximetry. In Proceedings of the 2016 IEEE International
Conference on Consumer Electronics (ICCE), Las Vegas, LA, USA, 7–11 January 2016, pp. 49–50.
12. Maxim Integrated-High-Sensitivity Pulse Oximeter and Heart-Rate Sensor for Wearable Health. Available
online: http://www.maximintegrated.com/en/design/technical-documents/userguides-and-manuals/
6/6409.html (accessed on 31 March 2020).
13. Maxim Integrated-Best-in-Class Optical Pulse Oximeter and Heart-Rate Sensor for Wearable Health.
Available online: http://www.maximintegrated.com/en/products/sensors/MAX86140EVSYS.html
(accessed on 31 March 2020).
14. Olimex MOD-PULSE. Available online: http://www.olimex.com/Products/Modules/Biofeedback/MOD-
PULSE (accessed on 31 March 2020).
15. TI-Optical Heart Rate Monitor Reference Design with BLE Connectivity. Available online: http://www.ti.
com/tool/TIDA-00011(accessed on 31 March 2020).
16. ROHM-Heart Rate sensor module. Available online: http://www.rohm.com/sensor-shield-support/heart-
rate-sensor (accessed on 31 March 2020).
17. Microchip-Wearable Heart Rate Monitor Demonstration. Available online: http://www.microchip.com/
design-centers/medical/applications/wearable-activity-monitors/design-files-demo-boards/wearable-
heart-rate-monitor-demo (accessed on 31 March 2020).
18. Ralston, A.; Webb, R.; Runciman, W. Potential errors in pulse oximetry III: effects of interference, dyes,
dyshaemoglobins and other pigments. Anaesthesia 1991, 46, 291–295. [CrossRef] [PubMed]
19. ISO 80601-2-61:2017-Medical Electrical Equipment—Part 2-61: Particular Requirements for Basic Safety and
Essential Performance of Pulse Oximeter Equipment. Available online: http://www.iso.org/standard/
67963.html. (accessed on 2 June 2020).
20. Nitzan, M.; Romem, A.; Koppel, R. Pulse oximetry: Fundamentals and technology update. Med. Devices
2014, 7, 231. [CrossRef] [PubMed]
21. Verkruysse, W.; Bartula, M.; Bresch, E.; Rocque, M.; Meftah, M.; Kirenko, I. Calibration of contactless pulse
oximetry. Anesth. Analg. 2017, 124, 136. [CrossRef] [PubMed]
22. Tsiakaka, O.; Feruglio, S. Toward the monitoring of the spinal cord: A feasibility study. Microelectron. J. 2019,
88, 145–153. [CrossRef]Sensors 2020, 20, 3302 16 of 17
23. Tsiakaka, O.; Terosiet, M.; Romain, O.; Histace, A.; Benali, H.; Pradat, P.F.; Vallette, F.; Feher, M.; Feruglio, S.
In vivo NIRS monitoring in pig Spinal Cord tissues. In Proceedings of the 2015 37th Annual International
Conference of the IEEE Engineering in Medicine and Biology Society (EMBC), Milan, Italy, 25–29 August
2015, pp. 4262–4265.
24. Wecht, J.M.; Weir, J.P.; Katzelnick, C.G.; Wylie, G.; Eraifej, M.; Nguyen, N.; Dyson-Hudson, T.; Bauman, W.A.;
Chiaravalloti, N. Systemic and cerebral hemodynamic contribution to cognitive performance in spinal cord
injury. J. Neurotrauma 2018, 35, 2957–2964. [CrossRef] [PubMed]
25. Rashnavadi, T.; Macnab, A.; Cheung, A.; Shadgan, A.; Kwon, B.K.; Shadgan, B. Monitoring spinal cord
hemodynamics and tissue oxygenation: A review of the literature with special focus on the near-infrared
spectroscopy technique. Spinal Cord 2019, 57, 617–625. [CrossRef] [PubMed]
26. Feder, I.; Duadi, H.; Chakraborty, R.; Fixler, D. Self-Calibration Phenomenon for Near-Infrared Clinical
Measurements: Theory, Simulation, and Experiments. ACS Omega 2018, 3, 2837–2844. [CrossRef] [PubMed]
27. Guidelines for S p O2 Measurement. Available online: http://www.maximintegrated.com/en/design/
technical-documents/app-notes/6/6845.html (accessed on 31 March 2020).
28. Milner, Q.; Mathews, G. An assessment of the accuracy of pulse oximeters. Anaesthesia 2012, 67, 396–401.
[CrossRef] [PubMed]
29. Lima, A.P.; Beelen, P.; Bakker, J. Use of a peripheral perfusion index derived from the pulse oximetry signal
as a noninvasive indicator of perfusion. Crit. Care Med. 2002, 30, 1210–1213. [CrossRef] [PubMed]
30. A Single-Chip Pulsoximeter Design Using the MSP430. Available online: http://www.ti.com/lit/pdf/
SLAA274 (accessed on 31 March 2020).
31. He, D.; Morgan, S.P.; Trachanis, D.; van Hese, J.; Drogoudis, D.; Fummi, F.; Stefanni, F.; Guarnieri, V.;
Hayes-Gill, B.R. A single-chip CMOS pulse oximeter with on-chip lock-in detection. Sensors 2015,
15, 17076–17088. [CrossRef] [PubMed]
32. Optical Absorption of Hemoglobin. Available online: http://omlc.org/spectra/hemoglobin/index.html
(accessed on 9 March 2020).
33. Reynolds, K.; De Kock, J.; Tarassenko, L.; Moyle, J. Temperature dependence of LED and its theoretical effect
on pulse oximetry. BJA: Br. J. Anaesth. 1991, 67, 638–643. [CrossRef] [PubMed]
34. Nitzan, M.; Noach, S.; Tobal, E.; Adar, Y.; Miller, Y.; Shalom, E.; Engelberg, S. Calibration-free pulse oximetry
based on two wavelengths in the infrared—A preliminary study. Sensors 2014, 14, 7420–7434. [CrossRef]
[PubMed]
35. Silicon Photodiode-BPW34. Available online: http://www.vishay.com/photo-detectors/list/product-81521
(accessed on 9 March 2020).
36. Light to Voltage Converter-TSL12. Available online: https://www.datasheetarchive.com/TSL12T-datasheet.
html (accessed on 9 March 2020).
37. Lee, J.; Kim, M.; Park, H.K.; Kim, I.Y. Motion Artifact Reduction in Wearable Photoplethysmography Based
on Multi-Channel Sensors with Multiple Wavelengths. Sensors 2020, 20, 1493. [CrossRef] [PubMed]
38. Moraes, J.L.; Rocha, M.X.; Vasconcelos, G.G.; Vasconcelos Filho, J.E.; De Albuquerque, V.H.C.; Alexandria,
A.R. Advances in photopletysmography signal analysis for biomedical applications. Sensors 2018, 18, 1894.
[CrossRef] [PubMed]
39. Vishay-TLCR5800. Available online: http://www.vishay.com/docs/83178/tlcr5800.pdf (accessed on
9 March 2020).
40. Osram-LHQ974. Available online: http://media.digikey.com/pdf/Data%20Sheets/Osram%20PDFs/LH_
Q974.pdf (accessed on 9 March 2020).
41. Osram-SFH4050. Available online: http://www.osram.com/ecat/SMARTLED%C2%AE%20SFH%204050/
com/en/class_pim_web_catalog_103489/global/prd_pim_device_2219714 (accessed on 9 March 2020).
42. Osram-SFH484-800. Available online: http://media.digikey.com/pdf/Data%20Sheets/Osram%20PDFs/
sfh484_5.pdf (accessed on 9 March 2020).
43. Osram-SFH4248. Available online: http://www.osram.com/ecat/Power%20TOPLED%C2%AE%20Lens%
20SFH%204248/com/en/class_pim_web_catalog_103489/global/prd_pim_device_2219743 (accessed on
9 March 2020).
44. Vishay-VSMD66694. Available online: http://www.vishay.com/docs/84324/vsmd66694.pdf(accessed on
9 March 2020).Sensors 2020, 20, 3302 17 of 17
45. Marubeni-SMT660/890. Available online: http://www.tech-led.com/wp-content/uploads/2013/10/
SMT660.890.pdf (accessed on 9 March 2020).
46. Osram-SFH7050. Available online: http://dammedia.osram.info/media/resource/hires/osram-dam-
2496439/SFH%207050.pdf (accessed on 9 March 2020).
47. Dräger-Accessory Catalogue 2019/2020. Available online: http://www.draeger.com/Products/Content/
Accessories-ca-9066485-2019-2020-en.pdf (accessed on 9 March 2020).
48. Mindray-SpO2 Accessories. Available online: https://www.mindray.com/en/accessories/SPO2.html
(accessed on 9 March 2020).
49. Kalambet, Y.; Kozmin, Y.; Mikhailova, K.; Nagaev, I.; Tikhonov, P. Reconstruction of chromatographic peaks
using the exponentially modified Gaussian function. J. Chemom. 2011, 25, 352–356. [CrossRef]
50. Supronowicz, R.; Fryc, I. The LED spectral power distribution modelled by different functions-how spectral
matching quality affected computed LED color parameters. In Proceedings of the 2019 Second Balkan Junior
Conference on Lighting (Balkan Light Junior), Plovdiv, Bulgaria, 19–21 September 2019; pp. 1–4.
51. Thorlabs. Available online: http://www.thorlabs.com/newgrouppage9.cfm?objectgroup_id=285 (accessed
on 9 March 2020).
52. Harini, H.; Krithika, L.; Shalini, M.; Swaminathan, S.; Mohan, N.M. Design and implementation of
a calibration-free pulse oximeter. In Proceedings of the 15th International Conference on Biomedical
Engineering, Singapore, 4–7 December 2014; pp. 100–103.
53. Yossef Hay, O.; Cohen, M.; Nitzan, I.; Kasirer, Y.; Shahroor-karni, S.; Yitzhaky, Y.; Engelberg, S.; Nitzan, M.
Pulse oximetry with two infrared wavelengths without calibration in extracted arterial blood. Sensors 2018,
18, 3457. [CrossRef] [PubMed]
54. Jubran, A. Pulse oximetry. Crit. Care 2015, 19, 272. [CrossRef] [PubMed]
55. Feruglio, S.; Courcier, T.; Tsiakaka, O.; Karami, A.; Alexandre-Gauthier, A.; Romain, O.; Aimez, V.;
Charette, P.G.; Pittet, P.; Lu, G.N. A CMOS buried Quad pn junction photodetector model. IEEE Sens. J.
2015, 16, 1611–1620. [CrossRef]
56. Von Chong, A.; Terosiet, M.; Histace, A.; Romain, O. Towards a novel single-LED pulse oximeter based on a
multispectral sensor for IoT applications. Microelectron. J. 2018, 88, 128–136. [CrossRef]
57. Costa, J.; Vieira, H.; Louro, P.; Vieira, M. Double junction photodiodes for multiwavelength
photoplethysmography. Optical Sensing and Detection V. International Society for Optics and Photonics.
Proc. SPIE 2018, 10680. [CrossRef]
58. Raypah, M.E.; Devarajan, M.; Sulaiman, F. Modeling spectra of low-power smd leds as a function of ambient
temperature. IEEE Trans. Electron Devices 2017, 64, 1180–1186. [CrossRef]
c 2020 by the authors. Licensee MDPI, Basel, Switzerland. This article is an open access
article distributed under the terms and conditions of the Creative Commons Attribution
(CC BY) license (http://creativecommons.org/licenses/by/4.0/).You can also read