Sensory Profile, Consumer Preference and Chemical Composition of Craft Beers from Brazil - MDPI
←
→
Page content transcription
If your browser does not render page correctly, please read the page content below
beverages
Article
Sensory Profile, Consumer Preference and Chemical
Composition of Craft Beers from Brazil
Carmelita da Costa Jardim 1 , Daiana de Souza 1 , Isabel Cristina Kasper Machado 1,2 ,
Laura Massochin Nunes Pinto 1 , Renata Cristina de Souza Ramos 1 and Juliano Garavaglia 1,2, *
 1   Institute of Technology in Food for Health, University of Vale do Rio dos Sinos, Av. Unisinos, 950,
     São Leopoldo 93022-000, Brazil; mitajardim@gmail.com (C.d.C.J.); daianasouz@unisinos.br (D.d.S.);
     ikasper@unisinos.br (I.C.K.M.); lauramnp@gmail.com (L.M.N.P.); rcramos@unisinos.br (R.C.d.S.R.)
 2   Department of Nutrition, Federal University of Health Sciences of Porto Alegre, Rua Sarmento Leite, 245,
     Porto Alegre 90050-170, Brazil
 *   Correspondence: julianogar@unisinos.br; Tel.: +55-51-3590-8842; Fax: +55-51-3590-8122

 Received: 17 October 2018; Accepted: 14 December 2018; Published: 19 December 2018

 Abstract: Craft beers are known for their distinct flavor, brew, and regional distribution. They are
 made using top-fermenting (ale) yeast, bottom-fermenting (lager) yeast, or through spontaneous
 fermentation. Craft beers are consumed and produced in Brazil in large quantities. However,
 they present a high level of polyphenols, which affects consumer preference as they may yield a
 taste of bitterness to beers. In this study, we analyzed the relationship between polyphenols and
 bitterness as well as the composition of the main styles of craft beers and consumer preference for
 them. Six different styles were analyzed according to their polyphenol content, bitterness, chemical
 composition, sensory profile, and preference. For preference, a panel of 62 untrained assessors was
 used. For sensory profile, quantitative descriptive analysis was performed using expert assessors
 (n = 8). The most preferred style was classic American pilsner, and the least preferred was standard
 American lager. The most preferred style showed less bitterness (9.52) and lower polyphenol content
 (0.61 mg EAG/mL), total solids (6.75 ◦ Brix), and turbidity (7.27 NTU). This beer also exhibited
 reduced sensory notes of malty, fruity, smoked, hoppy, and phenolic but a higher perception of
 floral, sweet, and yeast notes; the bitterness attribute had a reduced perception. This study advances
 the understanding and complexity of the sensory profile of different styles of craft beers from
 Southern Brazil.

 Keywords: craft beer; polyphenols; bitterness; preference; sensory attributes

1. Introduction
     Beer can be defined as a product of cereal fermentation process, and it consists of more than 90%
water in addition to carbohydrates, minerals, and alcohol (on average 3.5–10%) [1]. Last year, Brazil
produced 13.9 billion liters and consumed 1.25 billion liters of beer, representing 7.0% and 6.6% of
the global beer market, respectively [2]. Beers are primarily classified according to the fermentation
process [3]. Lagers, the most consumed type of beer, are produced by low fermentation, which is usually
carried out between 6 and 15 ◦ C [2]. In contrast, ale type beers are produced by high fermentation,
occurring between 16 and 24 ◦ C after which yeast cells rise to the surface of the fermentation media,
forming a thick film that is not generally removed completely [2]. Indeed, the transformation of wort
into beer essentially represents the yeast-driven conversion of sugars into ethanol, CO2 , and many
other secondary products that provide specific aromas and flavors [4].
     Craft beer can be defined as a distinctively flavored and brewed variety that is distributed
regionally. Their popularity has benefited from innovation, creativity, typicality, and authenticity,

Beverages 2018, 4, 106; doi:10.3390/beverages4040106                          www.mdpi.com/journal/beverages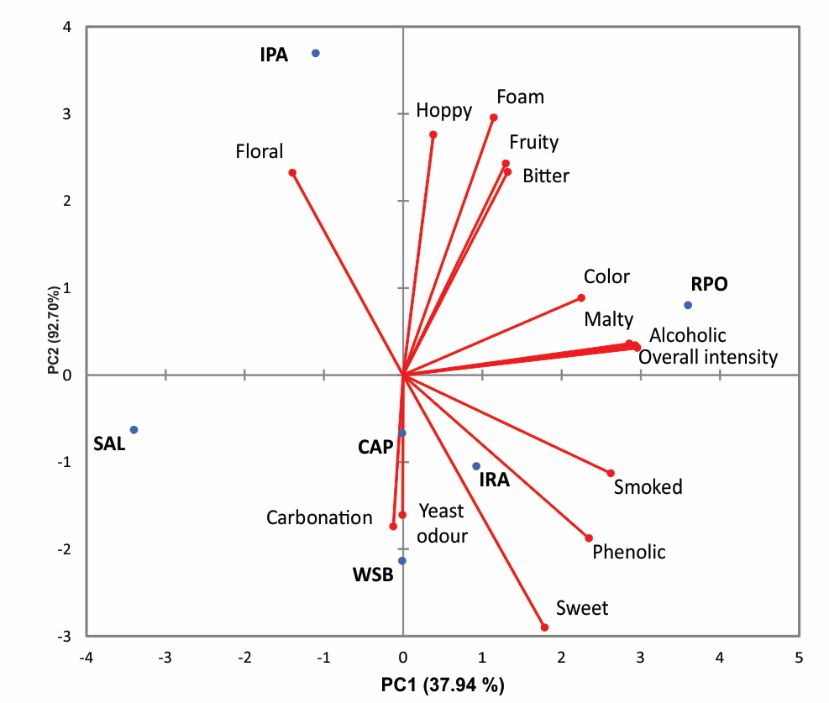
Beverages 2018, 4, 106                                                                              2 of 12

which typifies craft beer as an experience that offers pleasure, enjoyment, sense of identity and
belonging, self-fulfillment, social recognition, and sustainability [5]. In recent years, there has been a
big increase in the Brazilian market for craft beer consumption and production. In addition, craft beer
is generally unfiltered, unpasteurized, and without additional nitrogen or carbon dioxide pressure [3].
Unlike commercial beers, craft beers are mainly produced in microbreweries following the basic
brewing principles and using specific recipes according to the preference of consumers. At the same
time, like commercial beers, they can be brewed using different adjuncts and yeast types [6].
     It is well known that many compounds affect the sensory properties of craft beers, such as sugars,
organic acids, hop bitter acids, polyphenols, and carbonyl compounds [6]. The fermentation processes
through the inoculated yeast (i.e., first fermentation and refermentation in craft beers) are fundamental
to the aromatic profile of the final beer produced [4]. Polyphenols are important compounds for beer
quality as they can contribute to bitterness, color, body, and astringency and can therefore influence
their acceptance [7,8]. Almost 67 different polyphenols have been detected in beers, both from barley
and hop [9]. The most abundant phenolic acid is ferulic acid, which is found in different beer styles,
especially in pilsner and weissbier [10]. Polyphenols have a key impact on the sensory quality of beers,
with a higher number of polyphenols leading to better aroma and flavor of the final product [11].
     Beer polyphenols come from barley malt [12] and hop [8], and their content depends on the type
of beer and the quantity of hops added during its production. The brewing process and fermentation
are also important factors as some chemical changes can occur during these processes [12]. Three
polyphenol groups—flavan-3-ol, flavonols, and phenolic acids—are found in beers and contribute to
their flavor, aroma, and chemical stability [9]. Some polyphenols act as antioxidants and prevent the
oxidative degradation of beers. In addition, they provide potential benefits for human health as they
inhibit mutagenic and carcinogenic agents [8].
     Consumers choose craft beers because they have a variety of flavors, such as malted barley,
chestnut, and honey, which increases the probability of perceiving craft beers to be of a higher
quality [13]. Moreover, their consumption has become, in a qualitative approach, experienced-based
and emerging from a desire for identity and distinction. The goal toward consumption is not functional
but rather symbolic. [5]. Moreover, Brazilian consumers choose craft beers because they have an
individual quality value and distinct sensory attributes [14]. Indeed, there has been a worldwide
increase in the popularity of craft beers in recent times, particularly traditional ales, lagers, and even
styles that do not fit in any of the two main types [3].
     In the present study, the relationship between polyphenols and bitterness of the main styles of craft
beers brewed in Southern Brazil was analyzed, along with the preference of consumers. In addition,
each style of craft beer was characterized according to its chemical composition, polyphenol content,
and sensory attributes. As far as we know, few researches have been conducted with the sensorial
description and composition of Brazilian artisanal beer styles, evidencing the importance of this work.

2. Material and Methods

2.1. Craft Beers and Styles
     Six different styles of beer were used: standard American lager (SAL), classic American pilsner
(CAP), weissbier (WSB), American India pale ale (IPA), Irish red ale (IRA), and robust porter (RPO).
Table 1 shows the characteristics and packaging specifications of the different craft beers. These
styles were selected so that each specific beer showed different levels of color, bitterness, and ethanol
content. All beer sample styles were defined according to sensory characteristics and brewing process
as determined by the Beer Judge Certification Program (BJCP) [15]. The beer samples were purchased
from the market and were brewed in different localities of Rio Grande do Sul State in Southern Brazil
(Table 1).
Beverages 2018, 4, 106 3 of 12
Table 1. Characteristics of each craft beer samples regarding their production and packaging type.
Classic American pilsner (CAP), standard American lager (SAL), weissbier (WSB), American India
pale ale (IPA), Irish red ale (IRA), and robust porter (RPO).
Beer Packing
Type Beer Color Packing Production City Purchase Place
Samples Volume (mL)
CAP Lager Yellow Bottle 1000 Porto Alegre Specialty store
SAL Lager Yellow Can 473 Caxias do Sul Supermarket
WSB Lager Yellow Bottle 1000 Porto Alegre Specialty store
IPA Ale Red Bottle 500 Campo Bom Specialty store
IRA Ale Red Bottle 600 Porto Alegre Specialty store
RPO Ale Brown Bottle 600 Gramado Specialty store
2.2. Chemical Composition of Craft Beers
For all the beer parameters analyzed, the samples were decarbonated in an ultrasonic bath (Ultra
Sonic Cleaner, Unique, São Paulo, Brazil) (30 min and at 80 kHz) until the foam disappeared, indicating
that the beer did not contain CO2 [16]. The turbidity was measured in a turbidity meter (TU-2016,
Lutron Electronic, Taipei, Taiwan) and expressed in nephelometric turbidity units (NTU). The pH was
directly measured using a calibrated pH meter (AZ 86505, AZ Instruments, Taichung City, Taiwan).
The total solids were measured by refractometric method using a refractometer (Fisher Scientific,
Waltham, MA, USA) and expressed in ◦ Brix.
Dry extract was determined using an aliquot of 25 mL into metallic capsules (weighed before),
evaporated in water bath for approximately 30 min, and expressed in g/L. The acidity was measured
by titration with a 0.1 M NaOH solution in the presence of phenolphthalein as the indicator until the
appearance of pale pink color that persisted for 1 min. The content of reducing sugar was measured
using the 3,5-dinitrosalicylic acid method [17]. All procedures were carried out in triplicate, and
samples were collected from the same production lot.
2.3. Beer Color
The color of craft beers was determined by colorimetric method [18,19]. The color of the beer
samples was determined by HunterLAB software and a colorimeter (UltraScan PRO, Hunterlab,
Reston, VA, USA) using D65 illuminating standard source, which was calibrated in the ultraviolet
region for an accurate measurement of whitening agents. Aliquot of 2 mL of each craft beer was placed
in a glass cell with a thickness of 2 mm. The parameters analyzed were luminosity (L*); a* (green to
negative value and red to positive value); b* (blue to negative value and yellow to positive value);
chroma (C*), which indicates the color purity; and angle measurement (h*), which shows the hue of
the samples’ color. The C* was calculated by the equation C* = (a*2 + b*2 )1/2); the h* was measured
by the equation h* = tg−1 (b*/a*). Moreover, the absorbance of beer was measured at a wavelength of
430 nm in a 10-mm cuvette, and the color in European Brewing Convention (EBC) units was obtained
by multiplying the absorbance by a given factor [15]. All determinations were carried out in triplicate.
2.4. Polyphenols and Antioxidant Analysis
The total phenolic content was determined using the Folin–Ciocalteu method [20]. Briefly,
in 500 µL of beer samples or standard solutions, 2.5 mL of 0.2 M Folin–Ciocalteu reagent (Sigma-Aldrich,
St Louis, MO, USA) and 2 mL of sodium carbonate (Sigma-Aldrich) solution (75 g/L) were added and
mixed. After incubation (2 h), the absorbance was measured at 760 nm. The phenolic content was
calculated from the calibration curve of Gallic acid (Sigma-Aldrich) standard solutions and expressed
as millimoles of Gallic acid equivalent (GAE) per mL of craft beer. All determinations were carried out
in triplicate.
The antioxidant activity was determined by 2,2-diphenyl-1-picrylhydrazyl (DPPH) radical-scavenging
activity [21]. A 0.1 mL aliquot of methanolic extract was added to 3.9 mL of a 6 × 10⁻⁵ mol/L DPPH
radical (Sigma-Aldrich), and the absorbance was measured at 515 nm. Quantification was performedBeverages 2018, 4, 106 4 of 12
using a calibration curve prepared with Trolox standard (6-hydroxy-2,5,7,8-tetramethylchroman-
2-carboxylic acid) (Sigma-Aldrich). The results of DPPH radical-scavenging activity were expressed as
µmol of Trolox per mL of beer, and all determinations were carried out in triplicate.
2.5. Determination of Bitterness
Craft beer samples were decarbonated, and bitter substances were extracted with iso-octane [16]
using 10 mL of sample, 1 mL of hydrochloric acid, and 20 mL iso-octane. After this, the sample was
agitated for 5 min at room temperature and then centrifuged for 15 min at 4000 rpm. The iso-octane
phase was decanted and drained; the sample tube was covered and left to stand in the dark for at least
30 min before measuring the absorption at 275 nm. Results were expressed as International Bittering
Units (IBU), and the average values of three determinations were used.
2.6. Sensory Analysis of Craft Beers
Ethical approval for the sensory tests of this investigation was obtained from the University of
Vale do Rio dos Sinos Committee (number 12247636), and all participants gave written informed
consent to participate in the study. Two different sensory tests—the ranking preference test and
quantitative descriptive analysis (QDA)—was performed for each beer style.
For the ranking preference test, a hedonic panel test composed of 62 assessors who were not
experienced and aged 20–56 years old was used. The selection criteria were availability and motivation
to participate on all days of the experiments and the panelists being regular beer consumers. Initially,
these participants answered questions about the habits of beer consumption, such as the frequency;
the type, style, and brand consumed; factors that influence consumption (prize, packaging, place of
consumption, etc.); sensory characteristics they appreciate the most in craft beers (aroma, flavor, color,
taste, foam, etc.); and food pairing with beers. The preference was evaluated by the ranking preference
test [22,23]. The test was carried out in individual cabins under white light. In each session, the beer
samples were served at refrigeration temperature ranging from 6 ◦ C to 8 ◦ C. About 30 mL of each beer
was served in transparent, glass cups without assessors having prior knowledge regarding the brand
of the beer being evaluated. The samples were served randomly at the same time, and the assessors
were requested to order the least preferred to the most preferred craft beers. The preference tests were
carried out in four different sessions with intervals of at least eight hours between sessions to avoid
sensory fatigue of the consumers. The results were submitted to Friedman test at a significance level of
5% after which the least significant difference value between the sums of the scores obtained with all
analyses was calculated.
For the QDA, the flavor attributes of Southern Brazilian craft beers were analyzed [22,23]. The
QDA was carried out by an experienced panel (n = 8) to outline the qualitative aspects of beers. Fifteen
attributes, derived from literature, panelists perception, and from the attribute list used by the “beer
taster association” [15], were included in the evaluation process. Seven of the attributes were related
to flavor (malty, fruity aroma, floral notes, hoppy, phenolic aroma, smoked and yeast odor), two
were visual attributes (foam persistency and color), five were gustatory traits (overall intensity, sweet,
bitter, alcoholic, residual flavor), and one concerned the texture (level of carbonation). Industrial beers
were used in pretesting panel-test sessions to let the assessors familiarize with the products under
investigation and the related terminology. These sessions were also used to standardize the panel’s
attribute definitions according to literature and the panelists’ perceptions.
The sensory attributes were assessed using an unstructured 9-point scale anchored at the left
end with “absent” and at the right end with “high”. The samples were identified with a code of three
different random digits, where each panelist received 50 mL of each beer sample, monadically and
randomly. In all sensory analysis sessions, the panelists received mineral water and dry unsalted
breadsticks for palate cleansing between samples to avoid carry-over effects.Beverages 2018, 4, 106 5 of 12
2.7. Statistical Analysis
One-way analysis of variance (ANOVA) was performed to detect statistically significant
differences among the beers for the sensory attributes and chemical composition. A Tukey honestly
significant difference (HSD) post-hoc test was used to identify samples that were significantly different
from each other (95% significance). For ranking preference test, the Friedman test and table of Newell
and MacFarlane were performed (95% significance). Statistical analysis was done using SPSS Statistics
21 software (SPSS Inc., Chicago, IL, USA). Differences of p < 0.05 were considered significant. Principal
component analysis (PCA) was carried out on panel QDA data to identify the key attributes that most
contributed to the variation in products within the product space. All PCA statistical analyses were
performed with the XLSTAT, v2017 package (Addinsoft, New York, NY, USA).
3. Results
3.1. Craft Beer Composition and Color
All the craft beers tested showed best quality condition parameters according to international
quality guidance [15]. Table 2 shows the composition of craft beers. In general, the craft beers had a
similar composition in sugars, density, acidity, and pH; more differences were observed in turbidity,
total solids, and dry extract.
The porter style (RPO) showed a higher turbidity (230 NTU) than the other tested samples.
This beer had a high pH value (4.40), more solids (10% m/v), dry extract (7.47 g/L), acidity (2.19 g
acetic acid/L), sugars (2.08% w/v), and ethanol (7.0% w/w). In addition, this characteristic was
detected and pointed out by the hedonic panel, which described the beer as turbid and with a dark and
intense color, as expected by the analysis of parameters. The SAL exhibited minor turbidity (1.44 NTU),
dry extract (3.84 g/L), solids (5.75 ◦ Brix), and acidity (1.49 g acetic acid/L).
Table 2. Principal quality parameters of each craft beer. Classic American pilsner (CAP), standard
American lager (SAL), weissbier (WSB), American India pale ale (IPA), Irish red ale (IRA), and robust
porter (RPO). Different letters in the same column indicate significant differences between groups of
beers (p < 0.05, ANOVA followed by post-tests).
Turbidity Total Solids Dry Extract Acidity Sugars Ethanol
Style/Beer pH Density
(NTU) (◦ Brix) (g/L) (g Acetic Acid/L) (% w/v) (% w/v)
CAP 7.27 e 4.24 c 6.75 b,c 4.20 d 1.84 c 1.0112 b 0.9 d,e 5.1 c
SAL 1.44 f 4.12 c 5.75 c 3.84 e 1.49 d 1.0098 b 0.93 c,d 5.0 c
WSB 16.78 d 3.88 d 7b 4.80 c 1.97 b 1.0116 b 0.95 c 5.0 c
IPA 37.77 b 4.12 c 7b 4.21 d 1.97 b 1.0084 b 0.86 e 6.2 b
IRA 29.14 c 4.33 a,b 7.75 b 5.36 b 1.52 d 1.0139 a,b 1.13 b 6.2 b
RPO 230 a 4.40 a 10 a 7.47 a 2.19 a 1.0222 a 2.08 a 7.0 a
Regarding the color of beers, differences in L*, a*, and b* parameters were found. All samples
showed high luminosity, but SAL had higher luminosity than other craft beers analyzed (Table 3).
Minor L* value was detected with porter (RPO) style, a very turbid beer (Table 2). The L* value ranged
from 14.02 (RPO beer) to 91.65 (SAL beer). The a* value, which represents the color axis green to red,
ranged from −0.49 (SAL) to 33.43 (RPO). The positive values indicated a perception of red color due
to the toasted barley use in craft beer production. For parameter b*, a tendency of yellow color was
noticed and ranged from 24.03 (RPO) to 89.6 (IRA). The decrease in b* value of some samples of craft
beers led to a reddish color and with a brown trace, as a function of a* value of color. Chroma value
was positive for all craft beer samples and ranged from 32.74 (SAL beer) to 94.19 (IRA). The beer IRA
showed a higher chroma when compared to other samples, representing a beer color with more quality,
purity, and intensity. The h angle oscillated from −1.556 (SAL) to 1.532 (CAP), indicating a more yellow
color of beer samples. The h is correlated to a* and b* value, and it is important to differentiate the
color hue from different beer samples. The CAP beer had a more intense and yellow hue compared to
the other samples (Table 3).Beverages 2018, 4, 106 6 of 12
Table 3. Color parameters of craft beers. L* (luminosity), C* (chroma), h* (hue) and EBC (European
Brewery Convention) units. Classic American pilsner (CAP), standard American lager (SAL), weissbier
(WSB), American India pale ale (IPA), Irish red ale (IRA), and robust porter (RPO). Different letters in
the same column indicate significant differences between groups of beers (p < 0.05, ANOVA followed
by post-tests).
Style/Beer L* a* b* C* h* EBC Units
c d c c a
CAP 87.21 1.82 47.39 47.43 1.532 13.37 d
SAL 91.65 a −0.49 f 32.73 e 32.74 e −1.556 e 7.50 e
WSB 89.90 b 1.01 e 40.87 d 40.89 d 1.546a 9.75 e
IPA 77.12 d 12.13 c 71.72 b 72.74 b 1.403 b 16.75 c
IRA 62.46 e 29.06 b 89.60 a 94.19 a 1.257 c 44.75 b
RPO 14.02 f 33.43 a 24.03 f 41.17 d 0.623 d 157.0 a
The color expressed in EBC units varied from 7.50 (SAL) to 157 (RPO). The beer with higher
EBC index (RPO: 157) showed lower luminosity (14.02), and the least intense EBC color had more
luminosity (91.65).
3.2. Bitterness, Antioxidant Activity, and Polyphenols
The polyphenol content in beer is an important factor to analyze as it can improve the quality and
acceptance of craft beers. Table 4 shows the content of polyphenols, antioxidant activity, and bitterness
of each craft beer sample. The beers with higher level of polyphenols were RPO (1.62 mg EAG/mL),
IRA (0.95 mg EAG/mL), and WSB (1.68 mg/EAL/mL). The SAL craft beer showed lower polyphenols
content (0.35 mg EAG/L) compared with other samples. In Table 4, it can be seen that the beers that
presented higher content of total polyphenols were also the ones with greater antioxidant activity.
The antioxidant activity was maximal (5.58 µmol Trolox/mL) with the weissbier beer (WSB)
using the DPPH method. In general, the antioxidant activity of the tested beers varied from 1.74 µmol
Trolox/mL (SAL) to 5.58 µmol Trolox/mL (WSB). The beer bitterness was maximal in IPA beer
(46.15 EBU), and the lowest value of bitterness was 9.52 EBU (CAP) (Table 4). The bitterness EBC value
varied depending on the content of bitter compounds and polyphenols in the beers. In this case, the
craft beer with higher content of total polyphenols did not show a higher bitterness value.
Table 4. Total polyphenols content, antioxidant activity (2,2-diphenyl-1-picrylhydrazyl (DPPH)
method), and bitterness value of different craft beers. Classic American pilsner (CAP), standard
American lager (SAL), weissbier (WSB), American India pale ale (IPA), Irish red ale (IRA), and robust
porter (RPO). Different letters in the same column indicate significant differences between groups of
beers (p < 0.05, ANOVA followed by post-tests).
Style/Beer Total Polyphenols (mg EAG/mL) DPPH (µmol Trolox/mL) Bitterness (IBU)
CAP 0.61 d 3.24 b 9.52 f
SAL 0.35 e 1.74 e 11.57 e
WSB 1.68 a 5.58 a 12.55 d
IPA 0.8 c 2.30 c 46.15 a
IRA 0.95 b 2.05 d 33.45 b
RPO 1.62 a 3.14 b 24.72 c
3.3. Sensory Analysis of Beers
For the hedonic test of beers, 62 panelists were recruited to evaluate six different styles. This panel
was composed of 57.4% females and 42.6% males. The average consumer age was 32.09 ± 10.6 years
old and ranged from 20 to 56 years old. Regarding the frequency of beer consumption, 81.5% of panel
reported frequently drinking beer every day and only occasionally consuming it on a weekly basis.
They also consumed both commercial and craft beer brands; the most consumed craft beers were local
beers, followed by the international brands of craft beers available.Beverages 2018, 4, 106 7 of 12
Concerning the factors that influence beer consumption, most assessors chose the beer differential
and typical sensory characteristics, the type of serving, the beer label design, and the beer style. The
second most important factor was the place of consumption. The least important factor was the type
of packaging. The most important sensory characteristics appreciated by the survey participants were
the flavor and then the beer fragrance notes. Regarding the preference for styles of beer, the most cited
were pilsner, weissbier, and India pale ale.
The calories contained in beer had relevance for only eight participants (12.9%) in the survey,
and the clear majority of participants said they usually drink with their friends. When talking about
the consumption of beer combined with some type of gastronomic preparation, 24 people (38.7%)
reported that they do not care about it, 14 (22.6%) said they do not usually drink with food, and
24 assessors (38.7%) said they try to harmonize the drink with food. Regarding the factors influencing
beer consumption, a majority chose the beverage differential, such as how it is served, the label,
and the style. The second most important factor was the place where they drink the beer. The least
important factor was the packaging. According to sensory characteristics of craft beers, the most
prominent was the taste, followed by aroma. For only eight participants (12.9%) in the survey, the
calories contained in beer had relevance. On the other hand, the clear majority of participants usually
drink with their friends. When talking about the consumption of beer harmonized with some type of
gastronomic preparation, 20 people (31.25%) reported that they do not care about it and 14 (22.6%) do
not usually drink with the food and only 20 people (31.25%) try to harmonize the drink with the food.
Concerning the brewing schools (English, Belgian, German, and American), 63% did not know any of
them. Regarding the preference for a particular style of beer, the most cited were pilsner, weissbier,
and India pale ale.
Regarding the useful ranking preference test, the least preferred beer was IPA, and the
most preferred style was pilsner (CAP). The ranking preference test was considered significant
(95% significance) using the Friedman test, and there was a significant difference in the preference when
comparing the scores between them. Pilsner craft beer (CAP) was more preferred when compared to
lager beer (SAL) and other craft beers. In fact, none of the participants chose CAP beer as the least
preferred of all beer samples. Pilsner (CAP), one of the beers with the lowest number of polyphenols
(0.61 mg EAG/mL) and bitterness (9.52 IBU), had a higher preference compared to the others. Thus,
an increase in polyphenol level and beer bitterness led to a decrease in preference by the panel test.
The IPA beer also showed a more intense bitterness (46.15 IBU), which was a factor that contributed to
its low preference among beer consumers.
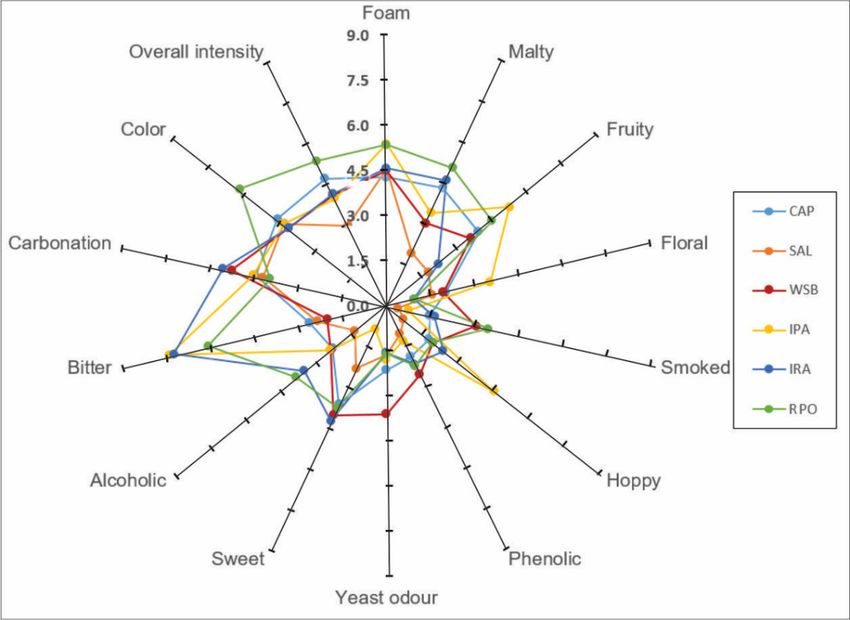
Figure 1 shows the sensory profile of different craft beer styles by QDA. This data indicates
the differences in the craft beer styles according to the abovementioned sensory attributes. Aroma
attributes, carbonation, hoppy, and foam were some important characteristics evaluated by
beer consumers.
The CAP beer showed a high sweet flavor score (3.64) but did not show high scores for other
descriptors (Figure 1). The RPO beer exhibited good color (6.23), overall intensity (5.23), foam (5.34),
malty (5.08), and smoked (3.48). The hoppiest (4.59) and fruitiest (5.24) craft beer was IPA. This craft
beer had around 2.5-fold more hoppy flavor than CAP beer (1.8), which was the most preferred
beer. The bitterest craft beer was IPA (7.40) and IRA (7.25). Consumers preferred beers without high
polyphenols content, less bitterness (EBU units), and lower bitter and hoppy character.
Differences in the sensory profiles of craft beers were investigated by PCA, and the results are
shown in Figure 2. This analysis matrix included all sensory attributes evaluated (Figure 1). Two
principal components (PCs) were extracted, and one group of samples was discernible after analysis of
PC1 versus PC2 in a biplot of samples and selected variables. In this PCA plot, PC1 explained 37.94%
of total variance and PC2 explained another 29.7%. Based on the results of PCA and considering
the studied beer samples, CAP, IRA, and WSB were grouped (Figure 2). The beers IPA, RPO, and
SAL did not cluster together and remained separated in the plots. The group of beers showed
yeast/fermentation and sweet flavor and had a high perception of carbonation. In the upper leftBeverages 2018, 4, 106 8 of 12
quadrant, the beer IPA was mainly related to the presence of floral flavor. The IPA style showed a
more intense perception of floral flavor and hoppy character. The RPO positioned in the upper right
quadrant was more related to the presence of more intense color besides alcoholic, malty, fruity, and
overall intensity attributes (Figure 2).
Beverages 2019, 5 FOR PEER REVIEW 8
Figure 1. Plots of mean intensity scores for sensory profile of six different craft beers evaluated by
Figure 1. Plots of mean intensity scores for sensory profile of six different craft beers evaluated
quantitative descriptive analysis using a 9-point scale. Standard American lager (SAL), classic
by quantitative descriptive analysis using a 9-point scale. Standard American lager (SAL), classic
American pilsner (CAP), weissbier (WSB), American India pale ale (IPA), Irish red ale (IRA), and
American pilsner (CAP), weissbier (WSB), American India pale ale (IPA), Irish red ale (IRA), and robust
robust
Beverages 2019, porter
5 FOR PEER(RPO).
REVIEW 9
porter (RPO).
The CAP beer showed a high sweet flavor score (3.64) but did not show high scores for other
descriptors (Figure 1). The RPO beer exhibited good color (6.23), overall intensity (5.23), foam (5.34),
malty (5.08), and smoked (3.48). The hoppiest (4.59) and fruitiest (5.24) craft beer was IPA. This craft
beer had around 2.5-fold more hoppy flavor than CAP beer (1.8), which was the most preferred beer.
The bitterest craft beer was IPA (7.40) and IRA (7.25). Consumers preferred beers without high
polyphenols content, less bitterness (EBU units), and lower bitter and hoppy character.
Differences in the sensory profiles of craft beers were investigated by PCA, and the results are
shown in Figure 2. This analysis matrix included all sensory attributes evaluated (Figure 1). Two
principal components (PCs) were extracted, and one group of samples was discernible after analysis
of PC1 versus PC2 in a biplot of samples and selected variables. In this PCA plot, PC1 explained
37.94% of total variance and PC2 explained another 29.7%. Based on the results of PCA and
considering the studied beer samples, CAP, IRA, and WSB were grouped (Figure 2). The beers IPA,
RPO, and SAL did not cluster together and remained separated in the plots. The group of beers
showed yeast/fermentation and sweet flavor and had a high perception of carbonation. In the upper
left quadrant, the beer IPA was mainly related to the presence of floral flavor. The IPA style showed
a more intense perception of floral flavor and hoppy character. The RPO positioned in the upper right
quadrant was more related to the presence of more intense color besides alcoholic, malty, fruity, and
overall intensity attributes (Figure 2).
Figure
Figure2.2.Scatter
Scatterplots
plotsofof
principal
principalcomponent
component analysis (PCA)
analysis scores
(PCA) for for
scores specific sensory
specific attributes
sensory of
attributes
Southern Brazilian
of Southern craftcraft
Brazilian beersbeers
analyzed in thein
analyzed present study.study.
the present (PC1 + (PC1
PC2 explain 67.64% of
+ PC2 explain total matrix
67.64% of total
variance). Standard
matrix variance). American
Standard lager lager
American (SAL),(SAL),
Classic American
Classic pilsner
American (CAP),
pilsner (CAP),weissbier
weissbier(WSB),
(WSB),
American
AmericanIndia
Indiapale
paleale
ale(IPA),
(IPA),Irish
Irishred
redale
ale(IRA),
(IRA),and
androbust
robustporter
porter(RPO).
(RPO).
4. Discussion
Beer is a very complex mixture, and its chemical composition varies considerably [24], as shown
in Table 2. To bring more light into the differences found in craft beer consumption, the objective of
this work was to explore the impact of polyphenol content and bitterness of Southern Brazilian craft
beers on consumer preference. As craft beers have different flavors, aromas, etc. than the usual well-
known commercial brands, their preference is increasing among consumers [13].Beverages 2018, 4, 106 9 of 12
4. Discussion
Beer is a very complex mixture, and its chemical composition varies considerably [24], as shown
in Table 2. To bring more light into the differences found in craft beer consumption, the objective of this
work was to explore the impact of polyphenol content and bitterness of Southern Brazilian craft beers
on consumer preference. As craft beers have different flavors, aromas, etc. than the usual well-known
commercial brands, their preference is increasing among consumers [13].
These differences in craft beer flavors come from the ingredients used as well as the brewing
process [16]. The yeast strains used have a key impact on the final craft beer quality, either in the aroma
compound production or in the interaction of some beer components, such as polyphenols [4]. While
several yeast strains are commercially accessible, the availability of new starter strains could be an
important differentiating factor among craft beers produced in different microbreweries [25]. The main
ingredients used in beer production are barley, hops, water, and yeast [26], with each ingredient
playing a crucial role in the quality and composition of beers. The porter style beer, for example,
is characterized as a substantial, malty dark beer with a complex and flavorful dark malt character [15].
This beer showed high scores in composition parameters compared to other beers tested in this study.
Nevertheless, in general, the tested craft beers were similar in analytical factors to the styles described
in the BJCP guide [15].
In addition, craft beers have distinctive and pleasant flavor characteristics, and these attributes
are easily perceived by consumers [27]. Today, consumer preferences appear to be connected to the
discovery of new beer flavors [13], which can increase the consumption of craft beers. Brazilian
consumers have followed the same trend as they search for beers with high sensorial quality and
differentiated and characteristic flavor and aroma, as verified in this study. The main factor that affects
Brazilian beer consumers is the sensory attributes, as pointed out by other studies [13,27,28]. The
most preferred craft beer in our study was the CAP style, which mainly shows a fruity and sweet
note. Additionally, consumers have a predilection to drink with friends and consider the flavor and
fragrances of beer.
It must be noted, however, that this study had some limitations, in particular the few number
of craft beer samples that were evaluated for each style of beer. Even so, the sensory attributes
and craft beer styles selected in this study for their consumer relevance spanned a wide range of
beer characteristics.
Moreover, studying consumer behavior can have great value for the beer industry as it can show
how consumers represent the beer category, the associations linked to them, and the proximity
across different types of beer [27]. In addition, studies about consumer preferences can assist
brewers to understand consumer attitude and translate consumer needs, wants, and expectations
into manufacturing design to produce the best, most cost-competitive, and widely accepted product
possible in a relatively short period [29].
Beers are rich in polyphenols, which are mostly acquired from barley and hop [8], and they
were found in the six styles of beers evaluated in this study. For example, xanthohumol is the most
common phenol in hop [30]. Investigating the Brazilian beers, we found that the contents of phenolic
compounds, as well as the antioxidant capacity, were like those of beers produced elsewhere in the
world [2]. Polyphenols are already extracted in the initial phase of the fermentation process, i.e., during
the wort production [9]. This study showed that polyphenols, especially the bitterness associated with
it, have an important relationship with the preference of different beers among Brazilian consumers.
The most preferred beer showed the lowest bitterness (Table 4, Figure 1) of all styles tested and the
second lowest level of polyphenols (0.61 mg EAG/mL). This same relationship with bitterness was
verified when analyzing consumer acceptance of craft beers and commercial brands in the Brazilian
market [31]. Understanding the sensory characteristic of bitterness in beers and how that relates to
their content of polyphenols has a significant value for understanding consumer response as well as
optimizing production processes [8].Beverages 2018, 4, 106 10 of 12
The malt kilning process determines the color parameter, and it is quite an important process
as it can improve the acceptance of beers [26]. The luminosity (L* value) also has a great importance
because beers with higher L* value (high luminosity) show a more vivid and intense color [19]. The
lager beers show high L* values [19].The darker and more turbid beers show big scores in fruity,
floral, and malty flavors, but they still have a low preference among consumers. Beer appearance
provides substantial opportunities for product differentiation, and even beers of the same type have
the potential to deliver on rather different usage contexts [32].
The most popular beer style in Brazil is the Germany-style pilsner, which is very light and
clear [31]. This beer style is very common in the Brazilian market and has a great familiarity to
consumers. Familiar beers would be more often cited as appropriate in most of usage contexts, and
that familiar and novel products would be associated with different usage contexts [32]. Consumers
perceive familiar beers to be more interesting and tasty [32], which can increase their preference,
as verified in this study. The preference order obtained from this study came from the sensory
proprieties perceived by non-trained assessors because the beer samples were analyzed at the same
time and were not assigned different styles.
From the sensory characterization of Brazilian beer styles, it is possible to attest that the evaluated
consumers could differentiate and prefer the most aromatic and fruity beers. In addition, this distinct
character is a motivation to choose and buy craft beers instead of other beer brands [29]. In this
context, the use of S. cerevisiae strains isolated from food matrices can represent a valid approach for
the selection of starters for brewing to obtain craft beers with more complex flavors [25]. A study
with Italian consumers found similar preference to beers brewed from moderately kilned/roasted
malts with a milder flavor and less intense mouthfeel perceptions [28]. More complex craft beers with
remarkably increased flavors would lead to an improvement of consumer preference [29].
The IPA was the lowest preferred beer and showed a higher level of bitterness attribute
perception by the panel test. According to international definitions, the IPA style is a hop-forward,
bitter, dryish beer with good drinkability. However, the excessive harshness and heaviness of IPA
are typical faults that result from the strong flavor clashes between the hops and other specialty
ingredients [15]. Furthermore, IPA beer was differentiated by PCA (Figure 2) from other styles because
of its characteristic floral note.
Bitterness is a very important quality parameter in beer production [16]. Nearly four out of ten
consumers report that they highly appreciate sweet and fruity samples but dislike primarily bitter,
burnt, and roasted notes and hoppy resinousness of beer [28]. The bitter foods are generally disliked
due to the instinctive rejection of the bitter taste [33]. Variations in liking and the willingness to
consume bitter foods can be triggered by motivational states in humans [33]. In this study, the beer
with the lowest bitterness had a higher preference among consumers. This shows bitterness is a key
factor that influences beer preference and leads to a decline in consumer preference.
5. Conclusions
In this study, we found that the polyphenol content and bitterness determine the preference of
craft beers among Southern Brazilian as consumers can perceive their complex sensory attributes.
The research also showed the influence of polyphenols in terms of consumer preference as beers with
less polyphenol content and bitterness (CAP beer) were more preferred than other craft beer types.
Brazilian craft beers with high antioxidant activity, polyphenols, and bitterness were the porter style
(RPO), red ale (IRA) and India pale ale (IPA). The craft beers showed complex aromatic notes and
flavors, which were described as floral, fruity, yeast, and malty. There were, however, some limitations
in this study as it was only exploratory. Therefore, additional work with a larger craft beer sample that
is representative of Brazilian craft beers is needed to strengthen our conclusion.
Considering these study findings, it is possible to describe some craft beers and point to the
adverse effect of polyphenols and bitterness on consumer preferences. These preliminary results willBeverages 2018, 4, 106 11 of 12
be important in stimulating the production of more appreciable craft beers for Southern Brazilian
consumers who want to improve their drinking experience and hedonic aspects.
Author Contributions: Study conception and design: All; Acquisition of data: C.d.C.J., D.d.S. and L.M.N.P.;
Analysis and interpretation of data: All; Drafting of manuscript: C.d.C.J., R.C.d.S.R. and J.G.
Funding: This research was funded by Financiadora de Estudos e Projetos (FINEP) of the Brazilian Government,
grant number 0110051002. Additional support was provided by Institute of Technology in Food for Health,
University of Vale do Rio dos Sinos.
Acknowledgments: The authors thank the Financiadora de Estudos e Projetos (FINEP) of the Brazilian
Government for financial support.
Conflicts of Interest: The authors declare no conflict of interest.
References
1. Gaetano, G.; Costanzo, S.; Di Castelnuovo, A.; Badimon, L.; Bejko, D.; Alkerwi, A.; Chiva-Blanch, G.;
Estruch, R.; La Vecchia, C.; Panico, S.; et al. Effect of moderate beer consumption on health and disease: A
consensus document. Nutr. Metab. Cardiovas. 2016, 26, 443–467. [CrossRef] [PubMed]
2. Moura-Nunes, N.; Brito, T.C.; Fonseca, N.D.; de Aguiar, P.F.; Monteiro, M.; Perrone, D.; Torres, A.G. Phenolic
compounds of Brazilian beers from different types and styles and application of chemometrics for modeling
antioxidant capacity. Food Chem. 2016, 199, 105–113. [CrossRef] [PubMed]
3. Capece, A.; Romaniello, R.; Pietrafesa, A.; Siesto, G.; Pietrafesa, R.; Zambuto, M.; Romano, P. Use of
Saccharomyces cerevisiae var. boulardii in co-fermentations with S. cerevisiae for the production of craft beers
with potential healthy value-added. Int. J. Food Microbiol. 2018, 284, 22–30. [CrossRef]
4. Budroni, M.; Zara, G.; Ciani, M.; Comitini, F. Saccharomyces and Non-Saccharomyces Starter Yeasts. In Brewing
Technology; Kanauchi, M., Ed.; Intechopen: London, UK, 2017; pp. 81–100.
5. Gómez-Corona, C.; Lelievre-Desmas, M.; Buendía, H.E.B.; Chollet, S.; Valentin, D. Craft beer representation
amongst men in two different cultures. Food Qual. Preferences 2016, 53, 19–28. [CrossRef]
6. Estela-Escalante, W.D.; Rosales-Mendoza, S.; Moscosa-Santillán, M.; González-Ramírez, J.E. Evaluation of
the fermentative potential of Candida zemplinina yeasts for craft beer fermentation. J. Inst. Brew. 2016, 122,
530–535. [CrossRef]
7. Giacalone, D.; Ribeiro, L.M.; Frost, M.B. Perception and description of premium beers by panels with
different degrees of product expertise. Beverages 2016, 2, 5. [CrossRef]
8. Oladokun, O.; Tarrega, A.; James, S.; Smart, K.; Hort, J.; Cook, D. The impact of hop bitter acid and
polyphenol profiles on the perceived bitterness of beer. Food Chem. 2016, 205, 212–220. [CrossRef] [PubMed]
9. Juric, A.; Coric, N.; Odak, A.; Herceg, Z.; Tisma, M. Analysis of total polyphenols, bitterness and haze in
pale and dark lager beers produced under different mashing and boiling conditions. J. Inst. Brew. 2015, 121,
541–547. [CrossRef]
10. Piazzon, A.; Forte, M.; Nardini, M. Characterization of phenolics content and antioxidant activity of different
beer types. J. Agric. Food Chem. 2010, 58, 10677–10683. [CrossRef]
11. Zhao, H.; Li, H.; Sun, G.; Yang, B.; Zhao, M. Assessment of endogenous antioxidative compounds and
antioxidant activities of lager beers. J. Sci. Food Agric. 2013, 93, 910–917. [CrossRef]
12. Quifer-Rada, P.; Vallverdú-Queralt, A.; Martínez-Huélamo, M.; Chiva-Blanch, G.; Jáuregui, O.; Estruch, R.;
Lamuela-Raventós, R. A comprehensive characterisation of beer polyphenols by high-resolution mass
spectrometry (LC-ESI-LTQ-Orbitrap-MS). Food Chem. 2015, 169, 336–343. [CrossRef] [PubMed]
13. Aquilani, B.; Laureti, T.; Poponi, S.; Secondi, L. Beer choice and consumption determinants when craft beers
are tasted: An exploratory study of consumer preferences. Food Qual. Preferencs 2015, 41, 214–224. [CrossRef]
14. Ferreira, R.H.; Vasconcelos, R.L.; Judice, V.M.M.; Neves, J.T.R. Inovação na fabricação de cervejas especiais
na região de Belo Horizonte. Perspect. Ciênc. Inf. 2011, 16, 171–191. [CrossRef]
15. Beer Judge Certification Program (BJCP). 2015 Style Guidelines: Beer Style Guidelines. 2015. Available
online: https://www.bjcp.org/docs/2015_Guidelines_Beer.pdf (accessed on 8 November 2018).
16. Popescu, V.; Soceanu, A.; Dobrinas, S.; Stanicu, G. A study of beer bitterness loss during the various stages
of the Romanian beer production process. J. Inst. Brew. 2013, 119, 111–115. [CrossRef]Beverages 2018, 4, 106 12 of 12
17. Miller, G.L. Use of dinitrosalicylic acid reagent for determination of reducing sugar. Anal. Chem. 1959, 31,
426–428. [CrossRef]
18. Mamede, M.; Monica, S.; Maria, J.; Cruz, J.; Oliveira, L. Avaliação sensorial e colorimétrica de néctar de uva.
Braz. J. Food Nutr. 2013, 24, 65–72.
19. Smedley, S.M. Discrimination between beers with small colour differences using the CIELAB colour space.
J. Inst. Brew. 1995, 1, 195–201. [CrossRef]
20. Meda, A.; Lamien, C.; Romito, M.; Millogo, J.; Nacoulma, O. Determination of the total phenolic, flavonoid
and proline contents in Burkina Fasan honey, as well as their radical scavenging activity. Food Chem. 2005,
91, 571–577. [CrossRef]
21. Brand-Williams, W.; Cuvelier, M.E.; Berset, C. Use of a free radical method to evaluate antioxidant activity.
Food Sci.Technol. 1995, 28, 25–30. [CrossRef]
22. Dutcosky, S.D. Análise Sensorial de Alimentos, 3rd ed.; Editora Champagnat: Curitiba, Brazil, 2013; Chapter 4;
p. 356.
23. Lawless, H.T.; Heymann, H. Sensory Evaluation of Food: Principles and Practices, 2nd ed.; Springer: New York,
NY, USA, 2010; Chapter 4, p. 596.
24. Silva, G.C.; Abner, A.S.; Silva, L.S.N.; Godoy, R.L.O.; Nogueira, L.C.; Quitério, S.L.; Raices, R.S.L. Method
development by GC–ECD and HS-SPME–GC–MS for beer volatile analysis. Food Chem. 2015, 167, 71–77.
[CrossRef]
25. Marongiu, A.; Zara, G.; Legras, J.; Del Caro, A.; Mascia, I.; Fadda, C.; Budroni, M. Novel starters for old
processes: Use of Saccharomyces cerevisiae strains isolated from artisanal sourdough for craft beer production
at a brewery scale. J. Ind. Microbiol. Biotechnol. 2015, 42, 85–92. [CrossRef] [PubMed]
26. Han, H.; Kim, J.; Choi, E.; Ahn, E.; Kim, W.J. Characteristics of beer produced from Korean six-row barley
with the addition of adjuncts. J. Inst. Brew. 2016, 122, 500–507. [CrossRef]
27. Gómez-Corona, C.; Valentin, D.; Escalona-Buendía, H.B.; Chollet, S. The role of gender and product
consumption in the mental representation of industrial and craft beers: An exploratory study with Mexican
consumers. Food Qual. Preferences 2017, 60, 31–39. [CrossRef]
28. Donadini, G.; Fumi, M.D.; Newby-Clark, I.R. Consumer’s preference and sensory profile of bottom fermented
red beers of the Italian market. Food Res. Int. 2014, 58, 69–80. [CrossRef]
29. Donadini, G.; Porretta, S. Uncovering patterns of consumers’ interest for beer: A case study with craft beers.
Food Res. Int. 2017, 91, 183–198. [CrossRef] [PubMed]
30. Stevens, J.F.; Page, J.E. Xanthohumol and related prenylflavonoids from hops and beer: To your good health!
Phytochemistry 2004, 65, 1317–1330. [CrossRef]
31. Araújo, F.B.; Silva, P.H.A.; Minim, V.P.R. Perfil sensorial e composição físico-química de cervejas provenientes
de dois segmentos do mercado brasileiro. Food Sci. Technol. 2003, 23, 121–128. [CrossRef]
32. Giacalone, D.; Frost, M.B.; Bredie, W.L.P.; Pineau, B.; Hunter, D.C.; Paisley, A.G.; Beresford, M.K.; Jaeger, S.R.
Situational appropriateness of beer is influenced by product familiarity. Food Qual. Preferences 2015, 39, 16–27.
[CrossRef]
33. Garcia-Burgos, D.; Zamora, M.C. Exploring the hedonic and incentive properties in preferences for bitter
foods via self-reports, facial expressions and instrumental behaviours. Food Qual. Preferences 2015, 39, 73–81.
[CrossRef]
© 2018 by the authors. Licensee MDPI, Basel, Switzerland. This article is an open access
article distributed under the terms and conditions of the Creative Commons Attribution
(CC BY) license (http://creativecommons.org/licenses/by/4.0/).You can also read