SYSTEMATIC EVALUATION OF MULTIPLE QPCR PLATFORMS, NANOSTRING AND MIRNA SEQ FOR MICRORNA BIOMARKER DISCOVERY IN HUMAN BIOFLUIDS

Page created by Ruth Brown
 
CONTINUE READING
SYSTEMATIC EVALUATION OF MULTIPLE QPCR PLATFORMS, NANOSTRING AND MIRNA SEQ FOR MICRORNA BIOMARKER DISCOVERY IN HUMAN BIOFLUIDS
www.nature.com/scientificreports

                OPEN             Systematic evaluation of multiple
                                 qPCR platforms, NanoString
                                 and miRNA‑Seq for microRNA
                                 biomarker discovery in human
                                 biofluids
                                 Lewis Z. Hong1*, Lihan Zhou2, Ruiyang Zou2, Chin Meng Khoo3,4, Adeline Lai San Chew1,
                                 Chih‑Liang Chin1 & Shian‑Jiun Shih1

                                 Aberrant miRNA expression has been associated with many diseases, and extracellular miRNAs
                                 that circulate in the bloodstream are remarkably stable. Recently, there has been growing interest
                                 in identifying cell-free circulating miRNAs that can serve as non-invasive biomarkers for early
                                 detection of disease or selection of treatment options. However, quantifying miRNA levels in biofluids
                                 is technically challenging due to their low abundance. Using reference samples, we performed a
                                 cross-platform evaluation in which miRNA profiling was performed on four different qPCR platforms
                                 (MiRXES, Qiagen, Applied Biosystems, Exiqon), nCounter technology (NanoString), and miRNA-Seq.
                                 Overall, our results suggest that using miRNA-Seq for discovery and targeted qPCR for validation is a
                                 rational strategy for miRNA biomarker development in clinical samples that involve limited amounts
                                 of biofluids.

                                   Since their discovery more than two decades ago, microRNAs (miRNAs) have been recognized for their critical
                                   roles in gene ­regulation1, 2. miRNAs are small RNA molecules (~ 22 nucleotides in size) that exert their effects by
                                  suppressing the translation or inducing the degradation of their target m  ­ RNAs3, 4, and play important roles in a
                                                                                     5, 6
                                   wide range of biologic and pathologic p ­ rocesses . Due to their tissue specificity and unusually high stability in
                                  biofluids, circulating cell-free miRNAs have emerged as a promising class of non-invasive biomarkers for human
                                  ­disease7–10. MiRNA expression profiling in plasma and serum has the potential for identifying miRNA biomark-
                                   ers that are informative for early disease diagnosis and to predict response to t­ herapy11–14. However, obtaining
                                   expression profiles of miRNAs in biofluids is technically challenging due to their low abundance, the small size
                                   of mature miRNAs, and the high degree of sequence similarity between family m      ­ embers15.
                                       Many platforms have been developed for quantitating miRNA expression; they are typically based on quantita-
                                   tive PCR (qPCR), hybridization, or next-generation sequencing t­ echnology16–18. Previous studies have compared
                                  the performance characteristics of different miRNA profiling ­methods15–17 and platform comparison studies
                                   have been conducted to assess the performance of individual miRNA profiling platforms on a variety of sample
                                 ­types19–23. In 2014, a miRNA quality control (miRQC) study that evaluated 12 different technology platforms
                                   was published, which reported that the majority of platforms detected fewer than 90 miRNAs in human s­ erum19.
                                   Since the miRQC study, newer platforms have emerged and reagent updates have been provided for several pre-
                                   existing platforms, but their relative performance in human biofluids is ­unclear24–33. Hence, an updated evalua-
                                   tion of miRNA quantitation platforms with a specific focus on human serum and plasma will be helpful. Here,
                                   we describe a systematic evaluation of four different qPCR platforms (MiRXES, Qiagen, Applied Biosystems,
                                   Exiqon), the NanoString nCounter platform, and the miRNA-Seq platform (Illumina TruSeq and Bioo Scientific
                                   NEXTflex) in measuring more than 600 miRNAs in human serum and plasma samples.

                                 1
                                  Translational Biomarkers, MSD, Singapore, Singapore. 2MiRXES Lab, Singapore, Singapore. 3Yong Loo Lin
                                 School of Medicine, National University of Singapore, Singapore, Singapore. 4Department of Medicine, National
                                 University Hospital, Singapore, Singapore. *email: lewis.hong@merck.com

Scientific Reports |   (2021) 11:4435                | https://doi.org/10.1038/s41598-021-83365-z                                                    1

                                                                                                                                                Vol.:(0123456789)
www.nature.com/scientificreports/

                                                                                            Cross-platform validation

                                               Performance                 Detection rate / LLOQ
                                               parameters                         Reproducibility                 Inter-platform correlation

                                                                                                                            Plasma
                                               RNA samples               Brain (QC)                 Ref. Serum
                                                                                                                            (n = 12)
                                                                                                                                                       Normalized Expression

                                                                                                     miRNA-Seq                                         Reads per million (RPM)
                                                    Platforms
                                                                                         NanoString                                                             Counts

                                                                                                                  MiRXES qPCR                                 Copies/ml

                                                                                                    Other qPCR                                                 Ct value

                                               Figure 1.  Overview of microRNA quantitation platforms, RNA samples, and different aspects of platform
                                               performance that were assessed in this study. Other qPCR platforms are Qiagen, ABI and Exiqon.

           Workflow stage    Assay component                Qiagen miScript                 Exiqon miRCURY​                ABI Taqman                    MiRXES ID3EAL
                                                                                                                           miRNA-specific; universal     miRNA-specific; modified
           cDNA synthesis    Reverse transcription primer   Universal A-tailing             Universal A-tailing
                                                                                                                           stem-loop                     stem loop
                             Reverse PCR Primer             Universal primer                miRNA-specific LNA primer      Universal primer              miRNA-specific DNA primer
           Amplification
                             Forward PCR Primer             miRNA-specific DNA primer       miRNA-specific LNA primer      miRNA-specific DNA primer     miRNA-specific DNA primer
           Detection         Fluorescence                   SYBR Green                      SYBR Green                     Taqman Probe                  SYBR Green

                                               Table 1.  Overview of qPCR assays.

                                               Results
                                               Study design. Our cross-platform evaluation relied on a set of reference samples (serum, plasma and brain)
                                               on which miRNA profiling was performed using six different platforms: (1) miRNA-Seq, (2) NanoString, (3)
                                               ABI Taqman qPCR. (4) Exiqon LNA qPCR, (5) Qiagen miScript qPCR and (6) MiRXES ID3EAL qPCR (Fig. 1).
                                               Each platform was assessed using performance parameters such as reproducibility, detection rate, and inter-
                                               platform correlation. The Reference Serum (Ref. Serum) is a large stock of pooled human serum that was pur-
                                               chased commercially. MiRNA profiling was performed on all six platforms using a similar input volume of Ref.
                                               Serum. The Human Brain Reference RNA sample has been characterized extensively by the MicroArray Quality
                                               Control (MAQC) project and was used in this study as a QC sample for the NanoString and miRNA-Seq plat-
                                               forms (hereafter referred to as ‘Brain QC sample’). On each platform, miRNA profiling was performed using the
                                               standard protocol from the manufacturer.

                                               miRNA profiling platforms. The four qPCR platforms evaluated in this study have slightly different meth-
                                               ods for miRNA profiling (Table 1). For example, the ABI and MiRXES platforms rely on gene-specific primers
                                               for reverse transcription, but the Qiagen and Exiqon platforms perform universal A-tailing. The most com-
                                               prehensive miRNA panels available from each manufacturer at the time of experiment were selected. Qiagen’s
                                               miRNome panel had the highest number of mature miRNAs (1066 miRNAs) whereas the MIRXES panel was
                                               the most focused (560 miRNAs) (Table 2). The number of overlapping miRNAs across the four qPCR panels is
                                               438, significantly higher than the 196 overlapping miRNAs analyzed in the miRQC ­study19. Expression levels
                                               of miRNAs in the Qiagen, Exiqon and ABI panels were determined using Ct values and normalized by spike-in
                                               RNA or endogenous small RNA and/or calibrators accordingly to manufacturers’ recommendations.
                                                   The NanoString assay involves ligating unique oligonucleotide tags onto target miRNAs, followed by detection
                                               of targets by hybridization to color-coded probes. Each target-probe pair is individually resolved and counted on
                                               the instrument. The nCounter Human v3 miRNA codeset contains probes for measuring 800 miRNAs (Table 2).
                                                   As the relative performance of miRNA-Seq library preparation kits from different manufacturers was unclear,
                                               we evaluated the performance of two different kits on our reference samples: the TruSeq Small RNA Library Prep

          Scientific Reports |     (2021) 11:4435 |                      https://doi.org/10.1038/s41598-021-83365-z                                                                  2

Vol:.(1234567890)
www.nature.com/scientificreports/

                                   Technology                      miRNA-Seq          nCounter       qPCR
                                   Platform                        Illumina TruSeq    NanoString     Qiagen miScript   Exiqon miRCURY​    ABI Taqman   MiRXES ID3EAL
                                   Panel content (number of                      a
                                                                   Up to ­2588        800            1066              751                733          560
                                   miRNAs)
                                                            b
                                   Turnaround time (days)          4                  2              7                 5                  5            7
                                   Reagent cost per sample         +                  +              ++                ++                 ++           ++
                                   Concordance correlation
                                                                   0.99               0.82           0.91              0.95               0.96         0.99
                                   ­coefficientc
                                   microRNAs detected above
                                                            372d                      84             NA                208                179          438
                                   LLOQ

                                  Table 2.  Platform comparison. a Number of mature microRNAs in miRBase release 21. b To obtain expression
                                  data for 12 samples using one instrument. c Average of pairwise comparisons across a minimum of three
                                  independent runs. d Based on sequencing depth of 20 million reads.

                                                                                     Ref. Serum (n = 3)a               Plasma (n = 12)b            Brain QC (n = 4)a
                                   Sequence reads (A)                                55,628,822                        26,555,049                  36,459,035
                                   Mature microRNA reads (B)                         4,969,597                         4,330,330                   13,985,954
                                   Alignment rate (B/A)                              8.9%                              16.3%                       38.4%
                                   microRNAs with ≥ 5 reads                          655                               595                         1035

                                  Table 3.  Summary statistics from miRNA-Seq. a Average of inter-run replicates (number of replicates in
                                  parentheses). b Average of plasma libraries from 12 patients.

                                  Kit (Illumina) and NEXTflex Illumina Small RNA Sequencing Kit v2 (Bioo Scientific). Ultimately, we selected
                                  the TruSeq method for miRNA-Seq as our evaluation showed that the TruSeq kit is superior to the NEXTflex kit
                                  in overall yield and consistency of library preparation, miRNA detection rate and total hands-on time (detailed
                                  report in Supplementary Note 1). The miRNA-Seq assay relies on the presence of 5′-phosphate and 3′-hydroxyl
                                  groups on mature miRNAs to ligate specific RNA adapters onto each end of the target molecule. Reverse tran-
                                  scription is used to generate cDNA, which is then amplified by PCR to generate molecules that are compatible for
                                  sequencing on an Illumina sequencer. MiRNA expression levels are obtained by counting the number of sequence
                                  reads that align to regions of the human genome corresponding to mature miRNA sequences. We observed
                                  lower alignment rates in Ref. Serum and plasma samples (~ 9% and ~ 16% respectively) compared to the Brain
                                  QC sample (~ 38%), which may be due to a lower overall miRNA content in the biofluid samples (Table 3). In
                                  miRNA-Seq, the count data for each sample is normalized to sequencing depth and is represented as the number
                                  of reads per million mapped miRNA reads (RPM). In principle, miRNA-Seq can capture the complete range of
                                  miRNA species in a sample and has the potential to measure the largest number of miRNAs (Table 2). As the
                                  platform is sequence agnostic, miRNA-Seq can be used to identify and quantitate novel miRNAs, i.e., sequences
                                  that are likely to be miRNAs but are not annotated in miRBase.

                                  Reproducibility.      On each platform, at least three independent runs were performed on Ref. Serum to
                                  obtain miRNA expression profiles. The concordance correlation coefficient (ccc) was calculated between runs
                                  to assess the reproducibility of each platform (Supplementary Fig. S1). We observed that the MiRXES qPCR
                                  and miRNA-Seq platforms had almost perfect concordance between runs (ccc = 0.99), the other three qPCR
                                  platforms had moderate inter-run concordance (ccc > 0.9), and the NanoString platform had poor inter-run
                                  concordance (ccc = 0.82) (Table 2). However, expression profiles obtained from the Brain QC sample had almost
                                  perfect inter-run concordance on both the miRNA-Seq and NanoString platforms (ccc = 0.99), suggesting that
                                  the lower reproducibility observed with NanoString may be restricted to sample types with lower miRNA con-
                                  tent, such as serum (Supplementary Fig. S1). The miRNA-Seq method was also highly robust, as miRNA expres-
                                  sion levels obtained from libraries with different input volume or PCR cycle number were highly concordant
                                  (Supplementary Table S1).

                                  Detection rate and lower limit of quantitation. Detection rate is determined by a combination of plat-
                                  form content, sensitivity, and the platform-specific cutoff used for the limit of detection (LOD). Each platform’s
                                  lower limit of quantification (LLOQ) is the lowest number of miRNAs that can be quantitatively determined
                                  with a defined precision. In this study, LLOQ was determined using a cutoff of 50% coefficient of variation (CV)
                                  on all platforms. Using a LOD of five sequence reads, the number of unique miRNAs detected by miRNA-Seq in
                                  the Brain QC and Ref. Serum samples did not saturate even at a sequencing depth of 50 million reads (Fig. 2a).
                                  At this read depth, greater than 1150 and 650 miRNAs were detected above the LOD in the Brain QC and Ref.
                                  Serum samples, respectively. This suggests that miRNA-Seq can achieve very high sensitivity in biofluid samples
                                  by capturing a complex library of miRNA molecules, followed by deep sampling by next-generation sequencing.
                                  For miRNA-Seq, the LLOQ in Ref. Serum increases with higher sequencing depth, and was approximately eight

Scientific Reports |   (2021) 11:4435 |                         https://doi.org/10.1038/s41598-021-83365-z                                                             3

                                                                                                                                                                  Vol.:(0123456789)
www.nature.com/scientificreports/

                    a                                                                                                                           b
                                             1200
                                                                                                                                                                               18

                                                                                                                                                    (mapped reads per miRNA)
                                             1000                                                                                                                              16
                                                                                                          Brain (detected by   5 reads)

                        Number of miRNAs
                                                                                                                                                                               14
                                              800                                                         Brain (detected above LLOQ)
                                                                                                                                                                               12                                           Ref. Serum
                                                                                                          Ref. Serum (detected by    5 reads)
                                              600                                                                                                                              10                                           Brain

                                                                                                                                                             LLOQ
                                                                                                          Ref. Serum (detected above LLOQ)
                                                                                                                                                                                8
                                              400
                                                                                                                                                                                6
                                              200                                                                                                                               4
                                                                                                                                                                                2
                                                0
                                                                                                                                                                                0
                                                    0        10     20      30       40        50                                                                                   0   10      20       30       40   50
                                                             Sequencing reads (millions)
                                                                                                                                                                                         Sequencing reads (millions)

                    c                                                                                                                           d
                                             120
                                                                                           miRNA-Seq
                                                                                           NanoString
                                             100                                           MiRXES qPCR
                          Number of miRNAs

                                                                                           ABI qPCR
                                              80                                           Exiqon qPCR

                                              60

                                              40

                                              20

                                               0
                                                    5      10   15    20   25    30 35        40     45     50   >50
                                                                                %CV

                                                                     Figure 2.  Detection rate, inter-platform overlap and LLOQ. (a) Detection rate of miRNAs as a function of
                                                                     sequencing depth for Brain QC and Ref. Serum miRNA-Seq libraries. (b) LLOQ of Brain QC and Ref. Serum
                                                                     miRNA-Seq libraries as a function of sequencing depth. LLOQ is expressed as the number of mapped reads per
                                                                     miRNA. (c) Coefficient of variation (%CV) observed in expression level for miRNAs detected above the LLOQ.
                                                                     (d) Overlap in miRNAs detected above LLOQ across platforms.

                                                                     reads at a sequencing depth of 20 million reads (Fig. 2b). In the Brain QC sample, the LLOQ was approximately
                                                                     four reads and was relatively stable at different sequencing depths (Fig. 2b). Our subsampling analysis suggests
                                                                     that miRNA-Seq libraries in serum should be sequenced to ~ 20 million reads as the number of miRNAs that can
                                                                     be reliably detected appears to reach saturation at this sequencing depth (Fig. 2a). However, as the number of
                                                                     additional miRNAs detected above LLOQ in Ref. Serum is relatively small when sequencing depth was increased
                                                                     from 10 to 20 million reads (300 vs 372 miRNAs), sequencing more samples at a lower depth of 10 million reads
                                                                     may be preferable in biomarker projects where budgets are limited. Conversely, the number of miRNAs that
                                                                     were detected above LLOQ in the Brain QC sample did not saturate even at a sequencing depth of 50 million
                                                                     reads (Fig. 2a). For tissue samples with more complex miRNA content, a trade-off will have to be made between
                                                                     increasing miRNA detection with sequencing depth and enhancing statistical power with more samples.
                                                                         A more meaningful performance parameter is the number of miRNAs that can be reliably detected in a given
                                                                     sample. To that end, we calculated the LLOQ for each platform using expression data obtained from at least
                                                                     three independent runs (Online Methods, Supplementary Fig. S2). Overall, there were significant differences
                                                                     in the number of miRNAs detected above the LLOQ in Ref. Serum—NanoString only detected 84 miRNAs,
                                                                     miRNA-Seq detected 372 miRNAs, and the number of miRNAs detected by qPCR was highly variable between
                                                                     platforms (Table 2). Across all platforms, the MiRXES qPCR platform detected the highest number of miRNAs
                                                                     above the LLOQ. Notably, the LLOQ could not be calculated for the Qiagen qPCR platform as the variability
                                                                     in measurement of miRNA levels was particularly high even at the lower Ct range (Supplementary Fig. S2) and
                                                                     results from this platform were excluded from further analysis.
                                                                         For miRNAs detected above the LLOQ, their expression levels were measured with highest precision by qPCR,
                                                                     compared to miRNA-Seq and NanoString (Fig. 2c).

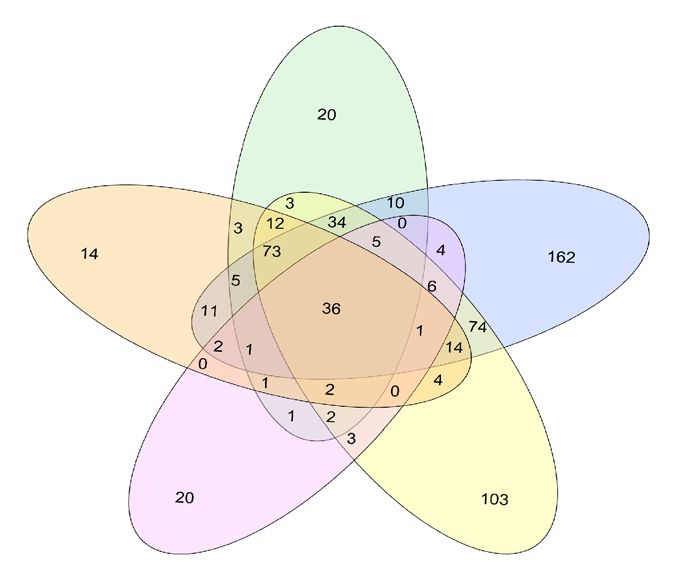
                                                                     Inter‑platform correlation. A total of 626 miRNAs were detected above the LLOQ in Ref. Serum by at
                                                                     least one platform (Fig. 2d). A significant proportion of miRNAs (51%) were only detected by one platform,
                                                                     and only 36 miRNAs (6%) were detected by all five platforms (Fig. 2d). Among the qPCR platforms, the largest
                                                                     inter-platform overlap with miRNA-Seq was observed with MiRXES (243 miRNAs), followed by Exiqon (167
                                                                     miRNAs) and ABI (142 miRNAs) (Supplementary Table S2). The discrepancy in detection rate between the
                                                                     qPCR platforms could be partially explained by the higher overall sensitivity of the MiRXES ID3EAL assay—a
                                                                     significant number of miRNAs (246 miRNAs) were only detected by MiRXES but not Exiqon or ABI. However,
                                                                     a substantial proportion of the miRNAs detected by Exiqon (21%) and ABI (20%) were not detected above the
                                                                     LLOQ by MiRXES. Among these miRNAs, around 70% were missing from the MiRXES panel, indicating that
                                                                     a reason for the discrepancy is non-overlapping panel content across qPCR platforms. However, each qPCR
                                                                     platform may also be unique in their ability to reliably detect some miRNAs.

          Scientific Reports |                          (2021) 11:4435 |                           https://doi.org/10.1038/s41598-021-83365-z                                                                                       4

Vol:.(1234567890)
www.nature.com/scientificreports/

                                        35                                                         35                                                              35                                                                         15

         MiRXES qPCR (log2 copies/ml)

                                                                                                                                                                                                                   Nanostring (log2 counts)
                                        30
                                                                                                                                                                   30

                                                                                Exiqon qPCR (Ct)
                                                                                                   30                                                                                                                                         10

                                                                                                                                                   ABI qPCR (Ct)
                                        25
                                                                                                                                                                   25
                                        20
                                                                                                   25                                                                                                                                         5
                                                                                                                                                                   20
                                        15
                                                                    r = 0.69                                 r = -0.58                                                       r = -0.38                                                                  r = 0.17 (ns)
                                        10                                                         20                                                              15                                                                         0
                                             0   5       10        15      20                           0          5       10        15       20                        0          5       10        15       20                                   0        5       10        15          20
                                                 miRNA-Seq (log2 RPM)                                              miRNA-Seq (log2 RPM)                                            miRNA-Seq (log2 RPM)                                                     miRNA-Seq (log2 RPM)

                                                                                                   35                                                              35                                                                         15

                                                                                                                                                                                                                   Nanostring (log2 counts)
                                                                                                                                                                   30

                                                                                Exiqon qPCR (Ct)   30                                                                                                                                         10

                                                                                                                                                   ABI qPCR (Ct)
                                                                                                                                                                   25

                                                                                                   25                                                                                                                                         5
                                                                                                                                                                   20

                                                                                                             r = -0.78                                                       r = -0.63                                                                  r = 0.45
                                                                                                   20                                                              15                                                                         0
                                                                                                        10          20           30           40                        10          20           30           40                                   10        20           30              40
                                                                                                               MiRXES qPCR (log2 copies/ml)                                    MiRXES qPCR (log2 copies/ml)                                             MiRXES qPCR (log2 copies/ml)

                                                                                                                                                                   35                                                                         15

                                                                                                                                                                                                                   Nanostring (log2 counts)
                                                                                                                                                                   30
                                                                                                                                                                                                                                              10

                                                                                                                                                   ABI qPCR (Ct)
                                                                                                                                                                   25

                                                                                                                                                                                                                                              5
                                                                                                                                                                   20

                                                                                                                                                                             r = 0.55                                                                   r = -0.48
                                                                                                                                                                   15                                                                         0
                                                                                                                                                                        20              25           30       35                                   20            25           30          35
                                                                                                                                                                                        Exiqon qPCR (Ct)                                                         Exiqon qPCR (Ct)

                                                                                                                                                                                                                                              15

                                                                                                                                                                                                                   Nanostring (log2 counts)
                                                                                                                                                                                                                                              10

                                                                                                                                                                                                                                              5

                                                                                                                                                                                                                                                        r = -0.32
                                                                                                                                                                                                                                              0
                                                                                                                                                                                                                                                   15       20          25          30    35
                                                                                                                                                                                                                                                                   ABI qPCR (Ct)

                                                                    Figure 3.  Inter-platform correlation. Pairwise inter-platform correlation in expression levels for miRNAs that
                                                                    were detected above the LLOQ in Ref. Serum. The miRNAs measured by qPCR do not include those in the
                                                                    “expanded” panel (see text). r Spearman’s correlation coefficient, ns not significant (p > 0.05).

                                                                        Next, we evaluated inter-platform correlation in miRNA levels measured in Ref. Serum (Fig. 3). Overall, mod-
                                                                    erate to strong correlation was observed between the qPCR platforms and between qPCR and miRNA-Seq, except
                                                                    for ABI qPCR and miRNA-Seq where inter-platform correlation is weak (r = 0.38). The highest inter-platform
                                                                    correlation was observed between Exiqon qPCR and MiRXES qPCR (r = 0.78). Similar dynamic range in miRNA
                                                                    levels was detected by miRNA-Seq and qPCR (~ 106). The correlation observed for NanoString with the other
                                                                    platforms were either not statistically significant (miRNA-Seq) or in the weak to moderate range (qPCR)—this
                                                                    could partly be explained by the lower dynamic range in miRNA detection for the NanoString platform (~ 103).
                                                                    In contrast, substantial overlap and strong inter-platform correlation was observed between miRNA-Seq and
                                                                    NanoString in the Brain QC sample (r = 0.63); however, miRNAs detected by NanoString appear to be skewed
                                                                    towards lower expression levels, i.e., below 100 counts (Supplementary Fig. S3). These results suggest that lower
                                                                    detection sensitivity for the NanoString platform may be affecting its accuracy in measuring miRNA expression,
                                                                    particularly in samples with low miRNA content. Interestingly, strong correlation was observed between miRNA-
                                                                    Seq and MiRXES qPCR (r = 0.69); it was the second highest correlation observed between any two platforms in
                                                                    this study and this was comparable to that observed in twelve plasma samples on which miRNA profiling was
                                                                    also performed by both platforms (Supplementary Fig. S4).
                                                                        Since miRNA-Seq and MiRXES qPCR had strong inter-platform correlation and higher assay precision and
                                                                    detection rate compared to the other platforms evaluated in this study, we decided to explore the potential of

Scientific Reports |                                 (2021) 11:4435 |                                            https://doi.org/10.1038/s41598-021-83365-z                                                                                                                               5

                                                                                                                                                                                                                                                                                     Vol.:(0123456789)
www.nature.com/scientificreports/

                    a                                                                                           b                                      10 8                HEK-293      10 6
                                              40                                                                                                                           THP-1
                                                                           r = -0.52                                                                   10 7
                                                                                                                                                                           OE19
                                                                                                                                                       10 6                             10 5
                                                                                                                                                                           NUGC

                                                                                                                    AU per million cells
                                              35
                                                                                                                                                       10 5                MDST8

                                                                                                                                                                                               Read count
                                                                                                                                                                           NPC          10 4
                                              30                                                                                                       10 4
                                                                                                                                                                           Ref. Serum
                            Ct value

                                                                                                                                                       10 3
                                                                                                                                                                                        10 3
                                              25                                                                                                       10 2

                                                                                                                                                       10 1                             10 2
                                              20
                                                                                                                                                       10 0
                                                                                                                                                   10 -1                                10 1
                                              15
                                                   5         10           15           20

                                                                                                                                               35 -3p

                                                                                                                                                 48 p

                                                                                                                                                 39 p

                                                                                                                                                 04 p
                                                                                                                                               90 3p

                                                                                                                                                 40 p
                                                                                                                                               3 5 5p

                                                                                                                                                57 p
                                                                                                                                               97 5p

                                                                                                                                                 72 p

                                                                                                                                                65 p
                                                                                                                                              85 -3p

                                                                                                                                                        p
                                                                                                                                             4 1 8 -3

                                                                                                                                             41 -3

                                                                                                                                             2 3 3 -3

                                                                                                                                             1 1 -3

                                                                                                                                             3 9 0 -5

                                                                                                                                             3 7 -3
                                                                                                                                             35 -3

                                                                                                                                                     -5
                                                                                                                                                     -

                                                                                                                                                     -

                                                                                                                                                     -
                                                             Log2 (read count)

                                                                                                                                                   4

                                                                                                                                                   8
                                                                                                                                                  03

                                                                                                                                                  12

                                                                                                                                                  03

                                                                                                                                                  19

                                                                                                                                                   2

                                                                                                                                                   9

                                                                                                                                                   5
                                                                                                                                                  88
                                                                                                                                                 16
                                                                                                                                             28
                    c                                                                                           d
                                           10 8                             HEK-293         10 6                                                                      2          HEK-293
                                                                            THP-1                                                                                                THP-1
                                           10 7
                                                                            OE19                                                                                                 OE19
                                                                                            10 5

                                                                                                                                       Log10 (Extra to Intra ratio)
                                           10 6                                                                                                                       1          NUGC
                                                                            NUGC
                    AU per million cells

                                                                                                                                                                                 MDST8
                                           10 5                             MDST8
                                                                                                   Read count

                                                                                                                                                                                 NPC
                                                                            NPC             10 4
                                           10 4
                                                                            Ref. Serum                                                                                0
                                           10 3
                                                                                            10 3
                                           10 2
                                                                                                                                                                      -1
                                           10 1                                             10 2
                                           10 0
                                           10 -1                                            10 1                                                                      -2
                                                                                                                                                       35 3p

                                                                                                                                                       90 3p

                                                                                                                                                       35 p

                                                                                                                                                       97 5p

                                                                                                                                                         72 p

                                                                                                                                                         48 p

                                                                                                                                                         39 p

                                                                                                                                                         04 p
                                                                                                                                                               3p
                                                                                                                                                            -5

                                                                                                                                                      35 -3

                                                                                                                                                      41 -3

                                                                                                                                                      41 -3

                                                                                                                                                      23 -3
                                               35 -3p

                                                 48 p

                                                 39 p
                                               90 -3p

                                                 04 p
                                                       3p
                                               3 5 5p

                                               97 5p

                                                 72 p

                                                                                                                                                           4-

                                                                                                                                                             -

                                                                                                                                                            -

                                                                                                                                                           2-
                                              41 -3

                                              23 -3
                                              41 -3
                                              35 -3

                                                                                                                                                          03

                                                                                                                                                          12

                                                                                                                                                          03

                                                                                                                                                          19

                                                                                                                                                           8

                                                                                                                                                           8

                                                                                                                                                           3
                                                   2-
                                                     -

                                                     -

                                                                                                                                                         16
                                                   4
                                                  03

                                                   8
                                                  12

                                                   8
                                                  19

                                                   3
                                                  03
                                            16

                                                                                                                                                      28
                                       28

                                                                  Figure 4.  Validation of 14 novel miRNAs identified in Ref. Serum. (a) Correlation in expression levels of
                                                                  predicted mature miRNAs measured by qPCR and miRNA-Seq in Ref. Serum. Two miRNAs were not detected
                                                                  above the LOD (data points not shown). r Spearman’s correlation coefficient. (b) Intracellular expression levels
                                                                  of 13 novel miRNAs measured by qPCR across six human cell lines (left y-axis) and read count measured by
                                                                  miRNA-Seq in Ref. Serum (right y-axis). One miRNA was not detected above LOD (data points not shown). (c)
                                                                  Extracellular expression levels of nine novel miRNAs measured by qPCR across six human cell lines (left y-axis)
                                                                  and read count measured by miRNA-Seq in Ref. Serum (right y-axis). Five miRNAs were not detected above
                                                                  LOD (data points not shown). (d) Ratio of extracellular to intracellular expression.

                                                                  using miRNA-Seq as a discovery platform and MiRXES qPCR for validation. First, we evaluated how the MiRXES
                                                                  panel content for MiRXES qPCR affected inter-platform variation in miRNA detection. Among the miRNAs that
                                                                  were detected above the LLOQ by miRNA-Seq but not MiRXES qPCR, 83% (107 miRNAs) were absent from the
                                                                  MiRXES panel. Subsequently, we designed an “expanded” qPCR panel by developing new qPCR assays for 92
                                                                  out of 107 miRNAs. When these 92 miRNAs were measured in Ref. Serum, 77 were detected above the LLOQ
                                                                  and their expression levels measured by qPCR had moderate correlation with miRNA-Seq (r = 0.45). Using the
                                                                  expanded MiRXES qPCR panel enabled the measurement of 320 miRNAs above LLOQ by both miRNA-Seq
                                                                  and qPCR in Ref. Serum (Supplementary Fig. S5) and 517 miRNAs by qPCR alone.

                                                                  Validation of novel serum miRNAs detected by miRNA‑Seq.                      Using miRNA-Seq as a discovery
                                                                  platform can also enable the identification of novel miRNAs that can be verified subsequently by qPCR. Novel
                                                                  miRNAs that were identified by miRNA-Seq in Ref. Serum were filtered for those that had a mirDeep score
                                                                  cutoff of ≥ 1 in technical replicates that were performed across three independent runs. The hairpin structure,
                                                                  mapped read distribution, and read counts observed in each predicted miRNA precursor suggested that they
                                                                  encoded true miRNAs (Supplementary Note 2). A total of 14 mature miRNA sequences that had average read
                                                                  counts per library ranging from 47 to 342,186 were selected for subsequent validation (Supplementary Table S3).
                                                                  The expression of these 14 miRNAs was measured by qPCR in Ref. Serum. Twelve miRNAs were detected above
                                                                  the LOD of the MiRXES platform (Ct < 40). We observed an inverse correlation between Ct values by qPCR
                                                                  and read counts by miRNA-Seq (Fig. 4a), although the correlation was not statistically significant at p = 0.05
                                                                  (p = 0.08).

          Scientific Reports |                         (2021) 11:4435 |                https://doi.org/10.1038/s41598-021-83365-z                                                                  6

Vol:.(1234567890)
www.nature.com/scientificreports/

                                      Next, we surveyed the intracellular and extracellular expression levels of these 14 predicted miRNAs by qPCR
                                  across six human cell lines of diverse origin—kidney (HEK-293), monocytic (THP-1), oesophageal (OE19),
                                  stomach (NUGC-3), colorectal (MDST8) and neural (NPC). Except for 31893-3p, which was also not detected
                                  by qPCR in Ref. Serum, intracellular expression for the remaining 13 miRNAs were detected at varying levels
                                  across the six cell lines (Fig. 4b). Notably, all 13 miRNAs were detected above the LOD in all cell lines. In con-
                                  trast, extracellular expression was detected above the LOD for nine miRNAs in at least one cell line (Fig. 4c).
                                  Interestingly, only six miRNAs had detectable extracellular levels across all cell lines. For instance, 3503-5p was
                                  detected at relatively high levels (~ 27 Ct) in the cell culture media from HEK-293, THP-1 and NPC but was
                                  undetectable in OE19, MDST8 and NUGC-3, suggesting that this particular miRNA may not be secreted by cells
                                  of gastrointestinal origin. Further, we calculated the ratio of miRNA expression in the extracellular and intracel-
                                  lular fraction by normalizing for cell number and volume of culture media (Fig. 4d). This analysis revealed several
                                  interesting observations. Several miRNAs such as 41393-3p and 23042-3p were detected at substantially higher
                                  levels in the extracellular fraction across all cell lines (ratio > 10), suggesting that they were likely to be actively
                                  secreted by these cells. On the other hand, several miRNAs had ratios greater than or lesser than one in differ-
                                  ent cell lines. For instance, 28164-3p had a ratio of 5.5 and 0.1 in THP-1 and MDST8 cells respectively, which
                                  indicates that this miRNA is more likely to be secreted by the former. It should be noted that that intracellular
                                  RNA and extracellular RNA were extracted using different reagents, which may introduce bias in measuring
                                  absolute ­expression34–36.

                                  Discussion
                                  Overall, our results show that miRNA profiling by qPCR, NanoString and miRNA-Seq differed significantly
                                  in performance, cost and speed (Table 2). Using a similar cutoff of 50% CV across all platforms, we found that
                                   MiRXES qPCR detected the highest number of miRNAs above the LLOQ in serum. This could be due to the use
                                   of a curated panel (optimized for human biofluids) and the high sensitivity and precision that is typically associ-
                                   ated with qPCR technology. However, we also observed significant variability in performance in the other qPCR
                                   platforms evaluated in this study. Compared to MiRXES qPCR, miRNA-Seq detected slightly fewer miRNAs
                                   above the LLOQ in serum, but offers several advantages such as lower cost and faster turnaround time. Further-
                                   more, the miRNA-Seq assay is target agnostic and will not require sample-specific optimization. The NanoString
                                   platform detected the lowest number of miRNAs above the LLOQ in serum. This could be due to several reasons:
                                   (a) in contrast to qPCR and miRNA-Seq, the NanoString assay is likely to have lower sensitivity as it does not
                                   involve target amplification, (b) the NanoString assay only allows a maximum RNA input volume of 3 µl, which
                                   is slightly lower than that of miRNA-Seq and qPCR. On the latter, we have found that using higher amounts of
                                   RNA input can increase the number of miRNAs detected above the LLOQ on the NanoString platform (data
                                   not shown). Therefore, it is likely that the performance of the NanoString platform on biofluid samples can be
                                   improved by increasing the overall RNA concentration of the sample, e.g., using vacuum concentration or a
                                   starting with higher volume of serum or plasma.
                                       MiRNA biomarker development and successful translation into the clinic will require a robust assay that is
                                   capable of performing reliable measurement of miRNA abundance. Therefore, applying an LLOQ cutoff during
                                   biomarker discovery would be a reasonable approach to select candidates for subsequent follow up. To that end,
                                   we found that the number of miRNAs that can be reliably measured in serum reaches saturation at a sequencing
                                   depth of ~ 20 million reads. We suggest that this fit-for-purpose approach to validate the miRNA-Seq assay can
                                   maximize cost effectiveness by providing a rational basis for the amount of sequencing required per sample.
                                       The platform-specific biases in miRNA detection that we observed in biofluids are not surprising, given that
                                   similar observations were made in other sample types. Nonetheless, we observed a high degree of overlap and
                                   strong correlation between miRNA-Seq and qPCR. Even though qPCR platforms are limited to the number of
                                   assays available, we showed that using miRNA-Seq to identify candidate miRNA biomarkers for subsequent vali-
                                   dation by qPCR is a viable approach. The use of an expanded panel allowed us to perform qPCR-based measure-
                                   ments for the majority (86%) of miRNAs that were detected by miRNA-Seq, which resulted in the co-detection
                                   of 320 miRNAs on both platforms. To our knowledge, this is the largest number of miRNAs that can be reliably
                                   measured on two independent platforms in a single serum sample. Given the strengths and weaknesses of each
                                   platform, we propose that using miRNA-Seq for miRNA biomarker discovery and subsequent validation using
                                   qPCR represents a rational combination for miRNA biomarker development. However, our study did not assess
                                   the ability of each platform to detect differences between samples (e.g., healthy individuals and patients), so the
                                   potential of this approach will have to be evaluated in a subsequent study.
                                       Another advantage of using miRNA-Seq for biomarker discovery is its ability to identify novel miRNAs. Of
                                   the 14 mature miRNAs that were selected for further analysis, most of them were also detected by qPCR in Ref.
                                   Serum. The existence of these predicted miRNAs in the serum suggests that they might be actively or selectively
                                  ­secreted37. Alternatively, these miRNAs may also be released into the circulation as a by-product of cell ­death37.
                                  By measuring the intracellular and extracellular expression levels of these predicted miRNAs across multiple cell
                                  lines, we provide experimental validation for many of these novel miRNAs and evidence for their active and/or
                                  tissue-specific secretion into the circulation.

                                  Methods
                                  Ethics statement.       All patients provided written informed consent according to the Declaration of Hel-
                                  sinki, and the study was approved by the institutional review board of the National University Hospital (Singa-
                                  pore). All methods in this study were performed in accordance with relevant guidelines and regulations.

Scientific Reports |   (2021) 11:4435 |                 https://doi.org/10.1038/s41598-021-83365-z                                                      7

                                                                                                                                                   Vol.:(0123456789)
www.nature.com/scientificreports/

                                            RNA samples.         Reference Serum is a human serum stock that was created by pooling serum samples from
                                            different individuals (Innovative Research, Inc.). RNA extraction was performed on 200 µl aliquots of Reference
                                            Serum using the miRNeasy Serum/Plasma Kit (Qiagen) by following the manufacturer’s recommendations, with
                                            the following modifications: (a) a set of three proprietary spike-in control RNAs (20 nt, MiRXES) with sequences
                                            distinct from any of the 2588 annotated mature human miRNAs (miRBase release 21) were spiked into the sam-
                                            ple lysis buffer (QIAzol Lysis Reagent, Qiagen) at high, medium and low levels prior to sample RNA isolation;
                                            (b) due to the low abundance of total RNA in serum, bacteriophage MS2 RNA was added into the lysis buffer
                                            (1 µg per ml of QIAZol) to improve RNA isolation yield; (c) after mixing with chloroform, centrifugation was
                                            performed at 18,000×g for 15 min at room temperature; (d) the final elution step was performed with 15 µl of
                                            RNase-free water. RNA extracted from multiple aliquots of Reference Serum was pooled for cross-platform eval-
                                            uation of microRNA profiling. FirstChoice Human Brain Reference RNA (Thermo Fisher Scientific) was used as
                                            a QC sample for miRNA-Seq and NanoString. Plasma samples were obtained from patients undergoing bariatric
                                            surgery at the National University Hospital (NUH). RNA extraction on plasma samples were performed using
                                            the same procedure described above.

                                            Cell lines. The following human cell lines were obtained commercially and cultured using the manufacturer’s
                                            recommendations—HEK-293 (ATCC), THP-1 (ATCC), OE19 (ECACC), NUGC-3 (JCRB), MDST8 (ECACC).
                                            Neural progenitor cells (NPC) were derived from hESCs (Es Cell International Pte Ltd) using a previously pub-
                                            lished ­protocol38. All cell lines were cultured in T75 flasks with 20 to 30 ml of culture media for up to 48 h. Cells
                                            were grown at sub-confluent density to minimize the release of intracellular miRNAs into the culture media
                                            due to cell death. To isolate extracellular RNA, 1 ml of cell culture media was transferred to a 1.5 ml tube and
                                            subjected to centrifugation at 16,000×g for 15 min to remove cells and cell debris. 200 µl of the supernatant was
                                            harvested for RNA extraction using the same procedure described above for serum/plasma. To isolate intracel-
                                            lular RNA, cells were harvested by trypsin treatment (for adherent cell lines), followed by centrifugation at 200×g
                                            for 5 min. The resulting pellet was resuspended in 1 ml of TRI Reagent (Sigma Aldrich) and RNA extraction was
                                            performed following manufacturer’s instructions. The Ct values obtained by qPCR were converted by applying
                                            a sample-specific scaling factor to normalize for the number of cells or amount of cell culture media that was
                                            measured. The normalized expression level for each miRNA was expressed as Arbitrary Units (AU) per million
                                            cells.

                                            MiRXES qPCR.          Ten microliters of serum or plasma RNA was reverse transcribed according to manufac-
                                            turer’s instructions (MiRXES) on a Veriti Thermal Cycler (Applied Biosystems). Template-specific RT primers
                                            for 560 miRNAs were divided into ten primer pools (50- to 60-plex per pool). Each primer pool was used for a
                                            multiplex RT reaction with 1 µl of RNA. A 6-log serial dilution of synthetic templates (­ 107 to 1­ 02 copies) for each
                                            miRNA and a non-template control (nuclease-free water spiked with MS2) were reversed-transcribed with the
                                            isolated sample RNA. This enabled absolute quantification of sample miRNA expression copy numbers through
                                            intrapolation using standards curves generated with synthetic miRNA. Each cDNA sample was pre-amplified by
                                            14 cycles of PCR using Augmentation Primer Pools (MiRXES) on the Veriti Thermal Cycler. Single-plex qPCR
                                            reactions were performed on the pre-amplified cDNA sample using miRNA-specific qPCR assays and Xtensa
                                            Sybr Green qPCR Master Mix according to manufacturer’s instructions (MiRXES). All qPCR reactions were per-
                                            formed with technical duplicates on the ViiA qPCR system (384-well configuration, Applied Biosystems). Raw
                                            threshold cycle (Ct) values were calculated using the ViiA 7 RUO software with automatic baseline setting and
                                            a threshold of 0.5. After quantification, miRNA levels (in copies per ml of serum or plasma) were determined
                                            by intra-polation of the sample miRNA Ct value to the standard curve of its synthetic miRNA template (Sup-
                                            plementary Table S4). Technical variations were normalized by a set of three proprietary spike-in control RNAs
                                            that were spiked at high, medium and low concentration prior to RNA isolation. For the 92 new miRNA assays
                                            that were added to the expanded panel, specific miRNA RT-qPCR assays were developed and miRNAs were
                                            measured using a similar qPCR workflow described above. RT primers for the 92 miRNAs were divided into two
                                            primer pools (50–60-plex per pool). Each primer pool was used for a multiplex RT reaction with 1 µl of RNA.

                                            ABI qPCR.       Ten microliters of serum RNA was reversed transcribed using Megaplex RT Primers, Human
                                            Pool Set v3.0 (PN 4444745) with the Taqman MicroRNA Reverse Transcription Kit (PN 4366596) on the Veriti
                                            Thermal Cycler following the manufacturer’s protocol. The cDNA was pre-amplified using Megaplex PreAmp
                                            Primers (PN 4444748) and TaqMan PreAmp Master Mix (PN 4,391,128) on a Veriti Thermal Cycler. The pre-
                                            amplified cDNA was diluted 1:4 in TE then diluted 1:100 in 1× TaqMan Universal Master Mix II (PN 4440048)
                                            before loading on the matching TaqMan Array Human MicroRNA A + B Cards Set v3.0 (PN 4444913). The
                                            TaqMan Array Cards were sealed, briefly centrifuged, and run on a ViiA qPCR system using a TaqMan Array
                                            Block. Raw Ct values were calculated using the ViiA 7 RUO software with automatic baseline setting and a
                                            threshold of 0.5 (Supplementary Table S5).

                                            Exiqon qPCR.         Ten microliters of serum RNA with UniSp6 RNA spike-in was reverse transcribed using the
                                            Universal cDNA Synthesis Kit II (PN 203301) on the Veriti Thermal Cycler. The cDNA was diluted 1:100 in Exi-
                                            LENT SYBR Green MM (PN 203,421) before loading on the microRNA Ready-to-Use PCR, Human panel I + II,
                                            V4.M (PN 203615). The PCR plates were sealed, briefly centrifuged and run on ViiA qPCR system (384-well
                                            configuration). Raw Ct values were calculated using the ViiA 7 RUO software with automatic baseline setting
                                            and a threshold of 0.5. A normalization factor for each sample was calculated from the residual Ct of UniSp6 and
                                            the inter-plate calibrator UniSp3 in comparison to their respective averages over all samples. The normalization

          Scientific Reports |   (2021) 11:4435 |                https://doi.org/10.1038/s41598-021-83365-z                                                      8

Vol:.(1234567890)
www.nature.com/scientificreports/

                                  factor was then subtracted from the raw Ct for the normalized Ct for each miRNA in that sample (Supplemen-
                                  tary Table S6).

                                  Qiagen qPCR. Ten microliters of serum RNA with miRTC was reversed transcribed using the miScript
                                  II RT Kit (PN 218161) on a Veriti Thermal Cycler. The cDNA was pre-amplified using the miScript PreAMP
                                  Primer Mix Human miRNome (miRBase V16) (PN 331251, MBHS-3216Z) and miScript PreAMP PCR Kit (PN
                                  331451) on a Veriti Thermal Cycler. The pre-amplified cDNA was diluted 1:5 in nuclease free water, followed by
                                  1:40 dilution in QuantiTect Sybr Green Mix from the miScript SYBR Green PCR Kit (PN 218075) before loading
                                  on the matching miScript miRNA PCR Array Human miRNome (PN 331222, MIHS-3216Z). The PCR plates
                                  were sealed, briefly centrifuged and run on a ViiA qPCR system (384-well configuration). Raw Ct values were
                                  calculated using the ViiA 7 RUO software with automatic baseline setting and a threshold of 0.5. A normaliza-
                                  tion factor for each sample was calculated from the residuals of the Ct of miRTC and the PPC in comparison to
                                  their respective averages over all samples. The normalization factor was then subtracted from the raw Ct for the
                                  normalized Ct for each miRNA in that sample (Supplementary Table S7).

                                  NanoString. Three microliters of serum RNA and 100 ng of brain RNA were processed according to the
                                  manufacturer’s recommendations for the nCounter Human v3 miRNA Expression Assay Kit (NanoString; CSO-
                                  MIR3-12). Each sample was scanned for 555 FOV on the nCounter Digital Analyzer. Raw count data from inde-
                                  pendent runs of Reference Serum were processed together in nSolver (v2.0; NanoString). For each gene, count
                                  data was processed as follows: (a) background subtraction using the geometric mean of the negative controls,
                                  (b) normalization to the geometric mean of the positive controls, and (c) normalization to the geometric mean
                                  of the top 100 most highly expressed microRNAs.

                                  miRNA‑Seq. miRNA-Seq libraries were prepared using the TruSeq Small RNA Library Prep Kit (Illumina;
                                  RS-200-0012) or the NEXTflex Illumina Small RNA Sequencing Kit v2 (Bioo Scientific; NOVA-5132-03). Brain
                                  QC libraries were prepared using 1 µg of FirstChoice Human Brain Reference RNA. For the TruSeq method,
                                  library preparation was performed using 5 µl of RNA following the manufacturer’s recommendations (Rev.F;
                                  February 2014). 11 cycles of PCR were performed for the Brain QC samples, 15 cycles of PCR were performed
                                  for the Reference Serum samples, and 18 cycles of PCR were performed for the plasma samples. For the NEX-
                                  Tflex method, library preparation was performed using 4 µl of total RNA following the manufacturer’s recom-
                                  mendations (V14.11). 15 cycles of PCR were performed for the Brain QC samples and Reference Serum samples.
                                      For both methods, gel purification of the library construct was performed by ethanol precipitation. Purified
                                  libraries were verified on a High Sensitivity D1000 ScreenTape (Agilent Technologies) and quantified by real-
                                  time PCR using a Library Quantification Kit (KAPA Biosystems). Pooled libraries from each run were loaded at
                                  1.8 pM for 1 × 40 bp sequencing on a NextSeq 500 using a High Output Kit (Illumina.). Sequence data in fastq
                                  format was obtained using bcl2fastq (v2.16).
                                      The CAP-miRSeq p   ­ ipeline39 was used to process and analyze miRNA-Seq data. In brief, reads were trimmed
                                  for low quality bases and Illumina adapter sequences using c­ utadapt40. For data generated using the NEXTflex
                                  method, additional trimming was performed to remove the randomized adapter sequences at the ligation junc-
                                  tions. Trimmed reads were aligned to the hg38 reference genome assembly (http://hgdow​nload​.cse.ucsc.edu/
                                  golde​nPath​/hg38/bigZi​ps/hg38.fa.gz) using the miRDeep2 p   ­ ackage41. Expression levels for known microRNAs
                                  were quantified by counting reads mapping to microRNA coordinates defined in miRBase release 21 (ftp://mirba​
                                  se.org/pub/mirba​se/21) and novel microRNAs were also predicted by miRDeep2. Based on structure and read
                                  signature for each potential miRNA precursor, the mirDeep2 core algorithm assigns a score for each potential
                                  miRNA precursor that reflects the likelihood of it being a genuine miRNA. The CAP-miRSeq pipeline was run
                                  using default parameters. Within each sample, expression levels for mature microRNAs were normalized to
                                  reads per million mapped reads (RPM).

                                  Statistical analyses. The lower limit of quantification (LLOQ) was determined using at least three inde-
                                  pendent runs on each platform. The microRNA expression data was fitted by LOESS (locally estimated scat-
                                  terplot smoothing), to estimate the trend between mean expression (e.g., normalized counts or Ct values) and
                                  variability (i.e., coefficient of variation). LLOQ was determined using a cutoff of 50% CV on all platforms (Sup-
                                  plementary File 1). Lin’s concordance correlation ­coefficient42 was calculated using the epi.ccc function in the
                                  epiR package (https​://cran.r-proje​ct.org/web/packa​ges/epiR/index​.html).

                                  Code availability
                                  Raw data have been deposited in the NCBI Sequence Read Archive under study accession number SRP090487.

                                  Received: 26 August 2020; Accepted: 2 February 2021

                                  References
                                   1. Kloosterman, W. P. & Plasterk, R. H. The diverse functions of microRNAs in animal development and disease. Dev. Cell 11, 441–450.
                                      https​://doi.org/10.1016/j.devce​l.2006.09.009 (2006).
                                   2. Lagos-Quintana, M., Rauhut, R., Lendeckel, W. & Tuschl, T. Identification of novel genes coding for small expressed RNAs. Science
                                      294, 853–858. https​://doi.org/10.1126/scien​ce.10649​21 (2001).
                                   3. Kim, V. N. MicroRNA biogenesis: Coordinated cropping and dicing. Nat. Rev. Mol. Cell Biol. 6, 376–385. https​://doi.org/10.1038/
                                      nrm16​44 (2005).

Scientific Reports |   (2021) 11:4435 |                   https://doi.org/10.1038/s41598-021-83365-z                                                                 9

                                                                                                                                                               Vol.:(0123456789)
www.nature.com/scientificreports/

                                             4. Bartel, D. P. MicroRNAs: Target recognition and regulatory functions. Cell 136, 215–233. https:​ //doi.org/10.1016/j.cell.2009.01.002
                                                (2009).
                                             5. Krol, J., Loedige, I. & Filipowicz, W. The widespread regulation of microRNA biogenesis, function and decay. Nat. Rev. Genet. 11,
                                                597–610. https​://doi.org/10.1038/nrg28​43 (2010).
                                             6. Okada, H., Kohanbash, G. & Lotze, M. T. MicroRNAs in immune regulation–opportunities for cancer immunotherapy. Int. J.
                                                Biochem. Cell Biol. 42, 1256–1261. https​://doi.org/10.1016/j.bioce​l.2010.02.002 (2010).
                                             7. Cortez, M. A. et al. MicroRNAs in body fluids–the mix of hormones and biomarkers. Nat. Rev. Clin. Oncol. 8, 467–477. https​://
                                                doi.org/10.1038/nrcli​nonc.2011.76 (2011).
                                             8. Arroyo, J. D. et al. Argonaute2 complexes carry a population of circulating microRNAs independent of vesicles in human plasma.
                                                Proc. Natl. Acad. Sci. U.S.A. 108, 5003–5008. https​://doi.org/10.1073/pnas.10190​55108​ (2011).
                                             9. Cheung, K. W. E. et al. The potential of circulating cell free RNA as a biomarker in cancer. Expert Rev. Mol. Diagn. 19, 579–590.
                                                https​://doi.org/10.1080/14737​159.2019.16333​07 (2019).
                                            10. Hermann, S. et al. Diagnostic potential of circulating cell-free microRNAs for community-acquired pneumonia and pneumonia-
                                                related sepsis. J. Cell Mol. Med. https​://doi.org/10.1111/jcmm.15837​ (2020).
                                            11. Mitchell, P. S. et al. Circulating microRNAs as stable blood-based markers for cancer detection. Proc. Natl. Acad. Sci. U.S.A. 105,
                                                10513–10518. https​://doi.org/10.1073/pnas.08045​49105​ (2008).
                                            12. Cho, W. C. Circulating microRNAs as minimally invasive biomarkers for cancer theragnosis and prognosis. Front. Genet. 2, 7.
                                                https​://doi.org/10.3389/fgene​.2011.00007​ (2011).
                                            13. Wang, P. et al. The serum miR-21 level serves as a predictor for the chemosensitivity of advanced pancreatic cancer, and miR-21
                                                expression confers chemoresistance by targeting FasL. Mol. Oncol. 7, 334–345. https:​ //doi.org/10.1016/j.molonc​ .2012.10.011 (2013).
                                            14. Nik Mohamed Kamal, N. & Shahidan, W. N. S. Non-exosomal and exosomal circulatory microRNAs: Which are more valid as
                                                biomarkers?. Front. Pharmacol. 10, 1500. https​://doi.org/10.3389/fphar​.2019.01500​ (2019).
                                            15. Fiammengo, R. Can nanotechnology improve cancer diagnosis through miRNA detection?. Biomark. Med. 11, 69–86. https​://doi.
                                                org/10.2217/bmm-2016-0195 (2017).
                                            16. Lu, T. X. & Rothenberg, M. E. MicroRNA. J. Allergy Clin. Immunol. 141, 1202–1207. https​://doi.org/10.1016/j.jaci.2017.08.034
                                                (2018).
                                            17. Pritchard, C. C., Cheng, H. H. & Tewari, M. MicroRNA profiling: Approaches and considerations. Nat. Rev. Genet. 13, 358–369.
                                                https​://doi.org/10.1038/nrg31​98 (2012).
                                            18. Mathew, R., Mattei, V., Al Hashmi, M. & Tomei, S. Updates on the current technologies for microRNA profiling. Microrna 9, 17–24.
                                                https​://doi.org/10.2174/22115​36608​66619​06281​12722​ (2020).
                                            19. Mestdagh, P. et al. Evaluation of quantitative miRNA expression platforms in the microRNA quality control (miRQC) study. Nat.
                                                Methods 11, 809–815. https​://doi.org/10.1038/nmeth​.3014 (2014).
                                            20. Buitrago, D. H. et al. Small RNA sequencing for profiling microRNAs in long-term preserved formalin-fixed and paraffin-embedded
                                                non-small cell lung cancer tumor specimens. PLoS ONE 10, e0121521. https​://doi.org/10.1371/journ​al.pone.01215​21 (2015).
                                            21. Foye, C. et al. Comparison of miRNA quantitation by Nanostring in serum and plasma samples. PLoS ONE 12, e0189165. https​
                                                ://doi.org/10.1371/journ​al.pone.01891​65 (2017).
                                            22. Giraldez, M. D. et al. Comprehensive multi-center assessment of small RNA-seq methods for quantitative miRNA profiling. Nat.
                                                Biotechnol. 36, 746–757. https​://doi.org/10.1038/nbt.4183 (2018).
                                            23. Yeri, A. et al. Evaluation of commercially available small RNASeq library preparation kits using low input RNA. BMC Genomics
                                                19, 331. https​://doi.org/10.1186/s1286​4-018-4726-6 (2018).
                                            24. Ying, L. et al. Development of a serum miRNA panel for detection of early stage non-small cell lung cancer. Proc. Natl. Acad. Sci.
                                                U.S.A. 117, 25036–25042. https​://doi.org/10.1073/pnas.20062​12117​ (2020).
                                            25. So, J. B. Y. et al. Development and validation of a serum microRNA biomarker panel for detecting gastric cancer in a high-risk
                                                population. Gut. https​://doi.org/10.1136/gutjn​l-2020-32206​5 (2020).
                                            26. Wong, L. L. et al. Combining circulating microRNA and NT-proBNP to detect and categorize heart failure subtypes. J. Am. Coll.
                                                Cardiol. 73, 1300–1313. https​://doi.org/10.1016/j.jacc.2018.11.060 (2019).
                                            27. Choi, H. et al. Plasma protein and microRNA biomarkers of insulin resistance: A network-based integrative -omics analysis. Front.
                                                Physiol. 10, 379. https​://doi.org/10.3389/fphys​.2019.00379​ (2019).
                                            28. Saw, W. Y. et al. Establishing multiple omics baselines for three Southeast Asian populations in the Singapore integrative omics
                                                study. Nat. Commun. 8, 653. https​://doi.org/10.1038/s4146​7-017-00413​-x (2017).
                                            29. Dard-Dascot, C. et al. Systematic comparison of small RNA library preparation protocols for next-generation sequencing. BMC
                                                Genomics 19, 118. https​://doi.org/10.1186/s1286​4-018-4491-6 (2018).
                                            30. Baran-Gale, J. et al. Addressing bias in Small RNA library preparation for sequencing: A new protocol recovers microRNAs that
                                                evade capture by current methods. Front. Genet. 6, 352. https​://doi.org/10.3389/fgene​.2015.00352​ (2015).
                                            31. Crossland, R. E. et al. Expression of serum microRNAs is altered during acute graft-versus-host disease. Front. Immunol. 8, 308.
                                                https​://doi.org/10.3389/fimmu​.2017.00308​ (2017).
                                            32. Van Laar, R., Lincoln, M. & Van Laar, B. Development and validation of a plasma-based melanoma biomarker suitable for clinical
                                                use. Br. J. Cancer 118, 857–866. https​://doi.org/10.1038/bjc.2017.477 (2018).
                                            33. Montalbo, R. et al. Prognostic value of circulating microRNAs in upper tract urinary carcinoma. Oncotarget 9, 16691–16700. https​
                                                ://doi.org/10.18632​/oncot​arget​.24672​ (2018).
                                            34. Kloten, V. et al. Multicenter evaluation of circulating plasma microRNA extraction technologies for the development of clinically
                                                feasible reverse transcription quantitative PCR and next-generation sequencing analytical work flows. Clin. Chem. 65, 1132–1140.
                                                https​://doi.org/10.1373/clinc​hem.2019.30327​1 (2019).
                                            35. Wong, R. K. Y., MacMahon, M., Woodside, J. V. & Simpson, D. A. A comparison of RNA extraction and sequencing protocols for
                                                detection of small RNAs in plasma. BMC Genomics 20, 446. https​://doi.org/10.1186/s1286​4-019-5826-7 (2019).
                                            36. McAlexander, M. A., Phillips, M. J. & Witwer, K. W. Comparison of methods for miRNA extraction from plasma and quantitative
                                                recovery of RNA from cerebrospinal fluid. Front. Genet. 4, 83. https​://doi.org/10.3389/fgene​.2013.00083​ (2013).
                                            37. Schwarzenbach, H., Nishida, N., Calin, G. A. & Pantel, K. Clinical relevance of circulating cell-free microRNAs in cancer. Nat.
                                                Rev. Clin. Oncol. 11, 145–156. https​://doi.org/10.1038/nrcli​nonc.2014.5 (2014).
                                            38. Swistowski, A. et al. Efficient generation of functional dopaminergic neurons from human induced pluripotent stem cells under
                                                defined conditions. Stem Cells 28, 1893–1904. https​://doi.org/10.1002/stem.499 (2010).
                                            39. Sun, Z. et al. CAP-miRSeq: A comprehensive analysis pipeline for microRNA sequencing data. BMC Genomics 15, 423. https​://
                                                doi.org/10.1186/1471-2164-15-423 (2014).
                                            40. Martin, M. Cutadapt removes adapter sequences from high-throughput sequencing reads. EMBnet J. 17(3), 2011. https​://doi.
                                                org/10.14806​/ej.17.1.200 (2011).
                                            41. Friedlander, M. R., Mackowiak, S. D., Li, N., Chen, W. & Rajewsky, N. miRDeep2 accurately identifies known and hundreds of
                                                novel microRNA genes in seven animal clades. Nucleic Acids Res. 40, 37–52. https​://doi.org/10.1093/nar/gkr68​8 (2012).
                                            42. Lin, L. I. A concordance correlation coefficient to evaluate reproducibility. Biometrics 45, 255–268 (1989).

          Scientific Reports |   (2021) 11:4435 |                    https://doi.org/10.1038/s41598-021-83365-z                                                                   10

Vol:.(1234567890)
www.nature.com/scientificreports/

                                  Acknowledgements
                                  The authors would like to acknowledge Deborah Chen, Khong Ming Peh and Sarah Ho for providing cell lines,
                                  and John Kang for providing the script to calculate LLOQ.

                                  Author contributions
                                  L.Z.H., L.Z. and S.S. conceived of the study and designed the experiments. L.Z.H., R.Z., A.L.S.C. and L.Z., per-
                                  formed the experiments. L.Z.H., R.Z., L.Z., C.C. and S.S. analyzed the data and/or provided intellectual guidance
                                  in their interpretation. C.M.K. conducted the surgery and provided plasma samples. L.Z.H. and L.Z. wrote the
                                  paper and all authors reviewed the manuscript.

                                  Competing interests
                                  L.Z. and R.Z. are shareholders and employees of MiRXES. The other authors declare no competing interests.

                                  Additional information
                                  Supplementary Information The online version contains supplementary material available at https​://doi.
                                  org/10.1038/s4159​8-021-83365​-z.
                                  Correspondence and requests for materials should be addressed to L.Z.H.
                                  Reprints and permissions information is available at www.nature.com/reprints.
                                  Publisher’s note Springer Nature remains neutral with regard to jurisdictional claims in published maps and
                                  institutional affiliations.
                                                Open Access This article is licensed under a Creative Commons Attribution 4.0 International
                                                License, which permits use, sharing, adaptation, distribution and reproduction in any medium or
                                  format, as long as you give appropriate credit to the original author(s) and the source, provide a link to the
                                  Creative Commons licence, and indicate if changes were made. The images or other third party material in this
                                  article are included in the article’s Creative Commons licence, unless indicated otherwise in a credit line to the
                                  material. If material is not included in the article’s Creative Commons licence and your intended use is not
                                  permitted by statutory regulation or exceeds the permitted use, you will need to obtain permission directly from
                                  the copyright holder. To view a copy of this licence, visit http://creat​iveco​mmons​.org/licen​ses/by/4.0/.

                                  © The Author(s) 2021

Scientific Reports |   (2021) 11:4435 |                https://doi.org/10.1038/s41598-021-83365-z                                                11

                                                                                                                                             Vol.:(0123456789)
You can also read