The anti diabetic effects of NAG 1/ GDF15 on HFD/STZ induced mice - Nature
←
→
Page content transcription
If your browser does not render page correctly, please read the page content below
www.nature.com/scientificreports
OPEN The anti‑diabetic effects of NAG‑1/
GDF15 on HFD/STZ‑induced mice
Pattawika Lertpatipanpong1, Jaehak Lee1, Ilju Kim1, Thomas Eling2, Seung Yeon Oh3,
Je Kyung Seong3,4 & Seung Joon Baek1*
Nonsteroidal anti-inflammatory drug-activated gene-1 (NAG-1) plays a role in various diseases.
Here, the anti-diabetic effects of NAG-1 were evaluated using a high-fat diet/streptozotocin-
induced diabetic mouse model. NAG-1-overexpressing transgenic (NAG-1 Tg) mice exhibited lower
body weight, fasting blood glucose levels, and serum insulin levels than wild-type (WT) mice. The
homeostatic model assessment of insulin resistance scores of NAG-1 Tg mice were lower than those of
WT mice. Hematoxylin and eosin staining revealed a smaller lipid droplet size in the adipose tissues,
lower lipid accumulation in the hepatocytes, and larger beta cell area in the pancreas of NAG-1 Tg
mice than in those of WT mice. Immunohistochemical analysis revealed downregulated expression
of cleaved caspase-3, an apoptosis marker, in the beta cells of NAG-1 Tg mice. Adiponectin and leptin
mRNA levels were upregulated and downregulated in NAG-1 Tg mice, respectively. Additionally,
the expression of IRS1/PI3K/AKT signaling pathway components, especially Foxo1, which regulates
gluconeogenesis in the muscle and white adipose tissue, was downregulated in NAG-1 Tg mice.
Furthermore, NAG-1 overexpression promoted the expression of As160 in both muscles and
adipocytes, and the mRNA levels of the NLRP3 pathway members were downregulated in NAG-1 Tg
mice. Our findings suggest that NAG-1 expression alleviates diabetes in mice.
Nonsteroidal anti-inflammatory drug-activated gene 1 (NAG-1), also known as growth differentiation factor
15 (GDF15), is a member of the TGF-β superfamily. The signaling and function of NAG-1 are associated with
cell and tissue homeostasis. Previous studies have reported that patients with critical illnesses or those under
stress exhibit upregulated serum NAG-1 levels1. In contrast, the expression of serum NAG-1 is downregulated
under normal physiological c onditions2. Recent studies have indicated that NAG-1 is a major regulator of energy
metabolism and a ppetite3. Additionally, NAG-1 is reported to contribute to the pathogenesis of various dis-
eases, such as cardiovascular diseases, obesity, inflammation, cognitive impairment, and c ancer1. NAG-1 exerts
its effects, probably through mature NAG-1 and pro-NAG-1 forms, which are secreted into the extracellular
matrix4–6. In contrast to mature NAG-1, the biological activity of pro-NAG-1 has not been extensively investi-
gated, except that the nuclear translocation of intercellular pro-NAG-1 regulates the transcription of members
of the SMAD p athways4.
The increasing prevalence of diabetes is a global health concern. Type 2 diabetes mellitus (T2DM) is charac-
terized by persistent hyperglycemia. The major phenotypes of T2DM include dysregulated insulin response in
the corresponding cells and insufficient insulin production in the pancreas. Furthermore, prolonged high blood
glucose levels can lead to other complications, such as diabetic retinopathy, diabetic neuropathy, diabetic foot,
cognitive deficits, and cardiovascular diseases7. Obesity and a sedentary lifestyle are the major causes of diabetes
that contribute to increased morbidity and m ortality8.
There are contradictory reports on the role of NAG-1 in diabetes. For example, in a study examining the
correlation between NAG-1 and beta cell function, serum NAG-1 levels were upregulated in the prediabetes
and diabetes groups. Additionally, the upregulated serum NAG-1 levels were correlated with HbA1c, glucose,
insulin, baseline, and dynamic indices of insulin sensitivity9. These results suggest that glucose upregulates
serum NAG-1 levels in patients with diabetes, indicating that serum NAG-1 could be a potential marker for
identifying individuals who are at risk for developing diabetes and obesity. Conversely, NAG-1 Tg mice exhibit
increased energy metabolism, decreased body weight, and improved glucose and insulin responses10. Moreover,
1
Laboratory of Signal Transduction, College of Veterinary Medicine and Research Institute for Veterinary
Science, Seoul National University, 1 Gwanak‑ro, Gwanak‑gu, Seoul 08826, South Korea. 2National Institute of
Environmental Health Science, 111 TW Alexander Dr. Research Triangle Park, NC 27709, USA. 3Laboratory of
Developmental Biology and Genomics, BK21 Plus Program for Advanced Veterinary Science, Research Institute
for Veterinary Science, College of Veterinary Medicine, and Korea Mouse Phenotyping Center, Seoul National
University, Seoul 08826, South Korea. 4Interdisciplinary Program for Bioinformatics, Seoul National University,
Seoul 08826, South Korea. *email: baeksj@snu.ac.kr
Scientific Reports | (2021) 11:15027 | https://doi.org/10.1038/s41598-021-94581-y 1
Vol.:(0123456789)
www.nature.com/scientificreports/
Figure 1. (A) Schematic diagram representing the timeline for experiments using the diabetes mouse model.
NAG-1-overexpressing transgenic (n = 5) and wild-type (n = 5) male mice were fed with high-fat diet throughout
the experiment. The mice were administered low-dose streptozotocin at weeks 9 and 10. Individual mice with
blood sugar levels of > 200 mg/dL were considered to be animals with type 2 diabetes mellitus. (B) ELISA assay
for human NAG-1 level in mouse serum. Data are presented as mean ± standard error, ***p < 0.01, compared
with the wildtype group.
the administration of recombinant NAG-1 decreases food intake and body weight, which results in decreased
adiposity and improved glucose tolerance and insulin sensitivity in obese and wild-type m ice11. Interestingly, met-
formin, a first-line drug for T2DM, promotes body weight loss through the upregulation of NAG-112. Although
the role of NAG-1 in the pathogenesis of diabetes is unclear, the expression of NAG-1, in both mature NAG-1
and pro-NAG-1 forms, may play a role in the disease process.
The correlation between obesity-induced chronic inflammation and insulin resistance has been extensively
investigated. The NLR family pyrin domain containing 3 (NLRP3) inflammasome, which plays an important
role in regulating inflammatory cytokines, is associated with metabolic d isorders13. Activation of the NLRP3
inflammasome promotes the secretion of interleukin-1β (IL-1β) and interleukin-18 (IL-18), which induce
inflammation. The downregulation of NLRP3 inflammasome activity in NAG-1 Tg mice may confer resistance
against diet-induced obesity and improve insulin s ensitivity14. Another study suggested that IL-1β and IL-18 are
associated with obesity-associated inflammation and promote insulin resistance15. Thus, NLRP3 may be a novel
therapeutic target to alleviate inflammasome hyperactivation in patients with diabetes.
The goal of this study was to elucidate the role of NAG-1 in insulin signaling, which is the major pathway
that regulates cellular metabolic pathways, such as those involved in glucose and lipid metabolism. Mice were
fed a high-fat diet (HFD) and administered a low dose of streptozotocin (STZ) to induce T2DM, and the IRS1/
AKT/PI3K signaling pathway was examined. The findings of this study indicate that NAG-1 regulates the insulin
pathway; thus, NAG-1 could be a biomarker for determining the efficacy of anti-diabetic agents.
Results
NAG‑1 Tg mice exhibit decreased body weight and blood glucose level. It has been reported
that the body weight of NAG-1 Tg mice is lower than that of their sibling WT mice, in both genetically modi-
fied and HFD-induced obese animal m odels10,16,17. In this study, the effect of NAG-1 expression on STZ-treated
mice was investigated (Fig. 1A). NAG-1 Tg mice express ~ 19 ng/ml of human NAG-1 in their serum, whereas
no detectable human NAG-1 was found in their sibling WT mice (Fig. 1B). The body weight of NAG-1 Tg mice
was significantly lower than that of WT mice (Fig. 2A), which concurred with the findings of a previous study
on non-STZ-treated mice10. The incremental changes in body weight between weeks 6 and 11 in NAG-1 Tg
mice (20.65 ± 3.27%) were markedly lower than those in WT mice (46.24 ± 15.35%) (Fig. 2B). The blood glucose
levels in NAG-1 Tg mice significantly decreased, especially after week 9, which was the time point at which STZ
treatment was initiated (Fig. 2C). The change in blood glucose level between the baseline and final week in WT
mice (86.20 ± 39.63 mg/dL) was markedly higher than that in NAG-1 Tg mice (9.60 ± 12.85 mg/dL) (Fig. 2D).
Scientific Reports | (2021) 11:15027 | https://doi.org/10.1038/s41598-021-94581-y 2
Vol:.(1234567890)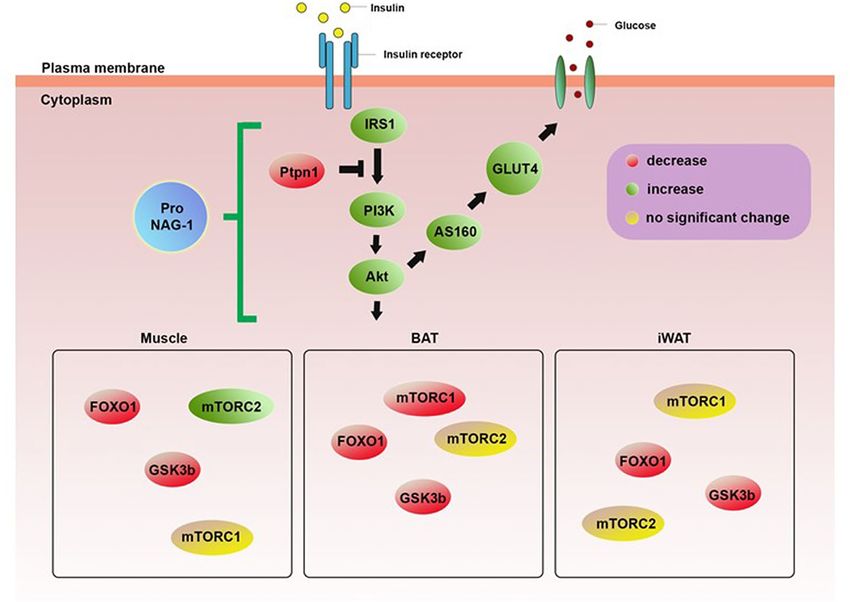
www.nature.com/scientificreports/

                                  Figure 2.  Effects of NAG-1 on body weight and glucose level in high-fat diet/streptozotocin-induced diabetes
                                  mouse model. (A) Body weight, (B) change in body weight, (C) blood glucose level, and (D) change in blood
                                  glucose level. Data are presented as mean ± standard error, ***p < 0.01, compared with the wild-type group. n = 5
                                  for all experiments.

                                  Thus, the body weight and blood glucose levels decreased in NAG-1 Tg mice, indicating that NAG-1 expression
                                  decreases blood glucose levels in the HFD/STZ-induced diabetic mouse model.

                                  NAG‑1 Tg mice exhibit increased insulin sensitivity. The levels of fasting blood glucose and insulin
                                  were measured, and the intraperitoneal glucose tolerance test (IPGTT) and intraperitoneal insulin tolerance test
                                  (IPITT) were performed before the mice were euthanized. The fasting blood glucose levels in NAG-1 Tg mice
                                  were significantly lower than those in WT mice (121.67 ± 27.79 mg/dL vs. 248.33 ± 70.30 mg/dL; p = 0.0216)
                                  (Fig. 3A). Additionally, the fasting insulin levels were significantly lower in NAG-1 Tg mice than in WT mice
                                  (0.28 ± 0.03 vs. 0.65 ± 0.19 ng/mL; p = 0.0341) (Fig. 3B). Glucose tolerance and insulin sensitivity were measured
                                  in both NAG-1 Tg and WT mice. WT mice exhibited higher serum glucose levels than NAG-1 Tg mice during
                                  the 120-min period after glucose administration (Fig. 3C,D). The area under the curve (AUC) of glucose in
                                  NAG-1 Tg mice was significantly lower than that in WT mice (31,037 ± 924.55 vs. 68,877.76 ± 1250.99; p < 0.001)
                                  (Fig. 3D). To further examine insulin sensitivity, IPITT was performed at different time points (Fig. 3E). The
                                  mice were intraperitoneally administered insulin, and blood samples were collected to measure glucose levels.
                                  Glucose levels (Fig. 3E) significantly decreased after insulin injection and 120 min after insulin administration in
                                  NAG-1 Tg mice. However, the glucose levels were not significantly different between the groups 30- and 60-min
                                  after insulin injection. The AUC of serum glucose (Fig. 3F) in NAG-1 Tg mice was significantly lower than that
                                  in WT mice (13,440.33 ± 645.22 vs. 19,423.00 ± 3221.49; p = 0.0344). The serum insulin levels were determined
                                  through IPGTT (Fig. 3G) significantly decreased 30 min after glucose injection. These results demonstrated that
                                  NAG-1 Tg mice were more sensitive to insulin than WT mice. Insulin resistance and insulin sensitivity were
                                  calculated using the homeostatic model assessment of insulin resistance (HOMA-IR) (Fig. 3H). The HOMA-IR
                                  score (2.14 ± 0.69) in NAG-1 Tg mice was markedly lower than that (12.33 ± 2.86) in WT mice, which indicated
                                  that NAG-1 overexpression increases insulin sensitivity in mice.

                                  Diabetic dyslipidemia and hepatic steatosis in the HFD/STZ‑induced diabetic mouse
                                  model. Histological staining images of the liver, inguinal white adipose tissue (iWAT), epididymal white adi-
                                  pose tissue (eWAT), and brown adipose tissue (BAT) are shown in Fig. 4A. Lipid accumulation and the number
                                  of fat droplets in the hepatic sections were lower in NAG-1 Tg mice than in WT mice. This suggests that NAG-1
                                  overexpression decreases hepatic steatosis. Furthermore, adipose tissue hypertrophy in NAG-1 Tg mice was
                                  lower than that in WT mice. Quantification of the histological data revealed that the size of lipid droplets in the
                                  iWAT, eWAT, and BAT was significantly smaller in NAG-1 Tg mice than in WT mice (p < 0.001) (Fig. 4B–D).

Scientific Reports |   (2021) 11:15027 |               https://doi.org/10.1038/s41598-021-94581-y                                                   3

                                                                                                                                               Vol.:(0123456789)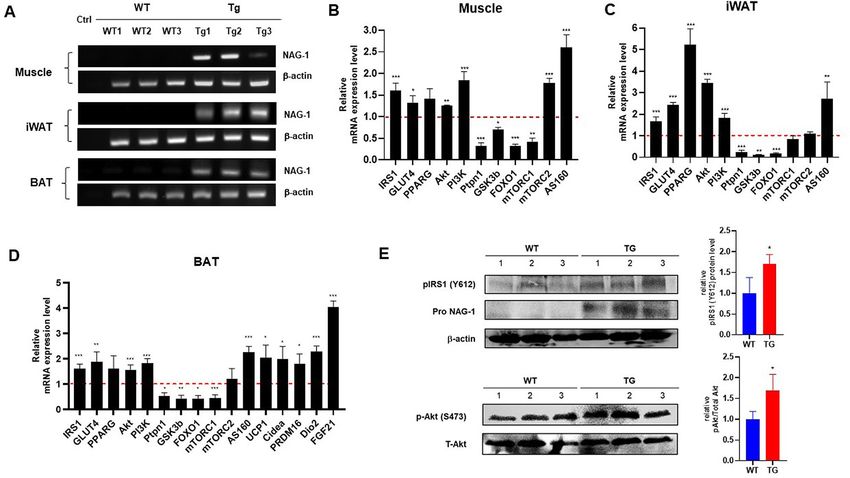
www.nature.com/scientificreports/
Figure 3. Anti-diabetic effect of NAG-1 in high-fat diet/streptozotocin-induced diabetes mouse model. Mice
were allowed to fast for 18 h before the blood sample was collected. (A) Fasting blood glucose level and (B)
fasting insulin level at week 11 before starting the intraperitoneal glucose tolerance test (IPGTT). (C) Fasting
blood glucose levels at the indicated time points in the IPGTT. Mice were allowed to fast for 18 h before the
administration of glucose (2 g/kg body weight). The blood glucose levels were measured at 0, 15, 30, 60, 90,
and 120 min post-glucose injection. (D) The area under the curve of glucose. (E) Fasting blood glucose levels
at the indicated time point in the intraperitoneal insulin tolerance test (IPITT). Mice were allowed to fast
for 6 h before the intraperitoneal administration of insulin (0.75 U/kg bodyweight). The blood samples were
collected to measure the serum glucose at 0, 15, 30, 60, and 120 min post-insulin injection. (F) The area under
the curve of glucose. (G) Serum insulin levels in the IPGTT at the indicated time points. (H) Homeostatic
model assessment of insulin resistance scores. Data are presented as mean ± standard error of mean. *p < 0.05,
**p < 0.01, and ***p < 0.001, compared with the wild-type group (n = 3–5).
The number of crown-like structures (CLS) in the eWAT, a histological hallmark of the pro-inflammatory pro-
cess in the adipose tissue, was significantly lower in NAG-1 Tg mice than in WT mice (p < 0.001), which sug-
gested that there were fewer inflammatory lesions in NAG-1 Tg mice (Fig. 4E,F). The number of CLS in the
iWAT was not significantly different between WT and NAG-1 Tg mice (data not shown).
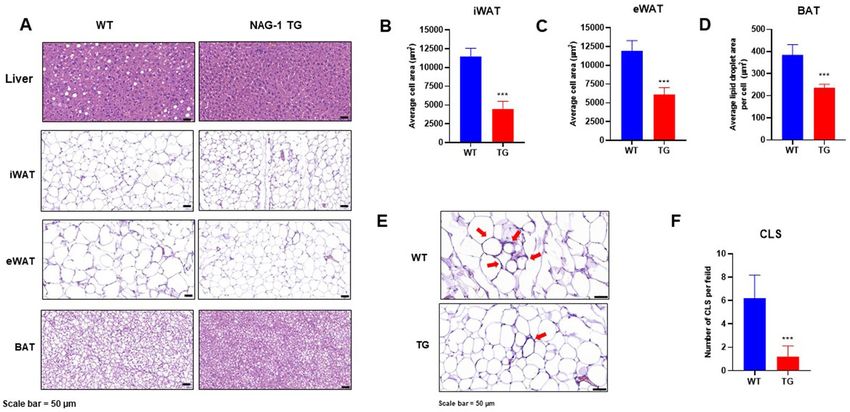
Effects of NAG‑1 overexpression on pancreatic islet architecture in the HFD/STZ‑induced dia‑
betic mouse model. T2DM development is accompanied by the loss of β cells in the pancreatic i slets18. The
effect of NAG-1 overexpression on pancreatic islets was examined using hematoxylin and eosin (H&E) staining
and immunohistochemistry. H&E analysis of the pancreas (Fig. 5A–C) revealed that the islet area in NAG-1
Tg mice was significantly larger than that in WT mice (32,138 ± 10,374.47 µm2 vs. 12,459.39 ± 3072.69 µm2;
p = 0.004). The mean number of beta cells per islet in NAG-1 Tg mice was significantly higher than that in WT
mice (238.63 ± 61.88 cells/islet vs. 109.88 ± 37.78 cells/islet; p = 0.002). Immunohistochemical analysis revealed
that the expression of cleaved caspase-3, a hallmark of apoptosis19, in the pancreatic islets of NAG-1 Tg mice was
lower than that in the pancreatic islets of WT mice (Fig. 5D). This indicates that NAG-1 overexpression delays
the development of T2DM and decreases apoptosis in pancreatic islets.
Effect of NAG‑1 overexpression on mRNA expression level of the insulin signaling pathway
members. To confirm NAG-1 expression in NAG-1 Tg mice, we performed real-time polymerase chain
reaction (RT-PCR) on muscle, iWAT, and BAT. The results indicated the expression of human NAG-1 in NAG-1
Tg mice, whereas no NAG-1 mRNA expression was observed in WT mice (Fig. 6A). To investigate the molecular
mechanisms underlying the NAG-1-mediated regulation of blood glucose levels, a quantitative RT-PCR (qRT-
PCR) analysis was performed to determine the expression levels of several genes related to the insulin signaling
pathway. In NAG-1 Tg mice, the mRNA expression of Irs1, Glut4, Akt, Pi3k, and As160 was upregulated in the
muscle, iWAT, and BAT (Fig. 6B–D). Western blot data showed an increase in phospho-Akt protein expression
in NAG-1 Tg mice, indicating that NAG-1 regulates the phosphorylation of Akt at Ser473. Thus, NAG-1 may
improve glucose metabolism and attenuate insulin resistance via the activation of the IRS1/AKT/PI3K signal-
ing pathway. These results were also confirmed by measuring the mRNA expression levels of the downstream
effectors of the AKT pathway, including Gsk3b, Foxo1, and Mtorc1. The expression levels of downstream effector
Scientific Reports | (2021) 11:15027 | https://doi.org/10.1038/s41598-021-94581-y 4
Vol:.(1234567890)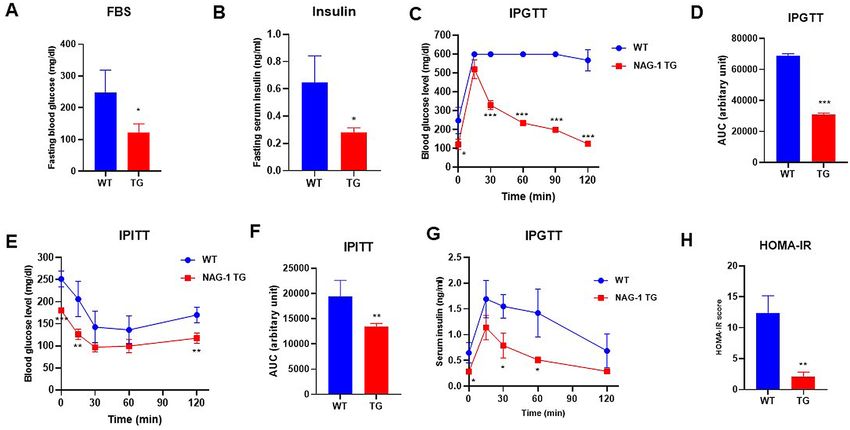
www.nature.com/scientificreports/
Figure 4. NAG-1 overexpression attenuated high-fat diet/streptozotocin-induced diabetic dyslipidemia and
hepatic steatosis in mice. The tissue sections were prepared and stained with hematoxylin and eosin (H&E).
(A) Representative image of the H&E-stained section of the liver, iWAT, eWAT, and BAT. Scale bar = 50 µm.
(B–D) Average lipid droplet area in the iWAT, eWAT, and BAT. (E) Histological staining of crown-like structure
(CLS) in the eWAT. Scale bar = 50 µm. (F) Number of CLS per field (10 fields per group). Data are presented as
mean ± standard error of mean. *p < 0.05 and ***p < 0.001, compared with the control group.
genes were significantly downregulated in the muscles, iWAT, and BAT of NAG-1 Tg mice. Additionally, the
expression level of Ptpn1, a negative regulator of AKT, was downregulated in the muscles, iWAT, and BAT of
NAG-1 Tg mice. Interestingly, the expression level of Mtorc2 was significantly upregulated in the muscles but
not in the iWAT and BAT. A previous study reported that Mtorc2 in muscle tissue contributes to glucose homeo-
stasis by positively regulating the insulin-stimulated phosphorylation of the Akt substrate As160 and negatively
regulating basal glycogen synthase a ctivity20. In contrast, Mtorc2 in adipose tissues controls the expression of
the lipogenic transcription factor ChREBPβ, which increases de novo lipogenesis in adipose tissue and impairs
hepatic insulin sensitivity21. The mRNA expression level of Pparg was significantly upregulated in the iWAT and
BAT, but not in the muscles. As adipose tissue is the major mediator of PPARγ activity on insulin sensitivity,
PPARγ activation in mature adipocytes induces the expression of several genes involved in the insulin signaling
cascade and, consequently, enhances insulin sensitivity22. Furthermore, the thermogenesis related-genes includ-
ing Ucp1, Cidea, Prdm16, and Fgf21, significantly increased in BAT of NAG-1 Tg mice, indicating that NAG-1
plays roles in thermogenesis (Fig. 6D). To confirming the effect of NAG-1 on insulin signaling at the post-trans-
lational level, we performed the western blot. The results indicated that NAG-1 Tg mice showed a significant
positive effect on insulin signaling by enhancing phosphorylated IRS (insulin receptor substrate) at Tyr612 and
its downstream Akt by increasing phosphorylation of Akt at ser473 (Fig. 6E).
Effect of NAG‑1 overexpression on the mRNA expression levels of adipocytokines. Adiponec-
tin and leptin, major adipokines, are important mediators of energy homeostasis. Leptin decreases appetite,
stimulates thermogenesis, enhances fatty acid oxidation, decreases glucose levels, and reduces body weight and
fat mass23. The effect of NAG-1 overexpression on the mRNA expression levels of adiponectin and leptin was
examined in NAG-1 Tg mice. The mRNA level of adiponectin was upregulated, whereas that of leptin was down-
regulated, in the muscles and iWAT of NAG-1 Tg mice. However, the mRNA level of adiponectin in BAT was not
significantly different between WT and NAG-1 Tg mice (Fig. 7).
Effect of NAG‑1 overexpression on the mRNA expression level of NLRP3 inflammasome com‑
ponents. NLRP3 inflammasomes are involved in the secretion of inflammatory cytokines, which promote
insulin resistance14. The NLRP3 inflammasome contains three main components: apoptosis-associated speck-
like protein containing CARD (ASC), pro-inflammatory caspase-1, and NLRP3. Therefore, this study investi-
gated the effects of NAG-1 overexpression on NLRP3 inflammasome component expression in a mouse model
of HFD/STZ-induced diabetes. The mRNA expression levels of Nlrp3 and Casp1 in the muscles, iWAT, and BAT
of NAG-1 Tg mice were significantly lower than those in the muscles, iWAT, and BAT of WT mice (Fig. 8A–C).
Compared with those in the iWAT, muscle, and BAT of WT mice, the mRNA levels of Asc were significantly
downregulated in the iWAT but not in the muscle and BAT of NAG-1 Tg mice. Furthermore, the mRNA levels
of Il18 were significantly downregulated in the muscles and iWAT of NAG-1 Tg mice compared with those in the
muscles and iWAT of WT mice. In contrast, the mRNA levels of Il1b in the BAT of NAG-1 Tg mice were signifi-
Scientific Reports | (2021) 11:15027 | https://doi.org/10.1038/s41598-021-94581-y 5
Vol.:(0123456789)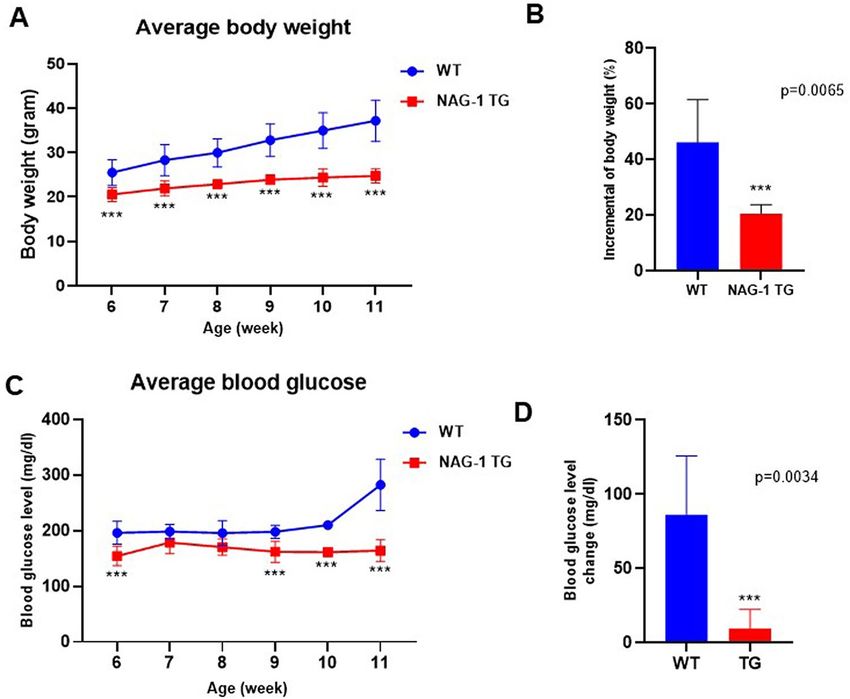
www.nature.com/scientificreports/
Figure 5. Pancreatic islet architecture. The pancreatic sections were prepared and stained with hematoxylin and
eosin (H&E) or anti-cleaved caspase-3 antibody. (A) Representative images of H&E-stained pancreatic sections
from different groups. Scale bar = 50 µm. (B,C) Pancreatic islet area and beta cell number were measured
as described in the methods section. Data are shown as mean ± standard error of mean. ***p < 0.01. (D)
Immunohistochemical analysis of cleaved caspase-3 in the pancreas islets. Scale bar = 50 µm.
cantly lower than those in the BAT of WT mice. The expression levels of Nlrp3 and Casp1 were downregulated in
the muscles, iWAT, and BAT of NAG-1 Tg mice. This indicated that the decreased NLRP3 inflammasome activ-
ity in NAG-1 Tg mice alleviates diet-induced obesity and enhances insulin sensitivity in the HFD/STZ-induced
diabetic mouse model.
Discussion
Mature NAG-1/GDF15 signaling in the brain exerts anti-obesity effects by regulating a ppetite24 and, conse-
quently, decreasing body weight and fat mass17. Consistently, this anti-obesity effect is inhibited in NAG-1 knock-
out mice16. Previously, we reported that NAG-1 is a novel therapeutic target for obesity and insulin resistance
as it modulates metabolic activity by promoting the expression of key thermogenic and lipolytic genes in BAT
and WAT10. These NAG-1 transgenic mice were developed using Protamine-Cre mice, indicating that NAG-1
expression is not toxic to mice and that all tissues express NAG-117. As NAG-1 can decrease body weight, it has
potential applications in the prevention and treatment of obesity and hyperglycemia, which is one of the main
chronic symptoms of diabetes.
The molecular mechanisms of action of NAG-1 in diabetes have not been elucidated. However, recent stud-
ies have suggested that treatment with NAG-1/GDF15 inhibits diabetes in 53% of non-obese diabetic mice25.
Further evidence of the anti-diabetic role of NAG-1 was obtained from the use of metformin, an anti-diabetic
drug; treatment with metformin consistently induces weight loss in individuals with or without T2DM. Addi-
tionally, metformin has been reported to upregulate the expression of NAG-1/GDF1512, which indicates that
the mechanism of action of metformin involves the induction of NAG-1 expression. However, the serum levels
of NAG-1/GDF15 in patients with T2DM are higher than those in non-diabetic individuals26. Additionally, the
serum levels of NAG-1/GDF15 are positively correlated with blood glucose concentrations27. The mechanism
underlying the upregulation of serum NAG-1/GDF15 levels in patients with diabetes has not been elucidated.
One potential explanation is the presence of several forms of NAG-1 in the serum. NAG-1 is synthesized in the
cytoplasm and secreted in at least two different forms of NAG-1 (pro-form and mature forms). However, the
molecular function of pro-NAG-1 in the serum has not been determined. The role of pro-NAG-1 in diabetes
development must be examined; thus, the ratio of the mature form of NAG-1 to the pro-form of NAG-1 could
be important in determining the progression of diabetes in patients. Furthermore, intercellular NAG-1 may also
Scientific Reports | (2021) 11:15027 | https://doi.org/10.1038/s41598-021-94581-y 6
Vol:.(1234567890)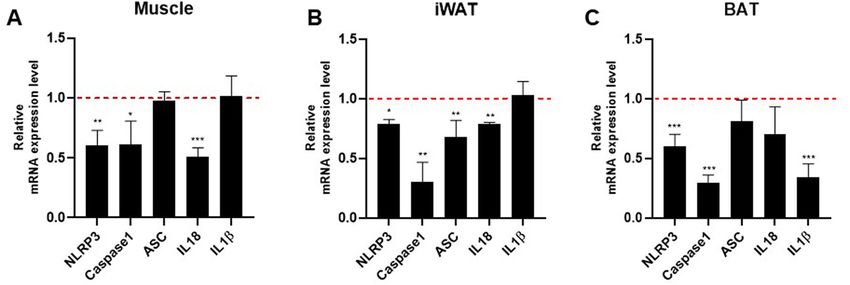
www.nature.com/scientificreports/
Figure 6. Effect of NAG-1 on the mRNA expression level of insulin signaling pathway-related factors. (A)
RT-PCR of NAG-1 gene expression in the muscle, iWAT, and BAT. Ctrl indicates negative control. The mRNA
expression levels of Irs1, Glut4, Pparg, Akt, Pi3k, Ptpn1 (Pten), Gsk3b, Foxo1, Mtorc1, Mtorc2, and As160 in
the (B) muscle tissue, (C) inguinal white adipose tissue, and (D) brown adipose tissue were examined using
quantitative real-time polymerase chain reaction. The thermogenesis related mRNA level of Ucp1, Cidea,
Prdm16, Dio2 and Fgf21 were also determined in BAT. The expression levels of target genes were normalized
to those of Gapdh. Data were analyzed using the Student’s t-test and are presented as mean ± standard error
of mean. *p < 0.05, **p < 0.01, and ***p < 0.001, compared with the wild-type group (n = 3). (E) Western blot
data represent the protein expression of p-Akt (Ser473), total Akt, pIRS1 (Tyr612) and pro-NAG-1 in skeleton
muscle of WT diabetic mice (WT) and NAG-1 Tg diabetic mice (TG). The graph represents the relative protein
expression. *p < 0.05, compared with the wildtype group. (n = 3 mice per group).
Figure 7. Effect of NAG-1 on the mRNA expression level of adipocytokines. Adiponectin and leptin mRNA
expression levels in the muscle tissue, inguinal white adipose tissue, and brown adipose tissue were determined
using quantitative real-time polymerase chain reaction. The expression levels of target genes were normalized
with those of Gapdh. Data are presented as mean ± standard error and were analyzed using the Student’s t-test.
*p < 0.05, **p < 0.01, and ***p < 0.001, compared with the control group (n = 3).
play a role in adipose tissue, which expresses NAG-1. Previously, we reported that pro-NAG-1 decreases SMAD
activity in the nucleus through transcriptional r egulation4, which possibly regulates several other mechanisms
of transcriptional regulation, including micro RNA and long non-coding RNA expression. The identification of
pro-NAG-1 function can aid in determining the role of NAG-1 in the development of diabetes.
To elucidate the mechanism involved in NAG-1/GDF15-mediated enhanced insulin sensitivity, this study
investigated the insulin signaling pathway in NAG-1 Tg mouse tissues using the HFD/STZ-induced diabetic
Scientific Reports | (2021) 11:15027 | https://doi.org/10.1038/s41598-021-94581-y 7
Vol.:(0123456789)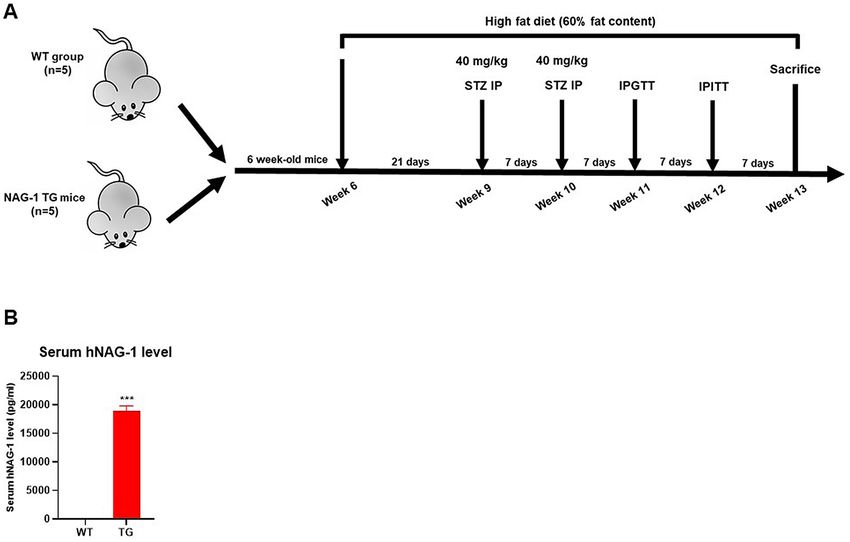
www.nature.com/scientificreports/
Figure 8. Effect of NAG-1 on the mRNA expression level of NLRP3 inflammasome components. The mRNA
expression levels of Nlrp3, Casp1, Asc, Il-18, and Il-1b in the (A) muscle, (B) inguinal white adipose tissue, and
(C) brown adipose tissue. The expression levels of target genes were normalized to those of Gapdh. Data are
presented as mean ± standard error of mean and were analyzed using the Student’s t-test. *p < 0.05, **p < 0.01,
and ***p < 0.001, compared with the control group (n = 3).
mouse model. In addition to the adipose tissue, the skeletal muscle was considered as a target tissue28 in which
NAG-1/GDF15 was expressed (Fig. 6E). Glucose uptake by this tissue accounts for the majority of glucose dis-
posal during the postprandial period, as well as after the challenge with exogenous insulin. The expression of
GLUT4 was upregulated in the skeletal muscle of NAG-1/GDF15 Tg mice (Fig. 6B–D), supporting the hypothesis
that NAG-1/GDF15 expression in the skeletal muscle may increase systemic insulin sensitivity. The upregulated
expression of Glut4 is accompanied by the induction of the expression of As160, which is required for the insulin-
stimulated translocation of glucose transporter to the plasma membrane. Indeed, the expression of Glut4 was
also upregulated in iWAT and BAT (Fig. 6).
In obesity and diabetes, PI3K/AKT is the major insulin pathway involved in the physiological functions of
various organs. The PI3K/AKT signaling pathway promotes lipid biosynthesis and inhibits lipolysis in adipose
tissue. Foxo1, the substrate of PI3K/AKT, regulates lipolysis by modulating the expression of adipose triglyceride
lipase29. Additionally, modulation of the PI3K/AKT signaling pathway and downstream effectors is a potential
therapeutic strategy for obesity and T2DM. However, the complex mechanism of the PI3K/AKT pathway must
be elucidated in future studies. This study demonstrated that the metabolic functions of the PI3K/AKT signal-
ing pathway in the muscle and adipose tissue are critical for metabolism and that NAG-1 is a positive regulator
of this pathway.
mTOR protein modulates insulin signaling by regulating several downstream components30. mTORC1, a
downstream effector of AKT, is involved in the conversion of BAT to WAT. Previous studies have reported that
mTORC1 activation in adipose tissue promotes the accumulation of lipids in BAT through the downregulation
of brown adipocyte markers and upregulation of WAT markers. In skeletal muscle, Mtorc1 regulates muscle mass
by regulating protein synthesis and degradation31. The overactivation of mTORC1 in the muscle of obese and
high-fat-fed rodents is associated with increased inhibitory phosphorylation of insulin receptor substrate-1 and
impaired AKT activation, which leads to impaired insulin signaling, decreased glucose uptake by the muscle, and
systemic insulin resistance32. The findings of this study indicate that mTORC1 is downregulated in BAT but not
in WAT, suggesting decreased conversion of BAT into WAT in NAG-1 Tg mice. Hence, this may be associated
with the low body weight and small size of the droplets in NAG-1 Tg mice (Figs. 2 and 4). Moreover, Mtorc1
was also downregulated in the muscles, indicating decreased insulin resistance in NAG-1 Tg mice. mTORC2, a
component of the mTOR complex, promotes AKT signaling via p hosphorylation33. The knockout of mTORC2
in the muscle leads to the impairment of insulin signaling through GLUT4 translocation20. Additionally, the
knockout of Mtorc2 in adipose tissues suppresses insulin-induced lipolysis, which increases the levels of circu-
lating fatty acids and g lycerol34. The findings of this study indicate that the expression of Mtorc2 changes in the
muscle but not in the adipose tissue of NAG-1 Tg mice. This suggests that the induction of Mtorc2 expression
in the muscles of NAG-1 Tg mice is associated with the upregulation of As160, which leads to the translocation
of GLUT4 to the plasma membrane. Interestingly, NAG-1 regulated the expression of leptin and adiponectin
in this study. Studies on animal models have revealed that leptin and adiponectin play a critical role in the pre-
vention and control of T2DM by promoting beta cell function and survival, improving insulin sensitivity, and
regulating glucose m etabolism23,35,36. Leptin and adiponectin regulate blood glucose via several mechanisms. In
this study, NAG-1 overexpression downregulated the expression of leptin and upregulated that of adiponectin
(Fig. 7). Previous studies have reported that increased leptin levels are associated with insulin resistance and
T2DM development. Additionally, increased leptin concentrations are associated with increased cardiovascular
risk in patients with T2DM37. In this study, NAG-1 Tg mice exhibited downregulated expression of leptin in the
WAT, BAT, and muscle and decreased insulin resistance compared with WT mice. Adiponectin also contributes
to improving insulin sensitivity by locally increasing GLUT4-mediated glucose uptake. However, adiponectin
also inhibits BAT activation and thermogenesis in mice by suppressing Ucp1 expression, lipolysis, and brown
adipocyte recruitment38. This demonstrates that increased adiponectin levels are sometimes associated with
metabolic dysfunction in B AT39. These data are consistent with the improved insulin sensitivity and increased
Scientific Reports | (2021) 11:15027 | https://doi.org/10.1038/s41598-021-94581-y 8
Vol:.(1234567890)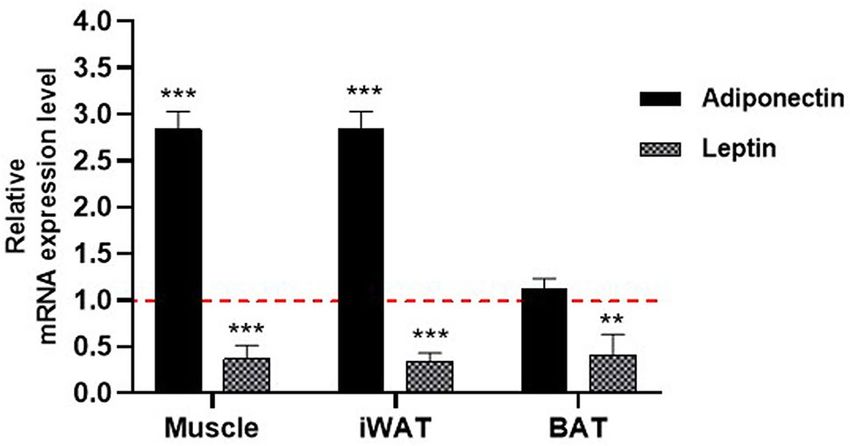
www.nature.com/scientificreports/
Figure 9. Schematic diagram representing the effect of NAG-1 on the insulin signaling pathway.
Overexpression of pro-NAG-1 increases expression levels of IRS1/PI3K/AKT, resulting in anti-diabetic activity.
Green and red colors represent upregulation and downregulation, respectively, whereas the yellow color
indicates no significantly different expression.
thermogenesis in the BAT of NAG-1 Tg mice (Fig. 6D). These results are also consistent with those of our previ-
ous study, which suggested that NAG-1 mice exhibit upregulated expression of thermogenesis-related genes in
the BAT10.
The NLRP3 inflammasome is the most fully characterized inflammasome and belongs to the nucleotide-
binding oligomerization domain-like receptor (NLR) family of pattern recognition receptors, which are found
in the cytosol, detect pathogen invasion, and initiate immune r esponses40. The activation of this inflammasome
leads to the promotion of the secretion of the pro-inflammatory cytokines IL-1β and IL-18, which play roles in
T2DM progression41. Several studies have reported that the NLRP3 inflammasome and its components are cru-
cial mechanisms that induce metabolic inflammation and insulin resistance42. In this study, the results showed a
decrease in Nlrp3 and Casp1 mRNA expression in the muscle, iWAT, and BAT, followed by the reduction in Il-1β
and Il-18 mRNA expression in different tissues of NAG-1 Tg diabetic mice compared with WT mice. Similarly,
we reported that NAG-1 Tg mice fed CHO, low-fat, or-high-fat diet, exhibit a lower expression of Nlrp3 mRNA
and significantly lower expression of Casp1, Asc, Il-1β, and Il-18 mRNA in the WAT than WT m ice10. This sug-
gests that NAG-1 Tg mice have a negative correlation with NLRP3 inflammasomes, which play important roles
in protection against insulin resistance.
In summary, the findings of this study demonstrate that NAG-1 may inhibit diabetic development in an HFD/
STZ-induced diabetic mouse model. Based on the findings of this study, we conclude that NAG-1 upregulates
insulin signaling and, consequently, downregulates the expression of Gsk3β, mTorc1, and Foxo1, which may con-
tribute to the prevention of HFD/STZ-induced diabetic mice (Fig. 9). Histological analysis revealed that NAG-1
mitigates the adverse effects of diabetes on liver and adipose tissues. NAG-1 overexpression exerts anti-diabetic
activity by increasing the pancreatic islet area and beta cell population in the pancreas. These results also highlight
the potential role of NAG-1 in the development of novel preventive approaches to manage insulin resistance.
Methods
Animals. Six-week-old male C57BL/6 mice (high-fat-induced WT and NAG-1 Tg mice) were used in this
study. The animals were housed in a temperature-controlled (21 ± 2 °C) room with a 12-h dark/light cycle. The
mice had free access to food and water. All mice were maintained on an HFD (60% from fat, D12492, Research
Diets, Inc., New Brunswick, NJ, USA) throughout the experimental period. All procedures used in the animal
experiments complied with the standards set out in the Guidelines for the Care and Use of Laboratory Animals
of Seoul National University and were approved by the Institutional Animal Care and Use Committee of Seoul
Scientific Reports | (2021) 11:15027 | https://doi.org/10.1038/s41598-021-94581-y 9
Vol.:(0123456789)www.nature.com/scientificreports/
National University (SNU-170417-23-2). All animals were maintained and used in accordance with ARRIVE
guidelines.
Experimental design. NAG-1 transgenic mice were previously generated using Protamine-Cre mice17,
indicating that NAG-1 is expressed in all tissues. Six-week-old male NAG-1 transgenic mice and their NAG-
1-negative sibling mice were grouped into two groups: WT mice and NAG-1 Tg mice (n = 5 for each group).
All mice were maintained on HFD, and the mice were intraperitoneally injected with low-dose STZ (40 mg/kg
body weight; #13104, Cayman Chemical, MI, USA) after 8 h of fasting at week 9. After injection, the mice were
maintained on an HFD (Fig. 1). At week 10, the mice were administered low-dose STZ (40 mg/kg body weight,
IP) for a second time to complete the induction of diabetes. The levels of fasting blood sugar (FBS) were analyzed
to confirm the presence of diabetes in the mice at week 11. Enzyme-linked immunosorbent assay (ELISA) Blood
was collected from a mouse (ELISA) tissues. Six-week-old male NAG-1 transgenicblood was then incubated in
a serum separator tube (SST, BD Microtainer, Franklin Lakes, NJ, USA) for 30 min at room temperature. After
incubation, SST was centrifuged at 15,000×g for 90 s to obtain the serum. These serums were used to determine
the human NAG-1 protein levels in each mouse using Human GDF-15 Quantikine ELISA Kit (#DGD150, R&D
Systems Inc., Minneapolis, MN, USA).
Measurements of body weight and fasting blood sugar/insulin levels. Bodyweight and FBS lev-
els were initially measured at week 6 and monitored every week thereafter until the end of the experimental
period. FBS levels were measured using fresh blood samples collected from the mouse tail vein with Accu-Chek
Performa (Roche Diabetes Care, Indianapolis, IN, USA). Fasting serum insulin levels were determined using
an Ultra-Sensitive Mouse Insulin ELISA Kit (#90080, Crystal Chem, IL, USA), following the manufacturer’s
instructions.
Intraperitoneal glucose tolerance test (IPGTT). The mice were allowed to fast for 18 h and subjected
to IPGTT at week 11. Mice were intraperitoneally injected with fresh glucose solution (2 g/kg body weight,
A2494001, Gibco, Gaithersburg, MD, USA), and the blood glucose level was measured at 0 (baseline), 15, 30, 60,
90, and 120 min post-glucose injection using Accu-Chek Performa. Serum insulin levels were also determined
at 15, 30, 60, and 120 min post-injection using the Ultra-Sensitive Mouse Insulin ELISA Kit. The AUC value
of blood glucose was calculated using GraphPad Prism 8 software (GraphPad Prism Software Inc., San Diego,
CA, USA). Insulin resistance was calculated using the following formula: HOMA-IR was calculated as [fasting
insulin (mU/mL) × fasting glucose (mg/dl)]/405.
Intraperitoneal insulin tolerance test (IPITT). At week 12, the mice were allowed to fast for 6 h before
the experiment. Serum glucose levels were measured using Accu-Chek Performa at the baseline (0 min) and
after the intraperitoneal injection of insulin (0.75 U/kg body weight) (I0516, Sigma-Aldrich, St. Louis, MO,
USA). Blood glucose levels were determined at 15, 30, 60, and 120 min post-injection. The AUC value of blood
glucose was calculated using GraphPad Prism software.
Histological analysis. The tissues were fixed in 10% neutral formalin, embedded in paraffin, sec-
tioned (thickness: 5 µm), and stained with H&E. Images of the tissues were captured using Panoramic SCAN
(3DHISTECH, Budapest, Hungary), and the pancreatic islet area and the number of beta cells were measured
using the CaseViewer program (3DHISTECH, version 2.2). The iWAT, eWAT, and BAT adipocyte areas were
measured using the adipocyte tool plugin in ImageJ software 1.52a (NIH, Bethesda, MD, USA).
Immunohistochemistry. The tissue blocks were fixed in 10% neutral formalin, embedded in paraffin, and
sectioned into 5-μm-thick sections. The sections were incubated in citrate buffer for 1 min in a microwave
(Immunobioscience, Mukilteo, WA, USA) to retrieve the antigens. Endogenous peroxidase activity was blocked
using 0.3% hydrogen peroxide (Sigma-Aldrich, St. Louis, MO, USA) in phosphate-buffered saline for 1 h at
room temperature. Immunoreactivity was detected using an ultra-sensitive ABC staining kit (Thermo Fisher,
IL, USA), following the manufacturer’s instructions. The sections were incubated with rabbit polyclonal anti-
cleaved caspase-3 (#9661S, Cell Signaling Technology, Beverly, MA, USA) antibody at 4 °C overnight. The nega-
tive control samples were incubated with secondary antibodies, but not with the primary antibody. The sections
were incubated with 3,3′-diaminobenzidine tetrahydrochloride (DAB) substrate (ImmPACT DAB kit, Vector
Laboratory, Burlingame, CA, USA) at room temperature for 45 s and counterstained with hematoxylin (Vec-
tor Laboratory, Burlingame, CA, USA) for 30 s. Coverslip-mounted sections were observed using a Panoramic
SCAN slide scanner.
RT‑PCR. Total RNA was extracted from tissues using the RNeasy Mini Kit (QIAGEN, Hilden, Germany), fol-
lowing the manufacturer’s instructions. RNA (1 µg) was reverse-transcribed using a Verso cDNA Synthesis Kit
(Thermo Fisher, IL, USA). DNA was amplified by PCR using a MiniAmp Plus Thermal Cycler (A37835, Applied
Biosystems, Marsiling Industrial Estate, Singapore) with GoTaq Green PCR Master Mix (Promega, Madison,
WI, USA). The primers used were human NAG-1 (F: 5′-CTCCAGATTCCGAGAGTTGC-3′ and R: 5′-AGAGAT
ACGCAGGTGCAGGT-3′) and mouse β-actin (F: 5′-GGCTGTATTCCCCTCCATCG-3′ and R: 5′-CCAGTT
GGTAACAATGCCATGT-3′). The thermal cycling conditions were as follows: initial denaturation at 94 °C for
2 min, followed by 40 cycles of 94 °C for 30 s, 52 °C for 30 s, and 72 °C for 1 min, and a final extension at 72 °C
Scientific Reports | (2021) 11:15027 | https://doi.org/10.1038/s41598-021-94581-y 10
Vol:.(1234567890)www.nature.com/scientificreports/
Forward primer (5′→3′) Reverse primer (5′→3′)
Adiponectin ATCTGGAGGTGGGAGACCAA GGGCTATGGGTAGTTGCAGT
Leptin AGGTAGGGATGGGTAGAGCC GTGTGCTGCTTGGGAGTTTC
GLUT4 GGTGTGGTCAATACGGTCTTCAC AGCAGAGCCACGGTCATCAAGA
PI3K CAAACCACCCAAGCCCACTACT CCATCAGCAGTGTCTCGGAGTT
Ptpn1 GCGCTTCTCCTACCTGGCTGTCAT ACGTGCTCGGGTGGAAGGTCTA
IRS-1 TGTCACCCAGTGGTAGTTGCTC CTCTCAACAGGAGGTTTGGCATG
Akt GGACTACTTGCACTCCGAGAAG CATAGTGGCACCGTCCTTGATC
GSK3β CATAGTGGCACCGTCCTTGATC CCAACTGATCCACACCACTGTC
PPARγ GTACTGTCGGTTTCAGAAGTGCC ATCTCCGCCAACAGCTTCTCCT
FOXO1 CTACGAGTGGATGGTGAAGAGC CCAGTTCCTTCATTCTGCACTCG
AS160 GCCAACAGTCTTGCCTCAGAGA CGTCTTCGGAACTGTGGAGAGT
RPTOR CTTCCTATCCGTCTTGGCAGAC CTCCAGACAGATGGCAATCAGG
RICTOR CAGTGTGAGGTCCTTTCCATCC GCCATAGATGCTTGCGACTGTG
UCP1 TTTTGTTCTTGCACTCACGCC CCCATGGTGGGTTGCACTTC
PRDM16 CCACCAGCGAGGACTTCAC GGAGGACTCTCGTAGCTCGAA
Cidea CAGTGATTTAAGAGACGCGG TCTGCAATCCCATGAATGTC
Dio2 ATGCTGACCTCAGAAGGGCT ACACTGGAATTGGGAGCATC
FGF21 ATCAGGGAGGATGGAACAGTGG AGCTCCATCTGGCTGTTGGCAA
NLRP3 TGCTCTTCACTGCTATCAAGCCCT ACAAGCCTTTGCTCCAGACCCTAT
IL-18 TGGTTCCATGCTTTCTGGACTCCT TTCCTGGGCCAAGAGGAAGTGATT
IL-1β TGGACCTTCCAGGATGAGGACA GTTCATCTCGGAGCCTGTAGTG
ASC CTGCTCAGAGTACAGCCAGAAC CTGTCCTTCAGTCAGCACACTG
Caspase-1 GGCACATTTCCAGGACTGACTG GCAAGACGTGTACGAGTGGTTG
GAPDH CATCACTGCCACCCAGAAGACTG CATCACTGCCACCCAGAAGACTG
Table 1. PCR primers used in this study.
for 5 min. The products were electrophoresed on a 1.5% agarose gel and visualized under UV light using an Alli-
ance Q9 Mini (Cambridge, UK).
qRT‑PCR. Total RNA was extracted from tissues using the RNeasy Mini Kit (QIAGEN, Hilden, Germany),
following the manufacturer’s instructions. RNA (1 μg) was reverse-transcribed into cDNA using a first-strand
cDNA synthesis kit (K1612, Thermo Fisher, IL, USA) in a MiniAmp Plus Thermal Cycler. The primers used
for qRT-PCR analysis are listed in Table 1. The relative level of each RNA was measured using qRT-PCR with
SYBR Green reagents (PowerUp SYBR Green Master Mix, A25741, Applied Biosystems, Thermo Scientific) in a
QuantStudio 1 real-time PCR system (Applied Biosystems, Marsiling Industrial Estate, Singapore). The expres-
sion level of the target gene was normalized to that of Gapdh (housekeeping gene). Relative gene expression was
calculated using the comparative Ct (2−ΔΔCt) method.
Immunoblotting analysis. The tissue was washed twice in ice-cold PBS and homogenized using lysis
buffer containing proteinase inhibitors. The samples were sonicated and centrifuged at 14,000×g for 20 min.
Protein concentrations in the supernatants were determined using a Pierce BCA Protein Assay Kit (Thermo
Fisher, IL, USA). After the proteins were quantified, western blotting was performed. Briefly, 60 µg of protein was
separated using 9% sodium dodecyl sulfate–polyacrylamide gel electrophoresis and transferred to a nitrocel-
lulose membrane. The blotted membrane was blocked with 5% BSA for 1 h at room temperature and incubated
overnight with specific antibodies at 4 °C. The primary antibodies used (at a dilution of 1:1000) included rabbit
anti-p-Akt Ser473 (#9271S, Cell Signaling, MA, USA), rabbit anti-Akt (#9272S, Cell Signaling, MA, USA), rab-
bit anti-p-IRS1 (Tyr612) (#44-816G, Invitrogen, MA USA), in-house rabbit anti-pro-NAG-1 (corresponding
human NAG-1 amino acid peptide 43–63), anti-alpha tubulin (TU-02, #sc8035, Santa Cruz) and anti-β-actin
(2A3, #sc517582, Santa Cruz). After incubation with goat anti-rabbit HRP-conjugated IgG secondary antibody
(1:5000 dilution, #31460, Thermo Fisher, IL, USA) or goat anti-mouse IgG (H + L) secondary antibody (1:5000
dilution, #626520, Thermo Fisher, IL, USA), in 5% skim milk for 1 h at RT, the blotted membranes were visual-
ized using Alliance Q9 mini (Cambridge, UK) and quantified using ImageJ software 1.52a.
Statistical analysis. Data processing and analyses were performed using GraphPad Prism version 8.0.1. All
experimental data are shown as the mean ± standard error of the mean for parametric data. The means between
groups were analyzed using the Student’s t-test. The data from the NAG-1 Tg mice were compared with those of
the controls (WT mice). Differences were considered significant at *p < 0.05, **p < 0.01, or ***p < 0.001.
Scientific Reports | (2021) 11:15027 | https://doi.org/10.1038/s41598-021-94581-y 11
Vol.:(0123456789)www.nature.com/scientificreports/
Data availability
All raw and processed data for this study are provided as a supplementary file.
Received: 19 February 2021; Accepted: 13 July 2021
References
1. Baek, S. J. & Eling, T. Growth differentiation factor 15 (GDF15): A survival protein with therapeutic potential in metabolic diseases.
Pharmacol. Ther. 198, 46–58. https://doi.org/10.1016/j.pharmthera.2019.02.008 (2019).
2. Buendgens, L. et al. Growth Differentiation factor-15 is a predictor of mortality in critically ill patients with sepsis. Dis. Markers
5271203–5271203, 2017. https://doi.org/10.1155/2017/5271203 (2017).
3. Yang, L. et al. GFRAL is the receptor for GDF15 and is required for the anti-obesity effects of the ligand. Nat. Med. 23, 1158–1166.
https://doi.org/10.1038/nm.4394 (2017).
4. Min, K. W. et al. NAG-1/GDF15 accumulates in the nucleus and modulates transcriptional regulation of the Smad pathway.
Oncogene 35, 377–388. https://doi.org/10.1038/onc.2015.95 (2016).
5. Lee, J., Kim, I., Yoo, E. & Baek, S. J. Competitive inhibition by NAG-1/GDF-15 NLS peptide enhances its anti-cancer activity.
Biochem. Biophys. Res. Commun. 519, 29–34. https://doi.org/10.1016/j.bbrc.2019.08.090 (2019).
6. Li, J. J. et al. Growth differentiation factor 15 maturation requires proteolytic cleavage by PCSK3, -5, and -6. Mol Cell Biol 38,
e00249-18. https://doi.org/10.1128/mcb.00249-18 (2018).
7. Zhang, Z.-Y. et al. Molecular mechanisms of glucose fluctuations on diabetic complications. Front. Endocrinol. 10, 640. https://
doi.org/10.3389/fendo.2019.00640 (2019).
8. Hruby, A. & Hu, F. B. The epidemiology of obesity: A big picture. Pharmacoeconomics 33, 673–689. https://d oi.o
rg/1 0.1 007/s 40273-
014-0243-x (2015).
9. Schernthaner-Reiter, M. H. et al. GDF15 reflects beta cell function in obese patients independently of the grade of impairment of
glucose metabolism. Nutr. Metab. Cardiovasc. Dis. 29, 334–342. https://doi.org/10.1016/j.numecd.2018.12.008 (2019).
10. Wang, X. et al. hNAG-1 increases lifespan by regulating energy metabolism and insulin/IGF-1/mTOR signaling. Aging 6, 690–704.
https://doi.org/10.18632/aging.100687 (2014).
11. Tsai, V. W. W., Husaini, Y., Sainsbury, A., Brown, D. A. & Breit, S. N. The MIC-1/GDF15-GFRAL pathway in energy homeostasis:
Implications for obesity, cachexia, and other associated diseases. Cell Metab. 28, 353–368. https://doi.org/10.1016/j.cmet.2018.07.
018 (2018).
12. Coll, A. P. et al. GDF15 mediates the effects of metformin on body weight and energy balance. Nature 578, 444–448. https://doi.
org/10.1038/s41586-019-1911-y (2020).
13. Stienstra, R. et al. Inflammasome is a central player in the induction of obesity and insulin resistance. Proc. Natl. Acad. Sci. USA
108, 15324–15329. https://doi.org/10.1073/pnas.1100255108 (2011).
14. Wang, X., Chrysovergis, K., Kosak, J. & Eling, T. E. Lower NLRP3 inflammasome activity in NAG-1 transgenic mice is linked to
a resistance to obesity and increased insulin sensitivity. Obesity 22, 1256–1263. https://doi.org/10.1002/oby.20638 (2014).
15. Ballak, D. B., Stienstra, R., Tack, C. J., Dinarello, C. A. & van Diepen, J. A. IL-1 family members in the pathogenesis and treatment
of metabolic disease: Focus on adipose tissue inflammation and insulin resistance. Cytokine 75, 280–290. https://d oi.o rg/1 0.1 016/j.
cyto.2015.05.005 (2015).
16. Tran, T., Yang, J., Gardner, J. & Xiong, Y. GDF15 deficiency promotes high fat diet-induced obesity in mice. PLoS ONE 13, e0201584.
https://doi.org/10.1371/journal.pone.0201584 (2018).
17. Baek, S. J. et al. Nonsteroidal anti-inflammatory drug-activated gene-1 over expression in transgenic mice suppresses intestinal
neoplasia. Gastroenterology 131, 1553–1560. https://doi.org/10.1053/j.gastro.2006.09.015 (2006).
18. Spijker, H. S. et al. Loss of β-cell identity occurs in type 2 diabetes and is associated with islet amyloid deposits. Diabetes 64, 2928.
https://doi.org/10.2337/db14-1752 (2015).
19. Reddy, S., Bradley, J. & Ross, J. M. Immunolocalization of caspase-3 in pancreatic islets of NOD mice during cyclophosphamide-
accelerated diabetes. Ann. N. Y. Acad. Sci. 1005, 192–195. https://doi.org/10.1196/annals.1288.025 (2003).
20. Kumar, A. et al. Muscle-specific deletion of rictor impairs insulin-stimulated glucose transport and enhances Basal glycogen
synthase activity. Mol. Cell Biol. 28, 61–70. https://doi.org/10.1128/mcb.01405-07 (2008).
21. Tang, Y. et al. Adipose tissue mTORC2 regulates ChREBP-driven de novo lipogenesis and hepatic glucose metabolism. Nat. Com-
mun. 7, 11365. https://doi.org/10.1038/ncomms11365 (2016).
22. Leonardini, A., Laviola, L., Perrini, S., Natalicchio, A. & Giorgino, F. Cross-talk between PPARg and insulin signaling and modula-
tion of insulin sensitivity. PPAR Res. 2009, 818945. https://doi.org/10.1155/2009/818945 (2009).
23. Yadav, A., Kataria, M. A., Saini, V. & Yadav, A. Role of leptin and adiponectin in insulin resistance. Clin. Chim. Acta 417, 80–84.
https://doi.org/10.1016/j.cca.2012.12.007 (2013).
24. Emmerson, P. J. et al. The metabolic effects of GDF15 are mediated by the orphan receptor GFRAL. Nat. Med 23, 1215–1219.
https://doi.org/10.1038/nm.4393 (2017).
25. Patel, S. et al. GDF15 provides an endocrine signal of nutritional stress in mice and humans. Cell Metab. 29, 707-718.e708. https://
doi.org/10.1016/j.cmet.2018.12.016 (2019).
26. Hong, J. H. et al. GDF15 is a novel biomarker for impaired fasting glucose. Diabetes Metab. J. 38, 472–479. https://d oi.o rg/1 0.4 093/
dmj.2014.38.6.472 (2014).
27. Bao, X. et al. Growth differentiation factor 15 is positively associated with incidence of diabetes mellitus: The Malmö Diet and
Cancer-Cardiovascular Cohort. Diabetologia 62, 78–86. https://doi.org/10.1007/s00125-018-4751-7 (2019).
28. Dimitriadis, G., Mitrou, P., Lambadiari, V., Maratou, E. & Raptis, S. A. Insulin effects in muscle and adipose tissue. Diabetes Res.
Clin. Pract. 93(Suppl 1), S52-59. https://doi.org/10.1016/s0168-8227(11)70014-6 (2011).
29. Chakrabarti, P. & Kandror, K. V. FoxO1 controls insulin-dependent adipose triglyceride lipase (ATGL) expression and lipolysis
in adipocytes. J. Biol. Chem. 284, 13296–13300. https://doi.org/10.1074/jbc.C800241200 (2009).
30. Yoon, M. S. The role of mammalian target of rapamycin (mTOR) in insulin signaling. Nutrients 9, 1176. https://doi.org/10.3390/
nu9111176 (2017).
31. Laplante, M. & Sabatini, D. M. mTOR signaling in growth control and disease. Cell 149, 274–293. https://doi.org/10.1016/j.cell.
2012.03.017 (2012).
32. Khamzina, L., Veilleux, A., Bergeron, S. & Marette, A. Increased activation of the mammalian target of rapamycin pathway in
liver and skeletal muscle of obese rats: Possible involvement in obesity-linked insulin resistance. Endocrinology 146, 1473–1481.
https://doi.org/10.1210/en.2004-0921 (2005).
33. Oh, W. J. et al. mTORC2 can associate with ribosomes to promote cotranslational phosphorylation and stability of nascent Akt
polypeptide. EMBO J. 29, 3939–3951. https://doi.org/10.1038/emboj.2010.271 (2010).
34. Kumar, A. et al. Fat cell-specific ablation of rictor in mice impairs insulin-regulated fat cell and whole-body glucose and lipid
metabolism. Diabetes 59, 1397–1406. https://doi.org/10.2337/db09-1061 (2010).
Scientific Reports | (2021) 11:15027 | https://doi.org/10.1038/s41598-021-94581-y 12
Vol:.(1234567890)www.nature.com/scientificreports/
35. Stern, J. H., Rutkowski, J. M. & Scherer, P. E. Adiponectin, leptin, and fatty acids in the maintenance of metabolic homeostasis
through adipose tissue crosstalk. Cell Metab. 23, 770–784. https://doi.org/10.1016/j.cmet.2016.04.011 (2016).
36. Bortolotto, L. F. B. et al. Cytotoxicity of trans-chalcone and licochalcone A against breast cancer cells is due to apoptosis induction
and cell cycle arrest. Biomed. Pharmacother. 85, 425–433. https://doi.org/10.1016/j.biopha.2016.11.047 (2017).
37. Rodríguez, A. J., Nunes Vdos, S., Mastronardi, C. A., Neeman, T. & Paz-Filho, G. J. Association between circulating adipocytokine
concentrations and microvascular complications in patients with type 2 diabetes mellitus: A systematic review and meta-analysis
of controlled cross-sectional studies. J. Diabetes Complicat. 30, 357–367. https://doi.org/10.1016/j.jdiacomp.2015.11.004 (2016).
38. Qiao, L. et al. Adiponectin reduces thermogenesis by inhibiting brown adipose tissue activation in mice. Diabetologia 57, 1027–
1036. https://doi.org/10.1007/s00125-014-3180-5 (2014).
39. Chanclon, B., Bauza-Thorbrugge, M., Benrick, A. & Wernstedt-Asterholm, I. Increased adiponectin levels are associated with
impaired Brown adipose tissue in mice. J. Diabetes 69, 1709. https://doi.org/10.2337/db20-1709-P (2020).
40. Swanson, K. V., Deng, M. & Ting, J. P. The NLRP3 inflammasome: Molecular activation and regulation to therapeutics. Nat. Rev.
Immunol. 19, 477–489. https://doi.org/10.1038/s41577-019-0165-0 (2019).
41. Grant, R. & Dixit, V. Mechanisms of disease: Inflammasome activation and the development of type 2 diabetes. Front. Immunol.
4, 50. https://doi.org/10.3389/fimmu.2013.00050 (2013).
42. Zheng, D., Liwinski, T. & Elinav, E. Inflammasome activation and regulation: Toward a better understanding of complex mecha-
nisms. Cell Discov. 6, 36. https://doi.org/10.1038/s41421-020-0167-x (2020).
Acknowledgements
This work was supported by the Research Institute for Veterinary Science, the BK21 PLUS Program for Crea-
tive Veterinary Science Research Center, Seoul National University, and the National Research Foundation of
Korea (NRF) grant funded by the Korean government (NRF-2018R1A2B2002923) to SJB. This research was
also partially supported by the R&D Project for Korea Mouse Phenotyping Center (2013M3A9D5072550) of
the National Research Foundation funded by the Ministry of Science and ICT to JKS.
Author contributions
Conceptualization: P.L., T.E., and S.J.B.; Investigation: P.L., J.L., I.K., S.Y.O., and S.J.B. Resources: T.E., and J.K.S.
Writing—original draft: P.L and S.J.B.; Writing and editing: P.L., J.L., T.E., and S.J.B.; Funding acquisition: S.J.B.
All authors reviewed the manuscript.
Competing interests
The authors declare no competing interests.
Additional information
Supplementary Information The online version contains supplementary material available at https://doi.org/
10.1038/s41598-021-94581-y.
Correspondence and requests for materials should be addressed to S.J.B.
Reprints and permissions information is available at www.nature.com/reprints.
Publisher’s note Springer Nature remains neutral with regard to jurisdictional claims in published maps and
institutional affiliations.
Open Access This article is licensed under a Creative Commons Attribution 4.0 International
License, which permits use, sharing, adaptation, distribution and reproduction in any medium or
format, as long as you give appropriate credit to the original author(s) and the source, provide a link to the
Creative Commons licence, and indicate if changes were made. The images or other third party material in this
article are included in the article’s Creative Commons licence, unless indicated otherwise in a credit line to the
material. If material is not included in the article’s Creative Commons licence and your intended use is not
permitted by statutory regulation or exceeds the permitted use, you will need to obtain permission directly from
the copyright holder. To view a copy of this licence, visit http://creativecommons.org/licenses/by/4.0/.
© The Author(s) 2021
Scientific Reports | (2021) 11:15027 | https://doi.org/10.1038/s41598-021-94581-y 13
Vol.:(0123456789)You can also read