Education in China and the United States - A Comparative System Overview CSET Issue Brief
←
→
Page content transcription
If your browser does not render page correctly, please read the page content below
September 2021

Education in China
and the United States
A Comparative System Overview

CSET Issue Brief

                         AUTHORS
                         Dahlia Peterson
                         Kayla Goode
                         Diana Gehlhaus
Executive Summary
Many in the national security community are concerned about
China’s rising dominance in artificial intelligence and AI talent.
Leading in AI workforce competitiveness hinges on the education,
development, and sustainment of the best and brightest AI talent.
This includes top-tier computer scientists, software engineers,
database architects, and other technical workers that can
effectively create, modify, and operate AI-enabled machines and
other products.
This issue brief provides an overview of the education systems in
China and the United States. We provide this context for better
understanding the accompanying main report, “AI Education in
China and the United States: A Comparative Assessment.”
The Chinese education system is mainly characterized by its
Ministry of Education setting centralized goals in five- to 15-year
education strategies. The MOE also certifies teachers and
approves curricula and teaching materials, while funding
responsibilities largely fall on local governments (see Appendix A).
The MOE’s role is greatest at the postsecondary level, where it
directly manages 75 elite colleges and universities.
In contrast, the U.S. system is driven by an individual states-led
approach where local governments and state authorities oversee
curricula, student achievement standards, and teacher
certifications. Additionally, administration and oversight of private
education differs from public education, having more autonomy in
its curriculum and educator standards. The U.S. Department of
Education’s primary role is to ensure equitable access to K-12
public education, compile education data, and distribute financial
assistance for postsecondary education.
Center for Security and Emerging Technology | 1Table of Contents
Executive Summary......................................................................................... 1
Introduction........................................................................................................ 3
Overview of China’s Education System .................................................... 4
Primary and Secondary Education (K-12) ........................................... 4
Postsecondary Education ......................................................................... 5
Undergraduate Level ............................................................................. 5
Graduate Level ........................................................................................ 7
Overview of the United States’ Education System ............................... 9
Primary and Secondary Education (K-12) ........................................ 10
Postsecondary Education ...................................................................... 11
Conclusion ...................................................................................................... 14
Authors ............................................................................................................ 16
Acknowledgments ....................................................................................... 16
Appendix A. Funding China’s Education System ............................... 17
Appendix B. Funding the United States’ Education System ........... 19
Appendix C. Recent Attempt to Standardize
U.S. K-12 Education ..................................................................................... 22
Appendix D. Comparison of Graduates in the
United States and China ............................................................................. 23
Endnotes.......................................................................................................... 24
Center for Security and Emerging Technology | 2Introduction
China’s efforts to recruit foreign artificial intelligence talent capture
headlines and are well-known. But China’s ongoing strategies,
initiatives, and other efforts to build their own AI workforce are
more potent, well-funded, and the most insulated from U.S.
sanctions.
This two-part analysis provides a new comparative perspective on
the U.S.-China competition to grow and cultivate an AI workforce.
This first brief provides an overview of each country’s education
system, with additional detail on system funding provided in
Appendix A (China) and Appendix B (United States).
The second brief, titled “AI Education in China and the United
States: A Comparative Assessment” discusses how each country is
integrating AI education and training into each level of education. It
also weighs potential national security implications for future U.S.
science and technology education and workforce policy.
The research presented here is based on original primary source
U.S. statistics, reports and assessments from education nonprofits,
private-sector promotional material, and individual states’
departments of education, along with Chinese education plans and
policies, official statistics, and translations. The data is often
defined and categorized differently, making uniform comparisons
difficult. We attempt to clarify such differences when they occur.
Center for Security and Emerging Technology | 3Overview of China’s Education System
China’s education system is more centralized than its U.S.
counterpart. Its education system includes 282 million students in
530,000 educational institutions from kindergarten to universities.
China’s Ministry of Education is the main authority overseeing
China’s education system, and is responsible for certifying
teachers, setting national education goals, approving curricula and
teaching materials, as well as providing limited funding
assistance.1
While the MOE supervises provincial education departments, it
has granted more implementation responsibility to the provincial
and municipal levels over recent decades.2 Provincial and major
city level bureaus follow national guidelines to develop provincial
curricula based on an implementation plan that incorporates local
contexts and MOE national curriculum guidance. But the MOE has
final approval before implementation.3 Further local
responsibilities include administering teaching materials, school
programs, providing education subsidies, and setting additional
standards for teacher training. 4
The MOE establishes goals for its education system through five-,
10-, and 15-year education strategies. The goals for 2010–2020
included universalizing preschool education; improving nine-year
compulsory education; raising the senior high school gross
enrollment rate to 90 percent (which has already been exceeded);
and increasing the higher education gross enrollment rate to 40
percent.5 Provinces then typically follow to create their own five-
to 10-year plans for education.6 The MOE’s Bureau of Education
Inspections monitors implementation and provides feedback to
local governments.7
Primary and Secondary Education (K-12)
Chinese students begin nine years of compulsory education at age
six. These nine years are typically split between six years of
elementary and three years of junior high school.8 In 2019, there
Center for Security and Emerging Technology | 4were 213,000 compulsory education schools nationwide teaching
154 million students. The 1986 Compulsory Education Law
underpins this requirement, while additionally calling for
achievement of the “two basics” (liangji): universal enrollment for
students within the nine-year period, and full literacy.9
Moreover, 15-year-old students who continue into secondary
education can pursue either an academic or vocational track. 10
Regardless of track, all students take the cumulative Zhongkao
examination, which is administered locally and not nationally
standardized.11 In 2019, MOE data indicated about 15.8 million
students were enrolled in the vocational secondary track across
more than ten thousand schools, while 24.1 million were spread
across 14,000 academic high schools. 12 The vocational track
entails one year of workplace training, after which students can
directly seek employment and forgo further education.13
For students in academic high schools, their next step is either
vocational colleges or universities. 14 Both typically require
preparing for the Gaokao college entrance examination; however,
since 2014, students applying to vocational colleges can instead
take an “academic plus skills test” organized by local governments
or vocational colleges. 15 The Gaokao is notoriously difficult and
crucially determines whether students qualify for coveted spots at
top academic universities such as the Ivy League-equivalent C9
League.16 In 2014, the MOE reduced the Gaokao’s difficulty by
removing the test’s elective subject, and implemented a combined
curriculum by removing the requirement that students choose
between humanities and science streams for their last two years in
high school.17
Postsecondary Education
Undergraduate Level
At the postsecondary level, China has 2,956 higher education
institutions (HEIs), spanning public degree-granting universities
and research institutes, junior colleges, vocational colleges and
Center for Security and Emerging Technology | 5universities, medical colleges, military institutions, private
universities, and adult education institutions. 18 1,265 of the HEIs
grant bachelor’s degrees at the 本科 (benke) level, while 1,423
vocational colleges offer diplomas for specialized training at the 专
科 (zhuanke) level, and the remaining 268 are for adult learning.19
Combined, there are 30.3 million undergraduate and junior college
students nationwide as of 2019.20 Chinese HEIs produce
approximately eight million graduates annually—more than the
United States and India combined—and this number is expected to
triple by the year 2030.21
Chinese postsecondary institutions are broken into roughly four
quality tiers, and unlike in the United States, China’s elite
universities are all public. The aforementioned C9 League sits at
the pinnacle: most are located in Beijing, Shanghai, or major
eastern Chinese cities.22 Eight of the C9 are among the 75 tier-one
institutions directly supervised and funded by the MOE.23 The ninth
member of the C9, the Harbin Institute of Technology, is a member
of the Seven Sons of National Defense, a group of universities
directly supervised by the Ministry of Industry and Information
Technology. The Seven Sons’ core mission is to support the
People’s Republic of China’s defense research and industrial base
and military-civil fusion to merge civilian research into military
applications.24
Nearly all of the MOE’s 75 institutions are also part of the “Double
First Class University” (双一流大学) initiative, a 2017 program
under Chinese President Xi Jinping that built upon previous
reforms such as Project 211 and Project 985. These former
projects identified and supported developing world-class
universities.25 “Double First Class” split universities into two tracks:
42 universities were selected as world-class universities, and split
respectively into 36 “Class A” (already close to being world class)
and 6 “Class B” (potential to be world-class) universities.26 This
initiative pared down the number of top universities China was
focusing on.27
Center for Security and Emerging Technology | 6China’s second-tier universities are also typically public.28
However, third-tier universities are usually private, are in some
cases partnered with a public “mother university” to confer
degrees, have lower admissions standards, and are operated
without state funds.29 Third-tier institutions typically charge at
least 10,000 yuan (approximately $1,400) for yearly tuition, or
double that of the first and second tiers.30 However, for individuals
with insufficient Gaokao scores, third-tier institutions are
increasingly popular for more applied careers, including computer
science and business, despite the higher tuition.31
Fourth-tier institutions are usually vocational colleges.32 While
they cannot grant bachelor’s degrees, lower tuition than third-tier
institutions is a frequent reason for enrolling. 33 Graduates of
fourth-tier zhuanke institutions either directly enter the workforce
as state-owned enterprise employees, factory managers, or enlist
in the military.34 However, they can also apply for 专升本
(zhuanshengben) “top-up” programs, which last two to three years
and grant a bachelor’s degree.35
Academics argue that between the 1980s to 1990s, continual
reforms increased provincial governments’ responsibility over their
own institutions, creating a joint governance approach between
the central and provincial governments.36 As a result, provincial
governments are increasingly responsible for funding and
management, as discussed in Appendix A. 37 However, we and
other scholars believe true educational autonomy remains low,
since party organizations are present within the organization
structure, and Marxism and Chinese socialism courses are
required.38
Graduate Level
At the graduate level, China offers 828 graduate training
institutions, which train 2.86 million students across 424,000
doctoral students and 2.44 million master’s students.39 It is unclear
what degree of overlap exists between the 828 postgraduate
institutions and the 1,265 HEIs offering bachelor’s degrees. Non-
Center for Security and Emerging Technology | 7MOE supervised institutions—such as the Chinese Academy of
Sciences, the Chinese Academy of Agricultural Sciences, and the
Chinese Academy of Social Sciences—are first-tier public research
universities that focus on graduate education. 40
CSET findings reflect increasing doctoral education quality. Around
45 percent of Chinese doctoral students graduate from the elite
Double First Class (A) universities, while about 80 percent of
graduates come from generally elite universities administered by
the central government.41
College graduates take entrance examinations when applying for a
master’s and a doctorate. 42 The MOE’s Department of Degree
Management and Postgraduate Education develops plans for
graduate education, establishes graduate schools, and manages
design of key national disciplines.43
Center for Security and Emerging Technology | 8Overview of the United States’ Education System
The U.S. education system is more decentralized than its Chinese
counterpart, especially for primary and secondary education. Each
individual state’s own department of education is the authority
that determines the laws that finance schools, hire educators,
mandate student attendance, and implement curricula. In contrast
to China’s MOE, the U.S. federal government provides relatively
minor education oversight through the compilation and reporting
of education statistics, along with promoting equitable access to
education and enforcing a prohibition on institutional
discrimination.44
The U.S. Department of Education, the United States’ federal
agency for education, proclaims that education is a “state and local
responsibility,” and the federal government’s role in education is
more of a “kind of emergency response system” to fill gaps when
“critical national needs arise.”45 The most notable federal
education initiatives, such as the Elementary and Secondary
Education Act of 1965, the No Child Left Behind Act of 2002, and
the Every Student Succeeds Act of 2015, reflect the U.S.
government’s efforts to promote childrens’ equal access to quality
public education.
At the postsecondary level, the federal government has slightly
more authority through its administration of student financial aid.
The Department of Education supports programs that provide
grants, financial aid (loans), and work-study assistance. Roughly
66 percent of students apply for federal financial assistance. 46 The
department’s student loan programs have more than 43 million
outstanding borrowers, with outstanding student debt over $1.7
trillion.47 (For more on U.S. education funding, see Appendix B.)
The jurisdiction of the U.S. Department of Education is rooted in
the United States Constitution. As a result of the division in
constitutional authority, states develop curriculum guidelines and
performance standards, license private elementary and secondary
schools to operate within their jurisdictions, certify teachers and
Center for Security and Emerging Technology | 9administrators, administer statewide student achievement tests,
and distribute state and federal funding to school districts. 48
Additionally, education in the United States is segmented between
public and private schools, including religious and nonsectarian
institutions.
Primary and Secondary Education (K-12)
The U.S. primary and secondary education system (K-12) annually
serves fifty million students, through around 98,000 public and
32,000 private elementary and secondary schools spread across
roughly 18,200 school districts. 49 Of the estimated $832 million
spent on K-12 education in the academic year 2018–19, states,
local school districts, and private sources provided the majority.
For K-12, the federal contribution is around 8 percent.50 Federal
funds do not solely come from the Department of Education, but
also from other federal agencies such as the U.S. Department of
Agriculture and the U.S. Department of Labor.
In the public sector, 13 years of formal schooling is available free
of cost to all U.S. children and is overseen by state governments
and local school districts. The compulsory starting age for children
to attend school varies by state (ranging from five to eight years
old), and individual states also determine the number of years of
compulsory education. In most states it is until age 18, but a few
are age 16 or 17. 51
Both public and private options for 13 years of schooling are
typically split among kindergarten, elementary, middle school or
junior high school, and high school, but due to the system’s
decentralized nature, different models exist. Depending on the
school district, middle school (typically years six through eight)
may be included in either elementary or junior and senior high
school.52
As with most systems, prerequisite requirements and determined
benchmarks set by state and local governments must be met at
each stage in the education system to proceed to the next level.
Center for Security and Emerging Technology | 10Individual U.S. states employ a variety of tools and assessments to
determine learners’ eligibility based on their needs and
achievements (for more on a recent attempt to adopt national
standards, called Common Core, see Appendix C). These
benchmarks will vary under the governance of state education
departments. For example, high school students will have different
requirements for exit exams and mandated credits in certain
subject areas depending on the state in which they attend school. 53
After high school graduation, about two thirds of students attend a
postsecondary institution the following fall season, with 44
percent attending a four-year institution.54
Postsecondary Education
The United States is home to a competitive environment for
degree-granting institutions, which include two- and four-year
colleges and universities serving over twenty million
postsecondary students. The National Center for Education
Statistics tallies 3,982 degree-granting postsecondary institutions
in the United States. Public institutions account for less than half
of this total, at 1,625, although have a higher share of total
enrollment than private institutions.55 Private nonprofit institutions
make up the largest count, with 1,660 institutions, while private
for-profit institutions total 697. Degrees conferred by colleges and
universities include five levels: associate’s, bachelor’s, master’s,
professional (e.g., JD, MD), and finally doctorates, split into
research doctorates (e.g., PhD) and doctorates of practice (e.g.,
PsyD, DNP, EdD).56
Community colleges are public postsecondary education options
that often work with high schools to provide students with
specialized education, technical and vocational training, and
transition pathways to four-year colleges or universities.
Additional nondegree postsecondary education options include
stand-alone programs, distance or online learning, or specific
course pathways that confer either certificates or licenses.57
Center for Security and Emerging Technology | 11The rest of the U.S. postsecondary education system consists of
four-year public and private colleges and universities. The
Carnegie Commission on Higher Education classifies these
institutions based on the types and numbers of degrees conferred
and level of research activity. At the top of this classification are
R1 and R2 institutions, which are the most research intensive
universities in the United States, awarding at least 20 research or
scholarship doctoral degrees and spending no less than $5 million
for research annually.58 R1 universities, those with “very high
research activity,” are often internationally recognized for their
academic prestige, but comprise roughly 3 percent of U.S.
postsecondary institutions.59 However, these 131 R1 universities
account for close to 18 percent of postsecondary enrollments. 60
There are a greater number of R2 institutions at a total of 135, but
these account for fewer enrollments—8 percent of postsecondary
students.61 Many other universities, including master’s colleges
and universities, baccalaureate colleges, or special focus
institutions such as business and management schools or faith-
based institutions also offer graduate degrees, whereas some
nonprofit private liberal arts institutions do not.
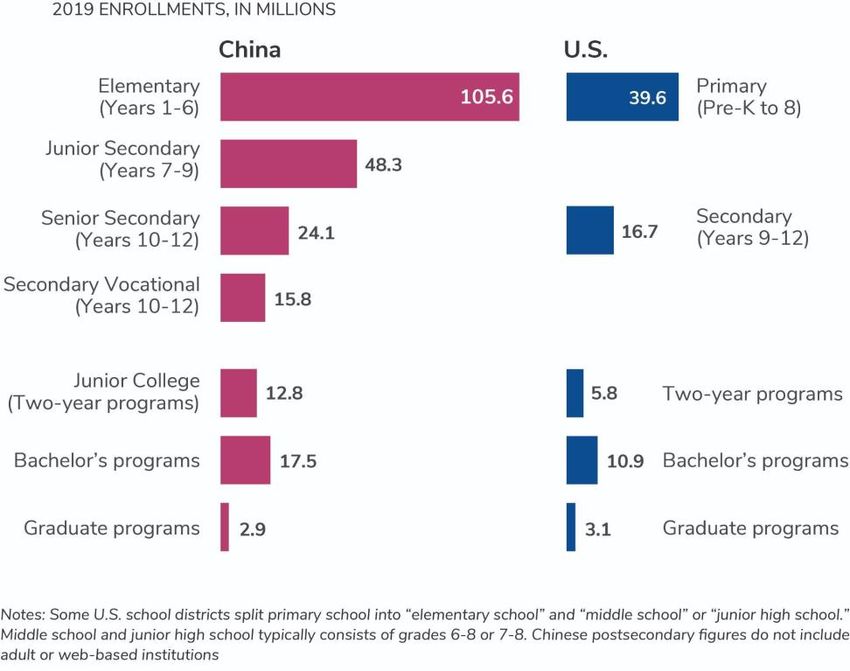
Figure 1 shows 2019 enrollment totals by level of education for
China and the United States (2019 graduate totals by level of
education are provided in the Appendix). China maintains a
cumulative numerical advantage until the graduate level, after
which the United States retains a slight lead. This lead disappears
when not counting foreign-born students, who comprise about 14
percent of total graduate enrollment. However, as a share of total
population in each country, the United States remains far ahead.
Center for Security and Emerging Technology | 12Figure 1. 2019 Total Educational Enrollment, United States and
China
Source: 2020 Digest of Education Statistics; U.S. National Center for Education
Statistics; 2020 Chinese Statistical Yearbook.
Center for Security and Emerging Technology | 13Conclusion
Access to AI education is a fundamental part of cultivating a
globally competitive AI workforce. Assessing competitive strength
in AI talent therefore includes understanding what each country is
doing to provide AI education. However, given the inherent
differences in each country’s education system, it also includes
understanding how both the Chinese and U.S. systems are
structured and administered.
This brief provides an overview of the education systems in China
and the United States. A companion brief, “AI Education in China
and the United States: A Comparative Assessment,” describes and
compares each country’s progress in providing AI education at all
educational levels, along with associated implications for U.S.
national security.
The Chinese education system is mainly characterized by its
Ministry of Education setting centralized goals in five- to 15-year
education strategies for its 282 million students across 530,000
educational institutions. The MOE also certifies teachers and
approves curricula and teaching materials, while funding
responsibilities largely fall on local governments (see Appendix A).
The MOE’s role is greatest at the postsecondary level, where it
directly manages 75 elite colleges and universities.
In contrast, the U.S. education system is primarily managed and
overseen by each individual state’s own department of education,
which sets curricula and achievement standards and certifies and
hires educators. At the federal level, the U.S. Department of
Education acknowledges states’ primary educational
responsibilities and instead maintains minor education oversight
through the compilation and reporting of education statistics,
promoting equitable access to education, and enforcing a
prohibition on institutional discrimination. At the postsecondary
level, the U.S. Department of Education has a more prominent role
through the administration of funding, grants, and financial aid
Center for Security and Emerging Technology | 14(loans), but it is not the only federal entity that contributes
postsecondary education funds.
Finally, there are clear similarities and differences in the
challenges both countries face in providing equal access to quality
education. Similarly, China and the United States share challenges
that could hinder successful integration of new curricula or
fundamental change in existing curricula—for example, to
accommodate emerging technologies like AI. Both countries
struggle with a persistent urban-rural divide, inability to access
quality education, and uneven teacher quality.
However, the level of centralization in educational administration
is notably different. While it is likely China can more easily push
nationwide change with its top-down system and regimented five-
to 15-year education plans, implementation can be uneven across
provinces. The United States must rely on buy-in from and
collaboration among its individual states for educational change to
take place at a national level (see Appendix C for how this process
can sometimes be complex).
Ultimately, each system has key advantages and disadvantages as
it relates to growing and cultivating a globally competitive AI
workforce. An exploration of this as it relates to AI education is in
the companion report “AI Education in China and the United
States: A Comparative Assessment.” Finally, an upcoming CSET
report titled “U.S. AI Workforce: Policy Recommendations” will
have policy recommendations that address these advantages and
disadvantages for the United States.
Center for Security and Emerging Technology | 15Authors
Dahlia Peterson and Kayla Goode are research analysts at CSET,
where Diana Gehlhaus is a research fellow.
Acknowledgments
For extremely valuable feedback and assistance, we would like to
thank Igor Mikolic-Torreira, Remco Zwetsloot, Anna Puglisi,
Dakota Cary, Ryan Fedasiuk, Charles Goldman, Sidney D’Mello,
and Denis Simon. We would also like to thank Melissa Deng,
Shelton Fitch, and Matt Mahoney for their editorial support, and
Farhana Hossain for visualizations.
© 2021 by the Center for Security and Emerging Technology. This
work is licensed under a Creative Commons Attribution-Non
Commercial 4.0 International License.
To view a copy of this license, visit
https://creativecommons.org/licenses/by-nc/4.0/.
Document Identifier: doi: 10.51593/20210051
Center for Security and Emerging Technology | 16Appendix A. Funding China’s Education System
Statistics from the MOE and the Chinese Statistical Yearbook do
not disclose funding breakdowns at each level of education.62
What is known is funding includes government appropriations for
education, funds invested by private school founders, donations
and fundraising, and tuition fees.63 The MOE’s internal Department
of Finance and Funds Supervision Affairs Center are responsible
for fund management, and the Chinese government has stated
that it will develop a more rigorous and standardized funding
supervision system.64
Government appropriations for education have traditionally
hovered at 80 percent, forming the largest share of total funding. 65
However, within government appropriations and aggregated
across all provinces and education levels, local governments bear
90 percent or more of the burden, which reached 3.7 trillion yuan
($968 billion when adjusted for purchasing power parity [PPP]) in
2018.66 China’s Education Law requires increased government
appropriations for all education levels proportional to national
economic growth, which is determined by the State Council. 67
However, national funding does not always cover the requisite
financial needs for provinces, some of which are unable to fill the
remaining need. In other words, local-centric funding models have
created inequities, since poorer areas have paltry resources to pay
skilled teachers, purchase instruction materials, and maintain
school facilities.68 Other diversified funding sources—such as the
aforementioned business donations and MOE-provided special
funding for underdeveloped school systems and teacher education
programs—may possibly provide a stopgap. 69
There is more clarity in the data when it comes to what the MOE
itself spends most of its money on. In 2019, the MOE had a budget
of 456.2 billion yuan, or $120 billion PPP-adjusted.70 This budget
formed the largest share of China’s 26 cabinet-level State Council
departments with publicly disclosed figures.71 Despite the MOE’s
aforementioned responsibilities, it has a clear focus on spending
Center for Security and Emerging Technology | 17on higher education, particularly in science and technology.72 Its
higher education spending surpasses $80.6 billion PPP-adjusted
each year, or over 85 percent of the ministry’s budget, making it
the State Council's largest publicly known line item.73 This figure
likely applies to the aforementioned 75 universities the MOE
directly oversees.
Center for Security and Emerging Technology | 18Appendix B. Funding the United States’ Education
System
The funding mechanisms between the public and private
education sectors are vastly different. Public education operates
under a braided funding model, drawing from a number of
different stakeholders such as state and local governments,
whereas private for-profit educational institutions draw the vast
majority of funds (typically over 90 percent for postsecondary
institutions) from tuition and fees.74 Private nonprofit educational
institutions, on the other hand, draw less funds from tuition. For
example, private nonprofit postsecondary institutions collect
roughly one-third of funds from tuition and fees; the rest come
from other stakeholders, including private gifts, grants, or
contracts; federal, state, or local governments; and investment
returns.75
Public K-12 funding primarily draws from local sources. Individual
states and local districts each differ in their approach to funding,
however, a general framework exists across the United States.
Typically, close to half of public K-12 school funding comes from
state resources, such as income and sales tax. 76 The next largest
contributor of funds comes from local sources, primarily through
property taxes of homeowners in the area. 77 A final small
percentage (around 8 percent) comes from federal sources,
including grants for specific programs or services.78 An Education
Commission of the States report found that public school funding
streams are sometimes “inconsistent and inefficient,” as they are
impacted by shifts in policies or economic downturns.79 Other
factors, such as district demographics may impact local funding for
schools. At times, great variances exist between states in public K-
12 funding. For example, New York spends more than $24,000 per
student, while states such as Idaho and Utah spend significantly
less, around $8,000.80 In sum, state, local, and federal
governments spend about $720 billion for K-12 public education,
or $14,840 on average per pupil.81
Center for Security and Emerging Technology | 19Public colleges and universities receive a share of their funding
from their state. Aggregated nationally, states contribute over 78
percent of funds to public postsecondary education, and tax
appropriations comprise a large share of this funding. 82 The share
of sources other than state tax appropriations, or local funding,
average about 11 percent nationally.83 However, the distribution of
funding among stakeholders will vary, often widely, by state. Local
appropriations for postsecondary education are as low as 0.1
percent (as in Alabama) or close to 50 percent (in Arizona, for
example).84 Additionally, figures from the State Higher Education
Finance Report show that in more than half of U.S. states, tuition
and fees have become the primary source of funding for public
higher education as the share of state revenue dedicated to
postsecondary funding has been declining nationwide.85 From
2000 to 2015, state funding per student at higher education
institutions, both public and private, fell by about 31 percent.86
The rest of public college and university funding comes from direct
tuition payments from students. Similarly, outside of university
grants and other financial support including endowments, all
funding at private sector institutions come from student tuition.
Students can pay tuition through their own means, or through
grants and scholarships, and increasingly, student loans. 87 Student
loans are public or privately funded; the vast majority are
administered federally through the U.S. Department of Education.
At the federal level, the Department of Education does not provide
the majority of funds for education: in 2018, its share of federal
education funding hit just below 45 percent. 88 Typically 13
cabinet-level entities, including the U.S. Departments of
Agriculture, Defense, Energy, Justice, and Labor, and smaller
federal departments and programs also contribute education
funds.89 Higher education also receives funds from over a dozen
cabinet-level agencies for research, grant programs, and financial
aid. The Department of Education directs higher education funds
through discretionary grants (which are awarded through a
competitive process), student loans (which are awarded for college
Center for Security and Emerging Technology | 20attendance), or formula grants (which use formulas determined by
Congress).
We note this funding structure comes with the additional cost of
budget fluctuations, which impacts not only long-term planning
but the ability for school districts to add new curricula. For
example, the COVID-19 pandemic greatly decreased state
revenues and led to reduced funding for computer science
education or its removal entirely from fiscal year 2021 budgets.90
Center for Security and Emerging Technology | 21Appendix C. Recent Attempt to Standardize U.S. K-12
Education
Various U.S. administrations periodically attempt reforms to the
public education system, particularly around establishing common
public K-12 education standards. In 2009, state governors and
education leaders spearheaded efforts to establish a new set of K-
12 education standards to increase students’ college preparedness
and academic competitiveness.91 The federal government at the
time promoted the effort, called the Common Core State
Standards Initiative, and funded two testing consortia, the
Partnership for Assessment of Readiness for College and Careers,
and Smarter Balanced, to develop standardized tests that aligned
with common K-12 education standards. 92
However, the Common Core was met with significant controversy,
pushback, and rejection. 93 Although a majority of individual states
adhered to the reformed Common Core standards, they have
chosen their own standardized tests.94
This demonstrates the difficulty of designing and implementing a
U.S. education policy as a long-term strategic goal. Education
preferences and priorities are not consistent and change with new
administrations, as was seen after the Obama administration when
federal policies shifted to “keep education local” (i.e., reduce the
federal government’s role in education governance) and challenge
the Common Core.95 In the long term, such fluctuations complicate
strategic objectives that require planning beyond the four- to
eight- year horizons of presidential terms.
Center for Security and Emerging Technology | 22Appendix D. Comparison of Graduates in the United
States and China
Figure D presents the number of graduates in the United States
and China by level of educational attainment. While China clearly
educates and graduates more youth at lower levels of education,
due to its larger population, the United States still confers more
graduate degrees.
Figure D. Graduations in the United States and China by level of
education, 2019
Source: 2020 Digest of Education Statistics, U.S. National Center for Education
Statistics; 2020 Chinese Statistical Yearbook.
Center for Security and Emerging Technology | 23Endnotes
1
Center on International Education Benchmarking, “Shanghai-China:
Governance and Accountability,” National Center on Education and the
Economy, https://ncee.org/what-we-do/center-on-international-education-
benchmarking/top-performing-countries/shanghai-china/shanghai-china-
system-and-school-organization.
2
Center on International Education Benchmarking, “Shanghai-China.”
3
Organization for Economic Cooperation and Development, Education in China:
A Snapshot (Paris: OECD, 2016), https://www.oecd.org/education/Education-in-
China-a-snapshot.pdf, 24.
4
Center on International Education Benchmarking, “Shanghai-China.”
5
Center on International Education Benchmarking, “Shanghai-China.”
6
Center on International Education Benchmarking, “Shanghai-China.”
7
OECD, Education in China.
8
“China: Gaokao,” Universities and Colleges Admissions Service, December 6,
2018, https://qips.ucas.com/qip/china-Gaokao.
9
Sixth National People's Congress, “中华人民共和国义务教育法(1986年)”
[“Compulsory Education Law of the People's Republic of China (1986)”], April
12, 1986,
http://www.edu.cn/edu/zheng_ce_gs_gui/jiao_yu_fa_lv/200603/t20060303_165
119.shtml; China Power Project, “How Does Education in China Compare with
Other Countries?" (Center for Strategic and International Studies, November 15,
2016, updated August 26, 2020), https://chinapower.csis.org/education-in-
china.
10
OECD, Education in China.
11
Mini Gu, Rachel Michael, Claire Zheng, and Stefan Trines, “Education in China”
(World Education News and Reviews, December 17, 2019),
https://wenr.wes.org/2019/12/education-in-china-3.
Center for Security and Emerging Technology | 2412
Chinese Ministry of Education, “中国教育概况: 2019年全国教育事业发展情况”
[“General Development Summary of Chinese Education in 2019”], August 31,
2020, https://archive.ph/kiVkS.
13
Directorate for Education, Education and Training Policy Division, “Vocational
Education and Training in China: Strengths, Challenges and Policy Options,”
OECD, June 2010, https://www.oecd.org/education/skills-beyond-
school/45494135.pdf; Australian Department of Education, Skills and
Employment, “China announces major reform to vocational education sector,”
Government of Australia, March 2019,
https://internationaleducation.gov.au/news/latest-news/Pages/China-
announces-majer-reform-to-vocational-education-sector.aspx.
14
Australian Department of Education, Skills and Employment, “China
announces major reform.”
15
Australian Department of Education, Skills and Employment, “China
announces major reform.”
16
C9 contains the universities Tsinghua, Peking, Fudan, Shanghai Jiaotong,
Nanjing, Zhejiang, Xi'an Jiaotong, University of Science and Technology of China,
and Harbin Institute of Technology. “China's Ivy League: C9 League,” People’s
Daily, accessed August 2021, http://en.people.cn/203691/7822275.html.
17
“China: Gaokao,” Universities and Colleges Admissions Service; Mini Gu and
Jessica Magaziner, “The Gaokao: History, Reform, and Rising International
Significance of China’s National College Entrance Examination” (World
Education News and Reviews, May 2, 2016), https://wenr.wes.org/2016/05/the-
Gaokao-history-reform-and-international-significance-of-chinas-national-
college-entrance-examination.
18
Gu et al., “Education in China”; Chinese Ministry of Education, "General
Development Summary."
19
Chinese Ministry of Education, "General Development Summary”; Gu et al.,
“Education in China.”
20
Chinese Ministry of Education, "General Development Summary."
21
Gu et al., “Education in China.”
22
Gu et al., “Education in China.”
Center for Security and Emerging Technology | 2523
Chinese Ministry of Education, “教育部直属高等学校” [“Higher Education
Institutions Directly Under the Ministry of Education”], https://archive.ph/rZeRY.
24
The Seven Sons include the Beijing Institute of Technology, Beijing University
of Aeronautics and Astronautics (Beihang), the Harbin Institute of Technology,
Harbin Engineering University, Northwestern Polytechnical University, Nanjing
University of Aeronautics and Astronautics and Nanjing University of Science
and Technology. See Ryan Fedasiuk and Emily Weinstein, “Universities and the
Chinese Defense Technology Workforce” (Center for Security and Emerging
Technology, December 2020), https://cset.georgetown.edu/wp-
content/uploads/CSET-Universities-and-the-Chinese-Defense-Technology-
Workforce-1.pdf.
25
“What is Project 211 and Project 985 universities,” Study in China,
http://usa.ciss.org.cn/Admissions/7017; Shengbing Li, “From 985 to World Class
2.0: China's Strategic Move,” Inside Higher Ed, February 7, 2018,
https://www.insidehighered.com/blogs/world-view/985-world-class-20-chinas-
strategic-move.
26
Department of Education, Skills and Employment, “Double First-Class
university and discipline list policy update,” Government of Australia, December
14, 2017, https://internationaleducation.gov.au/international-
network/china/PolicyUpdates-China/Pages/Double-First-Class-university-and-
discipline-list-policy-update.aspx.
27
Li, “From 985 to World Class 2.0.”
28
“全国二本大学有哪些?” [“What are China’s second-tier universities?”] Baidu
Answers, April 16, 2018,
https://zhidao.baidu.com/question/175107733640813124.html.
29
“为什么三本的学费比一本、二本贵这么多?” [“Why is the tuition fee for third-
tier universities so much more expensive than for first or second tiers?”] 河南教
师考试 [Henan Teacher Exams], December 12, 2018,
https://www.sohu.com/a/281305381_131071; Gu et al., “Education in China.”
30
Why is the tuition fee for third-tier universities so much more expensive?,”
Henan Teacher Exams.
31
Gu et al., “Education in China”; Jian Liu, “Independent colleges – A hybrid
response to massification,” University World News, November 7, 2014,
https://www.universityworldnews.com/post.php?story=20141106074227990.
Center for Security and Emerging Technology | 2632
Gu et al., “Education in China.”
33
“专科学校学费一般多少钱一年?” [“How much does yearly college tuition
typically cost?”] 大学生必备网 [Essentials for College Students], June 21, 2020,
https://www.dxsbb.com/news/79950.html.
34
“都说大专没用,为什么有些学生还是会选择大专?专科有什么优势?” [“All say
zhuanke is useless, so why do some select this path? What are the benefits?”]
记忆里的歌 [Songs as I Remember Them], August 2, 2018,
https://baijiahao.baidu.com/s?id=1607652162050865524&wfr=spider&for=pc.
35
Gu et al., “Education in China.”
36
Mei Li and Rui Yang, Governance reforms in higher education: A study of
China (Paris: UNESCO, 2014), 46,
https://unesdoc.unesco.org/ark:/48223/pf0000231858/PDF/231858eng.pdf.mul
ti.
37
Li and Yang, Governance reforms in higher education.
38
Gu et al., “Education in China.”
39
Chinese Ministry of Education, "General Development Summary."
40
Gu et al., “Education in China.”
41
Remco Zwetsloot et al., “China is Fast Outpacing U.S. STEM PhD Growth”
(Center for Security and Emerging Technology, August 2021),
https://cset.georgetown.edu/publication/china-is-fast-outpacing-u-s-stem-phd-
growth.
42
“研究生、硕士、博士有什么区别?具体怎么考?” [“What is the difference in
postgraduate degrees between Master’s and doctorates? How do you take the
entrance exam?”] Baidu Answers, March 18, 2019,
https://zhidao.baidu.com/question/43681.html.
43
OECD, Education in China.
44
U.S. Department of Education, “An Overview of the U.S. Department of
Education,” September 2010,
https://www2.ed.gov/about/overview/focus/what.html.
Center for Security and Emerging Technology | 2745
U.S. Department of Education, “The Federal Role in Education,” last modified
June 15, 2021, https://www2.ed.gov/about/overview/fed/role.html.
46
Melanie Hanson, “Financial Aid Statistics” (EducationData.org, November 28,
2020), https://educationdata.org/financial-aid-statistics.
47
Abigail Johnson Hess, “U.S. student debt has increased by more than 100%
over the past 10 years,” CNBC, December 22, 2020,
https://www.cnbc.com/2020/12/22/us-student-debt-has-increased-by-more-
than-100percent-over-past-10-years.html.
48
Bryce Loo, “Education in the United States of America” (World Education
News and Reviews, June 12, 2018), https://wenr.wes.org/2018/06/education-in-
the-united-states-of-america.
49
U.S. Department of Education, “The Federal Role in Education.”
50
National Center for Education Statistics, Expenditures of educational
institutions related to the gross domestic product, by level of institution:
Selected years, 1929-30 through 2018-19 (Washington, DC: U.S. Department
of Education, 2019),
https://nces.ed.gov/programs/digest/d19/tables/dt19_106.10.asp?current=yes;
U.S. Department of Education, “The Federal Role in Education.”
51
National Center for Education Statistics, Types of state and district
requirements for kindergarten entrance and attendance, waivers and
exemptions for kindergarten entrance, by state: 2018 (Washington, DC: U.S.
Department of Education, 2018),
https://nces.ed.gov/programs/statereform/tab5_3.asp; National Center for
Education Statistics, Compulsory school attendance laws, minimum and
maximum age limits for required free education, by state: 2017 (Washington,
DC: US Department of Education, 2017),
https://nces.ed.gov/programs/statereform/tab5_1.asp.
Only 19 states require kindergarten attendance. Kindergarten availability also
varies by state: 39 states require school districts to provide half-day
kindergarten programs, and 17 states require districts to provide full-day
kindergarten programs (source: “50-State Comparison: State Kindergarten
Through Third Grade Policies,” Education Commission of the States, accessed
June 6, 2018, https://www.ecs.org/kindergarten-policies/.)
52
Loo, “Education in the United States of America.”
Center for Security and Emerging Technology | 2853
National Center for Education Statistics, Course credit requirements and exit
exam requirements for a standard high school diploma and the use of other high
school completion credentials, by state: 2013 (Washington, DC: U.S.
Department of Education, 2013),
https://nces.ed.gov/programs/digest/d19/tables/dt19_234.30.asp.
54
National Center for Education Statistics, Recent high school completers and
their enrollment in college, by sex and level of institution: 1960 through 2019
(Washington, DC: U.S. Department of Education, 2019),
https://nces.ed.gov/programs/digest/d20/tables/dt20_302.10.asp.
55
National Center for Education Statistics, Degree-granting postsecondary
institutions, by control and level of institution: Selected years, 1949-50 through
2019-20 (Washington, DC: U.S. Department of Education, 2020),
https://nces.ed.gov/programs/digest/d20/tables/dt20_317.10.asp?current=yes.
56
U.S. Department of Education, “Structure of US Education,” February 22,
2008, https://www2.ed.gov/about/offices/list/ous/international/usnei/us/edlite-
structure-us.html.
57
Including adult education programs, many of which are offered at community
centers, local K-12 schools, or community colleges.
58
“Basic Classification Descriptions,” The Carnegie Classification of Institutions
of Higher Education, accessed August 9, 2021,
https://carnegieclassifications.iu.edu/classification_descriptions/basic.php.
59
“Boston College confirmed among top tier of U.S. research universities,”
Boston College, March 2019, https://www.bc.edu/bc-web/bcnews/campus-
community/announcements/carnegie-classification.html.
60
“131 Results for Basic ‘Doctoral Universities,’” The Carnegie Classification of
Institutions of Higher Education, accessed August 11, 2021,
https://carnegieclassifications.iu.edu/lookup/srp.php?clq=%7B%22basic2005_id
s%22%3A%2215%22%7D&start_page=standard.php&backurl=standard.php&
limit=0,50.
61
Enrollment data comes from 2018 NCES tables, which accordingly use a
2018 count of R1 and R2 institutions and differs slightly from the 2019 list from
Carnegie’s Classification of Institutions of Higher Education. NCES counts 115
R1 institutions and 104 R2 institutions.
Center for Security and Emerging Technology | 29“135 Results for Basic ‘Doctoral Universities,’” The Carnegie Classification of
Institutions of Higher Education, accessed August 11, 2021,
https://carnegieclassifications.iu.edu/lookup/srp.php?start_page=custom.php&li
mit=0,50&clq=%5D=16&submit=CREATE+LIST; National Center for Education
Statistics, Number of degree-granting postsecondary institutions and
enrollment in these institutions, by enrollment size, control, and classification of
institution: Fall 2018 (Washington, DC: U.S. Department of Education, 2018),
https://nces.ed.gov/programs/digest/d19/tables/dt19_317.40.asp.
62
An issue similarly faced by the OECD, see OECD, Education in China, 16.
63
OECD, Education in China, 16.
64
OECD, Education in China, 14.
65
Chinese Statistical Yearbook.
66
Using USD=RMB/7 and data from World Bank, Purchasing Power Parities
and the Size of World Economies: Results from the 2017 International
Comparison Program (Washington, DC: World Bank, 2020); Chinese Statistical
Yearbook.
67
OECD, Education in China, 14.
68
China Power Project, “Education in China.”
69
OECD, Education in China; Chinese Statistical Yearbook; Center on
International Education Benchmarking, “Shanghai-China.”
70
Using USD=RMB/7 and data from World Bank, Purchasing Power; Ryan
Fedasiuk, Emily Weinstein, Ben Murphy, and Alan Omar Loera Martinez,
“Chinese State Council Budget Tracker,” Center for Security and Emerging
Technology, https://statecouncil.cset.tech.
71
Fedasiuk et al., “Chinese State Council Budget Tracker.”
72
Forthcoming CSET work from Anna Puglisi, Ryan Fedasiuk, and Alan Omar
Loera Martinez, “Chinese University Investments in Science and Technology”
(Center for Security and Emerging Technology, forthcoming).
73
Fedasiuk et al., “Chinese State Council Budget Tracker.”
Center for Security and Emerging Technology | 3074
National Center for Education Statistics, Percentage distribution of total
revenues of private for-profit degree-granting postsecondary institutions, by
source of funds: 2017–18 (Washington, DC: U.S. Department of Education,
2019),
https://nces.ed.gov/programs/digest/d19/figures/fig_19.asp?referrer=figures.
75
National Center for Education Statistics, Percentage distribution of total
revenues of private nonprofit degree-granting postsecondary institutions, by
source of funds: 2017–18 (Washington, DC: U.S. Department of Education,
2019), https://nces.ed.gov/programs/digest/d19/figures/fig_18.asp .
76
National Center for Education Statistics, Percentage of revenue for public
elementary and secondary schools, by source of funds: 1970–71 through 2016–
17 (Washington, DC: U.S. Department of Education, 2019),
https://nces.ed.gov/programs/digest/d19/figures/fig_11.asp.
77
Grace Chen, “An Overview of the Funding of Public Schools,” Public School
Review, March 31, 2021, https://www.publicschoolreview.com/blog/an-
overview-of-the-funding-of-public-schools.
78
Chen, “An Overview of the Funding.”
79
“Initiatives From Preschool to Third Grade: A Policymaker’s Guide” (Education
Commission of the States, February 2018), https://www.ecs.org/wp-
content/uploads/Initiatives-From-Preschool-to-Third-Grade.pdf.
80
Melanie Hanson, “U.S. Public Education Spending Statistics,”
EducationData.org, accessed June 2, 2021, https://educationdata.org/public-
education-spending-statistics.
81
Hanson, “U.S. Public Education Spending Statistics.”
82
“Sources and Uses of State Funding” in State Higher Education Finance
(SHEF) Report, 2020, https://shef.sheeo.org/report/?report_page=sources-and-
uses-of-funding.
83
“Sources and Uses of State Funding,” SHEF Report.
84
“Sources and Uses of State Funding,” SHEF Report.
85
“Distribution of Revenue” in State Higher Education Finance (SHEF) Report,
2020, https://shef.sheeo.org/report/?report_page=distribution-of-revenue.
Center for Security and Emerging Technology | 3186
COVID-19 has exacerbated this trend: states cut funds for two-year colleges
by $457 million during the pandemic and by $63 million for four-year
institutions. Emma Whitford, “State Funding Hit Lands on 2-Year Colleges,”
Inside Higher Ed, March 23, 2021,
https://www.insidehighered.com/news/2021/03/23/state-funding-two-year-
colleges-declined-year-while-four-year-colleges-saw-small-dip.
87
“The Complex U.S. System of Workforce Education and Training,” in Building
America’s Skilled Technical Workforce (Washington, DC: National Academies
Press, 2017), 63, https://www.nap.edu/read/23472/chapter/6.
88
National Center for Education Statistics, Percentage distribution of federal on-
budget funds for education, by agency: Fiscal year 2018 (Washington, DC: U.S.
Department of Education, 2019),
https://nces.ed.gov/programs/digest/d19/figures/fig_21.asp.
89
NCES, Percentage distribution of federal on-budget funds.
90
Andrew Kenney and Bente Birkeland, “The Grim Business Of State Budget
Cuts Under Coronavirus Has Begun,” CPR News, May 11, 2020,
https://www.cpr.org/2020/05/11/the-grim-business-of-state-budget-cuts-
under-coronavirus-has-begun/.
91
Libby Nelson, “Everything you need to know about the Common Core,” Vox,
May 13, 2015, https://www.vox.com/2014/10/7/18088680/common-core.
92
Claudio Sanchez, “Obama's Impact On America's Schools,” National Public
Radio, January 13, 2017,
https://www.npr.org/sections/ed/2017/01/13/500421608/obamas-impact-on-
americas-schools.
93
Elaine McArdle, “What Happened to the Common Core?,” Harvard Ed
Magazine, Fall 2014, https://www.gse.harvard.edu/news/ed/14/09/what-
happened-common-core.
94
Sanchez, “Obama’s Impact.”
95
Cory Turner, “Can A President Trump Get Rid Of Common Core?,” National
Public Radio, November 10, 2016,
https://www.npr.org/sections/ed/2016/11/10/501426803/can-president-trump-
get-rid-of-common-core.
Center for Security and Emerging Technology | 32You can also read