Unraveling the Global Warming Mitigation Potential from Recycling Subway Related Excavated Soil and Rock in China Via Life Cycle Assessment
←
→
Page content transcription
If your browser does not render page correctly, please read the page content below
Integrated Environmental Assessment and Management — Volume 17, Number 3—pp. 639–650
Received: 12 June 2020   |   Returned for Revision: 10 July 2020   |   Accepted: 23 November 2020                                        639

   Life Cycle & Sustainability

Unraveling the Global Warming Mitigation Potential from
Recycling Subway‐Related Excavated Soil and Rock in China Via
Life Cycle Assessment
Ning Zhang,† Hui Zhang,‡ Georg Schiller,*† Haibo Feng,§ Xiaofeng Gao,|| Enming Li,# and Xiujie Li††
  †Leibniz Institute of Ecological Urban and Regional Development (IOER), Dresden, Germany
  ‡School of Chemistry and Environmental Engineering, Wuhan Institute of Technology, Wuhan, China
  §Department of Mechanical and Construction Engineering, Northumbria University, Newcastle, United Kingdom
  ||Department of Urban Engineering, The University of Tokyo, Tokyo, Japan
  #School of Resources and Safety Engineering, Central South University, Changsha, China
  ††Green Lighting System Lab, School of Environment and Energy, Peking University Shenzhen Graduate School, Shenzhen, China

   ABSTRACT
     Many cities across China are investing in subway projects, resulting in much subway construction activity, which has
   experienced a surge over the past decade. The construction activities inevitably cause a dramatic quantity of subway‐related
   excavated soil and rock (ESR). How to manage it with minimal environmental impact on our urban ecosystem remains an
   open question. The present study evaluates global warming potential (GWP, expressed by CO2 eq) from different ESR
   recycling and landfilling scenarios via a life cycle assessment (LCA) model based on primary field investigation combined with
   the LCA software database. The study results illustrate that recycling ESR can significantly reduce greenhouse gas emissions.
   In comparison with traditional construction materials, the scenarios found that a cumulative amount of 1.1 to 1.5 million
   tonnes (Mt) of CO2 eq emissions could have been mitigated by using ESR generated between 2010 and 2018 to produce
   baking‐free bricks and recycled baked brick. Using cost–benefit analysis, potential economic benefits from recycled sand and
   baking‐free bricks are found to reach US$9 million annually. The findings of this study could provide better recycling options
   for ESR‐related stakeholders. It is important to mention that there still is much work to be done before this recycling work can
   be popularized in China. Integr Environ Assess Manag 2021;17:639–650. © 2020 The Authors. Integrated Environmental
   Assessment and Management published by Wiley Periodicals LLC on behalf of Society of Environmental Toxicology &
   Chemistry (SETAC)

   Keywords: Excavated soil and rock (ESR) Recycling                    CO2 mitigation    Life cycle assessment Cost–benefit analysis

INTRODUCTION                                                                    of subway‐related excavated soil and rock (ESR) (Sun
   Urban expansion has become the “new normal” in China's                       et al. 2016).
present development model (Wei et al. 2017). Con-                                  Excavated soil and rock is a major contributor to con-
sequently, traffic congestion has become a common                                struction and demolition (C&D) waste in cities (Eras et al.
problem in megacities (Kong et al. 2016); many people                           2013). There are many previous studies related to C&D
pouring into cities increases requirements on traffic facilities                 waste across the world, including generation estimation,
(Han et al. 2018). Subway construction projects have be-                        environmental impact assessment, and technological in-
come the focus of the Chinese government's urban public                         novation in recycling (McNeil and Kang 2013; Yeheyis et al.
transportation planning in recent years (Zhang et al. 2017).                    2013; Sáez et al. 2014). Concerning the management opti-
Demand for better urban mass transit is causing a surge in                      mization of C&D waste, multiple approaches have been
the construction of subways and unparalleled generation                         used in waste management of construction projects (Lu
                                                                                et al. 2017). Jalaei et al. (2019) used life cycle assessment
                                                                                (LCA) and Building Information Modeling (BIM) tools to
  This article contains online‐only Supplemental Data.
                                                                                establish an optimized platform for lifespan quantitative
  * Address correspondence to G.Schiller@ioer.de
                                                                                management of C&D waste. Similarly, the application of
  Published 26 November 2020 on wileyonlinelibrary.com/journal/ieam.
                                                                                material flow analysis (MFA) to urban construction material
  This is an open access article under the terms of the Creative Commons
  Attribution‐NonCommercial‐NoDerivs License, which permits use and             management at the end‐of‐life (EoL) stage has also proved
  distribution in any medium, provided the original work is properly            to be useful in environmental management (Huang et al.
  cited, the use is non‐commercial and no modifications or adaptations
                                                                                2013). The research of Esa et al. (2017) shows that making
  are made.
                                                                                full use of the concept of circular economy to establish a

Integr Environ Assess Manag 2021:639–650                       DOI: 10.1002/ieam.4376                                     © 2020 The Authors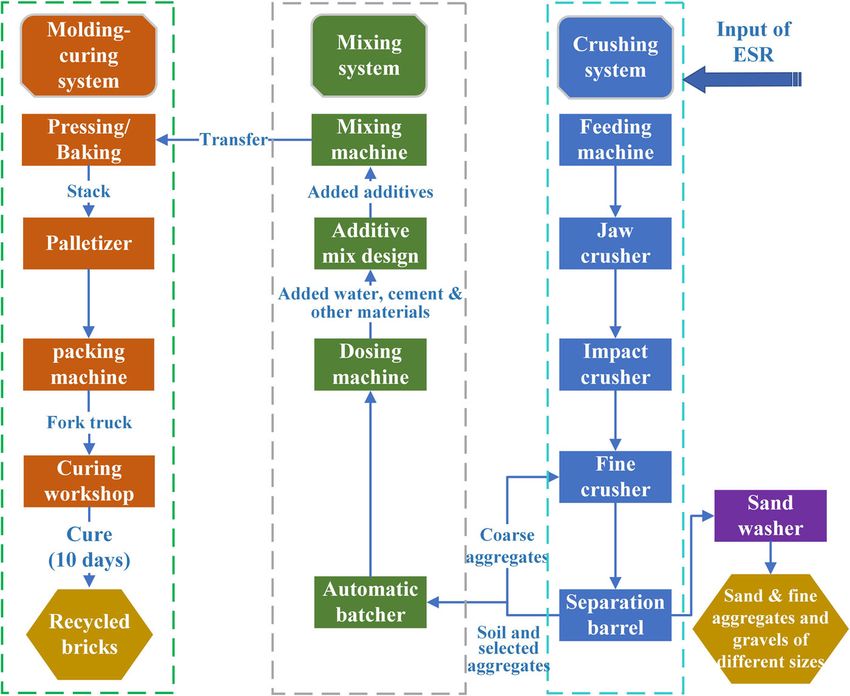
640                                                                           Integr Environ Assess Manag 17, 2021—N Zhang et al.

C&D waste reduction strategy can also reduce environ-              present study provides stakeholders with a recycling man-
mental impact.                                                     agement strategy for ESR.
   It is generally believed that landfilling and backfilling of
C&D waste and ESR cause more significant negative im-               RESEARCH METHODS
pacts than recycling, such as land subsidence, vegetation
                                                                   Research objective
deterioration, landslide risk, and increase in the difficulty of
ecological environment recovery (Vossberg et al. 2014; Arm            In recent studies, many researchers have proved that re-
et al. 2017; Duan et al. 2019). Simion et al. (2013) used LCA      cycling C&D waste is an effective and economically feasible
to compare the environmental impacts of producing con-             way of mitigating greenhouse gas (GHG) emissions (Zheng
crete aggregates from recycling and natural inert or mining        et al. 2017; Paes et al. 2019; Zhang, Duan, Miller et al. 2020).
processing; their results revealed that the main environ-          As these previous studies revealed, much C&D waste is
mental impacts are generated by natural inert processing.          generated in urban areas (e.g., Wu et al. 2014; Zhang
Ortiz et al. (2010) also used LCA to compare the global            et al. 2019), and recycling such waste is effective in reducing
warming potential (GWP) of 3 treatment scenarios for C&D           the negative impacts from C&D landfilling and increasing
waste in Spain, and the ecofriendliest treatment was re-           CO2 mitigation by using recycled construction materials.
cycling, followed by incineration and landfilling. A system         However, ESR recycling, which is a great opportunity to
dynamics model was developed by Marzouk and Azab                   further reduce CO2 emissions and waste production at the
(2014), and its findings showed that recycling C&D waste            urban scale, has not been paid enough attention.
leads to significant reductions in energy consumption and              To minimize the negative environmental impacts brought
GWP, meanwhile it also conserves land when compared to             by ESR landfilling and clarify the positive environmental and
disposal in landfills. In addition, recycling some components       economic results from ESR recycling, the present study aims
of C&D waste to energy regeneration and C capture and              to compare the environmental impacts of manufacturing
storage (CCS) can help in building climate‐friendly societies      ESR‐based construction materials versus traditional con-
(Lausselet et al. 2016, 2017). However, if the environmental       struction materials and to assess the potential economic
impact is expanded from climate change to human toxicity           benefits from recycling ESR. The present study applies an
and terrestrial acidification categories, there is yet another      LCA model to evaluate the total GWP (measured as carbon
view. Muñoz et al. (2018) used LCA to study the overall            dioxide equivalents [CO2 eq]) of different ways to recycle
environmental benefits of Waelz slag incorporation into             ESR. Meanwhile, an LCC model is developed to assess the
bricks; their results showed that a great reduction in impact      potential economic benefits of ESR recycling, as an ex-
on climate change could be achieved, but in the process of         ample. It is worth mentioning that recycling and backfilling
firing, more sulfur dioxide (SO2) and hydrogen fluoride (HF)         are 2 different disposal methods in China; recycling of ESR
emissions would be generated. The results were equivocal           or C&D waste refers to the reprocessing of waste materials
on environmental impact.                                           into recycled construction materials, whereas backfilling is a
   In terms of economic benefits, Tam (2008) did a case‐            recovery method and is not taken into account here (Galán
based economic analysis of concrete debris recycling, and          et al. 2019).
the results show that recycling concrete waste as aggregates          Excavated soil and rock is recycled in various marginal
for new concrete production can be cost effective. Coelho          ways to replace traditional construction materials. As shown
and Brito (2013) analyzed the economic viability of C&D            in Table 1, recycling methods include pressing, baking, and
waste recycling plants in Portugal, finding they have high          screening, and recycled products consist of recycled baking‐
potential for profit, even considering the large initial            free brick, recycled sand, and recycled baked brick.
investment required.                                                  The same types of natural and recycled materials
   In short, recycling C&D waste is feasible from both eco-        with similar properties can be replaced for multiple struc-
nomic and environmental perspectives. However, there is a          tures (recycled sand–natural sand [RS‐NS] and recycled
lot of focus on C&D waste, and ESR is generally ignored by         baked brick–clay solid brick [RBB‐CSB]). For the other
researchers. Improper disposal of ESR can also create neg-         2 replacements (recycled baking‐free brick–clay solid brick
ative environmental impacts, such as air pollution, water          [RBFB‐CSB] and recycled baked brick–solid concrete brick
contamination, and damage to vegetation (Duan et al.               [RBB‐SCB]), due to differences in properties between the
2019). A recent study by Zhang, Duan, Sun et al. (2020)            materials, there are limitations in the scope of their appli-
indicated that mismanagement of ESR (disposed of mainly            cation. The replacement materials are mainly suitable for
through dumping sites) threatens the natural environment           low‐rise buildings and pavements owing to the heavier
and poses high landslide risks in China. Therefore, further        weight of recycled baking‐free brick. Recycled baked brick
detailed research into ESR recycling is urgent and necessary.      and solid concrete brick have a similar range of utilization for
The present study evaluates the CO2 mitigation potential of        masonry walls, leading to feasible replacement.
recycling ESR by using an LCA model based on a series of
                                                                   Study area and data sources
field investigation data (i.e., from recycling plants and
landfills); it also analyzes the economic benefits of recycling       The assessment in the present study was carried out in
ESR based on the life cycle costing (LCC) method. The              mainland China, a rapidly growing and densely populated

Integr Environ Assess Manag 2021:639–650        wileyonlinelibrary.com/journal/ieam                            © 2020 The Authors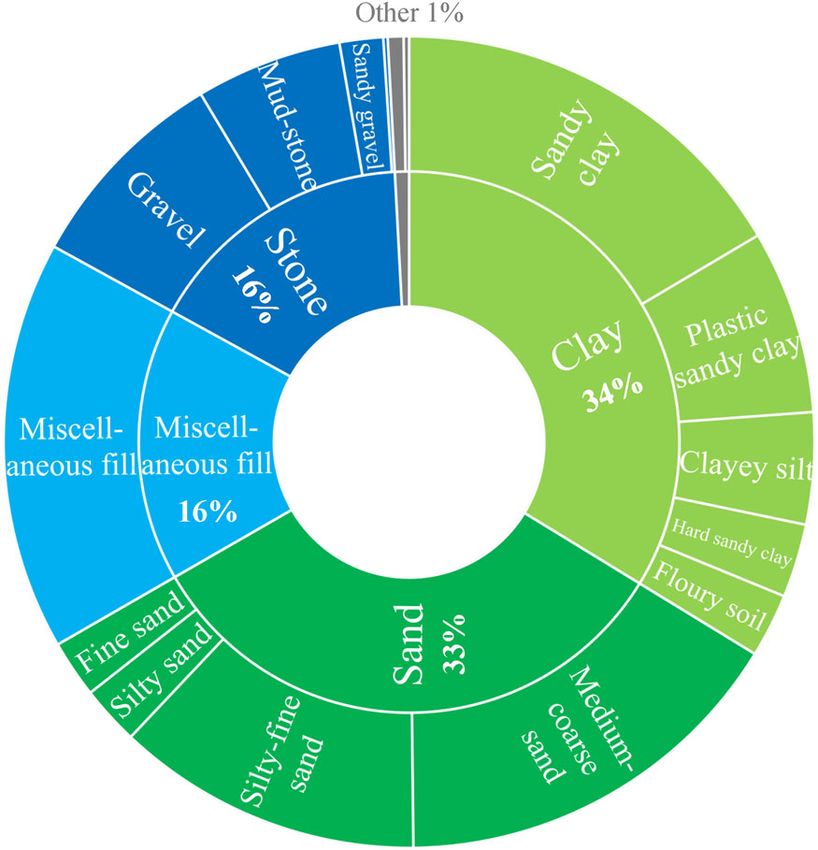
Waste Management via Life Cycle Assessment—Integr Environ Assess Manag 17, 2021 641
Table 1. The recycle and replace scenarios
Abbreviation of material
Recycling method Recycled product Material to be replaced replacement scheme
Screening Recycled sand (from ESR) Natural sand (from river sediment) RS‐NS
Pressing Recycled baking‐free brick Traditional clay solid brick RBFB‐CSB
Baking Recycled baked brick Traditional clay solid brick RBB‐CSB
Solid concrete brick RBB‐SCB
ESR = excavated soil and rock.
country with 177 urban railway lines as of December 2019 (ISO 2006), a widely accepted standard that describes the
(Jin and Chen 2019). Population growth, plus the great principles and framework for LCA. The methodology
demand for urban mass transit, generates much ESR in framework for LCA consists of the following 4 components,
China. The present study uses CO2 eq as a measurement each of which plays a crucial role in the assessment
unit to analyze the GWP from ESR landfilling, combined with (Guinée 2001).
different recycling plans, from 2000 to 2018.
Data in the present study are gathered from previous lit- 1) Goal and scope definition. The intended objective of the
erature, stakeholder interviews (e.g., ESR and C&D waste LCA is to evaluate the GWP of the EoL stage for the ESR
recycling plants, managers of landfill sites), and commercial sector. Because the recycling and landfilling processes all
databases (including eBalance and GaBi software) (IKE 2012; use ESR as the raw material, “1 kg (tonne) of ESR” is se-
Sphera 2018). The data on composition and flow of ESR are lected as the functional unit for the present research. A
derived from the average calculation of results in Zhang, reduced‐scope LCA is adopted in the present study (see
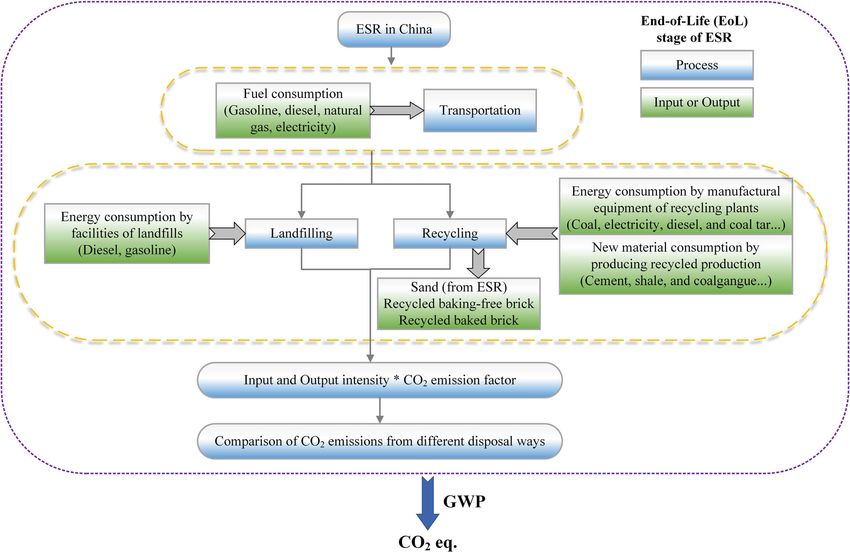
Duan, Sun et al. (2020) (see Eqn. 1). Further generation and Figure 1). It focuses on establishing and comparing the
flow data on main components were obtained from inter- energy consumption and GWP implications for ESR
views with government officials and previous studies (Zheng landfilling and its recycling in different ways, with only the
et al. 2017; Zhang, Duan, Sun et al. 2020) (see Eqn. 2). EoL stage considered.
7
2) Inventory analysis. Local data are used wherever possible
Px = ∑Pxl /7. (1) to ensure that the life cycle inventory (LCI) is repre-
l=1 sentative of the current situation in China. Therefore, the
primary data, such as the intensity of energy and mate-
Equation 1 represents an average calculation of 1 type of
rials consumption, are gathered from field investigation.
ESR material in 7 Chinese regions. Px refers to the average
Secondary data are available for calculating CO2 emis-
proportion of materials of type x across China, whereas Pxl is
sions; the Chinese CO2 emission factors of various
the proportion of materials of type x in region l .
processes are collected from the literature, GaBi (LCA
software developed by Thinkstep), and eBalance
Qxyt = Gy × Px × Rxt . (2)
(Chinese LCA software developed by IKE) (Bailey et al.
In Equation 2, Qxyt refers to the quality of composition x 2020). The detailed data inventory of emission factors is
flowing to treatment method t in year y , Gy is the total shown in Table 2.
generation of ESR in year y , and Rxt means the rate of 3) Impact assessment. The results of GWP value, such as
composition x flowing to t . In the present study, the treat- the impact of CO2, methane (CH4), and fluoride, are ex-
ment method t represents only landfilling and recycling. pressed in the weight of CO2 eq (Deviatkin et al. 2019).
The interviews focused on flow data, energy and material Following the Intergovernmental Panel on Climate
consumption at recycling and landfilling stages, revenue Change method, an assessment time frame of 100 y is
from ESR trade, and expenditure on equipment acquisition used in the present study to assess the GWP (IPCC 2007).
and site leasing. In brief, the interviews gave a better un- The following M1 to M4 in Equations 3 to 6 refer to the
derstanding of how the recycling system works. These data total CO2 mitigation potential from different material re-
are utilized to structure the LCA and LCC data inventory, placement schemes. Table 3 shows the definitions of the
which usually contains CO2 emission factors and energy and construction material terms.
materials consumption. M1 means using recycled sand from ESR to replace
natural sand from river sediment.
Life cycle assessment model M1 = ELC . NS − ERS , (3)
The LCA model is the main methodology in the
present study. It strictly follows the requirements of the In- where ELC . NS refers to the total emissions of producing
ternational Organization for Standardization 14044 standard natural sand from river sediment (including mining,
Integr Environ Assess Manag 2021:639–650 DOI: 10.1002/ieam.4376 © 2020 The Authors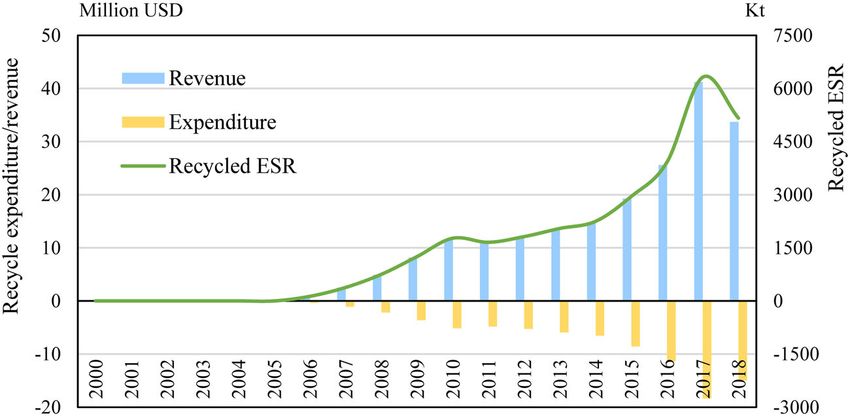
642                                                                                           Integr Environ Assess Manag 17, 2021—N Zhang et al.

  Figure 1. The system boundary and study scope for LCA. ESR = excavated soil and rock; GWP = global warming potential; LCA = life cycle assessment.

    transportation, and manufacturing stages), and ERS refers                                            M2 = ELC . CSB − ERBFB,                          (4)
    to the emissions of screening recycled sand from ESR
    (including transportation and screening stages).                                 where ELC . CSB refers to the total emissions of traditional
       M2 is using recycled baking‐free brick to replace                             clay solid brick production (including mining, trans-
    traditional clay solid brick.                                                    portation, and manufacturing stages), and ERBFB means

                                                          Table 2. The data inventory for LCA

 Emission factor                                                                           Value                                  Data source

 National grid                                                                   0.77 kg CO2 eq/kWh                    eBalance and GaBi databasesb

 Coal                                                                            0.28 kg CO2 eq/kg                     GaBi databasec

 Diesel                                                                          0.49 kg CO2 eq/kg

 Gasoline                                                                        0.56 kg CO2 eq/kg

 Transportation (truck with load capacity for 7.5–16 tonnes)                     0.22 kg CO2 eq/t·km

 Natural gas                                                                     0.78 kg CO2 eq/kg

 Coal tar                                                                        3.03 kg CO2 eq/kg                     eBalance databased

 Natural sand (μf = 3.0~1.6)a                                                    2.80 kg CO2 eq/t

 Traditional clay solid brick                                                    0.18 kg CO2 eq/kg

 Solid concrete brick                                                            334.80 kg CO2 eq/m3

LCA = life cycle assessment; µf = fineness modulus.
a
  μf, the fineness modulus, is an index that characterizes the degree and type of natural sand particle size. The fineness modulus of ordinary construction sand
is 3.0 to 1.6.
b
  IKE 2012; Sphera 2018.
c
  Sphera 2018.
d
  IKE 2012.

Integr Environ Assess Manag 2021:639–650                  wileyonlinelibrary.com/journal/ieam                                         © 2020 The Authors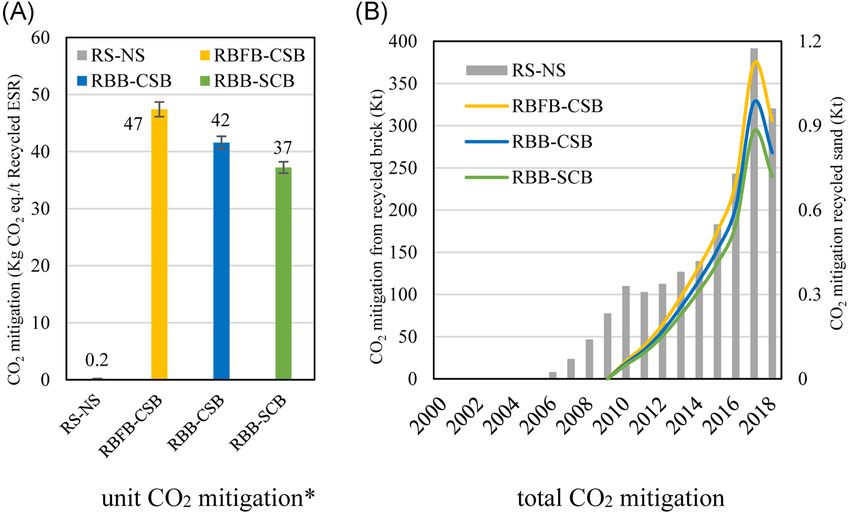
Waste Management via Life Cycle Assessment—Integr Environ Assess Manag 17, 2021                                                               643

     Table 3. Explanations of different terms for construction materials (according to Chinese national standards: GB/T 5101‐2017,
                                               GB/T 21144‐2007, and GB/T 14684‐2011)a

 Term of construction materials           Abbreviation                                             Explanation

 Traditional clay solid brick                  CSB              Produced by mixing clay, water, shale, coal gangue, and other additives.
                                                                   Hardening method is kiln firing.

 Recycled baking‐free brick                    RFB              Produced by mixing recycled clay (from ESR), water, cement, RCAs (from
                                                                   C&D waste), and other additives. Hardening method is machine pressing.

 Recycled baked brick                          RBB              Produced by mixing recycled clay (from ESR), water, shale, coal gangue,
                                                                   and other additives. Hardening method is kiln firing.

 Solid concrete brick                          SCB              Produced by mixing cement, water, concrete aggregates, fly ash, and other
                                                                   additives. Hardening methods are forming and curing.

 Natural sand                                   NS              Produced by river dredging.

 Recycled sand                                  RS              Produced by screening from ESR.

C&D = construction and demolition; ESR = excavated soil and rock; RCA = recycled concrete aggregate.
a
  SAC 2007, 2011, 2017.

   the emissions from pressing recycled baking‐free brick                   value between total revenues (Rtotal ) and total expenditures
   (including transportation and manufacturing stages).                     (EPtotal ) of ESR recycling.
      M3 refers to using recycled baked brick to replace
   traditional clay solid brick, and M4 means using recycled                                           Rtotal = RR + RS + SG.                  (8)
   baked brick to replace solid concrete brick.
                                                                              The total revenues comprise the income from trading
                        M3 = ELC . CSB − ERBB,                        (5)   recycled products (RR ) on the construction materials market,
                                                                            the handling fees charged by the recycling plants to deal
   where ERBB is the emissions from producing recycled
                                                                            with the ESR (RS ), and the government's financial subsidies
   baked brick (including transportation and manufacturing
                                                                            for ESR disposal in recycling plants (SG ).
   stages).
                                                                                                                                  n
                        M4 = ELC . SCB − ERBB,                        (6)
                                                                                        EPtotal = EPA + EPR + EPS + EPE +        ∑ EPO.        (9)
                                                                                                                                 i=1
   where ELC . SCB refers to the total emissions of traditional
   solid concrete brick production (including mining, trans-                   Similarly, the total expenditures are divided into the
   portation, and manufacturing stages).                                    amortized cost of equipment (EPA ), renting plants (EPR ),
4) Interpretation. The aim of the interpretation is to sys-                 mechanical consumables (EPS ), energy consumption for re-
   tematically summarize the information from the assess-                   cycling (e.g., electricity, diesel, gasoline, and natural gas)
   ment results. As mentioned in the Study area and data                    (EPE ), and other costs (EPO ). Other costs can be divided into
   sources section, CO2 eq is adopted to assess GWP                         labor, maintenance of equipment, et cetera, where i refers
   value. Therefore, based on the CO2 mitigation results,                   to the categories of these other costs.
   we compare GWP among the different replacement                              Based on field investigation in recycling plants across China
   schemes.                                                                 (in 9 C&D waste and ESR recycling plants located in Shenzhen,
                                                                            Huizhou, Beijing, Zhengzhou, and Wuhan; these cities are
Economic analysis model
                                                                            distributed in various regions of China), economic and energy
  In the cost–benefit analysis (Eqns. 7–9), the recycling com-               data about ESR recycling lines are gathered. Recycling tech-
pany is selected from among multiple stakeholders for the                   niques vary according to the cities' different development
present analysis, and the revenue from ESR trade and ex-                    levels. The collected data come from these large cities be-
penditure in structuring recycling plants are considered, using             cause this type of recycling behavior occurs only in large cities
data derived from field investigation of ESR recycling plants in             with policy and financial support. The figures for the recycled
2017. Because the financial data come from a specific re-                     baking‐free brick producing stage are shown in Tables 4 and 5
cycling plant that makes recycled pressed bricks, the eco-                  and were mostly provided by the manufacturers.
nomic analysis takes this project (using recycled baking‐free
bricks to replace traditional clay solid bricks) as an example.             RESULTS AND CURRENT STATUS ANALYSIS
                        NP = Rtotal − EPtotal .                       (7)   Excavated soil and rock recycling network
  The net proceeds (NP ) of the ESR recycling project are                     After a series of field investigations in ESR and C&D waste
shown in Equation 7. It can be expressed as the difference in               recycling plants in China, we found that ESR can generally

Integr Environ Assess Manag 2021:639–650                     DOI: 10.1002/ieam.4376                                             © 2020 The Authors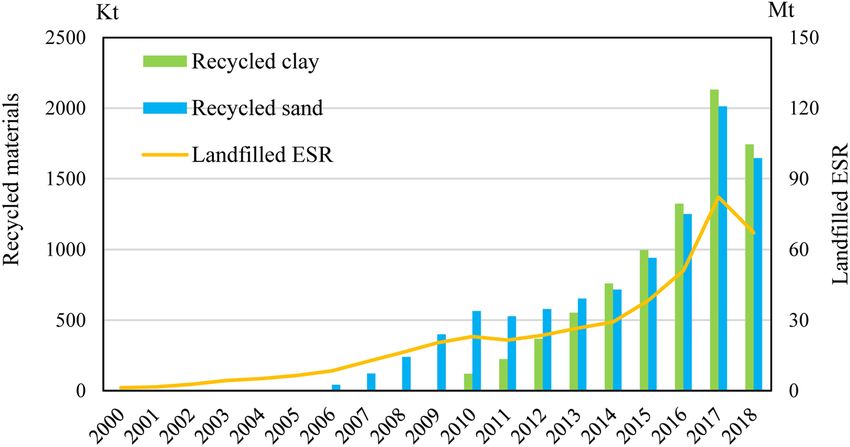
644                                                                                        Integr Environ Assess Manag 17, 2021—N Zhang et al.

                                    Table 4. Equipment information for ESR recycling toward baking‐free bricks

 Technical data (unit)                                                                  Equipment information
 Equipment                                        Impact crusher                        Screening machine                     Forming machine

 Number of machines                                          1                                     1                                  1

 Operating power (kW)                                    328                                       97                               242

 Fuel consumption (L/h)                                51.96                                   15.36                                37.27

ESR = excavated soil and rock.

be recycled into different building materials based on its                      proportional to the total generation of ESR, the change
composition. Unlike C&D waste, ESR or its components                            trends for recycling and landfilling are almost the same as
generally include sand, gravel of various sizes, and soil                       with generation. Although the recycling rate is increasing,
(Priyadharshini et al. 2017); these are mainly inert materials                  the landfill rate for ESR in China has exceeded 90% in recent
(Duan et al. 2016) and easier to recycle. Figure 2 shows a                      years. As shown in Figure 4, although sand and clay are the
general process of recycling ESR; typically, from ESR to re-                    2 main recycled materials (accounting for approximately
cycled materials, 3 processes need to be done. Sand and                         60% of total recycled ESR), the amount of recycled ESR is
gravel in the ESR are the first step, going through the                          considerably lower than that landfilled under the present
crushing and screening system to produce recycled sand.                         situation. From 2000 to 2018, accumulated recycled mate-
The mixing system and molding maintenance system are                            rials were only 18 million tonnes (Mt) (comprising sand 10 Mt
further steps to convert ESR into building materials, mainly                    and clay 8 Mt), whereas approximately 442 Mt of accumu-
recycled bricks.                                                                lated ESR was still transferred to landfills. Recently, scholars
   As shown in Figure 3, nationwide ESR typically consists of                   have found that natural sand is a scarce resource that is hard
4 main components: sand, clay, miscellaneous fill, and stone                     to get, and it is currently necessary to find replacement
(see Figure S2 in Supplemental Data). The sand and clay are                     materials and reuse sand (UNEP 2014; Bendixen et al. 2019).
the main targets of recycling. Usually, sand of different sizes                 In addition, according to a field survey in China, obtaining
can be screened out in the first step of the sand washing                        natural sand is much more difficult than using recycled sand
process, which can be carried out on the construction site.                     because current environment protection policies only allow
The remaining clay is pressed into mud cakes and sent to                        a small amount of natural sand to be mined (NDRC 2020).
recycling plants for further recycling.
                                                                                CO2 mitigation potential. As might be expected, the GWP
                                                                                caused from per kg (tonne) ESR recycling is less than that from
Comparison of different recycling methods
                                                                                landfilling. One of the reasons is that only a small amount of
The amount of recycled materials. Results from the primary                      ESR is recycled. The other reason is the reduction in trans-
analysis for material flows of ESR are depicted in Figure 4. In                  portation impacts. Figure 5 provides a more detailed view of
general, because the recycled and landfilled quantity is                         CO2 mitigation from different recycling methods. The results

                                 Table 5. Data for variables used in Equations 7 to 9 for economic analysis in 2017

 Technical data (unit)                                                           Equipment information                                      Total
 Equipment                                          Impact crusher                Screening machine             Forming machine              —

 Oil cost (US$/kt soila)                                     148                          44                         106                    298

 Dedusting cost (US$/kt soil)                                    6                        —                            4                     10

 Consumable cost (US$/kt soil)                               86                           19                          59                    164

 Maintenance cost (US$/kt soil)                              12                            9                          10                     31

 Labor costb (US$/kt soil)                                   12                           —                           —                      12

 Other cost (US$/kt soil)                                    15                           15                          15                     45

 Amortized equipment (US$/kt soil)                           112                          48                          59                    219
                                                                                                                      2
 Plant rent (US$/kt soil)                                    According to the lease price of plant in suburb, US$2.17/m ·mo                 1160

 Total cost (US$/kt soil)                                    778                         521                         640                    1939

ESR = excavated soil and rock; kt = kiloton.
a
  Soil means the clay component in ESR.
b
  The labor cost is a mixture of labor and overhead costs.

Integr Environ Assess Manag 2021:639–650                     wileyonlinelibrary.com/journal/ieam                              © 2020 The Authors
Waste Management via Life Cycle Assessment—Integr Environ Assess Manag 17, 2021 645
Figure 2. Schematic flowchart of recycling ESR. ESR = excavated soil and rock.
were obtained by carrying out Monte Carlo simulations. Error In Figure 5B, there are 4 material replacement schemes.
bars indicate 95% confidence limits with 20 000 times calcu- Using ESR to screen out recycled sand and replace natural
lations generated by Monte Carlo simulations (assuming the sand achieves only a small CO2 mitigation efficiency. How-
parameters present normal distributions). ever, when sand screening is followed by further recycling,
significant CO2 mitigation could be achieved. In addition,
per brick CO2 emissions from baking are much higher than
from pressing, therefore, recycled baking‐free bricks re-
placing traditional clay solid bricks contributes the most
mitigation, approximately 1.5 Mt CO2 eq cumulatively
between 2010 and 2018.
The results in Figure 5A show that recycling ESR can
achieve a “double emission reduction” effect. The CO2
mitigation from recycling and avoided emissions from
landfilling have significant potential in reducing GWP.
Landfilling would result in 30 kg CO2 eq per tonne of
landfilled ESR, in comparison with GWP reduction of
42 (37–48) kg CO2 eq per tonne of recycled ESR (producing
recycled sand and different types of recycled brick). Dif-
ferent types of recycled materials and their replacement
schemes have CO2 mitigation gaps. These differences can
be explained mainly by 1) different recycling methods with
different mechanical equipment, resulting in differences in
energy consumption (e.g., machines that use gasoline
have lower emissions than those that use diesel, 0.56 kg CO2
eq/kg gasoline and 0.49 kg CO2 eq/kg diesel in China, data
from GaBi database) (Sphera 2018); and 2) the new material
being replaced has different emission factors (e.g., 0.18 kg
Figure 3. Primary and secondary components of ESR in China (national average
value based on regional data from Zhang, Duan, Sun et al. 2020). ESR = CO2 eq/kg for clay solid brick, 0.03 kg CO2 eq/kg for natural
excavated soil and rock. sand in China, data from GaBi database) (Sphera 2018).
Integr Environ Assess Manag 2021:639–650 DOI: 10.1002/ieam.4376 © 2020 The Authors646 Integr Environ Assess Manag 17, 2021—N Zhang et al.
Figure 4. The present situation of ESR recycling in China. ESR = excavated soil and rock.
Economic benefits analysis. With the increasing trend of companies in China in the same year (NBSC 2018). In 2018,
recycling ESR and C&D waste in China, the market for re- net proceeds follow the downtrend of recycling volume
cycled building materials has substantial potential economic ($18.7 million). High government subsidies and an increas-
value (Zhao et al. 2010). Based on generation and recycling ingly favorable environment for trading recycled building
amounts of ESR in China, Figure 6 shows the estimation of products results in consistent revenue for ESR recycling
economic benefits and costs if recycling plants take ESR to plants. In terms of the cost of recycling ESR, plant rent and
produce recycled baking‐free bricks. the costs of purchasing equipment are the main expenses.
As shown in Figure 6, recycling ESR could have produced Because much ESR is generated in urban areas, from the
ever‐increasing net proceeds between 2006 and 2017, perspective of convenient transportation, most recycling
reaching a sizable amount of US$22.8 million in 2017 and plants are in the suburbs around cities, and the leasing price
accounting for 8% of operating revenue of construction of factories is relatively high. However, due to the high
Figure 5. The CO2 mitigation of different ESR recycling plans. CO2 mitigation occurs in the process of recycling. As a reminder, due to the landfilling that can
be avoided by recycling, there might be potential avoided CO2 emissions caused by landfilling (30 kg CO2 eq/landfilling ESR). The legends refer to the material
replacement schemes; their full definitions are shown in Table 1. ESR = excavated soil and rock; RBB‐SCB = recycled baked brick–solid concrete brick;
RBFB‐CSB = recycled baking‐free brick–clay solid brick; RBB‐SCB = recycled baked brick–solid concrete brick; RS‐NS = recycled sand–natural sand.
Integr Environ Assess Manag 2021:639–650 wileyonlinelibrary.com/journal/ieam © 2020 The AuthorsWaste Management via Life Cycle Assessment—Integr Environ Assess Manag 17, 2021 647
Figure 6. The economic analysis of ESR recycling (taking producing recycled sand and baking‐free bricks as an example). ESR = excavated soil and rock.
degree of automation of mechanical equipment, the tradi- results illustrate that governments across the world need
tional phenomenon of high labor costs is not significant in to be a driving force for sustainable development in the
the ESR and C&D waste recycling industry (Shan et al. 2011). construction sector.
In the near future, ESR management will no longer be so
DISCUSSION AND OUTLOOK limited, and secondary resources, ranging from clay and
Landfilling of ESR is a widespread phenomenon across sand to stone, should be considered comprehensively. In
China, which carries a range of negative environmental terms of economy, economic decision making based on
consequences (Leite et al. 2011). Recycling ESR can sig- multiple criteria analysis could also be a follow‐up direction
nificantly reduce the impact of landfilling on urban land for this research. At present, much research has been con-
occupation, geological damage, and landslide and collapse ducted into technological innovation (Lu and Tam 2013;
risk (Duan et al. 2019). Also, the results of the present study Ajayi et al. 2017) while ignoring the importance of man-
illustrate that recycling ESR could reduce GWP and meet the agement. As Magnusson et al. (2015) argued, ESR usually
targets in China's 13th Five‐Year Plan: CO2 emissions to be lacks sustainable management, and there is a need to
18% below the 2015 level by 2020 (SCC 2016). Based on evaluate the potential for increased use of ESR. Carrying out
estimation, the cumulative mitigation between 2010 and such research can provide more evidence to better under-
2018 would be equivalent to Kenya's CO2 emissions by the stand and effectively implement C&D waste management
coal combustion sector in 2018 (IEA 2019). More im- and ESR recycling.
portantly, the analysis of GWP based on different ESR re-
cycling plans provides multiple alternative pathways for
stakeholders to dispose of ESR. CONCLUSION
Economic analysis from the perspective of recycling The present study applied the LCC and environmental
companies is included in the present article, but further assessment method to assess the relative economic feasi-
taking construction companies, government, and other bility and CO2 emissions intensity of different recycling
stakeholders into consideration can make up for this 1‐sided plans for 2 main ESR material flows (sand and clay) in China.
result and better justify economic investment and benefits Overall results show that for large emerging countries,
across the whole recycling chain. Furthermore, it is worth enormous GWP is caused by the landfilling of construction‐
noting that the composition of ESR is not complicated, but generated ESR, and proper use of recycling is an economic
the current recycling rate and recycling type are both at low and environmentally friendly management strategy. This
levels in China; expanding the scope of recycling and in- regionalized case research in China also offers a methodo-
creasing the recycling rate may remove impediments logical basis for the transfer of research to other regions.
to potential economic and environmental benefits. Regarding the composition of ESR, sand and clay are the
Compared with the increasingly mature recycling tech- typical recycled materials in China. The present study find-
nology, it is important to improve the waste management ings show that accumulated recycling of ESR could have
level in China. Theoretical studies have shown that policy reached 20 Mt from 2006 to 2018 (ESR recycling began
making for landfill restrictions, recycling incentives, and tax to be promoted in 2006) (Zhang, Duan, Sun et al. 2020).
breaks can greatly influence the management of C&D waste Recycled sand (6.7 Mt) and clay (5.5 Mt) account for 60% of
and ESR (Ajayi and Oyedele 2017). Generally, government the total recycled ESR nationwide, and the remaining re-
control through legislation can increase sustainability in the cycled materials include some localized materials, such as
building materials sector (Kylili and Fokaides 2017). These coal and mucky soil.
Integr Environ Assess Manag 2021:639–650 DOI: 10.1002/ieam.4376 © 2020 The Authors648 Integr Environ Assess Manag 17, 2021—N Zhang et al.
Taking the example of producing recycled baking‐free Table S.6. The length of subway lines in China from 2012
bricks, recycling ESR can also contribute at least about to 2017 (Northwest China) (km)
$110 million to the national economy. Given present trends, Table S.7. The length of subway lines in China from 2012
this figure may further increase in future years. This finding, to 2017 (Northeast China) (km)
in particular, would be beneficial to stimulate the interest of Table S.8. The subway‐related ESR generation in China
recyclers. 1965–2018 (thousand m3)
In terms of environmental analysis, in the general process, Table S.9. Distribution of subway‐related ESR across
screening sand is the first step. Clay recycling shows sig- China (North China) (thousand m3)
nificant GWP mitigation; the GWP avoidance could reach Table S.10. Distribution of subway‐related ESR across
37 to 48 kg CO2 eq per tonne of recycled ESR, and com- China (East China) (thousand m3)
prehensive recycling of ESR per tonne can reduce the value Table S.11. Distribution of subway‐related ESR across
of GWP by 140% when compared to landfilling per tonne. China (South China) (thousand m3)
The results of the economic and environment analysis show Table S.12. Distribution of subway‐related ESR across
that using recycled baking‐free bricks to replace solid clay China (Middle China) (thousand m3)
bricks is profitable and can lead to maximal CO2 mitigation. Table S.13. Distribution of subway‐related ESR across
At the EoL stage of ESR, recycling should be supported China (Northwest China) (thousand m3)
by stakeholders. For construction companies, transporting Table S.14. Distribution of subway‐related ESR across
ESR to recycling plants in suburbs closer to city areas can China (Southwest China) (thousand m3)
save dramatic transportation and labor costs. For recyclers Table S.15. Distribution of subway‐related ESR across
and recycling plants, trade in recycled building materials China (Northeast China) (thousand m3)
(e.g., recycled sand and recycled baking‐free bricks) can Table S.16. Composition of subway‐related ESR in China
earn considerable profits. For local authorities, making (South China)
policies encouraging that ESR be recycled is an essential Table S.17. Composition of subway‐related ESR in China
point at present. It is also necessary to provide suburban (North China)
land to build recycling plants at a lower price. Finally, large‐ Table S.18. Composition of subway‐related ESR in China
scale recycled building materials markets for local ESR (Northeast China)
recyclers and material buyers must be established and Table S.19. Composition of subway‐related ESR in China
managed. By doing so, the sustainable and healthy (Northwest China)
management of ESR can be achieved in the near future. Table S.20. Composition of subway‐related ESR in China
Acknowledgment—The authors declare no conflicts of (Southwest China)
interest. There is no funding for this research. We would also Table S.21. Composition of subway‐related ESR in China
like to thank Karin Hosking for proofreading and editors and (Central China)
reviewers for their comments to improve this paper. Open Table S.22. Composition of subway‐related ESR in China
access funding enabled and organized by Projekt DEAL. (East China)
Data Availability Statement—Supplemental Data for this Table S.23. The landfilled ESR and recycled sand and clay
manuscript are available. Requests for further data are in China 2000–2018 (thousand tonnes)
available upon request from author Ning Zhang (n.zhang@
ioer.de). ORCID
Ning Zhang http://orcid.org/0000-0002-1563-1417
SUPPLEMENTAL DATA REFERENCES
Figure S1. China's urban built‐up area and urbanization Ajayi SO, Oyedele LO. 2017. Policy imperatives for diverting construction
rate growth trend. waste from landfill: Experts' recommendations for UK policy expansion.
J Cleaner Prod 147:57–65.
Figure S2. Composition of subway‐related ESR in China
Ajayi SO, Oyedele LO, Bilal M, Akinade OO, Alaka HA, Owolabi HA. 2017.
in 2018. Critical management practices influencing on‐site waste minimization in
Figure S3. Forecasting subway‐related ESR generation in construction projects. Waste Manage 59:330–339.
China. Arm M, Wik O, Engelsen CJ, Erlandsson M, Hjelmar O, Wahlström M.
Table S.1. The length of subway lines in China from 2012 2017. How does the European recovery target for construction & dem-
olition waste affect resource management? Waste Biomass Valori 8:
to 2017 (South China) (km)
1491–1504.
Table S.2. The length of subway lines in China from 2012 Bailey G, Joyce PJ, Schrijvers D, Schulze R, Sylvestre AM, Sprecher B, Van,
to 2017 (East China) (km) Acker K. 2020. Review and new life cycle assessment for rare earth
Table S.3. The length of subway lines in China from 2012 production from bastnäsite, ion adsorption clays and lateritic monazite.
to 2017 (Middle China) (km) Resour Conserv Recycl 155:104675.
Bendixen M, Best J, Hackney C, Iversen LL. 2019. Time is running out for
Table S.4. The length of subway lines in China from 2012
sand. Nature 571:29–31.
to 2017 (Southwest China) km)
Coelho A, Brito DJ. 2013. Economic viability analysis of a construction and
Table S.5. The length of subway lines in China from 2012 demolition waste recycling plant in Portugal–Part I: Location, materials,
to 2017 (North China) (km) technology and economic analysis. J Cleaner Prod 39:338–352.
Integr Environ Assess Manag 2021:639–650 wileyonlinelibrary.com/journal/ieam © 2020 The AuthorsWaste Management via Life Cycle Assessment—Integr Environ Assess Manag 17, 2021 649
Deviatkin I, Lyu L, Chen S, Havukainen J, Wang F, Horttanainen M, Magnusson S, Lundberg K, Svedberg B, Knutsson S. 2015. Sustainable
Mänttäri M. 2019. Technical implications and global warming potential of management of excavated soil and rock in urban areas—A literature
recovering nitrogen released during continuous thermal drying of sewage review. J Cleaner Prod 93:18–25.
sludge. Waste Manage 90:132–140. Marzouk M, Azab S. 2014. Environmental and economic impact assessment
Duan H, Miller TR, Liu G, Tam VWY. 2019. Construction debris becomes of construction and demolition waste disposal using system dynamics.
growing concerns of growing cities. Waste Manage 83:1–5. Resour Conserv Recycl 82:41–49.
Duan H, Yu D, Zuo J, Yang B, Zhang Y, Niu Y. 2016. Characterization of McNeil K, Kang THK. 2013. Recycled concrete aggregates: A review. Int J
brominated flame retardants in construction and demolition waste com- Concr Struct Mater 7:61–69.
ponents: HBCD and PBDEs. Sci Total Environ 572:77–85. Muñoz I, Cifrian E, Andrés A, San Miguel G, Ruiz D, Viguri JR. 2018. Analysis
Eras JJC, Gutiérrez AS, Capote DH, Hens L, Vandecasteele C. 2013. of environmental benefits associated with the incorporation of Waelz slag
Improving the environmental performance of an earthwork project using into fired bricks using LCA. Constr Build Mater 168:178–186.
cleaner production strategies. J Cleaner Prod 47:368–376. [NBSC] National Bureau of Statistics of China. 2018. China statistical
Esa MR, Halog A, Rigamonti L. 2017. Developing strategies for managing yearbook (2018). Beijing (CN): China Statistics Pr. 943 p.
construction and demolition wastes in Malaysia based on the concept of [NDRC] National Development and Reform Commission (China). 2020.
circular economy. J Mater Cycles Waste Manage 19:1144–1154. Guiding opinions on promoting the healthy and orderly development of
Galán B, Viguri JR, Cifrian E, Dosal E, Andres A. 2019. Influence of input the sand and gravel industry. Beijing (CN). 8 p.
streams on the construction and demolition waste (CDW) recycling per- Ortiz O, Pasqualino JC, Castells F. 2010. Environmental performance of
formance of basic and advanced treatment plants. J Cleaner Prod construction waste: Comparing three scenarios from a case study in
236:117523. Catalonia, Spain. Waste Manage 30:646–654.
Guinée J. 2001. Handbook on life cycle assessment—Operational guide to Paes MX, Medeiros GA, Mancini SD, Bortoleto AP, Oliveira JAP, Kulay LA.
the ISO standards. Int J Life Cycle Assess 6:255. 2019. Municipal solid waste management: Integrated analysis of
Han F, Xie R, Lai M. 2018. Traffic density, congestion externalities, and environmental and economic indicators based on life cycle assessment.
urbanization in China. Spat Econ Anal 13:400–421. J Cleaner Prod 119848.
Huang T, Shi F, Tanikawa H, Fei J, Han J. 2013. Materials demand and Priyadharshini P, Ramamurthy K, Robinson RG. 2017. Excavated soil waste as
environmental impact of buildings construction and demolition in fine aggregate in fly ash based geopolymer mortar. Appl Clay Sci
China based on dynamic material flow analysis. Resour Conserv Recycl 146:81–91.
72:91–101. [SAC] Standardization Administration of the People's Republic of China.
[IEA] International Energy Agency. 2019. CO2 Emissions from fuel combus-
2007. GB/T 21144–2007 National Standard of solid concrete brick. Beijing
tion 2019. Paris (FR). 514 p.
(CN). 16 p.
[IKE] IKE Environmental Technology Co., Ltd. 2012. Chinese Life Cycle
[SAC] Standardization Administration of the People's Republic of China.
Database (CLCD). Chengdu (CN).
2011. GB/T 14684–2011 National Standard of sand for construction.
[IPCC] Intergovernmental Panel on Climate Change. 2007. Changes in
Beijing (CN). 32 p.
atmospheric constituents and in radiative forcing. In: Solomon S, Qin D,
[SAC] Standardization Administration of the People's Republic of China.
Manning M, Chen Z, Marquis M, Averyt KB, Tignor M, Miller HL, editors.
2017. GB/T 5101–2017 National Standard of fired common bricks.
IPCC Fourth Assessment Report. Cambridge (UK): Cambridge Univ Pr.
Beijing (CN). 14 p.
106 p.
Sáez PV, Merino MR, Porras‐Amores C, González ASA. 2014. Assessing the
[ISO] International Standards Organization. 2006. ISO 14044 Environmental
accumulation of construction waste generation during residential building
management—Life cycle assessment—Requirements and guidelines.
construction works. Resour Conserv Recycl 93:67–74.
Geneva (CH). 46 p.
[SCC] State Council of China. 2016. Notice of the State Council on issuing the
Jalaei F, Zoghi M, Khoshand A. 2019. Life cycle environmental impact
work plan for greenhouse gas emission control during the 13th five‐year
assessment to manage and optimize construction waste using Building
plan period. Beijing (CN). 9 p.
Information Modeling (BIM). Int J Constr Manage 1–18. https://doi.org/10.
Shan Y, Goodrum PM, Zhai D, Haas C, Caldas CH. 2011. The impact of
1080/15623599.2019.1583850
Jin F, Chen Z. 2019. Evolution of transportation in China since reform and management practices on mechanical construction productivity. Constr
opening up: Patterns and principles. J Geogr Sci 29:1731–1757. Manage Econ 29:305–316.
Kong X, Xu Z, Shen G, Wang J, Yang Q, Zhang B. 2016. Urban traffic con- Simion IM, Fortuna ME, Bonoli A, Gavrilescu M. 2013. Comparing envi-
gestion estimation and prediction based on floating car trajectory data. ronmental impacts of natural inert and recycled construction and dem-
Future Gener Comput Syst 61:97–107. olition waste processing using LCA. J Environ Eng Landsc Manag 21:
Kylili A, Fokaides PA. 2017. Policy trends for the sustainability assessment of 273–287.
construction materials: A review. Sustain Cities Soc 35:280–288. [Sphera] Sphera Solutions GmbH. 2018. GaBi Software‐System and Data-
Lausselet C, Cherubini F, del Alamo Serrano G, Becidan M, Strømman AH. bases for Life Cycle Engineering. Stuttgart (DE).
2016. Life‐cycle assessment of a waste‐to‐energy plant in central Norway: Sun B, He Z, Zhang T, Wang R. 2016. Urban spatial structure and commute
Current situation and effects of changes in waste fraction composition. duration: An empirical study of China. Int J Sustain Transp 10:638–644.
Waste Manage 58:191–201. Tam VW. 2008. Economic comparison of concrete recycling: A case study
Lausselet C, Cherubini F, Oreggioni GD, del Alamo Serrano G, Becidan M, approach. Resour Conserv Recycl 52:821–828.
Hu X, Strømman AH. 2017. Norwegian waste‐to‐energy: Climate change, [UNEP] United Nations Environment Programme Globe Environmental Alert
circular economy and carbon capture and storage. Resour Conserv Recycl Service (GEAS). 2014. Sand, rarer than one thinks. Nairobi (KE). 15 p.
126:50–61. Vossberg C, Mason‐Jones K, Cohen B. 2014. An energetic life cycle assess-
Leite F, Motta R, Vasconcelos LK, Bernucci L. 2011. Laboratory evaluation of ment of C&D waste and container glass recycling in Cape Town, South
recycled construction and demolition waste for pavements. Constr Build Africa. Resour Conserv Recycl 88:39–49.
Mater 25:2972–2979. Wei YD, Li H, Yue W. 2017. Urban land expansion and regional inequality in
Lu W, Tam VW. 2013. Construction waste management policies and their transitional China. Landscape Urban Plann 163:17–31.
effectiveness in Hong Kong: A longitudinal review. Renewable Sustain- Wu Z, Ann TW, Shen L, Liu G. 2014. Quantifying construction and demolition
able Energy Rev 23:214–223. waste: An analytical review. Waste Manage 34:1683–1692.
Lu W, Webster C, Chen K, Zhang X, Chen X. 2017. Computational building Yeheyis M, Hewage K, Alam MS, Eskicioglu C, Sadiq R. 2013. An overview of
information modelling for construction waste management: Moving from construction and demolition waste management in Canada: A lifecycle
rhetoric to reality. Renewable Sustainable Energy Rev 68:587–595. analysis approach to sustainability. Clean Technol Environ Policy 15:81–91.
Integr Environ Assess Manag 2021:639–650 DOI: 10.1002/ieam.4376 © 2020 The Authors650 Integr Environ Assess Manag 17, 2021—N Zhang et al. Zhang N, Duan H, Miller TR, Tam VW, Liu G, Zuo J. 2020. Mitigation of Zhang Y, Zheng S, Sun C, Wang R. 2017. Does subway proximity discourage carbon dioxide by accelerated sequestration in concrete debris. Renew- automobility? Evidence from Beijing. Transp Res Part D: Transp Environ able Sustainable Energy Rev 117:109495. 52:506–517. Zhang N, Duan H, Sun P, Li J, Zuo J, Mao R, Liu G, Niu Y. 2020. Characterizing Zhao W, Leeftink RB, Rotter VS. 2010. Evaluation of the economic the generation and environmental impacts of subway‐related excavated feasibility for the recycling of construction and demolition waste soil and rock in China. J Cleaner Prod 119242. in China—The case of Chongqing. Resour Conserv Recycl 54: Zhang N, Zheng L, Duan H, Yin F, Li J, Niu Y. 2019. Differences of methods to 377–389. quantify construction and demolition waste for less‐developed but fast‐ Zheng L, Wu H, Zhang H, Duan H, Wang J, Jiang W, Song Q. 2017. Char- growing countries: China as a case study. Environ Sci Pollut Res acterizing the generation and flows of construction and demolition waste 26:25513–25525. in China. Constr Build Mater 136:405–413. Integr Environ Assess Manag 2021:639–650 wileyonlinelibrary.com/journal/ieam © 2020 The Authors
You can also read