Every breath you take. Every freight you make: environmental pollution index for road transportation
←
→
Page content transcription
If your browser does not render page correctly, please read the page content below
CASE STUDY

Every breath you take. Every freight you make:
environmental pollution index for road
transportation
Luciana Oranges Cezarino1,2, Lorena Costa Baesse2, Adhemar Ronquim Filho3,4,
Marlos Rocha de Freitas2
1
    Ca' Foscari University of Venice, Department of Management, BLISS Digital Impact, Venice, Italy.
2
    Federal University of Uberlândia – UFU, School of Business and Management, Uberlândia, MG, Brazil.
3
    University of São Paulo – USP, School of Economics, Accounting and Management of Ribeirão Preto – FEA-RP, Ribeirão
    Preto, SP, Brazil.
4
    University of Araraquara – UNIARA, Department of Legal Sciences, Araraquara, SP, Brazil.

     How to cite: Cezarino, L.O., Baesse, L.C., Ronquim Filho, A. et al. (2022), “Every breath you take. Every
     freight you make: Environmental pollution index for road transportation”, Brazilian Journal of Operations &
     Production Management, Vol. 19, No. 1, e20221049. https://doi.org/10.14488/BJOPM.2021.038

     ABSTRACT
     Goal: This study analyzes the impacts of the transportation sector on air pollution within the
     scope of one major Brazilian metropolitan region.
     Design / Methodology / Approach: A literature review was conducted on the subject's
     constructs, with subsequent reasoning grounded on the fleet's characteristics and data
     obtained from in-depth interviews from a government transportation agency.
     Results: The results show Brazil's contextual evidence that risk management for the haulage
     sector should consider air pollution's negative impacts. With air quality standards as an
     essential reference, it is possible to observe that the city of Uberlândia does not effectively
     manage air quality.
     Limitations of investigation: One limitation of this research is related to the
     representativeness of the sample. The research also recommends future studies to use
     government policies for the improvement of the framework.
     Practical implications: The local and contextual addressing of air pollution and transport
     correlation in one focal point for cargo transportation at a national level pontentially
     contributes to environmental public policies.
     Originality / Value: Originality value resides in considering emissions from cargo vehicles as a
     significant factor in this process of air pollution in a specific context of a metropolitan area of
     an emerging economy that has its transportation modal grounded on trucking freight.

     Keywords: Environment; Air Pollution; Pollutant Emissions; Road transportation; Diesel Oil;
     Haulage.

INTRODUCTION
     The evolution of road transport, starting in the 1950s, occurred at an extremely rapid
pace in Brazil. Between 1945 and 1952, the number of trucks and buses in circulation
jumped from 103,000 to 265,000, a growth of more than 157% in just seven years (Institute
of Interamerican Affairs, 1954). In the 1960s, freight movement shift from railroads and
cabotage (coastal navigation) to highways. Since then, the roads were responsible for

Financial support: Minas Gerais Research Funding Foundation (Fapemig).
Conflict of interest: The authors have no conflict of interest to declare.
Corresponding author: luciana.cezarino@unive.it
Received: 22 July 2020.
Approved: 8 April 2021.
Editor: Julio Vieira Neto.

               This is an Open Access article distributed under the terms of the Creative Commons Attribution License, which permits unrestricted use,
               distribution, and reproduction in any medium, provided the original work is properly cited.

Brazilian Journal of Operations & Production Management, Vol. 19, No. 1, e20221049, 2022 | https://doi.org/10.14488/BJOPM.2021.038                       1/17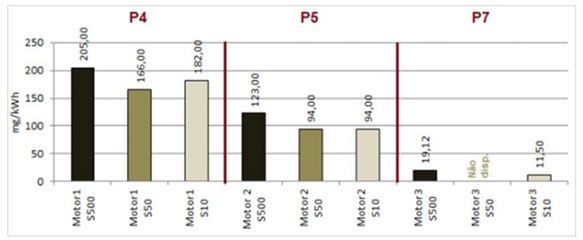
Every breath you take. Every freight you make: environmental pollution index for road transportation

about 73% of all freight movement in Brazil (Barat, 1978). A modern highway system would
be the fastest way to achieve its tremendous national objective of social, economic, and
political integration (Amann et al., 2016; Southworth et al., 2011; Galvão, 1996).
      From the business view, transportation is part of the logistics and distribution system.
The freight value is responsible for a large share of the product's total cost, affecting its
competitiveness (Coleti and Oliveira, 2019). The aim is to maximize the profit generated by
the services performed (Alvarez-Cruz et al., 2019). It imposes the need to improve the
choice of transport modal by companies, which depends, in turn, on the existence of viable
alternatives to be used (Catela and Seabra, 2017). Road freight transport is an important
activity for a country's economy. This is no different in Brazil (Martins et al., 2012): without
it, the other economic sectors' production would not be advantageous since the goods
produced could not reach their final consumers. This time, economic agents adobly need
the transportation sector for the proper development of their business.
      On the other hand, the economic growth fostered by fossil fuel transportation has
its side effects (Hao et al., 2018): the anthropogenic emissions of gases and particulates
tend to intensify progressively, leading to an increase in their concentration in the
atmosphere (Stern and Van Dijk, 2017). Some of these gases and particles have proven
effects on human health and the Environment, so they are considered “atmospheric
pollutants.” Among these, carbon monoxide (CO), hydrocarbons (HC), particulate matter
(PM), and nitrogen oxides (NO2) are highlighted (Santana et al., 2012). Air quality
degradation is an utmost threat to human health, especially in urban centers, and has
been associated with worsening of respiratory (Kim et al., 2018), cardiovascular
(Yang et al., 2019), and neurological diseases (Calderón-Garcidueñas et al., 2016),
especially in children and the elderly population. Studies also indicate the correlation
between exposure to some pollutants and the occurrence of different types of cancer
(World Health Organization, 2000; Gouveia et al., 2006; Brunekreef et al., 2012).
      The impacts of air pollution on ecosystems also deserve attention. The deposition of
air pollutants in plants can lead to a reduction in their photosynthesis capacity, leading to,
for example, a problem in agricultural productivity. Acidification of rainwater and dust
contaminating water resources, aquatic biomes, and the soil is also a consequence of the
anthropic introduction of pollutants into the atmosphere (Santana et al., 2012). People's
health is linked to the degree of air pollution, which is influenced by means of transport.
      At the international level, this was the trigger for one of the most legitimacy damaging
scandals in recent years: the V.W. Emissions scandal (Cavico and Mujtaba, 2016).
      Thus, the present study aims to contribute to this discussion and analyze air
pollution characteristics under the lens of the freight transportation industry in the
Brazilian city of Uberlandia, quantifying the primary atmospheric pollutants to advance
in this region's emissions studies and public policy implementation.

LITERATURE OVERVIEW

Air pollution and road transportation
     CO2 is the primary GHG both in the world and in Brazil. The most significant share
among the six gases responsible for climate change and tackling carbon dioxide
emissions is considered the foremost sustainable development goal (Rüstemoğlu and
Andrés, 2016). In a longitudinal study from 1992 to 2011, the economic activity
responsible for most of the Brazilian CO2 emissions was transportation (42% - 44%)
(Rüstemoğlu and Andrés, 2016) while many automobiles run on biodiesel local
alternatives like alcohol blend fuels (Vieira et al., 2018), the Brazilian buses and trucks
mostly run on Diesel Oil. In Brazil, road transportation is the main modal of a deeply
asymmetric matrix for product logistics: the truck fleet is old and energy inefficient
(Galbieri et al., 2017), yet trucking freight transport is responsible for 60% of diesel-oil
consumption (Empresa de Pesquisa Energética, 2015). In the last century, this

Brazilian Journal of Operations & Production Management, Vol. 19, No. 1, e20221049, 2022               2/17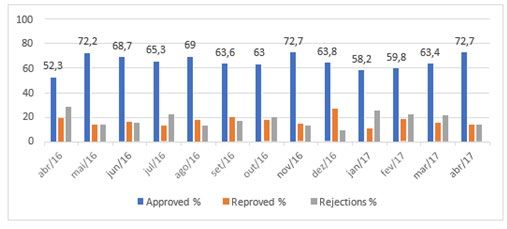
Every breath you take. Every freight you make: environmental pollution index for road transportation

centralization has not undergone any significant advance regarding environmental
issues, consequently impacting the Brazilian Environment and population well-being.
     Air pollution impacts are transboundary (Zhang et al., 2017), and its effects are felt
by the population and impact social and economic activities, biota, sanitary conditions
(Brasil, 1981). A large fleet contributes widely to numbers of lethality both in Brazil and
in other countries. WHO captured in 2014 close to four million deaths from air pollution,
especially in developing countries (Chiquetto, 2019). It is a latent public health problem,
which in addition to the number of deaths, causes respiratory, cardiovascular diseases,
cancer, and other complications related to pregnancy and children (Cepeda et al., 2017).
The fact that Brazil bet on road freight transport at the expense of more significant
investment in air, waterway, and rail modals, as it is showed in Table 1, compared to
other countries contributes to the number reproduced above. Due to its complexity,
road transport consumes oil in considerable amounts, which increases air pollution.

Table 1 – Brazilian cargo transport matrix

                                               TKU (tons per useful
                 Type                                                                        PERCENTAGE
                                                   kilometer)
                 Road                                  485.625                                  61,1%
                 Rail                                  164.809                                  20,7%
             AQUAVIARY                                 108.000                                  13,6%
              PIPELINE                                  33.300                                   4,2%
                  Air                                    3.169                                   0,4%
                TOTAL                             794,903 (million)                              100%
Source: Colavite and Konishi (2015).

     This cargo flow through the road modal represents Brazil's economic scenario:
integrating large, medium, and small companies, the transport industry can generate
work for larger shares of the active population. With the increase in road transport of
cargo, the supply chain remains dependent, being a relevant cause of air pollution
(table 2), which creates a multidimensional challenge for the reduction of pollutants,
aiming at new energy sources (i.e., the gradual replacement of diesel) without hindering
the country's significant economic industry.

Table 2 – Carbon Dioxide Emissions distribution

                           Type                                  Emission Of Carbon Dioxide Per Modal In %
                           Road                                                        86%
                           Rail                                                         7%
            Cabotage (Coastal Navigation)                                               5%
                        Waterway                                                        2%
Source: EPL (Plano Nacional de Logística, 2016)

      Regarding the regulation of the dangerous cargo to the Environment, there was the
publication of Resolution No. 5,232/2016, the Brazilian National Agency of Land
Transportation (ANTT) which, to discourage less caution by operators, imposed
obligations, and, as non-compliance, and can generate confiscation of products and
fines, among other sanctions. The standard does not care about penalties and the
approval of values, but to stimulate environmental responsibility and minimize pollution
and possible disasters on the environment.
      One decarbonization pathway among a plethora of alternatives is the electrification
of road transport (Nicolaides et al., 2017), reducing dependence on oil and the
proliferation of air pollution (Weiss et al., 2015). Many success cases exist in countries like
Canada (Bahn et al., 2013) and United States (Talebian et al., 2018). This approach tends to
make the industry more renewable-resource centered and efficient energy (Frey, 2018).

Brazilian Journal of Operations & Production Management, Vol. 19, No. 1, e20221049, 2022                     3/17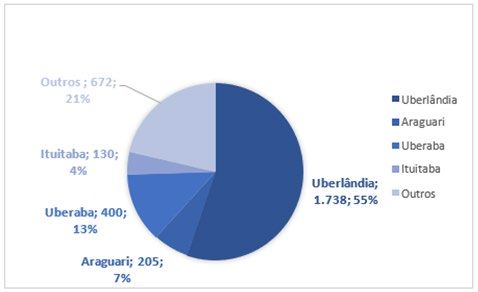
Every breath you take. Every freight you make: environmental pollution index for road transportation

     Air pollution from modal transport is transfigured as an externality of this activity,
bringing costs to direct non-users (Castro, 2013). The Air Pollution Control Program for
Motor Vehicles (PROCONVE), established in 1986, promotes national technological
development, both in automotive engineering, as well as in methods and equipment for
tests and measurements of pollutant emissions and the improvement of the technical
characteristics of liquid fuels, made available to the national fleet of motor vehicles
(Brasil, 1986). Until the program's creation, there were no guidelines for the emission of
road transport pollutant gases; the program established stricter parameters for control
of emissions and attributed supervision responsibilities to environmental authorities.
     As possible improvements in the framework, evaluate, and quantify the potential of
CO2 mitigation in road transport of cargo stemming from the adoption of measures and
technologies to promote the reduction of fuel consumption (Bartholomeu et al., 2016).
Other potential measuring efforts to reduce consumption can be implemented from
investments by the truck manufacturer industry to develop technologies aimed at
increasing vehicle efficiency (Bartholomeu et al., 2016).

Focal interstate freight transportation: the context of the Brazilian “Triângulo
Mineiro.”
      The spatial distribution of transport logistics in the Brazilian territory has a predominance
of highways, mainly concentrated in the Center-South of the country (Instituto Brasileiro de
Geografia e Estatistica, 2014). According to the National Transportation Confederation (CNT),
61.1% of all freight transported in Brazil uses the road system, 21.0% railroads, 14% by
waterways, rivers, and seaport terminals, and only 0.4% by air. According to the government of
Minas Gerais state, the Triângulo Mineiro region is one of the most productive and promising
areas of the country due to agribusiness economic success. The Triângulo Mineiro represents
7% of the state's total exports, which alone accounts for 13.8% of Brazil's external sales, causing
an intense flow of freight transportation in the region. The main products exported in the
region are sugar, coffee, corn, soy, and its derivatives. Also significant is the production and
export of poultry, beef, and pork (Minas Gerais, 2018).
      The National Land Transport Agency (ANTT), the National Department of Transport
Infrastructure (DNIT), and the Minas Gerais and Goiás states highway concessionary company
(MGO) entered into an agreement transferring to the concessionaire the section of highway
BR-050 in the state of Minas Gerais (2018). From then on, MGO has had monthly traffic control
in this region. Section P4 (Araguari 2) and section P5 (Uberaba) are the sections that have access
to the city of Uberlandia, the municipality related to this research. In this way, it is possible to
calculate the average quantity of freight vehicles that pass through the city of Uberlandia per
month using BR-050. According to the traffic control of MGO, Figure 1 the average monthly
number of trucks passing through Araguari toll plaza (section P4) is 101,714 and through the
Uberaba toll plaza (section P5) 124,904 trucks.

         Figure 1 - Number of trucks per month - Traffic Control - MGO (Sections P4 and P5)
                              Source: Adapted from MGO (Minas Gerais, 2018)

Brazilian Journal of Operations & Production Management, Vol. 19, No. 1, e20221049, 2022               4/17
Every breath you take. Every freight you make: environmental pollution index for road transportation

Fleet description in Brazil
     According to National Land Transport Agency (ANTT), Brazil has 1,682,398 freight
vehicles, including cooperatives, companies, and self-employed, representing a total of
494,815 agents and organizations involved in cargo transportation presented in Table 3.

Table 3 - Freight transport vehicles in Brazil- ANTT

                                   Self- employed             Companies            Cooperatives         Total
   Registrations Issued                 380,825                 113,715                  275           494,815
          Vehicles                      564,404                1,095,122               22,872          1,682,398
Source: ANTT (Agência Nacional de Transportes Terrestres, 2017)

      A large number of self-employed is due to the custom that companies have to
aggregate their fleets with vehicles owned by third parties (self-employed truck drivers).
All that is needed is to comply with some contractual requirements and formalities, and
the self- employed truck drivers start to transport the products under the companies'
responsibility, thus integrating the business activity (Brasil, 2017).
      According to the Triângulo Mineiro Transport Union (SETTRIM), in the Minas Gerais
Triangle Region, a total of 3,145 transporters, including self-employed, companies and
cooperatives, are cataloged. In the city of Uberlandia, 1,738 transporters are located,
which corresponds to 55% of the total (Sindicato das Empresas de Transporte de Cargas
do Triângulo Mineiro, 2017), as seen in Figure 2.

                            Figure 2 - Quantity of Transporters by Municipality
  Source: Adapted from SETTRIM (Sindicato das Empresas de Transporte de Cargas do Triângulo
                                        Mineiro, 2017)

     According to the data collected in Uberlandia, of the 1,738 transporters, only
80 companies and one cooperative carry out monitoring of emission of atmospheric
pollutants, which is carried out together with the Despoluir program and SETTRIM, using as
emission parameter limits the maximum levels found in CONAMA Resolution No. 418, of 25th
November 2009 (Sindicato das Empresas de Transporte de Cargas do Triângulo Mineiro, 2017).
     This research considered the transporters of Uberlandia that have been monitoring
atmospheric pollutants' emission as the target audience. A total of 81 transporters
(80 companies and one cooperative) were identified, comprehending 2,503 vehicles.
According to data collected for this research, in Uberlandia, only 31% of the cars have
engines with new technologies capable of using S10 Diesel, 69% are older than necessary
for S10 and use S500 diesel.
     S10 diesel is only used for new diesel engines manufactured from 2012, which have
new emission control technologies. S10 diesel enables the reduction of emissions of

Brazilian Journal of Operations & Production Management, Vol. 19, No. 1, e20221049, 2022                           5/17
Every breath you take. Every freight you make: environmental pollution index for road transportation
particulate matter up to 80% and of nitrogen oxides up to 98% (Petrobras, 2017). It is
currently estimated that Brazil has about 230 thousand trucks with more than 30 years
of use. These vehicles have outdated technology and pollute more than new trucks
(Brasil, 2017). One of the reasons for this is the use of S500 diesel that causes these
vehicles to have a higher atmospheric emissions rate.
Diesel oil in Brazil
According to the definition of the National Agency of Petroleum, Natural Gas
and Biofuels (Agência Nacional do Petróleo, Gás Natural e Biocombustíveis, 2017),
diesel is described as a petroleum-derived liquid fuel composed of hydrocarbons
with chains of 8 to 16 carbons, in addition to nitrogen, sulfur, and a lesser extent,
oxygen. Diesel oil, in its various denominations, is the primary fuel commercialized
in the Brazilian market and is mostly used in diesel-based engines of internal
combustion and compression ignition (Agência Nacional do Petróleo, Gás Natural e
Biocombustíveis, 2017).
Freight transportation in Brazil is mainly supported by vehicles powered by
diesel engines by road. Several types of diesel and respective applications are found
in the market; in the national territory, ANP establishes S10 and S500 diesel oil for
road use, S1800 diesel oil for non-road use, and marine diesel DMA/DMB for use by
marine vessels.
The pollutants emitted by diesel's combustion promote ecological problems
recognized worldwide, such as the destruction of the ozone layer, the increase of
global warming, and acid rain (Knothe et al., 2005). Diesel engines emit particulate
matter, black smoke and carry various carcinogenic compounds with a high impact
on human health and ecosystems (Correa and Arbilla, 2006).
The compounds of diesel engine emissions are classified into two forms: those
that do not cause damage to health, i.e., O2, CO2, H2O, and N2; and those that
provoke health problems, being subdivided into compounds that have emission
regulations, which are: carbon monoxide (C.O.), hydrocarbons (H.C.), nitrogen oxides
(NOX), sulfur oxides (SOx), and particulate matter (PM); and those that are not yet
under regulation, being aldehydes, ammonia, benzene, cyanides, toluene and
polynuclear aromatic hydrocarbons (PAH) (Neeft et al., 1996).
Diesel exhaust is complex, composed of three phases: solids, liquids, and gases
(Degobert, 1995). Operation under diesel engine oxidizing conditions at lower
temperatures can be compared with gasoline engines, with lower production of CO2,
NOX, CO, and hydrocarbons (H.C.). However, this process also results in high
emission levels of particulate matter (PM) and compounds responsible for the diesel
emission's odor characteristic, the latter emission being much worse during low
temperature operating conditions (Neeft et al., 1996).
Hydrocarbons from diesel emissions are generally heavier than those from
gasoline emissions; also, polycyclic aromatic hydrocarbons (PAH) and alkyl
derivatives thereof may be present in the diesel, thus resisting the combustion
process, volatilizing and escaping into the atmosphere by exhaustion (Scheepers and
Bos, 1992).
Diesel into the atmosphere: a public concern externality
Particulate matter
In 2011, Petrobras signed a cooperation agreement with the University of São Paulo
(Universidade de São Paulo - USP) and the Catholic University of Rio de Janeiro
(Universidade Católica do Rio de Janeiro - PUC-RJ) to study the influence of the primary
emitting sources on the formation of particulate matter (PM), especially PM2.5
Brazilian Journal of Operations & Production Management, Vol. 19, No. 1, e20221049, 2022 6/17Every breath you take. Every freight you make: environmental pollution index for road transportation
(particulate matter with a diameter of less than 2.5μm). This initiative was called the
“Sources Project” (Projeto Fontes).
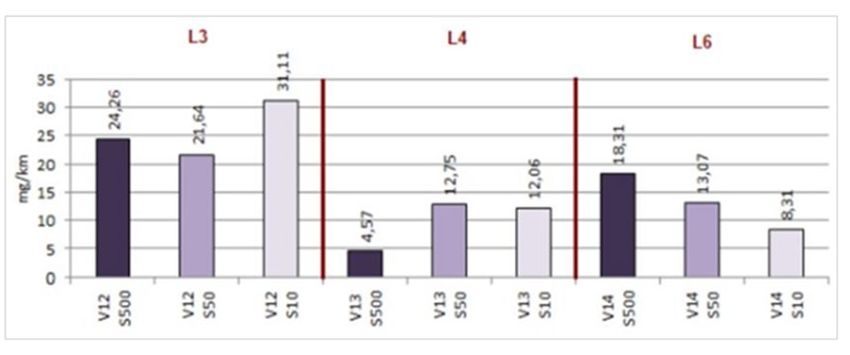
PM emission level in light diesel vehicles is much higher than that of Otto cycle vehicles
and motorcycles. For vehicles of previous phases (L3 and L4 of PROCONVE), there was no
evidence of a decrease in PM emission due to the reduction of the sulfur content of the fuel,
while in the more recent vehicles (L6), this was noticeable as showed by Figure 3.
Figure 3 - PM2.5 emission in heavy diesel cycle vehicles. Note: Emission factors for heavy diesel
cycle vehicles with S500, S50, and S10.
Source: Adapted from Projeto Fontes.
In heavy diesel engines, this influence is perceived when the diesel oil's sulfur
content was reduced to below 500 ppm, but it was not evident between the contents of
50 and 10 ppm. The numbers are presented in Figure 4.
Figure 4 - PM2.5 emission in heavy diesel cycle vehicles. Note: Emission factors for heavy diesel
cycle vehicles with S500, S50, and S10.
Source: Adapted from Projeto Fontes.
PROCONVE
Negative societal and environmental externalities caused by economic activities are
a matter of concern to private business but mostly to public agency, since the
stakeholder is affected on a broader scope. On 06th May 1986, CONAMA Resolution No.
18 created the Air Pollution Control Program for Automotive Vehicles (PROCONVE)
(Brasil, 1986), which defined the first emission limits for light vehicles, and contributes to
meeting the Air Quality Standards instituted by the National Air Quality Control Program.
Table 4 represents the implementation strategy for heavy vehicles.
Brazilian Journal of Operations & Production Management, Vol. 19, No. 1, e20221049, 2022 7/17Every breath you take. Every freight you make: environmental pollution index for road transportation
Table 4 - PROCONVE implementation strategy for heavy vehicles
Phase Implantation Feature / Innovation
In 1990, engines with lower emission levels were being produced than
those that would be required in 1993 (the year in which emission
P1 and P2 1990-1993 control for vehicles of this type began with the introduction of phases
P1 and P2. In that period, the limits for gas emissions (phase P1) and
particulate matter (phase P2) were not legally required.
The development of new engine models aimed at reducing fuel
consumption, increasing power, and reducing emissions of nitrogen
P3 1994-1997 oxides (NOx) through the adoption of intercooler and turbo engines.
There was a drastic reduction in CO (43%) and H.C. (50%) emissions in
this phase.
P4 1998-2002 It further reduced the limits created by Phase P3.
P5 2003-2008 It aimed to reduce emissions of particulate matter (PM), NOx, and H.C.
In January 2009, the start of phase P6 should have occurred,
according to CONAMA resolution 315/2002, whose main objective, as
P6 2009-2011
in phase 5, was to reduce emissions of particulate matter (PM), NOx,
and H.C.
Source: PROCONVE (Brasil, 2017)
Opacity
The Despoluir project, a national scheme to control atmospheric emissions by
automotive vehicles, is managed in Uberlandia by Triângulo Mineiro Transport Union
(SETTRIM). In this project, the diesel cycle vehicles are subjected only to the opacity test
that evaluates the amount of light that crosses a specific matter, classifying the opacity
of the emitted smoke (Sindicato das Empresas de Transporte de Cargas do Triângulo
Mineiro, 2017). The test is performed with an opacimeter device, which emits a beam of
light, thus measuring the light permeability in the exhaust smoke. The vehicle is
subjected to at least four accelerations to capture the smoke; this smoke is analyzed by
the opacimeter, which compares the result with the values referenced by the current
federal standard of CONAMA. Data obtained by the opacity test shows the average
number of vehicles inspected monthly is approximately 293, out of the total of 2,503, as
illustrated by Figure 5.
Figure 5 – Vehicles Inspected per Month
Source: Adapted from SETTRIM (Sindicato das Empresas de Transporte de Cargas do Triângulo
Mineiro, 2017)
Most of the vehicles were approved in the test, with an annual approval average of
approximately 65%, as represented by Figure 6.
Brazilian Journal of Operations & Production Management, Vol. 19, No. 1, e20221049, 2022 8/17Every breath you take. Every freight you make: environmental pollution index for road transportation
Figure 6 – Result of Opacity Test
Source: Adapted from SETTRIM (Sindicato das Empresas de Transporte de Cargas do Triângulo
Mineiro, 2017)
METHOD
A bibliographical review was carried to foster the study's reasoning and
support the main objective of developing an atmospheric pollution index using
data generated by the distribution of road transport in the city of Uberlandia. The
purpose of the review was the need for information that made it possible to verify
the variables necessary to calculate the pollution index and perform an analysis of
freight transportation in the Triângulo Mineiro region. For this, different databases
were explored, both academic like the Coordination for the Improvement of Higher
Education Personnel (CAPES) journal portal and the digital thesis portal from the
University of Sao Paulo and also from grey literature like the National Agency of
Land Transportation (ANTT) and the National Transportation Confederation (CNT)
database. After interpreting the selected works, it was possible to find information
on the number of transporters in Brazil and the number of freight vehicles and
their average age.
Interviews were conducted in a face-to-face meeting with employees of the
SETTRIM; in-depth interviews are used to obtain as much detailed information as
possible about a specific topic (Minayo, 1993). The conversation guidelines
addressed the fleet's characterization of the transport and logistics companies of
the municipality of Uberlandia.
The calculation for emissions of Hydrocarbons (H.C.), Carbon Monoxide (C.O.),
and Nitrogen Oxide (NOx)
The U.S. Environmental Protection Agency (EPA) methodology for calculating
atmospheric emissions was used as a reference. However, effective use needed to
make contextual adjustments for the Triângulo Mineiro region and adjust the year
of manufacture of the vehicles from 2017 since the table's source was from 2009.
In this way, it provided data for vehicles from 2009. The change of the year of
manufacture of the vehicles in the table does not interfere in the final result since
what matters is the vehicle's age, thus keeping the emission and deterioration
values consistent. To obtain emission rates for hydrocarbons (H.C.), carbon
monoxide (C.O.) and nitrogen oxides (NOx), the actual values offered by the EPA of
emission factors and deterioration factors for the years 2017 to 2005; and for the
years 2004 to 1994 an average of the values of the factors released by the EPA,
shown in Table 5, were performed.
Brazilian Journal of Operations & Production Management, Vol. 19, No. 1, e20221049, 2022 9/17Every breath you take. Every freight you make: environmental pollution index for road transportation
Table 5 - Emission (E.F.) and deterioration (D.F.) factors for hydrocarbons, carbon monoxide, and
nitrogen oxides, in grams per mile, for heavy diesel vehicles at high altitudes.
Year of Hydrocarbons Carbon monoxide Nitrogen oxides
manufacture F.E. F.D. F.E. F.D. F.E. F.D.
2017 to 2005 4.82 0 16.665 0.08 6.49 0
2004 to 1994 5.026 0 17.363 0.084 13.902 0
Source: EPA (United States Environmental Protection Agency, 2017)
The EPA provides data for two types of the region: low altitude and high altitude.
The state of Minas Gerais is considered the highest altitude in Brazil due to the
characteristics of its relief, thus justifying the use of the factors for high altitude regions.
The average annual value of 124,800 kilometers was performed by making the
summation of the monthly average, provided by the CNT survey, of 10,400 km/month.
Lastly, data on the Uberlandia state fleet provided by SETTRIM were required. Only 2,503
freight vehicles were considered, corresponding to the vehicles that carry out emission
monitoring of atmospheric pollutants in Uberlandia. Data from the fleet of diesel
vehicles were organized by age group as stipulated by the EPA and are presented in
Table 1. The calculation of the emission rate of the indicated pollutants is equivalent to
the multiplication of the deterioration factor by the average number of kilometers,
divided by 10,000 miles, added to the emission factor of vehicles, and it is possible to
estimate by Equation:
Milhasi
∑ Ni FEi + FDi *
Total issue =
10000
(1)
It is important to note that the data in Table 1, provided by the EPA, are in grams
per mile, so conversions are required to show the results grams/km, based on the one-
mile ratio of 1.609344 kilometers. Based on the emission and deterioration factors
presented in Table 1 and the distribution of the fleet of heavy diesel-powered vehicles
per year of manufacture, the total emission of each pollutant in grams can be estimated
by equation:
FEi FDi 124800
km
Total emission =
∑ Ni + *
1.609344 1.609344 10000 *1.609344 km (2)
Where Ni represents the total of vehicles with a year of manufacture “i”; FEi and FDi are
the emission and deterioration factors for each pollutant, in grams per mile, for each
vehicle with a year of manufacture belonging to the “i” range; and “Milhasi” corresponds
to the accumulated total of miles traveled by vehicles with a year of manufacture
belonging to the “i” range.
The calculation for particulate matter emissions with a diameter of less than 2.5
μm (PM2.5).
For the calculation of the emission estimate of the particulate matter, the “Projeto
Fontes” was used as a reference, which is a study carried out through the cooperation
agreement between Petrobras with USP and PUC-RJ to analyze the influence of the
primary emitting sources on the formation of particulate matter (PM), especially PM2.5
(particulate matter with a diameter of less than 2.5 μm).
Through the data provided by this study, it was possible to apply its results to the
fleet data of the vehicles studied herein, thus determining the average particulate matter
produced by the vehicles monitored in Uberlandia.
Brazilian Journal of Operations & Production Management, Vol. 19, No. 1, e20221049, 2022 10/17Every breath you take. Every freight you make: environmental pollution index for road transportation
RESULTS
The results will be presented in four topics to facilitate the reader's understanding:
1) Hydrocarbons, 2) Carbon Monoxide, 3) Nitrogen Oxide, and 4) Particulate Matter.
1. Hydrocarbons
FEi FDi 124800
km
Total emission =
∑ Ni + *
1.609344 1.609344 10000 *1.609344 km (3)
∑ ( fleet emission aged
Total 2017 2005)
emission = to + ( fleet 2004
emission aged to1994 )
(4)
4.82 0 124800
Emission ( 2017 2005
fleet= to ) 1770 1.609344 + 1.609344 * 10000 *1.609344
(5)
fleet ( 2017 2005
Emission to ) = 1770 * 2.9950 (6)
fleet ( 2017 2005
Emission to ) = 5301.16 g / year (7)
5.026 0 124800
fleet (=
Emission 2004 to1994 ) 733 + *
1.609344 1.609344 10000 *1.609344 (8)
fleet (
Emission 2004 to1994 ) = 733*3.1230
(9)
fleet (
Emission 2004 to1994 ) = 2289.18 g / year
(10)
Emission Emission (
Total 2017
= to 2005 ) + 2004
Emission ( to1994 )
(11)
= 5301.16 + 2289.18
Total Emission (12)
Total Emission 7590.32
= = g / year 7.6kg / year (13)
For the fleet of 2,503 heavy freight vehicles in Uberlândia, 7.6 kg of hydrocarbons is
emitted every year.
2. Carbon Monoxide
FEi FDi 124800
km
Total emission =
∑ Ni + *
1.609344 1.609344 10000 *1.609344 km (14)
∑ ( fleet emission aged
Total 2017 2005)
emission = to + ( fleet 2004
emission aged to1994 )
(15)
16.665 0.08 124800
Emission ( 2017 2005
fleet= to ) 1770 1.609344 + 1.609344 * 10000 *1.609344
(16)
Brazilian Journal of Operations & Production Management, Vol. 19, No. 1, e20221049, 2022 11/17Every breath you take. Every freight you make: environmental pollution index for road transportation
fleet ( 2017 2005
Emission to ) = 19010.52 g / year (17)
17.363 0.084 124800
fleet (=
Emission 2004 to1994 ) 733 + *
1.609344 1.609344 10000 *1.609344 (18)
fleet (
Emission 2004 to1994 ) = 8198.42 g / year
(19)
Emission Emission (
Total 2017
= to 2005 ) + 2004
Emission ( to1994 )
(20)
= 19010.52 + 8198.42
Total Emission (21)
Total Emission 27208.94
= = g / year 27.2kg / year (22)
For the fleet of 2,503 heavy freight vehicles in Uberlândia, 27.2 kg of carbon
monoxide is emitted per year.
3. Nitrogen Oxide
FEi FDi 124800
km
Total emission =
∑ Ni + *
1.609344 1.609344 10000 *1.609344 km (23)
∑ ( fleet emission aged
Total 2017 2005)
emission = to + ( fleet 2004
emission aged to1994 )
(24)
6.49 0 124800
Emission ( 2017 2005
fleet= to ) 1770 1.609344 + 1.609344 * 10000 *1.609344
(25)
fleet ( 2017 2005
Emission to ) = 7137,87 g / year (26)
13.902 0 124800
fleet (=
Emission 2004 to1994 ) 733 + *
1.609344 1.609344 10000 *1.609344 (27)
fleet (
Emission 2004 to1994 ) = 6677.4 g / year
(28)
Emission Emission (
Total 2017
= to 2005 ) + 2004
Emission ( to1994 )
(29)
= 7137.87 + 6677.4
Total Emission (30)
Total Emission 13815.27
= = g / year 13.82kg / year (31)
For the fleet of 2,503 heavy freight vehicles in Uberlândia, 13.82 kg of nitrogen oxide
is emitted per year.
Brazilian Journal of Operations & Production Management, Vol. 19, No. 1, e20221049, 2022 12/17Every breath you take. Every freight you make: environmental pollution index for road transportation
4. Particulate Matter
Emission of PM2.5 in heavy diesel cycle engines
• For S500 diesel
205mg 123mg 19.12mg
+ +
P 4 + P5 + P 7 km km km=
=X = X X 115.70mg / km
3 3 (32)
The average particulate matter (PM2.5) emitted by freight vehicles using S500 diesel
is 115.70 mg/km per vehicle.
• For S10 diesel
182mg 94mg 11.50mg
+ +
P 4 + P5 + P 7 km km km
=X = X = X 95.83mg / km (33)
3 3
The average particulate matter (PM2.5) emitted by freight vehicles using S10 diesel
is 95.83 mg/km per vehicle.
Total emission average of PM2.5 in heavy diesel cycle engines for S500 and S10
diesel.
115.70mg 95.83mg
+
xS 500 + xS10 km km =
=X = X X 105, 76mg / km (34)
2 2
Total emission generated by the vehicles of Uberlândia:
=T axS 500 + bxS10 (35)
1728 *115.7 + 775 * 95.83 T =
T= 199, 929.6 + 74, 268.25
T 274,197.85
= mg / km 274.2 g / km (36)
a: number of S500 fleet vehicles in Uberlândia;
b: number of S10 fleet vehicles in Uberlândia.
x S500: Average emission of vehicles using S500 diesel
x S10: Average emission of vehicles using S10 diesel
The emission of particulate matter (PM 2.5) generated by the sample's vehicles of
this research, which corresponds to 2,503 freight vehicles, is 274.2 g/km.
Total
emissions generated 274,197.85
PM
= indicator = = 1.04 (37)
Pollution average 264, 717.28
FINAL CONSIDERATIONS
The development of solutions to mitigate air pollution calls for a comprehensive
analysis: the problem is complex and can originate from several factors. However,
considering the emissions of cargo vehicles as a significant factor in this process of
pollution, the atmosphere can facilitate the identification of solutions to face this
situation with greater efficiency.
Brazilian Journal of Operations & Production Management, Vol. 19, No. 1, e20221049, 2022 13/17Every breath you take. Every freight you make: environmental pollution index for road transportation
The S10 diesel, used only in engines manufactured since 2012, allows reducing the
emission of particulate matter by up to 80% and nitrogen oxides by up to 98% (Petrobras,
2017). Itis currently estimated that Brazil has almost 14% of its cargo vehicle fleet with
more than 30 years of use. About 230 thousand trucks use diesel S500 as fuel, which
generates very high atmospheric emissions (Brasil, 2017).
Considering that 61.1% of cargo in Brazil is transported by the road system (Colavite
and Konishi, 2015), that there are a total of 1,682,398 cargo vehicles in the country
(Agência Nacional de Transportes Terrestres, 2017) and that only in the city of
Uberlândia, which is an important logistics hub in Brazil, 69% of vehicles are older than
necessary to use the S10 diesel (Agência Nacional de Transportes Terrestres, 2017), the
present research indicates a significant opportunity to reduce air pollution by suggesting
a more pronounced renewal of the vehicle fleet.
Thus, this study suggests intensively increasing the fleet of cargo vehicles' rates
using S10 diesel technology. In this sense, a viable alternative would be to offer limited
lines with incentives and low-interest rates to autonomous carriers and drivers to replace
vehicles manufactured before 2012 with others that are technologically more modern
and less polluting. As a side effect, there would also be a reduction in fleet maintenance
costs for companies operating in goods' transportation.
The standards used by the EPA and the Sources Project were used as a reference to
calculate the quantity of the primary air pollutants. During data collection in the city of
Uberlândia, it was possible to notice a low adherence by city carriers to the
environmental management system. Of the sample of 1,738 freight companies, only 81
carry out the monitoring of air quality in their fleet. In this work, the research sample
considered only the companies that carry out this monitoring with supervision by
SETTRIM. The results obtained were allowed to identify the following indices: Carbon
Monoxide (CO) 27.2 kg/year, Nitrogen Oxide (NOx) 13, 82 kg/year, Hydrocarbons (H.C.)
7.6 kg/year, and Particulate Material 274.2 g / km.
One limitation of this research is related to the use of a small percentage sample.
Besides, companies that were already concerned with the level of pollutant emissions
and who spontaneously adhered to an air quality monitoring program were considered.
As a result, the carriers contributing to this research may have a different fleet profile
concerning the others, which may have generated indexes that do not necessarily
represent the Uberlândia fleet.
Future research may consider replicating this study in other Brazilian regions to
identify relevant differences in pollutant emission rates, generating more appropriate
policies to address contextual realities. Another situation to assess would be to carry out
comparative research with other countries to identify and disseminate the most efficient
practices to mitigate pollutants' emission.
In this sense, having air quality standards as an essential reference, it is possible to
observe that the city of Uberlândia does not have effective air quality management. This
research also recommends using government policies to motivate a more significant
number of cargo transportation companies to seek adherence to air quality monitoring
in their fleets.
REFERENCES
Agência Nacional de Transportes Terrestres – ANTT (2017), Highways, available at:
http://www.antt.gov.br/rodovias/index.html> (accessed 1 March 2017).
Agência Nacional do Petróleo, Gás Natural e Biocombustíveis – ANP (2017), Statistic data, available
at: http://www.anp.gov.br/wwwanp/dados-estatisticos (accessed 1 April 2017).
Alvarez-Cruz, C. D., Munari, P. A. and Morabito, R. (2019), “Limites para o problema de alocação de
veículos”, Dyna rev.fac.nac.minas, Vol. 86, No. 208, pp. 329-35.
http://dx.doi.org/10.15446/dyna.v86n208.68504.
Brazilian Journal of Operations & Production Management, Vol. 19, No. 1, e20221049, 2022 14/17Every breath you take. Every freight you make: environmental pollution index for road transportation
Amann, E., Baer, W., Trebat, T. et al. (2016), "Infrastructure and its role in Brazil’s development
process", The Quarterly Review of Economics and Finance, Vol. 62, pp. 66-73.
Bahn, O., Mathilde, M., Wuaab, K. et al. (2013), "Electrification of the Canadian road transportation
sector: a 2050 outlook with TIMES-Canada", Energy Policy, Vol. 62, pp. 593-606.
Barat, J. (1978). The evolution of transport in Brazil, IPEA, Niterói.
Bartholomeu, D.B., Pera, T.G. and Caixeta-Filho, J.V. (2016), Logística sustentável: avaliação de
estratégias de redução das emissões de CO2 no transporte rodoviário de cargas. Journal of
Transport Literature, Vol. 10, No. 3, pp. 15-19. https://doi.org/10.1590/2238-1031.jtl.v10n3a3.
Brasil. Ministério dos Transportes, Portos e Aviação Civil. Agência Nacional de Transportes Terrestres –
ANTT. (2016). Resolução n.º 5.232/2016, de 14 de dezembro de 2016. Aprova as Instruções
Complementares ao Regulamento Terrestre do Transporte de Produtos Perigosos, e dá outras
providências. Diário Oficial da União; Brasília; 2016, available at:
https://anttlegis.datalegis.inf.br/action/UrlPublicasAction.php?acao=abrirAtoPublico&num_ato=0000
5232&sgl_tipo=RES&sgl_orgao=DG/ANTT/MTPA&vlr_ano=2016&seq_ato=000 (accessed 5 July 2021).
Brasil (1981), Lei nº 6.938, de 31 de Agosto de 1981. Dispõe sobre a Política Nacional do Meio
Ambiente, seus fins e mecanismos de formulação e aplicação, e dá outras providências. Diário
Oficial República Federativa do Brasil, Brasília.
Brasil (1986), Resolução CONAMA nº 18, de 6 de maio de 1986. Dispõe sobre a criação do Programa
de Controle de Poluição do Ar por veículos Automotores – PROCONVE. Diário Oficial República
Federativa do Brasil, Brasília.
Brasil. Ministério do Meio Ambiente. (2017), PROCONVE, available at:
http://www.mma.gov.br/estruturas/163/_arquivos/proconve_163.pdf (accessed 1 April 2017).
Brunekreef, B., Annesi-Maesano, I., Ayres, J.G. et al. (2012), "Ten principles for clean air", The
European Respiratory Journal, Vol. 39, No. 3, pp. 525-28.
Calderon-Garcidueñas. E., Leray, E., Reis, J. et al. (2016), “Air pollution, a rising environmental risk
factor for cognition, neuroinflammation and neurodegeneration: the clinical impact on
children and beyond”, Revue Neurologique, Vol. 172, No. 1, pp. 69-80.
https://doi.org/10.1016/j.neurol.2015.10.008. PMID: 26718591.
Castro, N. (2013), "Measurement of externalities of Brazilian cargo transport", Journal of Transport
Literature, Vol. 7, No. 1, pp. 163-81.
Catela, E.Y.S. and Seabra, F. (2017), “Aglomerações produtivas e escolha de modal de transporte:
um estudo de caso do setor industrial de São Paulo e Manaus”, Revista Nova Econonomia, Vol.
27, No. 2, pp. 295-321. https://doi.org/10.1590/0103-6351/2785.
Cavico, F.J. and Mujtaba, B.G. (2016), Volkswagen emissions scandal: a global case study of legal,
ethical, and practical consequences and recommendations for sustainable management",
Global Journal of Research in Business & Management, Vol. 4, No. 2, pp. 303-11.
Cepeda, M., Schoufour, J., Freak-Poli, R. et al. (2017), Levels of ambient air pollution according to
mode of transport: a systematic review”, Lancet Public Health, Vol 2, no, 1, available at:
https://www.researchgate.net/publication/311651813_Levels_of_ambient_air_pollution_accor
ding_to_mode_of_transport_a_systematic_review (accessed 6 April 2020).
Chiquetto, J.B. (2019), “Urban mobility and air pollution- synergies and co-benefits”, available at:
http://www.iea.usp.br/pesquisa/projetos-institucionais/usp-cidades-globais/artigos-
digitais/mobilidade-urbana-e-poluicao-do-ar-sinergias-e-cobeneficios (accessed 6 April 2020).
Colavite, A.S. and Konishi, F. (2015). “The transport matrix in Brazil: a comparative analysis for
competitiveness”, available at: https://www.aedb.br/seget/arquivos/artigos15/802267.pdf
(accessed 23 June 2021).
Coleti, J.C. and Oliveira, A.L.R. (2019), “A Intermodalidade no Transporte de Etanol Brasileiro:
aplicação de um modelo de equilíbrio parcial”, Revista de Economia e Sociologia Rural, Vol.
57, No. 1, pp. 127-44. http://dx.doi.org/10.1590/1234-56781806-94790570108.
Correa, S. and Arbilla, G. (2006), "Aromatic hydrocarbons emissions in diesel and biodiesel
exhaust", Atmospheric Environment, Vol. 40, No. 35
Degobert, P. (1995), Automobiles and pollution, SAE Society of Automotive Engineers, Warrendale.
Brazilian Journal of Operations & Production Management, Vol. 19, No. 1, e20221049, 2022 15/17Every breath you take. Every freight you make: environmental pollution index for road transportation
Empresa de Pesquisa Energética – EPE (2015), “Brazilian energy balance 2015 year 2014”, EPE, Rio
de Janeiro.
Frey, H.C. (2018), "Trends in onroad transportation energy and emissions", Journal of the Air & Waste
Management Association, Vol. 68, No. 6, pp. 514-63.
http://dx.doi.org/10.1080/10962247.2018.1454357.
Galbieri, R., Brito, T.L.F., Mouette, D. et al. (2017), GHG mitigation due to the introduction of natural
gas and ee measures in cargo transportation in Brazil”, in International Gas Union Research Gas
Conference 2017, Rio de Janeiro, pp. 1-11, avaliable at:
https://www.researchgate.net/profile/Thiago-Brito-
3/publication/318404736_GHG_Mitigation_due_to_the_Introduction_of_Natural_Gas_and_Ene
rgy_Efficiency_Measures_in_Cargo_Transportation_in_Brazil/links/5967b249a6fdcc18ea662c5
e/GHG-Mitigation-due-to-the-Introduction-of-Natural-Gas-and-Energy-Efficiency-Measures-in-
Cargo-Transportation-in-Brazil.pdf (accessed 24 June 2021).
Galvao, O. (1996), "Transport development and regional integration in Brazil: a historical
perspective", Planning and Public Policies, Vol. 1, No. 13, pp. 1-32.
Gouveia, N., Freitas, C.U., Martins, L.C. et al. (2006), Hospitalizações por causas respiratórias e
cardiovasculares associadas à contaminação atmosférica no Município de São Paulo, Brasil.
Cadernos de Saúde Pública, Vol. 22, No. 12, pp. 2669-2677. https://doi.org/10.1590/S0102-
311X2006001200016.
Hao, Y., Peng, H., Temulun, T. et al. (2018), "How harmful is air pollution to economic development?
New evidence from PM2. 5 concentrations of Chinese cities", Journal of Cleaner Production, Vol.
172, pp. 743-57.
Institute of Interamerican Affairs (1954), Brazilian technical studies, Joint Brazil- U.S. Economic
Development Commission, Washington, DC.
Instituto Brasileiro de Geografia e Estatistica – IBGE (2014), “Transport logistics”, avaliable at:Every breath you take. Every freight you make: environmental pollution index for road transportation
Santos Junior, D.A.M. (2015) Emissões veiculares em São Paulo: quantificação de fontes com modelos
receptores e caracterização do material carbonáceo, Dissertação de Mestrado, Instituto de Física,
Universidade de São Paulo, São Paulo, SP, available at
https://www.teses.usp.br/teses/disponiveis/43/43134/tde-17072015-
135624/publico/SantosJunior.pdf (accessed 5 July 2021).
Scheepers, P.T.J. and Bos, R.P. (1992), "International archives of occupational and environmental
health", Environmental Sciences, Vol. 1, No. 8.
Sindicato das Empresas de Transporte de Cargas do Triângulo Mineiro – SETTRIM (2017), Interview
Open, SETTRIM, Uberlândia.
Southworth, J., Marsik, M., Qiu, Y. et al. (2011), “Roads as drivers of change: trajectories through the
tri-national frontier in MAP, the Southwestern Amazon”, Remote Sensing. Vol. 3, No. 5, pp. 1047-
66. https://doi.org/10.3390/rs3051047.
Stern, D.I. and Van Dijk, J. (2017), "Economic growth and global particulate pollution
concentrations", Climatic Change, Vol. 142, No. 3-4, pp. 391-406.
Talebian, H., Herrera, O.E., Tran, M. et al. (2018), “Electrification of road freight transport: policy
implications in British Columbia”, Energy Policy, Vol. 115, pp. 109-18.
United States Environmental Protection Agency (2017), “AP-42: Compilation of air pollutant
emission factors”, available at: http://www.epa.gov/oms/ap42.htm (accessed 10 June 2017).
Vieira, N.D.B., Nogueira, L.A.H. and Haddad, J. (2018), "An assessment of CO2 emissions avoided by
energy-efficiency programs: a general methodology and a case study in Brazil", Energy, Vol. 142,
pp. 702-15.
Weiss, M., Dekker, P., Moro, A. et al. (2015), “On the electrification of road transportation – A review
of the environmental, economic, and social performance of electric two-wheelers”,
Transportation Research Part D: Transport and Environment, Vol. 41, pp. 348-366.
World Health Organization – WHO. (2000), Air Quality Guidelines for Europe, WHO, Copenhagen,
WHO regional publications. European series, No. 91.
Yang, B.Y., Guo, Y., Markevich, I. et al. (2019), “Association of long-term exposure to ambient air
pollutants with risk factors for cardiovascular disease in China”, JAMA Network Open, Vol. 2, No.
3, pp. e190318.
Zhang, Q., Jiang, X., Tong, D. et al. (2017), “Transboundary health impacts of transported global air
pollution and international trade”, Nature, Vol. 543, No. 7647, pp. 705-9.
Author contributions: All the authors contributed equally to this paper.
Brazilian Journal of Operations & Production Management, Vol. 19, No. 1, e20221049, 2022 17/17You can also read