The influence of synoptic weather regimes on UK air quality: regional model studies of tropospheric column NO2
←
→
Page content transcription
If your browser does not render page correctly, please read the page content below
Atmos. Chem. Phys., 15, 11201–11215, 2015
www.atmos-chem-phys.net/15/11201/2015/
doi:10.5194/acp-15-11201-2015
© Author(s) 2015. CC Attribution 3.0 License.

The influence of synoptic weather regimes on UK air quality:
regional model studies of tropospheric column NO2
R. J. Pope1,2 , N. H. Savage3 , M. P. Chipperfield1,2 , C. Ordóñez3 , and L. S. Neal3
1 Schoolof Earth and Environment, University of Leeds, Leeds, LS2 9JT, UK
2 National Centre for Earth Observation, University of Leeds, Leeds, LS2 9JT, UK
3 Met Office, Exeter, UK

Correspondence to: R. J. Pope (earrjpo@leeds.ac.uk)

Received: 18 June 2015 – Published in Atmos. Chem. Phys. Discuss.: 8 July 2015
Revised: 1 October 2015 – Accepted: 2 October 2015 – Published: 8 October 2015

Abstract. Synoptic meteorology can have a significant influ-       1   Introduction
ence on UK air quality. Cyclonic conditions lead to the dis-
persion of air pollutants away from source regions, while an-
ticyclonic conditions lead to their accumulation over source       Local air quality (AQ) can be influenced significantly by re-
regions. Meteorology also modifies atmospheric chemistry           gional weather systems through the accumulation and dis-
processes such as photolysis and wet deposition. Previous          persion of atmospheric pollutants over and away from source
studies have shown a relationship between observed satellite       regions and populated areas. Local air quality can also be in-
tropospheric column NO2 and synoptic meteorology in dif-           fluenced by changes in atmospheric chemistry processes. For
ferent seasons. Here, we test whether the UK Met Office Air        example, increased cloudiness will reduce photolysis rates
Quality in the Unified Model (AQUM) can reproduce these            below cloud and increased precipitation can lead to enhanced
observations and then use the model to explore the relative        removal of pollutants by wet deposition.
importance of various factors. We show that AQUM suc-                 Many studies have used synoptic weather classifications
cessfully captures the observed relationships when sampled         to investigate the influence on AQ. These include objective
under the Lamb weather types, an objective classification of       classifications such as the Lamb weather type (LWT) and the
midday UK circulation patterns. By using a range of ideal-         North Atlantic Oscillation (NAO) index. The LWTs are an
ized NOx -like tracers with different e-folding lifetimes, we      objective description of the daily midday atmospheric cir-
show that under different synoptic regimes the NO2 lifetime        culation over the UK based on mean sea level pressure re-
in AQUM is approximately 6 h in summer and 12 h in winter.         analysis data (Jones et al., 2013). The NAO Index is based
The longer lifetime can explain why synoptic spatial tropo-        on the pressure gradient between the Icelandic low and
spheric column NO2 variations are more significant in winter       the Azores/Gibraltarian high pressure systems (Jones et al.,
compared to summer, due to less NO2 photochemical loss.            1997). In winter this pressure gradient has a significant in-
We also show that cyclonic conditions have more seasonality        fluence on UK weather, where the positive phase can result
in tropospheric column NO2 than anticyclonic conditions as         in mild wet winters and the negative phase can lead to cold
they result in more extreme spatial departures from the win-       stable conditions (Osborn, 2006).
tertime seasonal average. Within a season (summer or win-             Previous studies including Demuzere et al. (2009), Tang
ter) under different synoptic regimes, a large proportion of       et al. (2011), Lesniok et al. (2010) and McGregor and
the spatial pattern in the UK tropospheric column NO2 field        Bamzelis (1995) have used surface observations of air pol-
can be explained by the idealized model tracers, showing that      lution to look at these AQ–regional weather relationships.
transport is an important factor in governing the variability of   Pope et al. (2014) and Thomas and Devasthale (2014) were
UK air quality on seasonal synoptic timescales.                    two of the first studies to use Earth observation (EO) of at-
                                                                   mospheric pollutants, in combination with measures of syn-
                                                                   optic weather, to investigate the influence of regional weather

Published by Copernicus Publications on behalf of the European Geosciences Union.
11202 R. J. Pope et al.: Evaluation of a regional air quality model using satellite column NO2
on AQ. Pope et al. (2014) used the LWTs and Ozone Moni- Table 1. The numbered elements show the 27 basic Lamb weather
toring Instrument (OMI) tropospheric column NO2 between types. LWTs also include −1 (unclassified) and −9 (non-existent
2005 and 2011 (note that in the following we often refer to day). Pope et al. (2014) grouped the LWTs into 3 circulation types
“tropospheric column NO2 ” as “column NO2 ”). They found and 8 wind directions, as indicated in the outer row and column.
that anticyclonic and cyclonic conditions lead to the accu- However, in this study we focus on the cyclonic and anticyclonic
conditions.
mulation and transport of air pollutants over and away from
source regions, respectively. They also successfully detected This work Anticyclonic Neutral Cyclonic
the leeward transport of column NO2 away from source re- vorticity
gions under certain wind directions, similar to Beirle et al.
(2011) and Hayn et al. (2009). These two studies used OMI 0A 20 C
column NO2 and wind information to analyse NO2 transport North-easterly 1 ANE 11 NE 21 CNE
Easterly 2 AE 12 E 22 CE
from the isolated megacity Riyadh, Saudi Arabia, and Johan-
South-easterly 3 ASE 13 SE 23 CSE
nesburg, South Africa, respectively. Zhou et al. (2012) found
Southerly 4 AS 14 S 24 CS
significant impacts of wind speed and precipitation on OMI South-westerly 5 ASW 15 SW 25 CSW
column NO2 over western Europe. Savage et al. (2008) in- Westerly 6 AW 16 W 26 CW
vestigated the interannual variability (IAV) of satellite NO2 North-westerly 7 ANW 17 NW 27 CNW
columns over Europe, finding that meteorology influences Northerly 8 AN 18 N 28 CN
NO2 IAV more than emissions. Thomas and Devasthale
(2014) found that Atmospheric Infrared Sounder (AIRS) CO
at 500 hPa from 2002 to 2013 over the Nordic countries in-
Sect. 3. Section 4 shows our OMI/AQUM–LWT results for
creased by 8, 4, 2.5, and 1 % under southeasterly winds,
2006–2010 and our conclusions are presented in Sect. 5.
northwesterly winds, the positive phase of the NAO, and an-
ticyclonic conditions, respectively. The clearest conditions
were under northeasterly winds and the negative phase of 2 Data
the NAO when cleaner Arctic air was transported into the
Nordic region. When looking at the Global Ozone Monitor- 2.1 Lamb weather types
ing Experiment (GOME) column NO2 and the NAO, Eck-
hardt et al. (2003) found that significant positive phases lead Lamb (1972) originally had a manual methodology of classi-
to the reduction in column NO2 over western Europe. How- fying the UK weather patterns but that has been superseded
ever, Pope et al. (2014) did not find any clear evidence for by automated methods. The objective (automated) LWTs, de-
this relationship. veloped by Jones et al. (2013) based on the algorithm of
This paper uses both satellite observations and the Jenkinson and Collison (1977) and using the NCEP (Na-
UK Met Office’s operational Air Quality in the Unified tional Centers for Environmental Prediction) reanalyses of
Model (AQUM) to extend on the work of Pope et al. (2014). midday mean sea level pressure data described by Kalnay
We investigate the differences in the air quality–synoptic et al. (1996), classify the atmospheric circulation patterns
weather relationships found by Pope et al. (2014) by attempt- over the UK according to the wind direction and circulation
ing to quantify the dominant processes involved; for exam- type. The LWTs (Table 1) are grouped into three vorticity
ple, is atmospheric chemistry or weather more important in types (neutral vorticity, cyclonic and anticyclonic) and eight
governing the links between synoptic meteorology and air wind flow directions unless solely classified as cyclonic or
quality in different seasons? First, we assess the ability of anticyclonic. The left column and top row of Table 1 show
AQUM to simulate UK air quality under different synop- the grouped classifications used by Pope et al. (2014) to com-
tic regimes found in the OMI data. This is defined as “dy- posite OMI column NO2 data between 2005 and 2011. In this
namical” model evaluation, i.e. assessing a model’s ability study we focus on 2006–2010 to match the AQUM simula-
to simulate changes in air quality stemming from changes in tion period but only focus on seasonal cyclonic and anticy-
emissions and/or meteorology (Dennis et al., 2010). This fol- clonic conditions. Therefore, from here on in, references to
lows the work by Pope et al. (2015), who used “operational” “OMI–LWT” or “AQUM–LWT” comparisons relate to the
model evaluation, i.e. statistical analyses aimed at determin- analysis of OMI or AQUM tropospheric column NO2 fields
ing the agreement between the model and observations (Den- under seasonal cyclonic or anticyclonic conditions. For more
nis et al., 2010), to perform the first evaluation of AQUM information on the application of the LWTs to composite
against satellite observations. Then, we use AQUM e-folding OMI and AQUM column NO2 see Pope et al. (2014).
tracers with specified lifetimes designed to assess the impact
of meteorology, emissions and chemistry on UK AQ. 2.2 Satellite data
The paper is structured as follows: Sect. 2 discusses the
LWTs and OMI column NO2 data. The model setup and OMI is aboard NASA’s EOS-Aura satellite and has an ap-
application of OMI averaging kernels (AK) is discussed in proximate UK daytime overpass of 13:00 LT (local time).
Atmos. Chem. Phys., 15, 11201–11215, 2015 www.atmos-chem-phys.net/15/11201/2015/R. J. Pope et al.: Evaluation of a regional air quality model using satellite column NO2 11203
It is a nadir-viewing instrument with pixel sizes between Monitoring Atmospheric Composition and Climate (MACC)
16–23 and 24–135 km along and across track, respectively, reanalyses (Inness et al., 2013). Pope et al. (2015) showed
depending on the viewing zenith angle (Boersma et al., that for 2006, using the ECMWF GEMS (Global and re-
2008). The tropospheric column NO2 data used here is the gional Earth-system Monitoring using Satellite and in situ
DOMINO product version 2.0, which comes from the Tro- data) reanalysis (Hollingsworth et al., 2008) LBCs provided
pospheric Emissions Monitoring Internet Service (TEMIS) more accurate forecasts than using the MACC LBCs. How-
(Boersma et al., 2011a, b) and is available from http://www. ever, the GEMS LBCs are only available for 2006–2008.
temis.nl/airpollution/no2.html. We have binned NO2 swath Therefore, we have used the MACC LBCs, which are avail-
data from 1 January 2006 to 31 December 2010 onto a daily able for the full period analysed here.
13:00 LT 0.25◦ × 0.25◦ grid between 43–63◦ N and 20◦ W– The model emissions were generated by merging three
20◦ E. All satellite retrievals were quality controlled, and re- data sets: the National Atmospheric Emissions Inven-
trievals/pixels with geometric cloud cover greater than 20 % tory (NAEI) (1 × 1 km) for the UK, ENTEC (5 × 5 km) for
and poor quality data flags (flag = −1 including retrievals af- the shipping lanes and European Monitoring and Evalua-
fected by row anomalies and flagged by the Braak (2010) al- tion Programme (EMEP) (50 × 50 km) for the rest of the
gorithm) were removed. Several studies including Irie et al. model domain. NAEI NOx emissions consist of point and
(2008) and Boersma et al. (2008) have validated OMI col- area sources. Area sources include light industry, urban emis-
umn NO2 against surface and aircraft measurements of tro- sions and traffic, while elevated point sources are landfill,
pospheric column NO2 with good agreement within the OMI power stations, incinerators, and refineries. Typically, the
uncertainty ranges. Therefore, we have confidence in the point source emissions are 100 g s−1 in magnitude, while the
OMI column NO2 data used in this study. area sources tend to be 10 g s−1 . The emissions are initially
annual totals; however, the seasonal scaling factor from Viss-
chedijk et al. (2007) is applied. See Pope et al. (2015) for
3 Air quality in the Unified Model (AQUM) more information. NOx lightning emissions are parameter-
ized based on model convection (O’Connor et al., 2014).
3.1 Model setup AQUM does not include any soil NOx sources, but large
emissions from transport and industry in this region will
The AQUM domain covers approximately 45–60◦ N and dominate (Zhang et al., 2003).
12◦ W–12◦ E, on a rotated grid, including the British Isles AQUM was run for 5 years from 1 January 2006 to 31 De-
and part of continental Europe. The grid resolution is cember 2010. Five years provide a sufficient model data
0.11◦ × 0.11◦ in the horizontal and the model extends from record to test the OMI column NO2 –LWT relationships.
the surface to 39 km on 38 levels. It has a coupled online There are a few missing days for the 5-year simulation as
tropospheric chemistry scheme, which uses the UK Chem- the MACC LBCs do not exist over the full period (i.e. 4–
istry and Aerosols (UKCA) subroutines. A complete descrip- 6 June 2007 are missing).
tion of this chemistry scheme, known as Regional Air Qual- As AQUM is a limited area NWP (numerical weather
ity (RAQ), is available from the online Supplement of Savage prediction) model, with meteorological boundary conditions
et al. (2013). It includes 40 tracers, 18 non-advected species, from an operational NWP analysis and short (24 h) fore-
23 photolysis reactions and 115 gas-phase reactions. It also casts, the representation of large-scale weather systems via
includes the heterogeneous reaction of N2 O5 on aerosol as the LBCs is likely to be highly consistent with the NCEP
discussed by Pope et al. (2015). reanalyses used to calculate the LWTs. Jones et al. (2014)
For aerosols, AQUM uses the Coupled Large-scale also show high correlations between LWTs derived with
Aerosol Simulator for Studies In Climate (CLASSIC) NCEP reanalyses and those from another independent re-
aerosol scheme. Aerosols are treated as an external mixture analysis (20CR).
simulated in the bulk aerosol scheme. It contains six prog- We have sampled the AQUM surface pressure and winds
nostic tropospheric aerosol types: ammonium sulfate, min- under summer and winter anticyclonic and cyclonic condi-
eral dust, fossil fuel black carbon (FFBC), fossil fuel organic tions (Figs. 1, 2). In this study, summer ranges from April
carbon (FFOC), biomass burning aerosols, and ammonium to September and winter is October–March. This is between
nitrate. It also includes a fixed climatology for biogenic sec- 2007 and 2010 as u and v winds were unfortunately not saved
ondary organic aerosols (BSOA) and a diagnostic scheme for for 2006. Under cyclonic conditions, the pressure anoma-
sea salt. For more details of the aerosol scheme see Bellouin lies from the seasonal average range between −10 to 0 hPa
et al. (2011). and −20 to 0 hPa in summer and winter, respectively. Un-
Meteorological initial conditions and lateral boundary der anticyclonic conditions, the summer and winter anoma-
conditions (LBCs) come from the Met Office’s operational lies range between 0–10 and 0–20 hPa (Fig. 1). These pres-
global Unified Model (25 km × 25 km) data. The chemical sure anomalies are consistent with cyclonic and anticyclonic
initial conditions come from AQUM’s forecast for the previ- conditions. Under anticyclonic conditions, the circulation is
ous day and the chemical LBCs are provided by the global clockwise and is stronger in winter (3–10 m s−1 ; Fig. 2d)
www.atmos-chem-phys.net/15/11201/2015/ Atmos. Chem. Phys., 15, 11201–11215, 201511204 R. J. Pope et al.: Evaluation of a regional air quality model using satellite column NO2 Figure 1. AQUM pressure anomalies (hPa) relative to the seasonal average (2007–2010) with the wind circulation overplotted. (a) Summer cyclonic, (b) summer anticyclonic, (c) winter cyclonic, and (d) winter anticyclonic, all derived from the Lamb weather types. Figure 2. AQUM wind speed (m s−1 ) for 2007–2010 with the wind circulation overplotted. (a) Summer cyclonic, (b) summer anticyclonic, (c) winter cyclonic, and (d) winter anticyclonic, all derived from the Lamb weather types. than summer (2–8 m s−1 ; Fig. 2b). Both the cyclonic regimes tic regimes, using Spearman’s rank test (Fig. 3). This yielded have anticlockwise circulation with stronger flow in winter correlations of between 0.47 and 0.69 at the 99.9 % signifi- (5–12 m s−1 ; Fig. 2c) than summer (4–10 m s−1 ; Fig. 2a). cance level. These are significant correlations showing con- We have also correlated the surface pressure spatial pattern sistency between the AQUM and NCEP surface pressure data from AQUM and NCEP, sampled under the seasonal synop- (the primary variable used to generate the LWTs). The most Atmos. Chem. Phys., 15, 11201–11215, 2015 www.atmos-chem-phys.net/15/11201/2015/
R. J. Pope et al.: Evaluation of a regional air quality model using satellite column NO2 11205
Figure 3. AQUM surface pressure vs. NCEP surface pressure (2006–2010), both composited under summer and winter cyclonic and anticy-
clonic conditions. The correlations are based on Spearman’s rank with a significance level of p < 0.001.
reliable method to examine the influence of meteorology on AMF is the atmospheric air mass factor and AMFtrop is the
AQUM column NO2 would be to apply the LWT algorithm tropospheric air mass factor. Initially, the AQUM NO2 profile
used by Jones et al. (2013) on the AQUM pressure fields is interpolated to the satellite pressure grid. The AKs are then
directly. However, as we have shown AQUM and NCEP to applied to the NO2 sub-columns using Eq. (2). The AQUM
have consistent meteorological fields, it is simpler to directly sub-columns are then summed up to the satellite tropopause
sample the AQUM under the existing LWTs. Therefore, we level. For more information on OMI tropospheric column
choose to sample AQUM column NO2 fields using the LWT NO2 we refer the reader to Boersma et al. (2008), and for
classifications derived from the NCEP reanalysis in Table 1. more information on the effect of OMI AKs on AQUM col-
umn NO2 see Pope et al. (2015).
3.2 OMI averaging kernels
Since OMI retrievals of column NO2 range in sensitivity with 4 Results
altitude, the OMI AKs must be applied to the model for rep-
resentative comparisons. The OMI retrievals use the Differ- 4.1 OMI tropospheric column NO2 –LWT
ential Optical Absorption Spectroscopy (DOAS) technique relationships: 2006–2010
and the AK is a column vector. Following Huijnen et al.
(2010) and the OMI documentation (Boersma et al., 2011b), As AQUM was run for 2006–2010, the OMI column NO2 –
the AKs are applied to the model as LWT analyses performed by Pope et al. (2014) are repeated
for this time period to assess whether the synoptic weather–
y = A · x, (1) AQ relationships are consistent between the 7-year period
presented in that study and the 5 years analysed here. Fig-
where y is the total column, A is the AK and x is the verti- ures 4 and 5 show the influences of cyclonic and anticy-
cal model profile. However, here the tropospheric column is clonic conditions in winter and summer on column NO2 from
needed: OMI. Again, summer ranges from April to September and
winter is October–March. These extended seasons give more
ytrop = Atrop · x trop , (2) temporal sampling of OMI column NO2 and better compos-
ites under the weather regimes. Under cyclonic conditions,
where Atrop is column NO2 is transported away from the source regions,
while anticyclonic conditions aid its accumulation. Figure 5
AMF highlights significant (95 % confidence level, based on the
Atrop = A · . (3)
AMFtrop Wilcoxon rank test; Pirovano et al., 2012) anomalies of up to
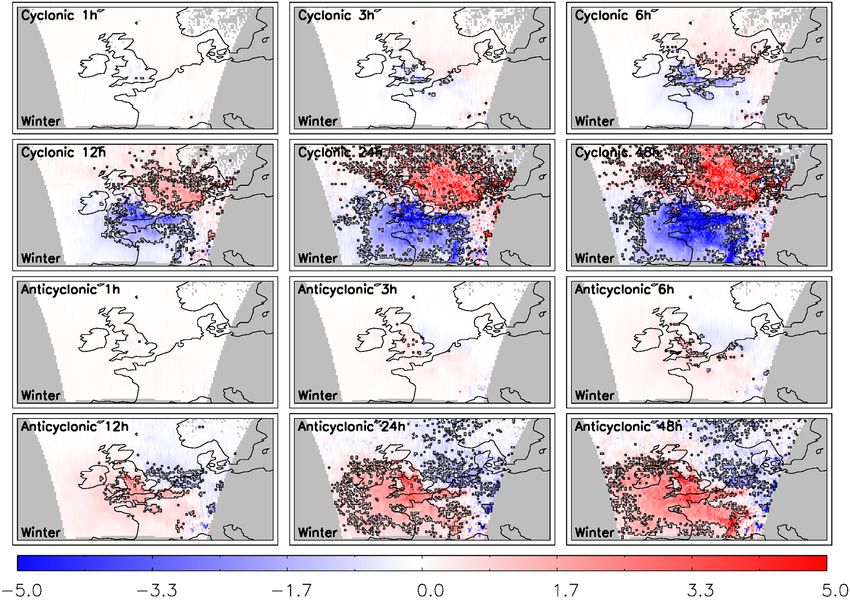
www.atmos-chem-phys.net/15/11201/2015/ Atmos. Chem. Phys., 15, 11201–11215, 201511206 R. J. Pope et al.: Evaluation of a regional air quality model using satellite column NO2 Figure 4. Composites of OMI tropospheric column NO2 (1015 molecules cm−2 ) for (a) summer cyclonic, (b) summer anticyclonic, (c) winter cyclonic, and (d) winter anticyclonic conditions during 2006–2010. Figure 5. Anomalies of OMI tropospheric column NO2 composites (calculated as the deviations with respect to the seasonal 5-year averages, 1015 molecules cm−2 ) for (a) summer cyclonic, (b) summer anticyclonic, (c) winter cyclonic, and (d) winter anticyclonic conditions. Black boxes indicate where the anomalies are statistically significant at the 95 % level. ±5 × 10¹⁵ molecules cm−2 over the North Sea and UK under nificant differences between the synoptic weather–air quality cyclonic conditions. The reverse is found under anticyclonic relationships based on the 5- and 7-year comparisons. Hence, conditions. The spatial extent of the anomalies is greatest in the LWT–OMI 5-year comparisons act as the baseline for winter for both vorticity regimes. Therefore, there are no sig- comparisons between AQUM column NO2 and the LWTs. Atmos. Chem. Phys., 15, 11201–11215, 2015 www.atmos-chem-phys.net/15/11201/2015/
R. J. Pope et al.: Evaluation of a regional air quality model using satellite column NO2                                11207

Figure 6. Composites of AQUM tropospheric column NO2 (1015 molecules cm−2 ) for (a) summer cyclonic, (b) summer anticyclonic,
(c) winter cyclonic, and (d) winter anticyclonic conditions (OMI AKs applied) during 2006–2010.

   This method does include some meteorological biases          Fig. 6c is indicative of cyclonic westerly transport off the UK
such as cloud cover and tropopause height under the syn-        mainland and the Benelux region, while larger source region
optic regimes. As cyclonic conditions (unstable weather) are    column NO2 in Fig. 6d highlights anticyclonic accumulation
associated with more cloud cover than anticyclonic condi-       of NO2 .
tions (more clear-sky days for OMI to retrieve NO2 on), the        When compared with OMI (Fig. 4c), AQUM sampled un-
NO2 composite sample size will be larger under anticyclonic     der the winter cyclonic conditions (Fig. 6c) shows transport
conditions. However, as shown by Pope et al. (2014), this       of more column NO2 over the North Sea ranging between
methodology of using the LWTs does involve sufficient satel-    5 and 8 × 10¹⁵ molecules cm−2 and covering a larger spatial
lite data to generate sensible column NO2 composites under      extent. Under anticyclonic conditions (Fig. 6d), AQUM col-
both vorticity regimes. The tropopause height will vary de-     umn NO2 is lower than OMI over the London and Benelux
pending on atmospheric vorticity, but this information is ac-   region by 2–3 × 10¹⁵ molecules cm−2 . However, AQUM col-
counted for in the retrieval process.                           umn NO2 is higher than OMI over northern England by 2–
                                                                3 × 10¹⁵ molecules cm−2 . The AQUM–OMI winter anticy-
4.2   AQUM tropospheric column NO2 –LWT                         clonic background column NO2 is similar, ranging between
      relationships                                             0–5 and 5–10 × 1015 molecules cm−2 over the sea and conti-
                                                                nental Europe, respectively.
AQUM column NO2 , composited under the LWTs, dis-                  Both OMI and AQUM show similar patterns in sum-
plays similar patterns to OMI (Fig. 6). For this comparison,    mer for both vorticity types, but with lower spatial ex-
AQUM output has been co-located spatially and temporally        tents than in winter. Interestingly, the OMI cyclonic UK
with each OMI retrieval and the averaging kernel applied.       source region column NO2 is larger in summer (8–
In winter, under cyclonic conditions AQUM column NO2            10 × 1015 molecules cm−2 ; Fig. 4a) than in winter (6–
ranges between 10 and 13 × 1015 molecules cm−2 over the         8 × 10¹⁵ molecules cm−2 ; Fig. 4c), but AQUM does not sim-
UK and Benelux source regions (Fig. 6c). Over the western       ulate this (Fig. 6a, c). AQUM summer cyclonic UK source re-
and eastern model domain, column NO2 ranges between 0–          gion NO2 ranges between 6–8 × 10¹⁵ molecules cm−2 , while
4 × 10¹⁵ molecules cm−2 and 5–8 × 10¹⁵ molecules cm−2 ,         in winter it is 10–12 × 1015 molecules cm−2 .
respectively. Under winter anticyclonic conditions col-            The AQUM and OMI transport and accumulation simi-
umn NO2 over UK and Benelux source regions is 16–               larities and differences can be seen in Figs. 5 and 7, which
20 × 1015 molecules cm−2 and the background column NO2          show anomalies of the composite averages calculated as dif-
ranges between 0 and 8 × 10¹⁵ molecules cm−2 (Fig. 6d).         ferences with respect to the 5-year seasonal means. Under
Larger background column NO2 over the North Sea in

www.atmos-chem-phys.net/15/11201/2015/                                        Atmos. Chem. Phys., 15, 11201–11215, 2015
11208 R. J. Pope et al.: Evaluation of a regional air quality model using satellite column NO2 Figure 7. Anomalies of AQUM tropospheric column NO2 composites (calculated as the deviations with respect to the seasonal 5-year aver- ages, 1015 molecules cm−2 ) for (a) summer cyclonic, (b) summer anticyclonic, (c) winter cyclonic, and (d) winter anticyclonic conditions (OMI AKs applied). winter cyclonic conditions, both AQUM (Fig. 7c) and OMI positive or negative significant anomalies. For instance, if an (Fig. 5c) show significant negative and positive anomalies anomaly cluster for AQUM has a smaller spatial extent than of similar magnitude over the UK and North Sea, respec- OMI, the error magnitudes will be larger where the two are tively. Winter anticyclonic conditions lead to an accumula- different, degrading the comparisons. Comparisons can also tion of AQUM (Fig. 7d) and OMI (Fig. 5d) column NO2 over be degraded if the anomalies in AQUM and OMI are similar the UK and the English Channel, causing significant posi- but offset slightly (e.g. should the model anomaly cluster be tive anomalies of 1–3 × 10¹⁵ molecules cm−2 . The summer offset to the east by 0.5◦ ). AQUM (Fig. 7a, b) and OMI (Fig. 5a, b) synoptic-column A more appropriate method to compare AQUM and OMI NO2 spatial patterns are similar in extent and magnitude. column NO2 under the four regimes, which we do here, is They are similar to the winter equivalents but cover a smaller to analyse both the spatial extent of the significant anoma- spatial extent. Therefore, on the regional scale, we can say lies and their magnitude. For each of the seasonal synop- that AQUM captures the OMI column NO2 –LWT relation- tic regimes the number of significant positive and nega- ships with similar significant anomalies from the period av- tive column NO2 anomalies (pixels) were calculated. This erage. represents the spatial extent of significance. The anomalies For a more complete dynamical model evaluation, the dif- were grouped into separate counts of the positive and neg- ferences between AQUM and OMI column NO2 have been ative anomaly clusters as they show independent features quantified. To compare the spatial extent of the anomaly across the model domain. To ascertain the magnitude of the fields from AQUM and OMI under the different seasonal anomaly clusters, the average positive and negative anomaly weather regimes, metrics such as correlation, slope of the was calculated. This means that the spatial extent and size linear regression, and RMSE could be used, but these have of the anomalies are both accounted for. We then define the limitations. Correlation only accounts for the spatial patterns cluster density to be the product of the respective cluster size of the anomalies and not the magnitude. Also, it does not ac- (i.e. number of pixels) and its average anomaly magnitude, count for the significance of the anomalies. Linear regression yielding should indicate the best AQUM–OMI agreement when tend- ing towards a 1 : 1 fit. However, this metric does not account φ ± = α± × η± , (4) for anomaly significance either. RMSE does not always give where φ is the anomaly cluster density, α represents the a good indication of the error in the anomaly field magnitudes size of the anomaly cluster, η is the average magnitude of or in the spatial extent of the significant anomaly clusters. the anomaly cluster and ± indicates if it is the positive Here, we use the term “cluster” to represent a grouping of or negative anomaly cluster density. The AQUM and OMI Atmos. Chem. Phys., 15, 11201–11215, 2015 www.atmos-chem-phys.net/15/11201/2015/
R. J. Pope et al.: Evaluation of a regional air quality model using satellite column NO2                                            11209

Table 2. Highlights the skill rank of the seasonal synoptic regimes for which AQUM can simulate column NO2 when compared with
OMI column NO2 using correlation, slope of regression, RMSE, and the method proposed here. 1: best AQUM–OMI agreement, 4: worst
AQUM–OMI agreement.

                Rank    Correlation              Regression               RMSE                      New method
                1       Summer Anticyclonic      Summer Anticyclonic      Summer Anticyclonic       Summer Cyclonic
                2       Summer Cyclonic          Summer Cyclonic          Summer Cyclonic           Winter Anticyclonic
                3       Winter Anticyclonic      Winter Cyclonic          Winter Anticyclonic       Winter Cyclonic
                4       Winter Cyclonic          Winter Anticyclonic      Winter Cyclonic           Summer Anticyclonic

anomaly cluster densities were then compared using the frac-
tional gross error (FGE). FGE is a normalized metric of
the model’s deviation from the observations, which performs
symmetrically with respect to under- and overprediction, and
is bounded by the values 0–2 (for more information see Sav-
age et al., 2013; Pope et al., 2015). In this study’s context,
the FGE is represented by

             φAQUM± − φOMI±
FGE± = 2                    .                                 (5)
             φAQUM± + φOMI±

   In Fig. 8, the AQUM–OMI positive and negative FGEs
for the four seasonal/synoptic cases are plotted against each
other in red. The smaller the FGE, the closer the AQUM–
OMI column NO2 comparisons are under the seasonal syn-
optic regimes. A goal zone of x = 0, y = 0 would show that             Figure 8. The fractional gross errors of the AQUM–OMI positive
AQUM can accurately simulate the column NO2 –LWT rela-                 and negative anomaly cluster densities are plotted against each other
tionships seen by OMI. However, this method only works if              for different seasonal synoptic regimes. The best agreement be-
the anomaly clusters are in similar locations in the AQUM              tween AQUM–OMI column NO2 is at the goal zone (x = 0, y = 0)
and OMI fields. From observation of Figs. 5 and 7, the                 showing no error. Zones 1–4 represent areas of skill ranging 0.0–
anomaly dipole clusters cover the same regions in both data            0.5, 0.5–1.0, 1.0–1.5, and 1.5–2.0. The lower the zone, the better
sets and spatial variances (R 2 ), discussed in more detail at the     the comparison is.
end of the section, show high associations between the two
(i.e. the anomaly clusters are in similar locations). Therefore,
we suggest that we can use this methodology to assess the              mostly to be a result of the smaller magnitude and extent
skill of AQUM in simulating seasonal synoptic relationships            of the negative anomalies in the proximity of the North Sea
seen in the OMI data by looking at the size and magnitude              within the model, where they are significant for much fewer
of the anomaly clusters. In Fig. 8 we have added four arbi-            pixels (Fig. 7b) than in the observations (Fig. 5b).
trary zones which indicate the closeness to the goal of x = 0,            In Table 2 we justify using our approach of using the
y = 0.                                                                 anomaly clusters and FGE when compared with other statis-
   Summer cyclonic conditions give the best comparisons                tical metrics. The table highlights the order in which AQUM
with positive and negative FGEs of approximately 0.4                   most successfully reproduces the OMI column NO2 anoma-
and 0.45, respectively. This falls in Zone 1, closest to the           lies when sampled under the seasonal synoptic regimes. Like
(0, 0) goal zone. Winter anticyclonic conditions have the              the correlation and RMSE, our method has summer cyclonic,
next best agreement as the negative FGE shows small dif-               winter anticyclonic, and winter cyclonic in the same order.
ferences of under 0.1. Therefore, AQUM under these con-                However, summer anticyclonic has the worst comparisons
ditions can accurately represent the OMI negative anomaly              using our method. This is because in the anomaly fields
pattern. However, the positive FGE is approximately 0.75               (Fig. 7), our method shows AQUM does not simulate sig-
resulting in a comparison skill in Zone 2. The winter cy-              nificant negative biases whereas the other metrics show the
clonic conditions present FGE values of approximately 0.7              best apparent agreement. This justifies our new method as it
for both anomaly clusters falling into Zone 2 as well. Sum-            takes into account the significance of the anomalies, unlike
mer anticyclonic conditions show the poorest comparisons               the other metrics.
falling in Zone 4 with reasonable agreement in the positive               The spatial variance (R 2 ) between AQUM and OMI col-
FGE of 0.4–0.5, but 1.5 in the negative FGE. This appears              umn NO2 anomalies (both significant and non-significant)

www.atmos-chem-phys.net/15/11201/2015/                                                Atmos. Chem. Phys., 15, 11201–11215, 2015
11210 R. J. Pope et al.: Evaluation of a regional air quality model using satellite column NO2
is 0.70, 0.61, 0.68, and 0.59 for summer anticyclonic, sum- portance of the processes can be determined as well as an
mer cyclonic, winter anticyclonic, and winter cyclonic con- approximation for the model lifetime of NO2 . Beirle et al.
ditions, respectively. This represents the proportion of spatial (2003) used GOME tropospheric column NO2 over Germany
variability in OMI column NO2 anomalies captured by the to estimate a summer lifetime of approximately 6 h and a
AQUM column NO2 anomalies for each seasonal synoptic winter lifetime of 18–24 h.
regime. For all the seasonal regimes, the association between As the chemistry of NOx is complex, with non-linear rela-
the AQUM and OMI anomaly fields is significantly large, tions via ozone, diurnal cycles and varying emissions, a sim-
with peak associations in the anticyclonic comparisons. As ple e-folding tracer will never truly match the NO2 distribu-
the associations are strong, the anomaly spatial patterns are tion. However, this approach is less complex than investigat-
located in similar locations, as can be seen in Figs. 5 and 7. ing chemical budgets and wind fields, which are not avail-
Therefore, this provides us with further confidence to use able from the AQUM for this study. Also, the direct lifetime
the methodology discussed in Eq. (5) to analyse the size and of NO2 cannot be determined as fluxes through the model
spread of the significant anomalies for each seasonal synop- boundaries are likely a strong sink or source under differ-
tic regime. Interestingly, even though AQUM does not sim- ent conditions. Therefore, the tracers will indicate transport
ulate the significant negative anomalies over the North Sea and chemical representation to a first-order approximation,
(worst comparisons in Fig. 8) under summer anticyclonic and can be used to answer questions such as “Does the use
conditions (Fig. 7b), it does capture the spatial variability of tracers support the well-known fact that the chemical life-
in the OMI anomalies (Fig. 5b) better than under the other time of NO2 is shorter in summer than in winter? If so, does
regimes. However, the two metrics were used to look at dif- synoptic meteorology have a smaller effect on NO2 columns
ferent objectives. As stated above, the R 2 values show the in summer than in winter?”.
spatial agreement between the AQUM and OMI anomaly The same method of compositing AQUM column NO2
fields, while the cluster and FGE analyses focus on the sig- has been applied to the e-folding tracer columns. The tracer
nificance and magnitude of the anomaly clusters. anomalies under the seasonal synoptic conditions are shown
in Fig. 9 (summer) and Fig. 10 (winter) with OMI AKs ap-
4.3 AQUM tropospheric column tracer–LWT plied. The tracers successfully reproduce the spatial patterns
relationships seen in the AQUM and OMI column NO2 sampled under
the different seasonal synoptic regimes. However, the area
Section 4.2 has shown that AQUM successfully reproduces size of the tracer anomalies (both the negative and posi-
the relationships seen by OMI column NO2 when sampled tive clusters) are a function of the tracer lifetime. In the
under the LWTs. Therefore, AQUM can be used as a tool case of the tracers with 1 and 3 h lifetimes (tracer1 and
to diagnose the influence of meteorology and chemistry on tracer3 ), the anomaly cluster areas are small. The short life-
the distribution of NO2 under the seasonal weather regimes. time means that there is less column tracer to be accumu-
Here, idealized tracers are introduced into AQUM with e- lated or transported under anticyclonic or cyclonic regimes.
folding lifetimes of 1, 3, 6, 12, 24, and 48 h. They are With the longer lifetimes, tracer24 and 48 , these anomaly clus-
emitted with the same loading and over the same locations ter areas cover a larger proportion of the domain. This pat-
as the model NOx . This method of using e-folding tracers tern can be seen in Fig. 11, where as the lifetime increases
has been applied in inverse modelling of NOx emissions from 1 to 48 h, the cluster size of significant pixels (posi-
from satellite data. For example, Richter et al. (2004) used tive and negative totals combined) increases from a fraction
SCIAMACHY (Scanning Imaging Absorption Spectrometer of 0.0 to 0.3–0.5 (depending on seasonal synoptic regime).
for Atmospheric CHartographY) column NO2 measurements This clearly shows that the lifetime of the tracer is important
and simple approximations of NOx loss (i.e. a fixed life- and has an impact on the spatial pattern (area size) of the
time of NOx ) to estimate shipping emissions over the Red tracer column anomalies.
Sea. These idealized tracers will indicate the importance of The summer and winter anticyclonic curves in Fig. 11 are
transport and atmospheric chemistry governing the relation- very similar reaching approximately 0.35 for tracer48 . This
ships between column NO2 and seasonal synoptic weather. suggests that under anticyclonic conditions differences in
If transport is the main factor governing the air quality dis- meteorology between the two seasons have relatively lit-
tribution under the different synoptic regimes, then a fixed tle impact on the area of significant tracer columns. Thus,
lifetime tracer would have similar anomaly fields to NO2 . On the chemistry is playing an important role in the summer to
the other hand, if changes in chemistry are driving or signif- winter differences in the spatial distributions. However, un-
icantly contributing to the different regime anomalies, then a der cyclonic conditions, the winter anomalies are somewhat
certain fixed lifetime tracer would be unable to capture the larger than the summer ones, reaching approximately 0.51
observed differences. Therefore, depending on which of the and 0.47, respectively, for tracer48 . Here differences in me-
tracers with different lifetimes results in anomaly fields most teorology between summer and winter are playing a more
similar to the AQUM column NO2 anomalies, for winter and active role suggesting that winter cyclonic systems are more
summer cyclonic and anticyclonic regimes, the relative im- intense than summer equivalents. In Fig. 2 the AQUM win-
Atmos. Chem. Phys., 15, 11201–11215, 2015 www.atmos-chem-phys.net/15/11201/2015/R. J. Pope et al.: Evaluation of a regional air quality model using satellite column NO2 11211 Figure 9. Summer AQUM column tracer anomalies (1015 molecules cm−2 ) with different lifetimes for cyclonic and anticyclonic conditions (OMI AKs applied). Figure 10. Winter AQUM column tracer anomalies (1015 molecules cm−2 ) with different lifetimes for cyclonic and anticyclonic conditions (OMI AKs applied). www.atmos-chem-phys.net/15/11201/2015/ Atmos. Chem. Phys., 15, 11201–11215, 2015
11212                                                                                                  R. J. Pope et al.: Evaluation of a regional air quality model using satellite column NO2

                                                            0.6
 Fraction of Significant Cluster Pixels Across the Domain

                                                            0.5    Summer Anticyclonic
                                                                   Summer Cyclonic
                                                                   Winter Anticyclonic
                                                            0.4    Winter Cyclonic

                                                            0.3

                                                            0.2

                                                            0.1

                                                            0.0
                                                               1                3          6               12      24        48
                                                                                         Tracer Lifetime (hours)

Figure 11. Proportion of the AQUM domain covered by signifi-                                                                        Figure 12. The same as Fig. 8 but for the anomaly cluster densi-
cant anomaly pixels as a function of tracer lifetime for the dif-                                                                   ties of AQUM column NO2 –AQUM tracer columns. The different
ferent seasonal synoptic regimes. Red, blue, black, and green rep-                                                                  colours refer to the AQUM tracer experiments with e-folding life-
resents the summer anticyclonic, summer cyclonic, winter anticy-                                                                    times of 1, 3, 6, 12, 24, and 48 h.
clonic, and winter cyclonic conditions, respectively. Dashed lines
represent the approximate lifetime of AQUM column NO2 under
the seasonal synoptic regimes based on the domain proportion of
                                                                                                                                    times are 6.0, 4.5, 11.0, and 7.0 h, respectively. This supports
significant anomalies (pixels) in Fig. 7.
                                                                                                                                    the tracer results in that summer NO2 lifetimes are shorter
                                                                                                                                    than in winter, similar to the result of Beirle et al. (2003). It
                                                                                                                                    should be noted though that this approach does not take into
ter cyclonic wind speed ranges between 5 and 12 m s−1 . In                                                                          account the magnitude of the anomalies.
summer, the equivalent summer cyclonic wind speed ranges                                                                               Having found the best representations of the seasonal syn-
between 4 and 10 m s−1 . Therefore, the cyclonic wind speeds                                                                        optic regimes’ lifetimes, the respective tracer anomaly fields
are stronger in winter. Thus, the stronger transport in win-                                                                        were correlated against the AQUM column NO2 anomalies.
ter probably explains the difference in the cyclonic curves in                                                                      Since the tracer lifetime was fixed, the variance between the
Fig. 11.                                                                                                                            tracer fields and the column NO2 represents the proportion of
   The analysis performed previously for the FGEs of the                                                                            meteorological variability in the spatial pattern of the anoma-
AQUM and OMI column NO2 anomaly cluster densities                                                                                   lies within the season (the emissions for each seasonal syn-
(Fig. 8) was repeated for the FGEs of the AQUM column                                                                               optic regime NO2 – tracer comparison are equal). The vari-
NO2 and tracer column anomaly cluster densities in Fig. 12.                                                                         ances (R 2 ) are 0.92, 0.87, 0.80, and 0.75 for the summer an-
Therefore, in Eq. (5), φAQUM± has been replaced with φtracer±                                                                       ticyclonic, summer cyclonic, winter anticyclonic, and winter
and φOMI± has been replaced with φAQUM± . The aim is                                                                                cyclonic conditions, respectively. Therefore, a large propor-
to find which tracer lifetimes most accurately represent the                                                                        tion of the seasonal variability in the spatial patterns, under
NO2 lifetime under the seasonal synoptic regimes. Overall,                                                                          the seasonal synoptic regimes, is explained by the meteorol-
tracers1, 3 and 48 have the least accurate lifetimes with skill                                                                     ogy (e.g. transport) and the remaining variability is due to the
comparisons in Zone 4, because the domain coverage of the                                                                           chemistry and emissions.
tracer anomalies is either too small or too large (the win-
ter tracer48 regimes fall into Zone 3). The most accurate
tracer lifetime for summer cyclonic and anticyclonic regimes                                                                        5   Conclusions
is tracer6 , with FGE values between 0.3 (Zone 1) and 0.6–
0.7 (Zone 2), respectively. The winter cyclonic and anticy-                                                                         The LWTs (cyclonic and anticyclonic)–OMI tropospheric
clonic regimes are most accurately represented by tracer12 ;                                                                        column NO2 relationships discussed by Pope et al. (2014) for
both of them fall into Zone 1 with FGE values lower than 0.4.                                                                       a 7-year period have been analysed for the 2006–2010 period
This is more consistent with chemical processes in summer                                                                           simulated by AQUM in order to investigate the model’s abil-
than winter acting as a loss of NO2 . To verify this result,                                                                        ity to capture the impact of synoptic weather on tropospheric
the AQUM column NO2 significant anomaly domain fraction                                                                             column NO2 .
was calculated at 0.02, 0.04, 0.07, and 0.09 for summer an-                                                                            AQUM column NO2 , composited in the same way as OMI
ticyclonic, summer cyclonic, winter anticyclonic, and winter                                                                        data by using the LWTs directly, successfully captured the
cyclonic conditions, respectively. Reading across to the re-                                                                        OMI column NO2 anomalies for cyclonic and anticyclonic
spective tracer profiles in Fig. 11, the approximate NO2 life-                                                                      LWT conditions. Under anticyclonic conditions, AQUM col-

Atmos. Chem. Phys., 15, 11201–11215, 2015                                                                                                           www.atmos-chem-phys.net/15/11201/2015/
R. J. Pope et al.: Evaluation of a regional air quality model using satellite column NO2 11213
umn NO2 accumulates over the source regions, while it is References
transported away under cyclonic conditions. This also shows
that the representation of weather systems through the model Beirle, S., Platt, U., Wenig, M., and Wagner, T.: Weekly cycle of
LBCs is sufficiently consistent with the NCEP reanalyses NO2 by GOME measurements: a signature of anthropogenic
sources, Atmos. Chem. Phys., 3, 2225–2232, doi:10.5194/acp-
that the LWTs derived from NCEP can be used to investigate
3-2225-2003, 2003.
the influence of synoptic weather regimes on air quality. Beirle, S., Boersma, K. F., Platt, U., Lawrence, M. G., and
To determine which processes are important in driving Wagner, T.: Megacity emissions and lifetimes of nitro-
these relationships, idealized tracers were introduced into the gen oxides probed from space, Science, 333, 1737–1739,
model using the NOx emission sources and selected lifetimes doi:10.1126/science.1207824, 2011.
ranging from 1 to 48 h. The tracers reproduce the AQUM col- Bellouin, N., Rae, J., Jones, A., Johnson, C., Haywood, J., and
umn NO2 anomaly fields under the different seasonal synop- Boucher, O.: Aerosol forcing in the Climate Model Intercompar-
tic regimes, but the relationships found depend heavily on the ison Project (CMIP5) simulations by HadGEM2-ES and the role
lifetime. A 1 h lifetime was clearly too short and a 48 h life- of ammonium nitrate, J. Geophys. Res.-Atmos., 116, D20206,
time clearly too long, resulting in smaller/larger anomaly pat- doi:10.1029/2011JD016074, 2011.
terns when compared with the model column NO2 . The most Boersma, K., Jacob, D., Bucsela, E., Perring, A., Dirksen, R., van
der A, R., Yantosca, R., Park, R., Wenig, M., Bertram, T., and
representative tracer lifetimes are 6 h in summer and 12 h in
Cohen, R.: Validation of OMI tropospheric NO2 observations
winter, which is consistent with enhanced photochemistry in during INTEX-B and application to constrain emissions over the
summer. The variance (R 2 ) between the most representative eastern United States and Mexico, Atmos. Environ., 42, 4480–
tracer lifetimes for the seasonal synoptic regimes and the cor- 4497, doi:10.1016/j.atmosenv.2008.02.004, 2008.
responding AQUM column NO2 spatial anomaly fields were Boersma, K. F., Eskes, H. J., Dirksen, R. J., van der A, R. J.,
calculated. This resulted in R 2 values ranging between 0.75 Veefkind, J. P., Stammes, P., Huijnen, V., Kleipool, Q. L., Sneep,
and 0.92. Therefore, within seasons (i.e. summer and winter), M., Claas, J., Leitão, J., Richter, A., Zhou, Y., and Brunner, D.:
under the synoptic regimes, a large proportion of the spatial An improved tropospheric NO2 column retrieval algorithm for
pattern in the UK column NO2 fields can be explained by the ozone monitoring instrument, Atmos. Meas. Tech., 4, 1905–
these tracers, suggesting that transport is a significant fac- 1928, doi:10.5194/amt-4-1905-2011, 2011a.
tor in governing the variability of UK air quality on seasonal Boersma, K., Braak, R., and van der A, R.: Dutch OMI
NO2 (DOMINO) data product v2.0, Tropospheric Emissions
synoptic timescales. We also show that cyclonic conditions
Monitoring Internet Service on-line documentation, avail-
have more seasonality than anticyclonic conditions as winter
able at: http://www.temis.nl/docs/OMI_NO2_HE5_2.0_2011.
cyclonic conditions result in more extreme spatial column pdf (last access: January 2015), 2011b.
NO2 distributions from the seasonal average. Braak, R.: Row Anomaly Flagging Rules Lookup Table, KNMI
This study shows that to a first-order approximation atmo- Technical Document TN-OMIE-KNMI-950, KMNI, De Bilt, the
spheric chemistry is, as expected, more influential in summer Netherlands, 2010.
than in winter. During summer the NO2 lifetime decreases Demuzere, M., Trigo, R. M., Vila-Guerau de Arellano, J., and van
due to enhanced NO2 photolysis and OH chemistry, which Lipzig, N. P. M.: The impact of weather and atmospheric cir-
explains the less spatially significant synoptic weather–air culation on O3 and PM10 levels at a rural mid-latitude site, At-
pollution relationships detected for that season in OMI col- mos. Chem. Phys., 9, 2695–2714, doi:10.5194/acp-9-2695-2009,
umn NO2 (Pope et al., 2014). This work also shows that the 2009.
Dennis, R., Fox, T., Fuentes, M., Gilliland, A., Hanna, S.,
Met Office AQUM can reproduce the large-scale accumula-
Hogrefe, C., Irwin, J., Rao, S., Scheffe, R., Schere, K., Steyn, D.,
tion of tropospheric column NO2 over the UK under anticy-
and Venkatram, A.: A framework for evaluating regional-scale
clonic conditions. numerical photochemical modelling systems, Environ. Fluid
As follow-on work from this study, we intend to perform Mech., 10, 471–489, doi:10.1007/s10652-009-9163-2, 2010.
a sensitivity analysis of different AQUM production and loss Eckhardt, S., Stohl, A., Beirle, S., Spichtinger, N., James, P., Forster,
processes of NO2 to determine the governing factors on the C., Junker, C., Wagner, T., Platt, U., and Jennings, S. G.: The
distribution of column NO2 . North Atlantic Oscillation controls air pollution transport to the
Arctic, Atmos. Chem. Phys., 3, 1769–1778, doi:10.5194/acp-3-
1769-2003, 2003.
Hayn, M., Beirle, S., Hamprecht, F. A., Platt, U., Menze, B. H.,
Acknowledgements. We acknowledge the use of the Tropospheric
and Wagner, T.: Analysing spatio-temporal patterns of the global
Emissions Monitoring Internet Service (TEMIS) OMI data set
NO2 -distribution retrieved from GOME satellite observations us-
and the LWT data from the Climatic Research Unit, University of
ing a generalized additive model, Atmos. Chem. Phys., 9, 6459–
East Anglia, used in this study. This work was supported by the
6477, doi:10.5194/acp-9-6459-2009, 2009.
UK Natural Environment Research Council (NERC) by providing
Hollingsworth, A., Engelen, R., Benedetti, A., Dethof, A., Flem-
funding to the National Centre for Earth Observation.
ming, J., Kaiser, J., Morcrette, J., Simmons, A., Textor, C.,
Boucher, O., Chevallier, F., Rayner, P., Elbern, H., Eskes, H.,
Edited by: P. Monks
Granier, C., Peuch, V.-H., Rouil, L., and Schultz, M. G.: Towards
a monitoring and forecasting system for atmospheric composi-
www.atmos-chem-phys.net/15/11201/2015/ Atmos. Chem. Phys., 15, 11201–11215, 201511214 R. J. Pope et al.: Evaluation of a regional air quality model using satellite column NO2
tion: the GEMS project, B. Am. Meteorol. Soc., 89, 1147–1164, McGregor, G. and Bamzelis, D.: Synoptic typing and its application
2008. to the investigation of weather air pollution relationships, Birm-
Huijnen, V., Eskes, H. J., Poupkou, A., Elbern, H., Boersma, K. F., ingham, United Kingdom, Theor. Appl. Climatol., 51, 223–236,
Foret, G., Sofiev, M., Valdebenito, A., Flemming, J., Stein, O., doi:10.1007/BF00867281, 1995.
Gross, A., Robertson, L., D’Isidoro, M., Kioutsioukis, I., Friese, O’Connor, F. M., Johnson, C. E., Morgenstern, O., Abraham, N.
E., Amstrup, B., Bergstrom, R., Strunk, A., Vira, J., Zyryanov, L., Braesicke, P., Dalvi, M., Folberth, G. A., Sanderson, M. G.,
D., Maurizi, A., Melas, D., Peuch, V.-H., and Zerefos, C.: Com- Telford, P. J., Voulgarakis, A., Young, P. J., Zeng, G., Collins,
parison of OMI NO2 tropospheric columns with an ensemble of W. J., and Pyle, J. A.: Evaluation of the new UKCA climate-
global and European regional air quality models, Atmos. Chem. composition model – Part 2: The Troposphere, Geosci. Model
Phys., 10, 3273–3296, doi:10.5194/acp-10-3273-2010, 2010. Dev., 7, 41–91, doi:10.5194/gmd-7-41-2014, 2014.
Inness, A., Baier, F., Benedetti, A., Bouarar, I., Chabrillat, S., Clark, Osborn, T. J.: Recent variations in the winter North Atlantic Oscil-
H., Clerbaux, C., Coheur, P., Engelen, R. J., Errera, Q., Flem- lation, Weather, 61, 353–355, doi:10.1256/wea.190.06, 2006.
ming, J., George, M., Granier, C., Hadji-Lazaro, J., Huijnen, Pirovano, G., Balzarini, A., Bessagnet, B., Emery, C., Kallos, G.,
V., Hurtmans, D., Jones, L., Kaiser, J. W., Kapsomenakis, J., Meleux, F., Mitsakou, C., Nopmongcol, U., Riva, G., and
Lefever, K., Leitão, J., Razinger, M., Richter, A., Schultz, M. G., Yarwood, G.: Investigating impacts of chemistry and transport
Simmons, A. J., Suttie, M., Stein, O., Thépaut, J.-N., Thouret, V., model formulation on model performance at European scale, At-
Vrekoussis, M., Zerefos, C., and the MACC team: The MACC mos. Environ., 53, 93–109, doi:10.1016/j.atmosenv.2011.12.052,
reanalysis: an 8 yr data set of atmospheric composition, Atmos. 2012.
Chem. Phys., 13, 4073–4109, doi:10.5194/acp-13-4073-2013, Pope, R., Savage, N., Chipperfield, M., Arnold, S., and Osborn, T.:
2013. The influence of synoptic weather regimes on UK air quality:
Irie, H., Kanaya, Y., Akimoto, H., Tanimoto, H., Wang, Z., Gleason, analysis of satellite column NO2 , Atmos. Sci. Lett., 15, 211–217,
J. F., and Bucsela, E. J.: Validation of OMI tropospheric NO2 doi:10.1002/asl2.492, 2014.
column data using MAX-DOAS measurements deep inside the Pope, R., Chipperfield, M., Savage, N., Ordóñez, C., Neal, L., Lee,
North China Plain in June 2006: Mount Tai Experiment 2006, At- L., Dhomse, S., Richards, N., and Keslake, T.: Evaluation of a
mos. Chem. Phys., 8, 6577–6586, doi:10.5194/acp-8-6577-2008, regional air quality model using satellite column NO2 : treatment
2008. of observation errors and model boundary conditions and emis-
Jenkinson, A. and Collison, F.: An initial climatology of gales over sions, Atmos. Chem. Phys., 15, 5611–5626, doi:10.5194/acp-15-
the North Sea, in: Synoptic Climatology Branch Memorandum 5611-2015, 2015.
No. 62, Meteorological Office, Bracknell, 1977. Richter, A., Eyring, V., Burrows, J. P., Bovensmann, H., Lauer, A.,
Jones, P. D., Jonsson, T., and Wheeler, D.: Extension to Sierk, B., and Crutzen, P. J.: Satellite measurements of NO2
the North Atlantic oscillation using early instrumental pres- from international shipping emissions, Geophys. Res. Lett., 31,
sure observations from Gibraltar and south-west Iceland, L23110, doi:10.1029/2004GL020822, 2004.
Int. J. Climatol., 17, 1433–1450, doi:10.1002/(SICI)1097- Savage, N. H., Pyle, J. A., Braesicke, P., Wittrock, F., Richter, A.,
0088(19971115)17:133.0.CO;2-P, 1997. Nüß, H., Burrows, J. P., Schultz, M. G., Pulles, T., and van
Jones, P. D., Harpham, C., and Briffa, K. R.: Lamb weather types Het Bolscher, M.: The sensitivity of Western European NO2
derived from reanalysis products, Int. J. Climatol., 33, 1129– columns to interannual variability of meteorology and emissions:
1139, doi:10.1002/joc.3498, 2013. a model-GOME study, Atmos. Sci. Lett., 9, 182–188, 2008.
Jones, P. D., Osborn, T. J., Harpham, C., and Briffa, K. R.: The Savage, N. H., Agnew, P., Davis, L. S., Ordóñez, C., Thorpe, R.,
development of Lamb weather types: from subjective analy- Johnson, C. E., O’Connor, F. M., and Dalvi, M.: Air quality mod-
sis of weather charts to objective approaches using reanalyses, elling using the Met Office Unified Model (AQUM OS24-26):
Weather, 69, 128–132, doi:10.1002/wea.2255, 2014. model description and initial evaluation, Geosci. Model Dev., 6,
Kalnay, E., Kanamitsuand, M., Kistler, R., Collins, W., Deaven, D., 353–372, doi:10.5194/gmd-6-353-2013, 2013.
Gandin, L., Iredell, M., Saha, S., White, G., Wollen, J., Zhu, Y., Tang, L., Rayner, D., and Haeger-Eugensson, M.: Have meteoro-
Chelliah, M., Ebisuzaki, W., Higgins, W., Janowiak, J., Mo, K., logical conditions reduced NO2 concentrations from local emis-
Ropelewski, C., Wang, J., Leetmaa, A., Reynolds, R., Jenne, R., sion sources in Gothenburg?, Water Air Soil Poll., 221, 275–286,
and Joseph, D.: The NCEP/NCAR 40 year reanalysis project, B. doi:10.1007/s11270-011-0789-6, 2011.
Am. Meteorol. Soc., 77, 437–471, 1996. Thomas, M. A. and Devasthale, A.: Sensitivity of free tropospheric
Lamb, H.: British Isles weather types and a register of daily carbon monoxide to atmospheric weather states and their per-
sequence of circulation patterns, 1861–1971, in: Geophysical sistency: an observational assessment over the Nordic coun-
Memoir, HMSO, London, 116, 85, 1972. tries, Atmos. Chem. Phys., 14, 11545–11555, doi:10.5194/acp-
Lesniok, M., Malarzewski, L., and Niedzwiedz, T.: Classification of 14-11545-2014, 2014.
circulation types for Southern Poland with an application to air Visschedijk, A., Zanveld, P., and van der Gon, H.: A high
pollution concentration in Upper Silesia, Phys. Chem. Earth, 35, resolution gridded European emission database for the EU
516–522, doi:10.1016/j.pce.2009.11.006, 2010. integrated project GEMS, TNO report 2007-A-R0233/B,
Netherlands Organisation for Applied Scientific Research, the
Netherlands, http://lap.physics.auth.gr/gems/docu/TNO_Short_
Emissions_Report.pdf (last access: October 2015), 2007.
Atmos. Chem. Phys., 15, 11201–11215, 2015 www.atmos-chem-phys.net/15/11201/2015/You can also read