Spatial Patterns of China's Ski Resorts and Their Influencing Factors: A Geographical Detector Study
←
→
Page content transcription
If your browser does not render page correctly, please read the page content below
sustainability

Article
Spatial Patterns of China’s Ski Resorts and Their Influencing
Factors: A Geographical Detector Study
Yan Fang 1 , Yiyi Jiang 1, *, Chin-Hsun Ken Tsai 2 , Binghao Luo 1 and Ming-Hsiang Chen 3

                                          1   School of Recreational Sports and Tourism, Beijing Sport University, Beijing 100084, China;
                                              fangyan@bsu.edu.cn (Y.F.); 1004320180814@bsu.edu.cn (B.L.)
                                          2   Department of Apparel, Events, and Hospitality Management, College of Human Sciences,
                                              Iowa State University, Ames, IA 50011-1078, USA; kentsai@iastate.edu
                                          3   School of Hospitality Business Management, Carson College of Business, Washington State University,
                                              Pullman, WA 99164-4742, USA; ming-hsiang.chen@wsu.edu
                                          *   Correspondence: yiyijiang@bsu.edu.cn

                                          Abstract: This study uses geographic information systems (GIS) and geographical detector techniques
                                          to explore the national and regional pattern of the spatial distribution of China’s ski resorts, and
                                          quantitatively identifies the main factors that influence their location. Results show that although
                                          China’s ski areas are geographically clustered, ski resorts are more likely to be located at high
                                          latitudes (northeast and northwest China) than at low latitudes (central and south China). Among
                                          the most influential factors are the winter sporting mega-events that explain 70% of the location of
                                          China’s ski areas; the 2022 Winter Olympics accounted for 14%. The main factors that contribute to
                                          the distribution of ski areas depend on the regions and types of ski resorts. Implications for the ski
                                          resorts industry, such as the different practice for hot and cold spot areas of China’s ski resorts, and

                                   the future development direction of ski industry, are discussed.

Citation: Fang, Y.; Jiang, Y.; Tsai,
                                          Keywords: ski resorts; geographic information systems (GIS); spatial analysis; geographical detector;
C.-H.K.; Luo, B.; Chen, M.-H. Spatial
Patterns of China’s Ski Resorts and
                                          influence factors; Winter Olympics
Their Influencing Factors: A
Geographical Detector Study.
Sustainability 2021, 13, 4232.
https://doi.org/10.3390/su13084232        1. Introduction
                                               Sports tourism, one of the world’s fastest-growing travel and tourism sectors, is
Academic Editor: Gema Cárdenas            becoming crucial for destination planning and development [1]. With the introduction of
                                          leisure and sports activities in the second half of the 20th century, many mountain areas
Received: 18 February 2021
                                          have become attractive tourist destinations [2]. Ski resort-based tourism, including services
Accepted: 7 April 2021
                                          and infrastructure improvement, economic and income diversification, and the creation of
Published: 10 April 2021
                                          “psychological stability” among residents [3], is a pillar of the tourism industry in many
                                          mountain areas. For example, ski tourism accounts for approximately 4.5% of Austria’s
Publisher’s Note: MDPI stays neutral
                                          GNP, which is about half of the country’s total tourism revenue [4]. The socioeconomic
with regard to jurisdictional claims in
                                          of ski resort-based tourism in Alpine countries epitomizes the transformation of sporting
published maps and institutional affil-
                                          activities into industrially produced and consumed outdoor leisure activities [5]. The
iations.
                                          world’s 2000 outdoor ski resorts and 90 indoor snow centers have attracted approximately
                                          400 million skiers over the last 18 years [6].
                                               In contrast to the mature ski tourism markets in many countries of Europe and North
                                          America, the ski industry in China is an apparent emerging market. With significant growth
Copyright: © 2021 by the authors.
                                          over the last two decades, China has now become one of the world’s largest ski tourism
Licensee MDPI, Basel, Switzerland.
                                          markets, reaching 19.7 million skier visits and 742 ski resorts in 2018 [7]. It will soon surpass
This article is an open access article
                                          some global leaders such as Switzerland (with 21.2 million skier visits in the 2016–2017
distributed under the terms and
                                          season) [8]. Ski tourism in China began in 1996 and has boomed in the last decade; however,
conditions of the Creative Commons
                                          skiing participation rates in China (currently at only 1% of the global average) are still
Attribution (CC BY) license (https://
creativecommons.org/licenses/by/
                                          considerably lower than in other countries [8]. This growth has been driven by the increase
4.0/).
                                          in personal wealth, which has led to a large increase in domestic and inbound tourism.

Sustainability 2021, 13, 4232. https://doi.org/10.3390/su13084232                                      https://www.mdpi.com/journal/sustainability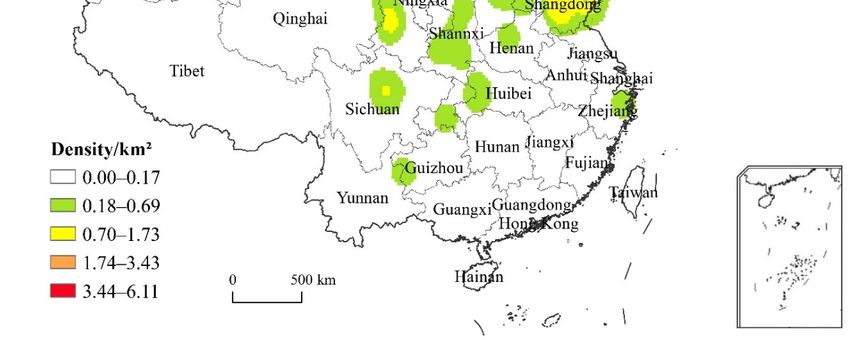
Sustainability 2021, 13, 4232                                                                                           2 of 16

                                The 2022 Winter Olympics will strengthen winter sports in China, because the government
                                has enacted a series of policies to build China’s skiing industry. According to China’s
                                government, 800 ski resorts will be built by 2022. More than 300 million Chinese people are
                                expected to participate in winter sports by 2025, generating USD 155.4 billion in revenue
                                for the ski industry alone [9].
                                      Ski areas are essential facilities for skiing, which are important for the development of
                                ski tourism and the regional economy. Geographical inequalities, however, are identified
                                in the distribution of ski resorts. More than one-third of all ski resorts in the world are
                                located in the Alpine region, capturing 43% of skiers’ visits, followed by North America
                                (21%) [6]. The uneven spatial distribution of ski areas is also observed in China, where 60%
                                of ski areas are located in the north and northeast [7]. In mature ski tourism markets, a
                                critical factor in the location of ski areas are the natural resources [10]. The number of ski
                                resorts seems to have stabilized. In China, however, more ski resorts are being built.
                                      In order to better understand and predict the development of the ski industry, it is
                                important to understand spatial patterns in the distribution of ski resorts at the regional
                                scale as well as the main factors of influence. By combining spatial analysis based on
                                geographic information systems, we propose a new approach—the geographical detector—
                                which explores the national and regional pattern of the spatial distribution of China’s ski
                                resorts, identifies the main factors that influence the location of ski resorts, and provides
                                useful information for planning and marketing purposes, such as how to predict and
                                select locations for different types of ski resorts, and develop sound marketing strategies
                                according to the distribution pattern.
                                      The research contribution is threefold. This paper, unlike similar studies, is based on a
                                quantitative rather than a qualitative methodology. No studies in the literature [11,12] on
                                spatial analysis in tourism research have used spatial tools to detect regional differences
                                in influence. For this reason, we used the geographical detector to analyze factors that
                                influence the distribution of ski resorts from a spatial perspective, and to determine whether
                                there are significant regional variations in the impact of those factors.
                                      In addition, although some studies have examined the nationwide spatial distribution
                                of China’s ski resorts [13,14], their results were less accurate due to considerable regional
                                differences. China has ski resorts in 28 provinces [7]; therefore, it is essential to explore
                                spatial distribution and influencing factors in different areas. Lastly, the literature has
                                not distinguished ski resorts with markedly different snow qualities [13,14]. Although
                                there are more than 700 ski areas across China, fewer than 10% of them meet international
                                standards for high quality [15]. In other words, most of them are either poorly equipped
                                or are suitable only for novice skiers. In these circumstances, it is necessary to determine
                                the extent to which the geographical distribution of ski areas with and without aerial lifts
                                varies across China.
                                      The rest of the paper is organized as follows. The next section presents the literature
                                on possible factors affecting the spatial distribution of China’s ski resorts. Section 3
                                describes the research methodology and data sources. Section 4 identifies the pattern of the
                                spatial distribution of China’s ski resorts, followed by a quantitative analysis of the spatial
                                distribution factors. The last section presents the main findings.

                                2. Review of the Literature
                                2.1. Factors That Influence the Distribution of Ski Resorts
                                     Current research shows that natural, economic, and social factors can be used to
                                identify possible ski towns [10]. Ground factors and climatic variables are central in
                                determining whether or not a ski resort can be built. The minimum criterion for a ski area
                                is adequate snowfall, which depends on low temperatures, precipitation, air humidity, and
                                prevailing winds [10,16].
                                     As far as the topography is concerned, slope is an element that separates novice from
                                expert skiers. Elevation is essential for skiing activities and the maintenance of a favorable
                                snow layer [17]. Moreover, a water source would be beneficial for snowmaking [18]. For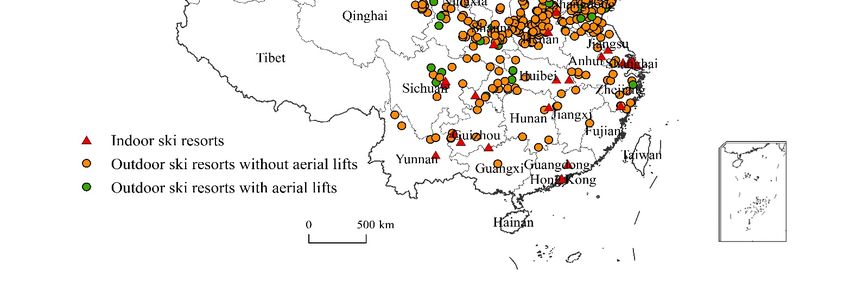
Sustainability 2021, 13, 4232                                                                                            3 of 16

                                example, at Colorado’s White River National Forest, 20–30 cm of snow are added to the
                                slopes at each resort by snowmaking runs. The water used for snowmaking is pumped
                                from the White River below the ski slopes and transported to snowmaking basins [19].
                                      Sporting mega-events, most notably the Olympic Games, not only support the con-
                                struction of new sports facilities, but also foster investments in tourism development (e.g.,
                                the dramatic increase in hotel accommodation capacity) [20]. Tourist and recreation func-
                                tions are provided by these sports facilities and infrastructure, which usually contribute to
                                winter tourism and community amenities [21]. Winter sports events are therefore important
                                in the development of infrastructure and skiing culture [22], particularly in areas where
                                the ski industry is still lagging behind. Bidding and holding sporting mega-events can
                                promote construction, as well as increasing sports facility demand. Zhangjiakou, a host city
                                of the Beijing 2022 Winter Olympic Games, has boosted its local ski industry development
                                due to it co-hosting the 2022 Winter Olympic with Beijing, for example. In addition, culture
                                is incorporated into the changes brought on by mega-sports activities, which is almost
                                unavoidably created in the process of planning the event [23]. The cultural component of
                                sports mega-events has received increasing attention because it has become increasingly
                                important, both in terms of artistic activities and in terms of identity and way of life [24].
                                The Winter Olympics is arguably a game for the comparatively wealthy Global North;
                                therefore, hosting this winter sports mega-event in less developed countries not only serves
                                to boost its status as a global economic and cultural powerhouse [25], but also plays a vital
                                role in fostering a ski culture and converting this activity into a lifestyle [26].
                                      The factors affecting the demand for skiing should also be considered in the selection
                                of the site. According to a previous study [27], population density is the primary driver of
                                outdoor recreation demand, and the resident population affects the generation of regional
                                recreation trips from a particular origin zone, such as skiing [28]. Moreover, accessibility is
                                a vital prerequisite at any tourist destination [29]. Based on the comparison of the results
                                of the studies, the main factor influencing the choice of location and destination are travel
                                distance and climatic factors (e.g., snow conditions, ski slopes) [30]. With climate change,
                                the appeal of snow-safe destinations is strongly influenced by price and travel time [31].
                                The distance of the ski resort from where the skiers live or stay is important for the choice
                                of destination.
                                      In order to find more potential skiers, economic factors, e.g., GDP per capita, are
                                also valid in explaining arrivals [32], and the demand for skiing is expected to increase as
                                income rises [33]. Additionally, tourism revenue, tourist carrying capacity, and tourism
                                infrastructure can be used as indicators to measure ski tourism demand [34], because new
                                ski resorts are more likely to be established in regions/destinations that offer sufficient
                                recreation-related activities, and these factors can demonstrate the local ability to cope with
                                ski tourism impacts.

                                2.2. Factors That Influence the Spatial Distribution of China’s Ski Resorts
                                      The natural, economic, and social factors that influence the location of the ski resorts
                                mentioned above also apply to those in China [13,35]. However, government regulatory
                                factors are a uniquely significant factor in the development of China’s ski resorts [36,37],
                                which is testament to the initiative’s success [38]. Following its successful bid for the
                                2022 Winter Olympics, the Chinese government released a series of policy documents
                                supporting the development of the ski industry. The number of policies related to ski
                                resorts could, therefore, reflect the development of China’s ski industry. Due to its regional
                                emphasis, this study relies on provincial policies for the ski industry rather than national
                                ones, such as the Hebei Province ice and snow industry development plan (2018–2025), and
                                the ice and snow sports industrial development project of Jilin City. Furthermore, sporting
                                mega-events are particularly important for the development of China’s ski industry. For
                                example, the third Asian Winter Games held in Harbin in 1996 marked the beginning of
                                ski tourism in China, where ski areas were first opened to the public.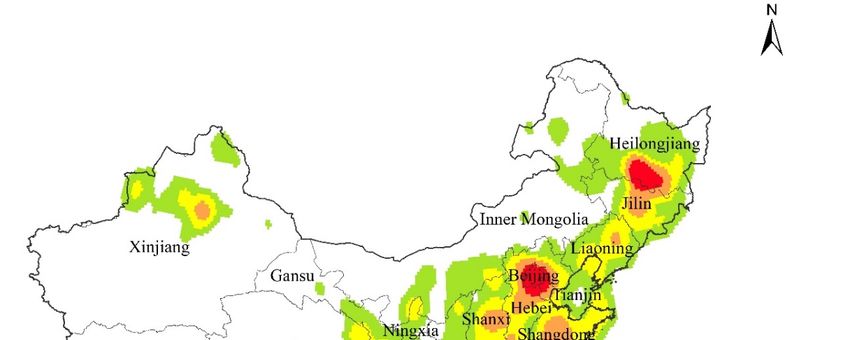
Sustainability 2021, 13, 4232                                                                                                        4 of 16

                                           As a result of the literature review, natural, economic, social, cultural, and political
                                     factors were chosen to explain the location of ski resorts, as shown in Table 1. Due to
                                     the disparate influence of sporting events, the weight assignments for national sporting
                                     events, and small and large international events (e.g., Olympic Games) were set at 1, 3 and
                                     5, respectively. Moreover, fictitious data were used to evaluate the effects of Olympic host
                                     cities on the location of ski areas, which are divided into two categories (0 = No, 1 = Yes).
                                     Other data were divided into five classes using the k-means classification technique using
                                     ArcGIS (geographic information system) software.

                          Table 1. The possible factors that influence the spatial distribution of China’s ski resorts.

            Factors                                        Subfactors                                      Code           Classification
                                                           Elevation                                        X0                  5
                                                             Slope                                          X1                  5
                                                         Terrain relief                                     X2                  5
                                                 Distance to the nearest river                              X3                  5
                                              Temperature in the winter season
        Natural factor                                                                                      X4                  5
                                                      (November–April)
                                              Precipitation in the winter season
                                                                                                            X5                  5
                                                      (November–April)
                                               Wind speed in the winter season
                                                                                                            X6                  5
                                                      (November–April)
                                   Relative humidity in the winter season (November–April)                  X7                  5
                                                        GDP per capita                                      X8                  5
      Economic factor                            International tourism revenue                              X9                  5
                                                   Domestic tourism revenue                                 X10                 5
                                                      Resident population                                   X11                 5
         Social factor
                                                      Population density                                    X12                 5
                                                        Traffic density                                     X13                 5
     Traffic accessibility
                                                  Distance to the nearest road                              X14                 5
                                  Whether it is an area for holding the 2022 Winter Olympics                X15                 2
       Cultural factors
                                  The number of international/national winter sports events                 X16                 5
       Political factor                        The number of provincial policies                            X17                 5

                                     3. Data and Methodology
                                     3.1. Data Resources
                                            The location of each ski resort was obtained through a map website on October 11, 2019,
                                     and was checked for integrity and authenticity by multi-source information (e.g., search
                                     engine, reports of China’s ski resorts). The latitudes and longitudes of 776 confirmatory
                                     samples were converted to GIS-compatible point data using ArcMap10.2 (Figure 1). To
                                     understand the spatial distribution of the different types of ski resorts as well as their
                                     primary influence factors, we looked at all of China’s ski resorts (776) and those with aerial
                                     lifts (162).
                                            Terrain data such as elevation, slope, and terrain relief were obtained from the Chinese
                                     Academy of Geological Sciences’ resource and environment data cloud platform [39], which
                                     calculates using the Shuttle Radar Topography Mission (SRTM) 90 m resolution digital
                                     elevation model (DEM). The climate dataset used in the winter season analysis (November–
                                     April) was the standard value of the surface climate dataset in China from 1981 to 2010, the
                                     DEM of the SRTM through ArcGIS downloaded from China’s meteorological data sharing
                                     service system. With 825 weather observation stations across China, the station attribute
                                     information (e.g., station ID, longitude, latitude) and mean monthly climate data (e.g.,
                                     temperature, humidity, precipitation, wind speed) are included in the dataset, which has
                                     been widely used in climate-related research in China [40].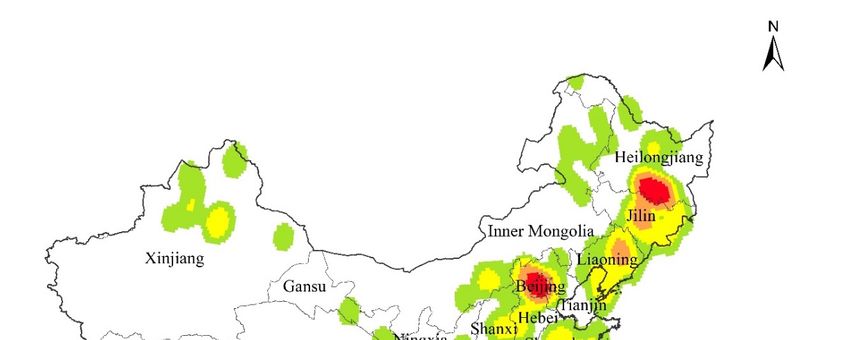
Sustainability 2021, 13, x FOR PEER REVIEW 5 of 17
Sustainability 2021, 13, 4232 5 of 16
The location of each ski resort was obtained through a map website on October 11,
2019, and was checked for integrity and authenticity by multi-source information (e.g.,
search engine, reports of China’s ski resorts). The latitudes and longitudes of 776
The primary data for traffic density, distance to the nearest road, and river were
confirmatory samples were converted to GIS-compatible point data using ArcMap10.2
obtained from the National Geomatics Center of China and were processed by ArcGIS
(Figure 1). To
software. understand
Economic andthe spatial
social datadistribution of the
were obtained different
from types
the 2018 of ski resorts
statistics as
published
well as their primary influence factors, we looked at all of China’s ski resorts
by the National and Provincial Statistical Bureaus of China. We collected data on the (776) and
those withofaerial
number liftssports
winter (162).events and provincial policies from government websites and
other web pages.
Figure 1. The location of China’s ski resorts.
Figure 1. The location of China’s ski resorts.
3.2. Methods
Terrain
3.2.1. Nearestdata such asRatio
Neighbor elevation,
Analysis slope, and terrain relief were obtained from the
Chinese Academy of Geological Sciences’
The nearest average neighbor tool within resource andisenvironment
ArcGIS data
a valid tool for cloud platform
statistically assess-
[39], which distribution
ing spatial calculates using
through thethe Shuttle
outputRadar
of an RTopography Mission The
value and a Z-score. (SRTM)
R value90 was
m
resolution
calculateddigital
on theelevation model
basis of the ratio (DEM).
betweenThe the climate
observed dataset
and theused in theaverage
random winter distance,
season
analysis
showing (November–April)
how the data were wasclustered
the standard value of the
or dispersed. surface
The climate
Z-score showeddataset
the in China
statistical
from 1981 to 2010, the DEM of
significance of the calculated R value. the SRTM through ArcGIS downloaded from China’s
meteorological data sharing
A high confidence service
level in the system. With R
calculated 825 weather
value was observation
indicated bystations
a highlyacross
posi-
China, the station
tive/negative attribute
Z-score [41]. information
The distribution (e.g.,was
station ID, longitude,
considered latitude)if and
to be clustered the Rmean
value
monthly
was less climate
than 1; itdata (e.g., temperature,
was dispersed humidity,
if the ratio was greater precipitation, wind
than 1. The closer thespeed)
value ofarethe
included
R was toin0,the
thedataset, which has
more clustered thebeen
points widely
were used
likelyin
toclimate-related
be. p-values of research
less than in China
0.05 were
[40].
considered to be statistically significant.
The primary data for traffic density, distance to the nearest road, and river were
3.2.2.
obtained Kernel
fromDensity Estimation
the National Geomatics Center of China and were processed by ArcGIS
software. Economic
Kernel density and social data
estimation (KDE) were obtained from the
is a non-parametric 2018
means ofstatistics
determiningpublished by
the pattern
of National
the spatial data
andfor estimating
Provincial the crashBureaus
Statistical intensityoffor hotspot
China. Weidentification
collected data[42]. Thenumber
on the premise
of the method is that the point pattern has a density at any location in a given region,
meaning that it is not just the location where the event occurs [43]. The value of the data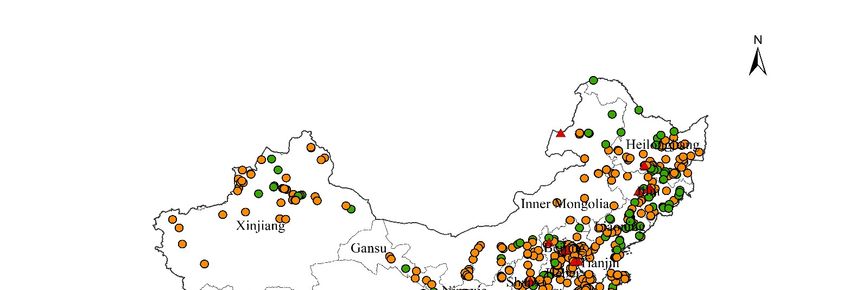
Sustainability 2021, 13, 4232                                                                                                6 of 16

                                assigned to a specific point is used and spreads across a predefined area. The KDE at point
                                x is defined as:
                                                                           1     n        1
                                                                fˆ( x ) =
                                                                          nh d ∑ i = 1
                                                                                       K ( ( x − xi ))
                                                                                          h
                                                                                                                        (1)

                                where K ( ) is the kernel function, h is the bandwidth matrix, xi is the known points, n is
                                the number of known points within the bandwidth, and d is the data dimensionality.

                                3.2.3. Spatial Autocorrelation Statistics
                                     (1) Moran’s I
                                     Moran’s I, as a major global spatial autocorrelation index, is used to determine whether
                                there is spatial autocorrelation in a dataset and its degree of autocorrelation throughout
                                the study region [44]. Possible values of Moran’s I range from −1 to 1. A positive value
                                indicates the spatial clustering of similar values, and a negative value identifies the cluster-
                                ing of different values. The Z-score is measured for statistical hypothesis testing, which
                                indicates that spatial autocorrelation is statistically significant at the 5% level if it is greater
                                than 1.96 or less than −1.96. Mathematical formulas for Moran’s I index are defined as:

                                                                      n ∑in=1 ∑nj=1 wij ( xi − x )( x j − x )
                                                              I=                                                                (2)
                                                                       (∑in6= j ∑nj=1 wij )(∑in=1 xi − x2 )

                                where n is the total number of pixels, xi and xj are the variables of interest in points i and j,
                                respectively, x is the average value of x, and wij is a matrix of spatial weights.
                                     (2) Getis–Ord Gi*
                                     Although global spatial autocorrelation indexes measure whether clustering is present
                                across the study area, cluster structures of high or low concentration cannot be identified.
                                We therefore used Getis–Ord Gi*, a local spatial autocorrelation index statistic, to investigate
                                spatial associations by identifying significant hot and cold spots [45]. A significant hotspot
                                could be identified if Z-scores were greater than 1.96, while a significant cold spot was
                                shown if the Z-score was lower than −1.96 (p < 0.05). The statistical equation for calculating
                                Gi* can be written as:

                                                                               ∑nj wij x j − x ∑nj wij
                                                          Gi∗ =       r                                                        (3)
                                                                                                       2
                                                                  S       (n ∑nj   wij2   − (∑nj   wij ) )/(n − 1

                                where n is the total observation number, Wij is the weight of the values, x is the average of
                                the observed values, and S is the standard deviation. The x and S can be defined as:
                                                                                s
                                                                   ∑nj x j        ∑nj x2j
                                                              x=           ; S=           − ( x )2                        (4)
                                                                     n               n

                                3.2.4. Geographical Detector
                                     The geographical detector was developed by Wang et al. [46] on the basis of a spatial
                                variance analysis, which examines the relationship between spatial landscape patterns
                                and their influence factors. The method has been used to study the influence factors of
                                natural and socioeconomic phenomena due to its strength in the analysis of mixed cate-
                                gorical and continuous data [47,48]. Four geographical detectors—risk, factor, ecological,
                                and interaction—could be model-based, and the factor detector module is used to detect
                                whether the factor is the cause of the difference in the spatial distributions of the indicator
                                value [46]. We used PD,G obtained from the factor detector to assess the impact of geo-
                                graphical, climatic, social, economic, and political factors on the spatial pattern of China’s
                                ski resorts. PD,G can be expressed as follows:

                                                                                          ∑im=1 n Di Var Di
                                                                      PD,G = 1 −                                                (5)
                                                                                               nVar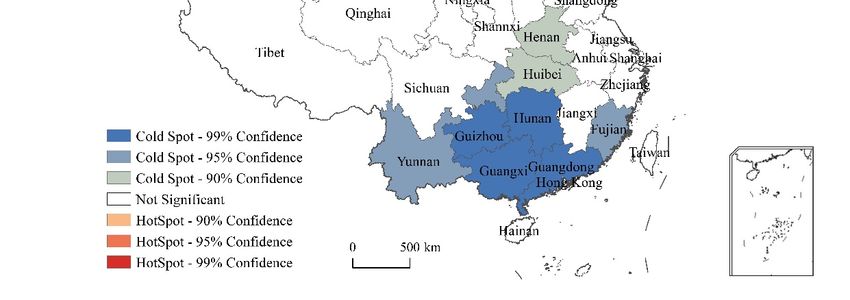
Sustainability 2021, 13, 4232 7 of 16
where PD,G indicates the power of the determinant, n is the total number of samples, Var is
the variance of samples in the study area, m is the number of sub-regions; nDi and VarDi
are the number of samples and the variance of sub-region Di , respectively. PD,G values
range from 0 to 1. A value of PD,G equal to 1 indicates that the spatial pattern of ski resorts
is adequately explained by the geographical stratum, while a completely random spatial
occurrence of the ski resorts is identified if it is equal to 0.
4. Results of the Pattern of the Spatial Distribution of China’s Ski Resorts and Discussion
4.1. Nearest Neighbor Ratio Analysis
Table 2 shows the closest neighbor spatial distributions of China’s ski resorts in
different regions. The spatial distributions of all ski areas and those with aerial lifts are
both significantly clustered at national level, but different patterns of distribution appear
in different regions. Ski resorts in high-latitude areas (e.g., northeast and northwest China)
are more likely to gather than those in low-latitude areas (e.g., central and south China).
The phenomenon of dispersion is also more commonly seen in ski resorts with aerial lifts
(i.e., east, central, and southwest China). The main reason is the difference in quantity of
natural snow. Most of China’s ski resorts, especially high-quality ones, are located in areas
with much natural snow cover, while few are located in less snowy areas, mainly driven by
demand [14].
Table 2. Average nearest neighbor results (NNRs) of China’s ski resorts.
All Ski Resorts Ski Resorts with Aerial Lifts
Spatial Spatial
Region
NNR Distribution Z-Score p-Value NNR Distribution Z-Score p-Value
Pattern Pattern
Northeast 0.478 clustered −14.090 0.000 *** 0.565 clustered −7.200 0.000 ***
North 0.736 clustered −2.140 0.032 ** 0.689 clustered −3.991 0.000 ***
East 0.666 clustered −3.259 0.001 *** 1.287 dispersed 1.899 0.058 *
Northwest 0.330 clustered −12.621 0.000 *** 0.762 clustered −2.137 0.033 **
Central 1.045 random 0.308 0.758 5.460 dispersed 14.778 0.000 ***
Southwest 0.972 random −0.279 0.780 2.161 dispersed 4.968 0.000 ***
South 7.058 dispersed 20.072 0.000 *** - - - -
Whole country 0.387 clustered −32.662 0.000 *** 0.463 clustered −13.067 0.000 ***
Note: ***, ** and * represent 99%, 95%, and 90% confidence levels, respectively; there are no ski resorts with aerial lifts in the south of China.
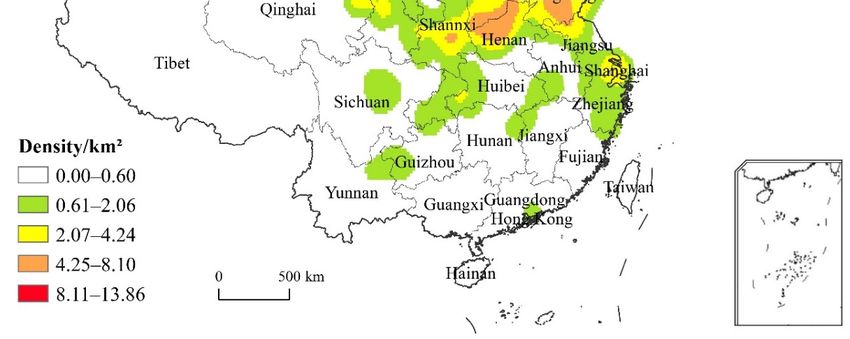
4.2. Kernel Density Estimation Analysis
Figure 2 shows the distribution of the density of the ski resorts using KDE analysis.
Jenk’s Natural Breaks was applied to the density classification. The average distribution
of ski resorts in China is 0.84/10000 km2 , while the number of ski resorts with aerial lifts
is only 0.17 per 10,000 km2 . Figure 2a shows that China’s ski resorts are concentrated in
regions with somewhat better natural snow conditions, such as Xinjiang province, north,
and northeast China. The pattern of high-density distribution of ski resorts varies across
the three regions. Those ski resorts are mainly located in Beijing, and four surrounding
provinces, Hebei, Shanxi, Shandong, and Henan, in northern China. Most of the ski resorts
in northeast China have been built along the Changbai Mountains, while the resorts in
Xinjiang province are scattered around the middle range of Tianshan Mountains. Although
only about 160 ski areas in China have aerial lifts, the high-density distribution areas are
similar to all ski resorts in Xinjiang province, north, and northeast China. Suitable climatic
conditions are the main reason for these dense areas. Heilongjiang province, for example,
was the site of the Yabuli ski resort and home to the third Asian Winter Games.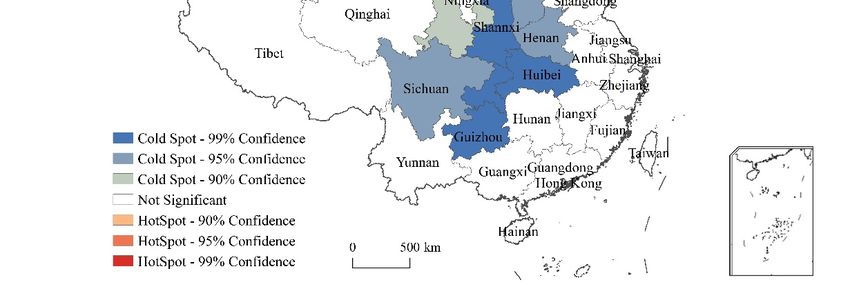
Sustainability 2021, 13, 4232                                                                                                            8 of 16
Sustainability 2021, 13, x FOR PEER REVIEW                                                                                              9 of 17

                       (a) All ski resorts

                       (b) Ski resorts with aerial lifts

     Figure
     Figure 2.
             2. Density
                Density estimation
                        estimation of
                                   of China’s
                                       China’s ski
                                                ski resorts
                                                    resorts using  kernel density
                                                            using kernel    density estimation
                                                                                    estimation (KDE)
                                                                                                (KDE) ((a)-Density
                                                                                                         (a- Density estimation
                                                                                                                      estimationof
                                                                                                                                 ofall
                                                                                                                                    allski
                                                                                                                                        ski
     resorts; (b)-Density estimationresorts;  b- Density
                                      of ski resorts with estimation
                                                          aerial lifts).of ski resorts with aerial lifts).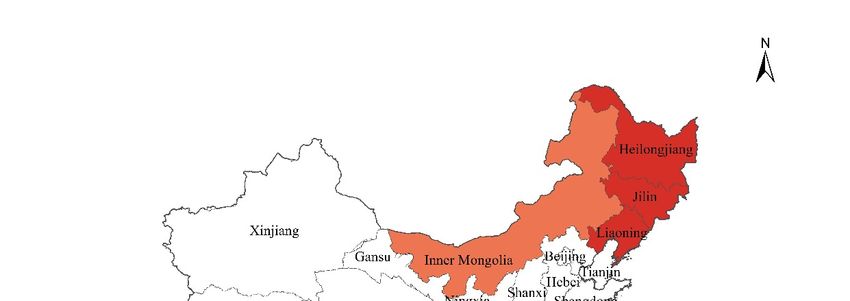
Sustainability2021,
Sustainability 2021,13,
13,4232
x FOR PEER REVIEW 10
9 ofof1617
4.3. Spatial Autocorrelation Analysis
4.3. Spatial Autocorrelation Analysis
4.3.1.Moran’s
4.3.1. Moran’sI I
Asshown
As shownininTable
Table3,3,Moran’s
Moran’sI Iindices
indicesindicated
indicatedsignificant
significantclustering
clusteringofofall
allsamples.
samples.
BothGlobal
Both GlobalMoran’s
Moran’sI Ivalues
valuesare
arearound
around0.2,
0.2,with
withcorresponding
correspondingZ-scores
Z-scoresofof3.82
3.82and
and2.92,
2.92,
suggestingthat
suggesting that there
there is significant
is significant spatial
spatial autocorrelation
autocorrelation betweenbetween all of China’s
all of China’s ski resortsski
and those with aerial lifts (p < 0.05). In other words, regions with ski areas tend to be closerto
resorts and those with aerial lifts (p < 0.05). In other words, regions with ski areas tend
tobeeach
closer to each
other other
instead instead
of being of being distributed
randomly randomly distributed across China.
across China.
Table 3. Global
Table spatialspatial
3. Global autocorrelation indicesindices
autocorrelation of Moran’s I for China’s
of Moran’s ski resorts.
I for China’s ski resorts.
All Ski Resorts All Ski Resorts Ski Resorts with Aerial
Ski Resorts Lifts Lifts
with Aerial
Moran’s I Z-score p-value Moran’s I Z-score p-value
Moran’s I Z-score p-value Moran’s I Z-score p-value
0.204 3.821 0.204 0.000 ***
3.821 0.191
0.000 *** 0.191 2.918 2.918 0.004
0.004***
***
Note:
Note:***
*** and ** represent
represent 99% and
99% confidence 95%respectively.
levels, confidence levels, respectively.
4.3.2.Hotspot
4.3.2. HotspotAnalysis
Analysis
Definitehotspots
Definite hotspots(in (inred)
red)and
andcold
coldspots
spots(in(inblue)
blue)ofofthe
thedensity
densityofofski
skiresorts
resortsininChina
China
wereobtained
were obtainedfromfromthetheGetis–Ord
Getis–OrdGi*Gi*analysis
analysis(Figure
(Figure3).3).Heilongjiang
Heilongjiangand andLiaoning
Liaoning
provinceswere
provinces wereconsistent
consistenthotspots
hotspotsfor
foreach
eachanalysis.
analysis.MoreMorehotspots
hotspotsareareshown
shownininall allski
ski
areas,including
areas, includingInner
InnerMongolia
Mongoliaand andnortheast
northeastChina.
China.However,
However,the thespatial
spatialdistribution
distribution
ofofthe
theski
skiareas
areasininFigure
Figure3a,b 3a,bshows
showsa ahigh
highvariability
variabilityofofclustered
clusteredcold
coldspots.
spots.Large
Largecold
cold
spots have been found in southern China (e.g., Guangdong, Guangxi), while cold spots ofof
spots have been found in southern China (e.g., Guangdong, Guangxi), while cold spots
skiresorts
ski resortswith
withaerial
aerial lifts
lifts in in northwest
northwest China
China (e.g.,
(e.g., Gansu,
Gansu, Shaanxi)
Shaanxi) are evident
are evident due toduetheto
the heat
heat and humidity
and humidity in southern
in southern China;
China; thus,thus,
no skinoresorts
ski resorts
have have
aerialaerial ski lifts.
ski lifts.
(a) All ski resorts
Figure 3. Cont.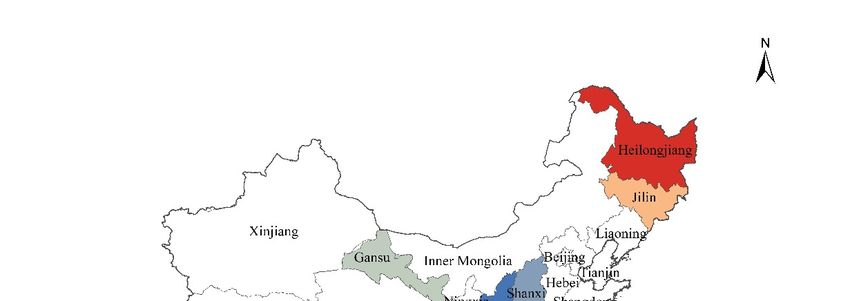
Sustainability 2021, 13, x FOR PEER REVIEW 11 of 17
Sustainability 2021, 13, 4232 10 of 16
(b) Ski resorts with aerial lifts
Figure 3. Hotspot analysis of China’s ski resorts ((a)-Hotspot analysis of all ski resorts; (b)-Hotspot analysis of ski resorts
withFigure 3. Hotspot analysis of China’s ski resorts (a- Hotspot analysis of all ski resorts; b- Hotspot analysis of ski resorts
aerial lifts).
with aerial lifts).
5. Results of Factors Affecting the Distribution of China’s Ski Resorts and Discussion
5.1.5.Factors
ResultsThat InfluenceAffecting
of Factors the Distribution of All Ski Resorts
the Distribution of China’s Ski Resorts and Discussion
According
5.1. to the
Factors That calculation
Influence using the geographical
the Distribution detector (Table 4), the main factors
of All Ski Resorts
affecting the cluster formation of in China’s ski resorts are temperature, precipitation,
According to the calculation using the geographical detector (Table 4), the main
wind speed, relative humidity during the winter, rivers, accessibility, GDP per capita,
factors affecting the cluster formation of in China’s ski resorts are temperature,
government policies, domestic tourism revenue, resident population, and the 2022 Winter
precipitation, wind speed, relative humidity during the winter, rivers, accessibility, GDP
Olympics and other national and international winter sports events. The spatial distribution
per capita, government policies, domestic tourism revenue, resident population, and the
of ski resorts in China is driven by multi-party systems involving natural, economic,
2022 Winter Olympics and other national and international winter sports events. The
political, cultural, and location factors.
spatial distribution of ski resorts in China is driven by multi-party systems involving
National and international winter sports events can explain around 70% of the spatial
natural, economic, political, cultural, and location factors.
distribution of China’s ski resorts. It should be noted that the impact of the 2022 Winter
Olympics National and international
was examined separately,winter sportstoevents
in order clarifycanitsexplain
role in around 70% of
the pattern of the spatial
spatial
distribution of China’s ski resorts. It should be noted that the impact
distribution. The results showed that the 2022 Winter Olympics was associated with almost of the 2022 Winter
14%Olympics was examined
of the explanatory power.separately,
These mega in order
wintertosports
clarifyhelp
its role in the the
to explain pattern
otherof spatial
major
distribution. The results showed that the 2022 Winter Olympics
factors affecting the spatial distribution of ski resorts. Studies show that the process ofwas associated with
almost 14% of the explanatory power. These mega winter sports
deciding who will host mega winter sports events is complicated, involving variables help to explain the other
majortofactors
related affecting
the spatial the spatial
distribution distribution
of ski of ski
resorts, such resorts. (e.g.,
as climate Studies show precipitation,
altitude, that the process
of deciding who will host mega winter sports events is complicated,
snowfall) and socioeconomic considerations (e.g., GDP, population, transport, tourism involving variables
related to the[49,50].
infrastructure) spatial distribution of ski resorts, such as climate (e.g., altitude, precipitation,
snowfall) and
In China, wintersocioeconomic
sports eventsconsiderations
are mainly (e.g.,
held GDP,
in thepopulation,
provinces of transport,
Jilin andtourism
Hei-
infrastructure) [49,50].
longjiang. Among these were the 1st through 12th Winter Games of the People’s Republic
of China,In the
China,
Thirdwinter
and Sixthsports
Asian events
Winterare mainly
Games, andheld in the
the 24th Worldprovinces
Universityof Winter
Jilin and
Heilongjiang. Among these were the 1st through 12th Winter
Games. In recent years, Xinjiang province has hosted the 13th National Winter Games, Games of the People’s
and
Republic
Beijing of China, the
and Zhangjiakou areThird
hosting and Sixth
cities of theAsian
2022 Winter Games, and
Winter Olympics. As the 24thmost
a result, World
University
of China’s skiWinter
areas areGames. In recent
in regions thatyears, Xinjiang
have hosted province has hosted the
international/national 13th sports
winter National
Winter
events; 42%Games, and Beijing
of ski resorts and Zhangjiakou
were located in these areasare hosting cities of the 2022 Winter
in 2018.
Olympics. As a result, most of China’s ski areas are in regions that have hosted
international/national winter sports events; 42% of ski resorts were located in these areas
in 2018.Sustainability 2021, 13, 4232 11 of 16
Table 4. The major influence factors of spatial distribution of China’s ski resorts.
X0 X1 X2 X3 X4 X5
PD,G 0.004 0.012 0.021 0.181 0.158 0.144
p-value 0.920 0.471 0.188 0.000 *** 0.000 *** 0.000 ***
X6 X7 X8 X9 X10 X11
PD,G 0.057 0.124 0.045 0.090 0.233 0.233
p-value 0.006 *** 0.000 *** 0.031 ** 0.203 0.058 * 0.058 *
X12 X13 X14 X15 X16 X17
PD,G 0.008 0.012 0.192 0.135 0.703 0.066
p-value 0.816 0.534 0.000 *** 0.036 ** 0.000 *** 0.000 ***
Note: ***, ** and * represent 99%, 95%, and 90% confidence levels, respectively.
5.2. Factors That Influence the Distribution of Ski Resorts in Different Regions
Table 5 shows similarities and differences in the influencing factors that shape the
spatial distribution of ski resorts across China. The main factors contributing to the
distribution of ski areas are good natural snow, international/national winter sports events,
resident population, and domestic tourism revenue. However, the explanatory power
varies by region. Winter sports events have greater explanatory power in northeast China as
well as in the resident population, while domestic tourism revenues have a more significant
impact in north China. Moreover, the factors affecting the distribution of ski resorts in north
China are more complicated, including international tourism revenues, population density,
GDP per capita, and the 2022 Winter Olympics. As far as the sphere of influence of the
2022 Winter Olympics is concerned, it mainly affects the pattern of the spatial distribution
of the ski resorts in the host cities of Beijing and Zhangjiakou in north China.
However, the explanatory power of natural factors (e.g., precipitation, relative hu-
midity, distance to the nearest river) and accessibility (e.g., traffic density, distance to the
nearest road) is becoming more influential in regions of eastern and central China without
good natural snow. Climatic factors affect the selection of ski areas; therefore, it is impor-
tant to choose an area with suitable climatic conditions for operation, especially in places
where, in most parts, climatic conditions are less than optimal for running a ski resort. In
addition, heavy dependence on artificial snow due to limited snow resources highlights
the importance of nearby rivers.
5.3. Factors Affecting the Distribution of Ski Resorts with and without Aerial Lifts
There were significant differences in the factors affecting the spatial distribution of the
types of ski resorts (Table 6). International and national winter sports events accounted for
nearly 85% of the spatial distribution of ski resorts in China with aerial lifts. The influencing
factors were not prominent in the distribution of ski resorts without aerial lifts. Although
GDP per capita and temperature in winter were statistically significant based on their
p-value (p < 0.05), only about 13% of the spatial distribution of ski resorts can be explained.
There are precise requirements that ski resorts must meet to host mega winter sports events,
and one of them is the availability of aerial lifts. For ski areas geared to novice skiers, the
high demand for skiing is more important in the choice of a building site. As a result, the
income of skiers (GDP per capita) who influence skiing demand is the most critical factor
for the distribution of ski resorts without aerial lifts.Sustainability 2021, 13, 4232 12 of 16
Table 5. The major influence factors of spatial distribution of ski resorts in different regions.
Region Major Influence Factors PD,G p-Value
X16 0.938 0.000 ***
Northeast X11 0.921 0.000 ***
X10 0.531 0.040 **
X10 0.819 0.000 ***
X11 0.762 0.006 ***
X9 0.724 0.024 **
North X16 0.671 0.036 **
X12 0.593 0.018 **
X8 0.585 0.023 **
X15 0.475 0.039 **
X11 0.654 0.042 **
East X14 0.494 0.008 ***
X3 0.405 0.019 **
X3 0.546 0.000 ***
X7 0.458 0.000 ***
Central X14 0.402 0.013 **
X13 0.396 0.076 *
X5 0.285 0.024 **
X9 0.768 0.016 **
X11 0.756 0.020 **
Southwest
X3 0.486 0.035 **
X14 0.423 0.048 **
X3 0.766 0.000 ***
South
X10 0.384 0.034 **
Note: ***, ** and * represent 99%, 95%, and 90% confidence levels, respectively; there were no significant factors in
northwest China according to the p-values.
Table 6. Major influencing factors of the spatial distribution of China’s ski resorts with and without
aerial lifts.
Ski Resorts with Aerial Lifts Ski Resorts without Aerial Lifts
Major Influence Major Influence
PD,G p-Value PD,G p-Value
Factors Factors
X16 0.850 0.000 *** X8 0.0825 0.042 **
X15 0.221 0.000 *** X4 0.0497 0.023 **
X4 0.133 0.000 ***
Note: *** and ** represent 99% and 95% confidence levels, respectively.
6. Implications, Conclusions and Future Work
This study used GIS and geographical detectors to analyze the patterns of and sig-
nificant influences on the spatial distribution of ski resorts in China. We highlighted the
importance of spatial analysis on the regional scale, focusing on different types of ski
resorts. The results of this study suggest that the geographical distribution of China’s ski
areas is significantly clustered at the national level. Although the factors affecting their
spatial distribution are complex, the number of international and national winter sports
events can explain approximately 70% of the locations of ski areas in China. In addition,
almost 14% of the explanatory power was identified as the 2022 Winter Olympics.
In comparison, different patterns of distribution appeared in different regions. Gener-
ally speaking, ski areas located in high-latitude regions are more likely to gather than those
in low-latitude areas. In addition, dispersion was observed in ski resorts with aerial lifts in
east, central, and southwest China. The main contributors to the distribution of ski areas
also varied by region and type. For example, winter sports mega-events have a higher
explanatory power in northeast China and on the resident population, while domestic
tourism revenues have a more significant impact in north China. For different types ofSustainability 2021, 13, 4232 13 of 16
ski areas, winter sports mega-events accounted for almost 85% of the spatial distribution
of China’s ski resorts with aerial lifts, while GDP per capita had the highest explanatory
power in ski resorts without them.
Many ski resorts are built in regions that have naturally adequate skiable terrain.
An excellent example of this is the Alps, where more than one-third of all ski resorts are
located. Previous studies tend to highlight natural factors, such as climate and snow
conditions, in the discussion of location criteria for ski resorts [10,45,51]. However, factors
that influence new ski resorts’ emergence have proven more multifaceted, as our findings
show. Furthermore, the driving factors for different types of ski resorts and different
regions vary significantly.
6.1. Managerial Implications
The ski resort selection process is of paramount importance because it affects both
short-term and long-term profits [52]. The present study confirmed the previous empirical
study’s finding that the essential attribute for a ski resort is the seasonality of snow condi-
tions [10]. A further novel finding was that technology might upend the location decision
process; for example, some ski resorts are built in areas with less natural snowfall. The
snowmaking systems (technology) will make artificial snow to help the resorts provide
the best snow conditions to skiers. The longer a ski resort is in operation, the better it
must be able to adjust to fluctuating weather conditions. Therefore, stakeholders should
conduct a climate change risk assessment that looks at not only the physical location but
also technological factors.
The spatial distribution of ski resorts in China is not uniform; therefore, various
operating policies should be developed for different distribution patterns. For hotspots
such as north and northeast China and Xinjiang province, the benefits of agglomeration
and the 2022 Winter Olympics can make them internationally famous destinations. In
particular, the construction of world-class ski destinations, the establishment of a regional
competition and cooperation mechanisms and the implementation of integrated strategies
are needed. The complementary advantages, the sharing of resources, retention strategies,
the sharing of benefits, and the development of these areas together will lead to the
optimization and upgrading of the ski industry structure and will strengthen China’s ski
resorts’ competitiveness as well as brands.
Neighboring ski resorts should take full advantage of the positive spillover effects
of the neighborhood to attract more potential customers, such as providing cost-effective
skiing products, uncrowded ski areas, reasonable accommodation, and service. In addition,
these cities need to undertake joint promotion, plan travel packages with neighbors, and
expand marketing networks to become popular ski destinations along with their neighbors’
hotspot clusters. The cold spot areas could be planned to overcome the competitive
disadvantages of the featured and compelling non-skiing activities. More attention should
be paid to the most reliable source markets—local residents and people in neighboring
cities—and preferential measures should be taken for these source markets.
6.2. Limitations and Future Work
A drawback of this study is that only ski areas in 2019 could be analyzed due to
data availability, ignoring the evolution of time and space. It was impossible to conduct
a dynamic analysis of the newly added ski resorts, which focuses on distribution and
influencing factors. Consequently, results would be more accurate if a dynamic analysis
were used. Furthermore, studying ski areas in relation to sporting mega-events and their
drivers would be critical. A longitudinal analysis would help to better understand how
certain events and ski resorts correlate, and to clearly explain the cause and effect.
Moreover, future research should consider the factors associated with ski areas’ sus-
tainable development during the location selection process. Achieving environmental,
economic, and social objectives sustainably are important for successful ski resort operation.
The natural environment is crucial for a thriving ski resort [53], because it could have pos-Sustainability 2021, 13, 4232 14 of 16
sible effects on soil, vegetation [54], wildlife degradation [55], and river system pollution.
Thus, assessing ecological services and carrying capacities should be incorporated into
future ski area distribution research. Moreover, the valuable prospect of working with
local business partners, industry associates, and community relationships [56] to promote
long-term economic sustainability in skiing resorts is desirable for future work. Future
studies should also evaluate residents’ benefits from ski resort development to achieve the
social sustainability objective. After such analyses, ski resort development could move
more sustainably and have a more stable long-term future.
Author Contributions: Conceptualization Y.F.; Methodology Y.F.; Writing—original draft Y.F.; Project
administration Y.J.; Supervision Y.J.; Writing—review & editing C.-H.T.; Data curation B.L.; Supervi-
sion M.-H.C. All authors have read and agreed to the published version of the manuscript.
Funding: This research was funded by NATIONAL NATURAL SCIENCE FOUNDATION OF
CHINA, grant number 42001255; and CHINA POSTDOCTORAL SCIENCE FOUNDATION, grant
number 2020M680448.
Data Availability Statement: Data is contained within the article.
Conflicts of Interest: The authors declare no conflict of interest.
References
1. Hudson, S. Sport and Adventure Tourism; Haworth Hospitality Press: New York, NY, USA, 2012; p. 1. ISBN 978-11-3639-384-6.
2. Varvaressos, S.; Soteriades, M. Mountain tourism and winter resorts: A study of Greek ski centers. Arch. Econ. Hist. 2007, 2,
119–144.
3. Lasanta, T.; Laguna, M.; Vicente-Serrano, S.M. Do tourism-based ski resorts contribute to the homogeneous development of the
Mediterranean mountains? A case study in the Central Spanish Pyrenees. Tour. Manag. 2007, 28, 1326–1339. [CrossRef]
4. Agrawala, S. Climate Change in the European Alps: Adapting Winter Tourism and Natural Hazards Management; OECD Publishing:
Paris, France, 2007; p. 26. ISBN 978-92-6403-168-5.
5. Weiss, O.; Norden, G.; Hilscher, P.; Vanreusel, B. Ski tourism and environmental problems: Ecological awareness among different
groups. Int. Rev. Sport Sociol. 1998, 33, 367–379. [CrossRef]
6. Vanat, L. 2020 International Report on Snow & Mountain Tourism—Overview of the Key Industry Figures for Ski Resorts.
Available online: https://vanat.ch/RM-world-report-2020.pdf (accessed on 10 June 2020).
7. Wu, B.; Wei, Q.H. China Ski Industry White Book (2018 Annual Report). Available online: http://sports.sina.com.cn/others/
magicski/2020-02-18/doc-iimxyqvz3883763.shtml (accessed on 12 March 2020).
8. Vanat, L. 2017 International Report on Snow & Mountain Tourism—Overview of the Key Industry Figures for Ski Resorts.
Available online: https://www.vanat.ch/RM-world-report-2017-vanat.pdf (accessed on 18 June 2019).
9. The State Council of the People’s Republic of China. Planning for Ice-Snow Sports Development 2016–2025. Available online:
http://www.gov.cn/xinwen/2016-11/25/content_5137611.htm (accessed on 10 June 2019).
10. Silberman, J.A.; Rees, P.W. Reinventing mountain settlements: A GIS model for identifying possible ski towns in the US Rocky
Mountains. Appl. Geogr. 2010, 30, 36–49. [CrossRef]
11. Kline, C.; Hao, H.; Alderman, D.; Kleckley, J.W.; Gray, S. A spatial analysis of tourism, entrepreneurship and the entrepreneurial
ecosystem in North Carolina, USA. Tour. Plan. Dev. 2014, 11, 305–316. [CrossRef]
12. Van Berkel, D.B.; Munroe, D.K.; Gallemore, C. Spatial analysis of land suitability, hot-tub cabins and forest tourism in Appalachian
Ohio. Appl. Geogr. 2014, 54, 139–148. [CrossRef]
13. Sun, S.M.; Liu, B.; Guo, Z.; Wang, F.; Wang, X.Y.; Qiu, Z.Y. Evolution of spatial distribution characteristics and influencing factors
of skiing resorts in China since reform and opening up. J. Shenyang Sport Univ. 2019, 38, 8–15.
14. Wang, S.J.; Xu, X.W.; Xie, J. Spatial pattern, formation mechanism and structure optimization of China’s ski resorts. Econ. Geogr.
2019, 39, 222–231.
15. Wang, S.J.; Xu, X.W.; Deng, J.; Zhou, L.Y. Chinese skiing-tourism destination: Spatial patterns, existing problems and development
countermeasures. J. Glaciol. Geocryol. 2017, 39, 902–909.
16. McClung, D.; Schaerer, P.A. The Avalanche Handbook, 3rd ed.; Mountaineers Books: Seattle, WA, USA, 2006; pp. 21–22. ISBN
978-08-988-6809-8.
17. Voiculescu, M.; Popescu, F. Management of Snow Avalanche Risk in the Ski Areas of the Southern Carpathians–Romanian
Carpathians. In Sustainable Development in Mountain Regions; Zhelezov, G., Ed.; Springer: Dordrecht, The Netherlands, 2016; pp.
191–213. ISBN 978-94-007-0131-1.
18. Falk, M.; Vanat, L. Gains from investments in snowmaking facilities. Ecol. Econ. 2016, 130, 339–349. [CrossRef]
19. David, G.C.; Bledsoe, B.P.; Merritt, D.M.; Wohl, E. The impacts of ski slope development on stream channel morphology in the
White River National Forest, Colorado, USA. Geomorphology 2009, 103, 375–388. [CrossRef]Sustainability 2021, 13, 4232 15 of 16
20. Chalkley, B.; Essex, S. Urban development through hosting international events: A history of the Olympic Games. Plan. Perspect.
1999, 14, 369–394. [CrossRef]
21. Essex, S.; Chalkley, B. Mega sporting events in urban and regional policy: A history of the Winter Olympics. Plan. Perspect. 2004,
19, 201–204. [CrossRef]
22. Zhang, Y.; Ye, H.B.; Chen, Y.X. Current Development and Prospect of the Skiing Resorts in Chongli County under the Background
of Winter Olympics. China Winter Sports 2016, 38, 78–82.
23. Preuss, H. The conceptualisation and measurement of mega sport event legacies. J. Sport Tour. 2007, 12, 207–228. [CrossRef]
24. Klausen, A.M. Introduction. In Olympic Games as Performance and Public Event: The Case of the XVII Winter Olympic Games in
Norway; Klausen, A.M., Ed.; Bergham Books: New York, NY, USA, 1999; p. 3. ISBN 978-15-7181-706-8.
25. Lee, J.W. A game for the global north: The 2018 Winter Olympic Games in Pyeongchang and South Korean cultural politics. Int. J.
Hist. Sport 2016, 33, 1411–1426. [CrossRef]
26. Shan, C.L.; Zhang, W.; Hao, P.F. Influence of Beijing Winter Olympics on Chinese Ice and Snow Movement. J. Nanjing Sports Inst.
2018, 1, 40–44.
27. Willibald, F.; van Strien, M.J.; Blanco, V.; Grêt-Regamey, A. Predicting outdoor recreation demand on a national scale—The case
of Switzerland. Appl. Geogr. 2019, 113, 102–111. [CrossRef]
28. McAllister, D.M.; Klett, F.R. A modified gravity model of regional recreation activity with an application to ski trips. J. Leis. Res.
1976, 8, 21–34. [CrossRef]
29. Mrnjavac, E.; Marsanic, R. Intelligent transportation systems in improving traffic flow in tourism destinations. J. Hosp. Tour. 2007,
13, 627–636.
30. Bédiová, M.; Ryglová, K. The main factors influencing the destination choice, satisfaction and the loyalty of ski resorts customers
in the context of different research approaches. Acta Univ. Agric. Silvic. Mendelianae Brun. 2015, 63, 499–505. [CrossRef]
31. Unbehaun, W.; Pröbstl, U.; Haider, W. Trends in winter sport tourism: Challenges for the future. Tour. Rev. 2008, 63, 36–47.
[CrossRef]
32. Martins, L.F.; Gan, Y.; Ferreira-Lopes, A. An empirical analysis of the influence of macroeconomic determinants on World tourism
demand. Tour. Manag. 2017, 61, 248–260. [CrossRef]
33. Falk, M.; Hagsten, E. Importance of early snowfall for Swedish ski resorts: Evidence based on monthly data. Tour. Manag. 2016,
53, 61–73. [CrossRef]
34. Lyngdoh, B.F. Tourism Attractiveness of Meghalaya: An Exploration of Entrepreneurial Opportunities. IUP J. Entrep. Dev. 2013,
10, 7–23.
35. Liu, J.M.; Liu, A.L.; Chen, T. Influencing factors and countermeasures of ski resort development distribution with inner Mongolia
Municipality’s ski tourism development as example. Prog. Geogr. 2005, 24, 105–112.
36. Kan, J.C.; Wang, F. Driving factors and innovation paths of skiing industry upgrading under the strategy of Winter Olympic
Games in China. China Sport Sci. 2016, 36, 11–20.
37. Wang, F.; Zhu, Z.Q. Study on the construction of large scale ski resort in promoting the development of skiing industry. China
Sport Sci. 2017, 37, 11–19.
38. Bergman, J. China’s Ski Industry is Set to Soar Following Olympic Win. Available online: https://www.theguardian.com
(accessed on 22 March 2020).
39. Chinese Academy of Sciences. Chinese Academy of Geological Sciences’ Resource and Environment Data Cloud Platform.
Available online: http://www.resdc.cn (accessed on 18 May 2019).
40. Yin, J.; Zhang, X. Multi-scenario-based hazard analysis of high temperature extremes experienced in China during 1951–2010. J.
Geogr. Sci. 2013, 23, 436–446. [CrossRef]
41. Clark, P.J.; Evans, F.C. Distance to nearest neighbor as a measure of spatial relationships in populations. Ecology 1954, 35, 445–453.
[CrossRef]
42. Silverman, B.W. Density Estimation for Statistics and Data Analysis, 1st ed.; Routledge: New York, NY, USA, 2018; pp. 1–2. ISBN
978-04-1224-620-3.
43. Lloyd, C.D. Local Models for Spatial Analysis, 2nd ed.; CRC Press: New York, NY, USA, 2010; pp. 28–29. ISBN 978-03-6786-493-4.
44. Moran, P.A. The interpretation of statistical maps. J. R. Stat. Soc. Ser. B 1948, 10, 243–251. [CrossRef]
45. Ord, J.K.; Getis, A. Local spatial autocorrelation statistics: Distributional issues and an application. Geogr. Anal. 1995, 27, 286–306.
[CrossRef]
46. Wang, J.F.; Li, X.H.; Christakos, G.; Liao, Y.L.; Zhang, T.; Gu, X.; Zheng, X.Y. Geographical detectors-based health risk assessment
and its application in the neural tube defects study of the Heshun Region, China. Int. J. Geogr. Inf. Sci. 2010, 24, 107–127.
[CrossRef]
47. Liang, P.; Yang, X. Landscape spatial patterns in the Maowusu (Mu Us) Sandy Land, northern China and their impact factors.
Catena 2016, 145, 321–333. [CrossRef]
48. Teng, T.W.; Qin, L.T.; Hu, S.L. Spatial distribution and influencing factors of national mass makerspaces in the Yangtze River
Delta. Sci. Geol. Sin. 2018, 38, 1266–1272.
49. Maennig, W.; Zimbalist, A.S. International Handbook on the Economics of Mega Sporting Events; Edward Elgar Publishing: Chel-
tenham, UK, 2012; pp. 70–84. ISBN 978-08-5793-026-2.
50. Persson, C. The Olympic Games site decision. Tour. Manag. 2002, 23, 27–36. [CrossRef]Sustainability 2021, 13, 4232 16 of 16
51. Frank, D. Ski Resort Site Selection in Washington Station. Available online: https://digitalcommons.tacoma.uw.edu/cgi/
viewcontent.cgi?article=1038&context=gis_projects (accessed on 13 March 2021).
52. Semih, T.; Seyhan, S. A multi-criteria factor evaluation model for gas station site selection. Evaluation 2011, 2, 12–21.
53. Kuščer, K.; Dwyer, L. Determinants of sustainability of ski resorts: Do size and altitude matter? Eur. Sport Manag. Q. 2019, 19,
539–559. [CrossRef]
54. Wipf, S.; Rixen, C.; Fischer, M.; Schmid, B.; Stoeckli, V. Effects of ski piste preparation on alpine vegetation. J. Appl. Ecol. 2005, 42,
306–316. [CrossRef]
55. Patthey, P.; Wirthner, S.; Signorell, N.; Arlettaz, R. Impact of outdoor winter sports on the abundance of a key indicator species of
alpine ecosystems. J. Appl. Ecol. 2008, 45, 1704–1711. [CrossRef]
56. Tinsley, R.; Lynch, P. Small tourism business networks and destination development. Int. J. Hosp. Manag. 2001, 20, 367–378.
[CrossRef]You can also read


