Transportation Research Part A
←
→
Page content transcription
If your browser does not render page correctly, please read the page content below
Transportation Research Part A xxx (xxxx) xxx–xxx

                                                        Contents lists available at ScienceDirect

                                               Transportation Research Part A
                                               journal homepage: www.elsevier.com/locate/tra

Elevating access: Comparing accessibility to jobs by public
transport for individuals with and without a physical disability
                                                                                                                   ⁎
Emily Grisé, Geneviève Boisjoly, Meadhbh Maguire, Ahmed El-Geneidy
McGill University, School of Urban Planning, Suite 400, 815 Sherbrooke St. W., Montréal, Québec H3A 0C2, Canada

AR TI CLE I NF O                                       AB S T R A CT

Keywords:                                              Equal access to opportunities has emerged in public transport planning as a social objective that
Equity                                                 many transport agencies are trying to achieve. Yet in practice, not all public transport agencies
Disabled access                                        are currently providing urban residents with comparable levels of service due to physical barriers
Job accessibility                                      in the public transport network that can significantly hinder the ability of individuals with
Travel time
                                                       physical disabilities to access opportunities. In countries without a strong federal accessibility act
                                                       and/or with major financial constraints, some public transport agencies fall behind in applying
                                                       universal access design principles, making it even harder for people with a physical disability to
                                                       access opportunities. The objective of this study is to develop a methodology that can be used by
                                                       public transport agencies or disability advocates to clearly highlight and quantify the perfor-
                                                       mance of the public transport network in a region, in terms of providing transit services to people
                                                       in a wheelchair and compare that to the service offered to an individual not in a wheelchair. In
                                                       this study we use accessibility, the ease of reaching destinations, by public transport as the key
                                                       performance measure in two major Canadian Cities (Montreal and Toronto). Furthermore, we
                                                       focus on job accessibility in the most socially vulnerable census tracts in both cities, to evaluate
                                                       levels of job accessibility for wheelchair users residing in socially vulnerable areas. The findings
                                                       from our study show striking contrasts between the numbers of accessible jobs by public trans-
                                                       port for wheelchair users compared to the general population. On average, wheelchair users in
                                                       Toronto have access to 75% of jobs that are accessible to users that are not in a wheelchair, whilst
                                                       their counterparts in Montreal have access to only 46% of the jobs accessible to other users. This
                                                       research is expected to highlight for public transport engineers, planners, policy makers and
                                                       advocates for those with disabilities, the importance of universal access in a region, especially
                                                       along public transport networks, using a widely used land use and transport performance mea-
                                                       sure.

1. Introduction

    Accessibility, the ease of reaching destinations, is a key land use and transport performance measure (Hansen, 1959) that has been
used in various studies to assess the equitable distribution of public transport service in a region (Bocarejo and Oviedo, 2012; Foth
et al., 2013; Golub and Martens, 2014; Guzman et al., 2017; Manaugh and El-Geneidy, 2012). Low accessibility to jobs has been
shown to be related to higher risks of unemployment, especially in low-income areas (Korsu and Wenglenski, 2010). Furthermore, the
absence of public transport in a neighborhood, even temporarily, can significantly impact unemployment rates in areas where people

  ⁎
   Corresponding author.
   E-mail addresses: emily.grise@mail.mcgill.ca (E. Grisé), genevieve.boisjoly@mail.mcgill.ca (G. Boisjoly), meadhbh.maguire@mail.mcgill.ca (M. Maguire),
ahmed.elgeneidy@mcgill.ca (A. El-Geneidy).

https://doi.org/10.1016/j.tra.2018.02.017

0965-8564/ © 2018 The Authors. Published by Elsevier Ltd. This is an open access article under the CC BY license (http://creativecommons.org/licenses/BY/4.0/).

 Please cite this article as: Grise, E., Transportation Research Part A (2018), https://doi.org/10.1016/j.tra.2018.02.017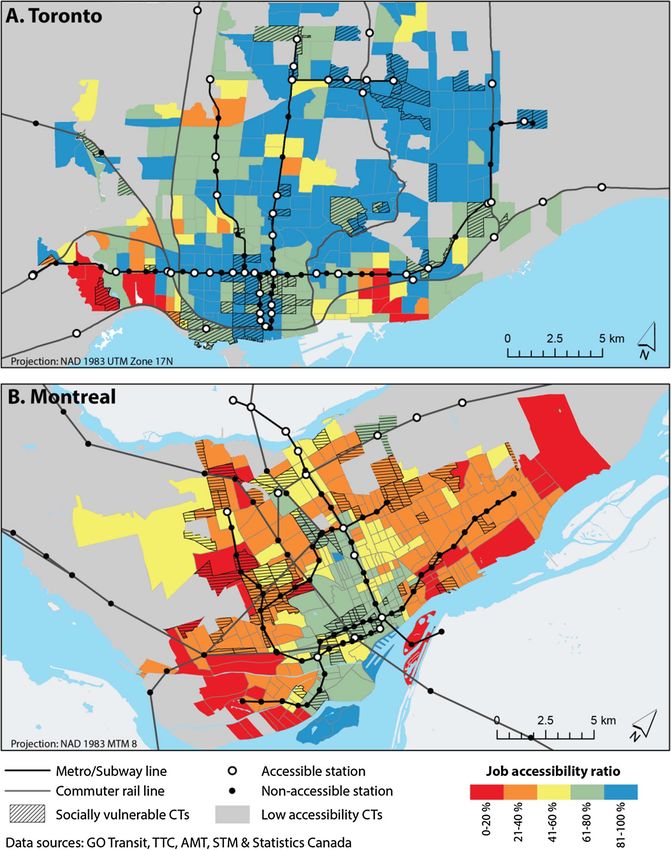
E. Grisé et al.                                                                                Transportation Research Part A xxx (xxxx) xxx–xxx

depend on it to reach their desired destinations (Matas et al., 2010; Sari, 2015; Tyndall, 2015).
    Originally, accessibility studies have been conducted at the regional level to investigate the relationship between transport
systems, land use development and economic indicators such as dwelling prices and labor outcomes (Coppola and Nuzzolo, 2011;
Hansen, 1959; Levinson, 2007). To explore these economic trends at a macroscopic level, accessibility studies have typically con-
sidered the generalized costs of travel which include all available modes (Coppola and Nuzzolo, 2011). More recently, accessibility
measures have been used to conduct social equity assessments. In such cases, studies have looked at accessibility in a more dis-
aggregated manner, namely by focusing on a specific transportation mode and/or groups of users. For example, recent studies on
accessibility and equity concentrated on the distribution of the public transport system for different income groups (Delmelle and
Casas, 2012; Legrain et al., 2016).
    In this paper, accessibility by public transport for people in a wheelchair is considered. This specific population is studied because
the public transport network that is available for a person in a wheelchair can be significantly different from the network available to
the rest of the population, due to physical barriers such as stairs in subway stations or inaccessible buses. Such barriers and the
associated difficulty with reaching employment opportunities impose significant challenges on a vulnerable group of people that have
been found to be more likely to be unemployed or underemployed compared to the general population for a considerable time (BC
Stats, 2009; Benoit et al., 2012; Lillie et al., 2013; Statistics Canada, 2016).
    To our knowledge, no previous study has considered the physical barriers present in a public transport network when measuring
accessibility to jobs by public transport. Accordingly, this study presents a methodological approach to assess the level of accessibility
to jobs using public transport for wheelchair users in the City of Toronto and the Island of Montreal, Canada on a typical weekday
during the morning peak. We then contrast this level of accessibility with that of the general population, who we assume are able to
access the entire public transport network. In particular, we examine job accessibility experienced by wheelchair users and the
general population in the most socially vulnerable census tracts in both cities. The methodology used in this study can benefit
transport planning agencies aiming to promote public transport equity based on service supply and provision for wheelchair users.
The results generated can be easily communicated to policy makers and to the public as they are expressed in the number of jobs that
can be reached within a certain travel time by public transport. The results also provide insights on how to effectively improve
accessibility to jobs by public transport for wheelchair users, which will be beneficial to the wider population, namely older adults,
and individuals traveling with luggage or a stroller. Against the backdrop of the progression of the Canadians with Disabilities Act,
this study is aptly timed to demonstrate the degree of disparities in accessibility between wheelchair users and the general population
and presents recommendations for how to reduce disparities in accessibility levels in both the long-term and short-term. The
methodology presented in this study is highly relevant to other contexts with similar issues in physical access that are present in older
public transit networks.
    This paper is organized in five sections. The first introduces the concepts of accessibility, equity and universal design within the
academic sphere before progressing to an overview of the disability legislation within Canada. The second presents the Toronto and
Montreal study contexts, followed by a description of the data and methodology used. Results are then presented and analyzed
spatially for both wheelchair users and the general population. We then produce an accessibility ratio to highlight the locations where
the disparities between accessibility for wheelchair users and the general populations are substantial, and identify socially vulnerable
neighborhoods that are particularly affected by disparities in job accessibility levels. Finally, the results are discussed and the re-
commendations and conclusions of the study are presented.

2. Literature review

    The literature review section will commence with a discussion of accessibility measures and their inclusion in land use and
transport planning, in addition to social equity. This will be followed by a brief discussion of universal access and its importance for
people with a disability. Finally, the literature review will include a discussion of the disability legislation in Canada to guide the
reader in understanding the legislation in the local context, which has likely contributed to the current situation in the public
transport systems in the studied Canadian cities.

2.1. Defining accessibility

    Accessibility is defined as a measure of potential opportunities (Hansen, 1959). One commonly used measure of accessibility is
known as cumulative opportunities, where within a given time thresholds (usually 30 or 45 min), the number of opportunities that
can be accessed using a given travel mode is measured. Within many studies in practice, the ‘opportunities’ measured are jobs,
although in theory there are an infinite number of other opportunities that could exist, such as health clinics, hospital emergency
departments, educational institutions and retail outlets (Geurs and van Wee, 2004; Vickerman, 1974). This measure considers all
opportunities equal and excludes those that are beyond the defined threshold, hence not considering the travelers’ perceptions of time
(Ben-Akiva and Lerman, 1979). An alternate measure of accessibility is the gravity-based measure, which discounts the desirability of
the opportunities that are further away, meaning that the closest opportunities to the origin carry more weight (Geurs and van Wee,
2004; Handy, 1994; Hansen, 1959; Owen and Levinson, 2014; Vickerman, 1974). This measure more closely follows travel behavior
theory, yet the results can be more difficult to communicate to the public. Gravity-based and cumulative accessibility measures have
been found to be highly correlated, which enables researchers to use either model as necessary (El-Geneidy and Levinson, 2006;
Manaugh and El-Geneidy, 2011). We have therefore opted for a cumulative opportunity model in this study, due to its ease in
communication.

                                                                    2
E. Grisé et al.                                                                                    Transportation Research Part A xxx (xxxx) xxx–xxx

    Determining accessibility by public transport is an effective tool to evaluate the distribution of services in a region, particularly to
assess how the transport system benefits different populations (Foth et al., 2013; Pucher and Renne, 2003; Sanchez et al., 2004).
Equity within transport studies often refers to the fairness of the distribution of transportation costs and benefits (Martens, 2017).
However, defining what is a fair distribution of the associated costs and benefits is an elusive concept in the transport literature. For
the purpose of this study, a measure of equality is adopted, whereby all individuals deserve equal levels of accessibility. In other
words, individuals in a wheelchair require at least the same levels of accessibility as the general population residing in the same
location. The need to deliver equal levels of service to all individuals has been adopted within universal design principles, which
would in theory ensure that wheelchair users would have equal levels of accessibility as the general population residing in the same
location.
    Comparing the level of accessibility between those in a wheelchair and the rest of the population has previously been developed in
an indoor retail context (Hagg and El-Geneidy, 2010). To our knowledge, however, accessibility tools have not been used to measure
these differences in job accessibility using public transport.

2.2. Universal design

    The concept of universal design aims to provide all individuals with or without disabilities in a region with the right to access and
use the same public systems at the same level of service (Evcil, 2009; Imrie and Kumar, 1998). According to the principles of universal
design, obstructions such as stairs, heavy doors, steep ramps, and poor signage/lighting should be minimized, to develop an en-
vironment that is truly open and functional to everyone (Bromley et al., 2007). Despite the efforts of public organizations and
advocacy groups, the current public transport system in many high-income countries does not meet the basic standards for universal
design. The built environment, including the transport system is usually designed for the perceived model user, which is young and
able bodied (McMillen, 2001). This is a major issue since a growing percentage of the population is aging and acquiring disabilities as
they age. According to the 2012 statistics, about 14% of the Canadian population has some sort of physical disability (Statistics
Canada, 2016). Lack of universal design can be just as disabling as a physical condition, which denies people with physical disabilities
the same levels of access as people without disabilities (Evcil, 2009; Kitchen and Law, 2001). Over two-thirds of respondents to a
survey about disability reported that the society was their main cause of disability, not their physical impairment (Bromley et al.,
2007). As a result of the importance of universal access, in the 1990s several governments such as the United States and the United
Kingdom passed disability legislations ensuring equal access to all individuals, which required public agencies to ensure that all their
facilities are accessible to all individuals. In Canada such legislation does not exist at the federal level, and in the absence of a federal
disabilities act, the rights of disabled Canadians and obligations of public agencies including public transport organizations, is
reserved to provincial government acts.

2.3. Disability legislation in Canada

    In the absence of a federal disabilities act with enforceable physical access standards, such as the Americans with Disabilities Act
of 1990 (ADA) in the United States, the decision to enact disability legislation to ensure public agencies and businesses provide equal
access to all individuals lies at the hands of individual provinces, although the majority have no such legislation. The Ontario
legislation currently in place is the Accessibility for Ontarians with Disabilities Act, 2005 (OADA), whose stated purpose is as follows:
    “the purpose of this Act is to benefit all Ontarians by
    (a) developing, implementing and enforcing accessibility standards in order to achieve accessibility for Ontarians with disabilities with
    respect to goods, services, facilities, accommodation, employment, buildings, structures and premises on or before January 1, 2025.”
                                                                                                           (Government of Ontario, 2005)
    The equivalent Quebec legislation is the Act to secure handicapped persons in the exercise of their rights with a view to achieving
social, school and workplace integration, 2004. The stated objective of this act is as follows:
   “The objective of this Act is to secure handicapped persons in the exercise of their rights and, through the involvement of government
   departments and their networks, municipalities and public and private agencies, to help them integrate into society to the same extent as
   other citizens by providing for various measures to apply specifically to handicapped persons and their families, their living environments
   and the development and organization of resources and services for them.
   To that end, this Act aims to enable the Office to efficiently carry out its role in assessing the integration of handicapped persons, to ensure
   compliance with the principles and rules of this Act and to play a decisive role in providing advice, coordination and consultation with a
   view to improving opportunities for handicapped persons.”
                                                                                                             Gouvernement du Québec, 2004
    From contrasting the above statements of purpose, it is apparent that whilst the OADA explicitly states that accessibility standards
are to be developed, implemented and enforced on or before January 1st, 2025, the equivalent Quebec legislation deploys a much
softer tone with no definitive deadline for standards to be in place, or without indeed even an assertion that any standards are (or at
any point will be) mandatory. The presence of standards and a deadline to adhere to them does not necessarily mean that accessibility
for wheelchair users in Ontario is anticipated in this study to be perfect. As the deadline for OADA standards to be in place is by 2025,
there are conceivably many buildings or elements of the transport network that are not yet meeting those standards within Ontario.
One of the key examinations within this study is to examine accessibility outcomes for wheelchair users within two different

                                                                      3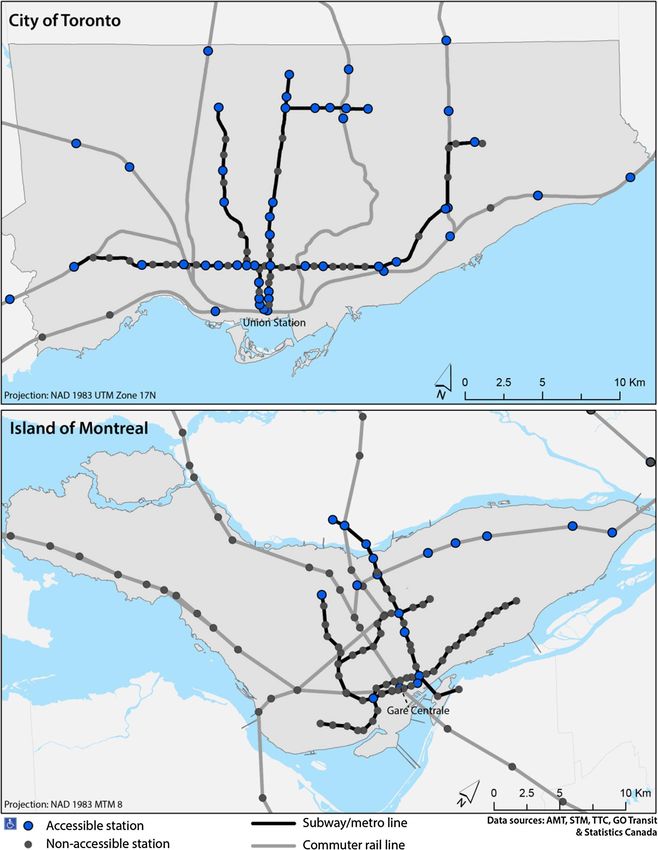
E. Grisé et al.                                                                                                Transportation Research Part A xxx (xxxx) xxx–xxx

legislative contexts.

3. Study context

    As the largest metropolitan area in Canada, the Greater Toronto Area, Ontario is home to almost 6.5 million people, of whom 2.7
million live within the City of Toronto (Statistics Canada, 2017). Public transport in the City of Toronto is provided by the Toronto
Transit Commission (TTC), which operates a network of subway, streetcar and bus service. Regarding wheelchair access of the TTC
network, the TTC operates a fleet of universally accessible buses that are either low-floor or equipped with a ramp. As of 2017, 35
(total 69) stations in the subway network are accessible for customers with physical disabilities, and the remaining 34 stations are
planned to be retrofitted with elevators by 2025 (Toronto Transit Commission, 2016). The historic streetcar network is currently
transitioning to a fleet of low-floor streetcars, and they anticipate that all streetcar routes will be accessible by 2019 (Toronto Transit
Commission, 2017b). To meet the AODA standard for accessibility by 2025, approximately 5% of the TTC’s Capital Budget is
dedicated to projects that will improve accessibility for customers with disabilities (Toronto Transit Commission, 2016). In addition
to the public transport service provided by the TTC, GO Transit operates regional public transport service within the Greater Toronto
and Hamilton Area (GTHA). GO Transit consists of a network of commuter trains and a regional bus service. Stations served by the
commuter rail service are predominantly wheelchair accessible (56 out of 62 are accessible), and GO Transit operates bus routes with
accessible vehicles, however some bus stops are inaccessible and require accommodation for individuals traveling with a wheelchair.
    As the second largest metropolitan region in Canada, the Greater Montreal Area, Quebec is home to almost 4 million people, of
whom 1.9 million reside on the Island of Montreal (Statistics Canada, 2017). The major employment centers within the Greater
Montreal Area are also situated on the Island of Montreal, both in the central business district and in other centers that are accessible
by public transport (Manaugh and El-Geneidy, 2011; Shearmur et al., 2007). The largest public transport agency in the region is the
Société de Transport de Montréal (STM), which operates subway and bus services on the Island of Montréal. Whilst almost all bus
services provided by the STM are wheelchair accessible (the exceptions being minibuses and shuttles), at the time of analysis there
were 12 wheelchair accessible subway stations equipped with elevators, from a total network of 68 stations (Société de Transport de
Montréal, 2017), but 11 stations were classified as wheelchair accessible in the GTFS data. Between the years 2017 and 2022 the STM
plans to invest 213 million dollars for retrofitting subway stations, from a total annual budget of 1.4 billion in 2017. This corresponds
to 3% of the annual budget if investments were to be equally distributed across years. The Agence Métropolitaine de Transport (AMT)
are responsible for operating commuter rail services which are principally aimed at transporting commuters from distant suburbs to
downtown Montreal. Consequently, the service frequency of commuter trains is highest during weekday morning and afternoon
peaks, with little service provided on off-peak weekdays and weekends. The AMT network consists of 66 rail stations, of which 10
were wheelchair accessible at the time of analysis (Agence Métropolitaine de Transport, 2017). Table 1 shows a comparison between
the two study regions in term of size and universal accessibility adherence when public transport networks are confined to the City of
Toronto and Island of Montreal boundaries used within this study. Fig. 1 demonstrates a map of the public transport networks in both
cities, and displays which subway or commuter rail stations are wheelchair accessible.
    Both cities offer a door-to-door paratransit service for individuals with a disability, which is a pre-scheduled service. While this
service will remain important in cities to ensure that all residents have access to transport services, it is beneficial to both the
individual and the public transport agency to provide accessible service so individuals in a wheelchair can use the conventional
transport network. From an agencies point of view, each trip delivered by paratransit service is extremely costly. Transitioning
paratransit customers on to the conventional network is not only more cost-effective for public transport agencies, but is better for
individuals who can travel independently and are not isolated in a paratransit vehicle (Currie, 2011).

4. Data

   Accessibility analyses require two types of data: travel time and number of jobs. Firstly, General Transit Feed Specification (GTFS)
data from Montreal and Toronto was used to calculate travel time between census tracts (CTs) for the general population and for
those in wheelchairs. Travel time was calculated at 8:00 am for both study areas (City of Toronto and Island of Montreal) based on
data from March 2017 GTFS. Secondly, the number of jobs data was obtained at the CT level from the 2011 National Household

                  Table 1
                  Summary of demographic characteristics and public transport system accessibility for the study areas.

                                                                             City of Toronto                              Island of Montreal

                    Demographic characteristics
                    Population                                               2.7 million                                  1.9 million
                    Number of Jobs                                           1.1 million                                  1.3 million

                    Transport characteristics
                    Subway stations                                          69                                           64
                    Of which are accessible:                                 35                                           8
                    GO Transit/AMT stations                                  21                                           33
                    Of which are accessible:                                 16                                           8
                    Wheelchair Accessible Buses                              Yes                                          Yes

                                                                               4
E. Grisé et al.                                                                                           Transportation Research Part A xxx (xxxx) xxx–xxx

                       Fig. 1. Context maps of the public transport networks in the City of Toronto and the Island of Montreal.

Survey commuter flows dataset (Canada, 2011). The final source of data in this analysis consisted of demographic CT information,
including median income, unemployment rates, percentage of recent immigrants (immigrated 2006–2011) and percentage of tenants
spending more than 30% of total income towards shelter costs. These data were used to evaluate levels of job accessibility for
wheelchair users residing in socially vulnerable areas. The demographic data were obtained from the 2011 Statistics Canada National
Household Survey.

                                                                          5
E. Grisé et al. Transportation Research Part A xxx (xxxx) xxx–xxx
5. Methodology
In this article we generate a methodological approach to highlight the gap in accessibility to jobs by public transport in two
Canadian cities between people with a physical disability and the rest of the population. Accessibility has been used in the past as a
key land use and transport performance measure (Wachs and Kumagai, 1973). It has been also used to measure equity gaps for
vulnerable groups, mostly low income population to compare the level of service provided to them (El-Geneidy et al., 2016; Foth
et al., 2013; Manaugh and El-Geneidy, 2012). However, accessibility studies have previously commenced with the assumption that
the entire public transport network is accessible to all individuals. Generating accessibility to jobs requires obtaining travel time
matrices, which were derived from the GTFS data. Two matrices are generated for every region, the first is travel time at 8:00 am
between every CT centroid and every other CT centroid in the study areas without consideration of trips for an individual in a
wheelchair. These travel times were calculated using the Add GTFS to a Network Dataset toolbox in ArcGIS for weekday 8:00 am
departure time. Within the GTFS data, public transport providers specify which rail or subway stations are physically accessible for
someone traveling in a wheelchair, as well as which trips are operated by a physically accessible vehicle, for example a low-floor bus.
Accordingly, using the same Add GTFS to a Network Dataset toolbox in ArcGIS for an 8:00 am departure time, we generated a second
travel time matrix for each region, yet for people using a wheelchair. In other words we used two networks in both study areas to
generate the travel times, the first for the general population has no restrictions in using any station or bus line, whilst the second is
one for the wheelchair users who are restricted to using only the accessible parts of the network.
The calculated routes for public transport trips were based on the shortest travel time, which may not always reflect a trip that a
user would take in reality, for reasons such as too many transfers. The travel time of each trip includes walking to the station or stop,
in-vehicle travel time and walking to the final destination. An important limitation of this method is that walking distances were not
restricted. While there is literature available to guide planners on how long someone is willing to walk to public transport, there is
currently no information to guide how far an individual in a wheelchair is willing to travel to reach a bus stop or subway station.
Therefore this was not modelled in our study. Furthermore, we did not account for the additional time that may be required for an
individual in a wheelchair to travel to and from the transit stop and to transfer either between transit modes or to enter or exit a
transit station. Individuals in wheelchairs may experience a delay in their trip as a result of the time needed to navigate a station and
to access it due to street-scape issues. For these reasons, we likely overestimated accessibility levels for certain census tracts for people
in wheelchairs.
Using the travel time matrices for both wheelchair users and non-wheelchair users, a cumulative opportunity measure of ac-
cessibility (number of jobs within 45 min) by public transport to jobs at 8:00 am on a weekday (non-holiday) were measured. A
threshold of 45 min was selected as it represents the average commute time to work by public transport in both regions- Montreal
43 min & Toronto 47 min as per Statistics Canada (2011). A visual comparison between the levels of accessibility to jobs by public
transport at 8:00 am for people using a wheelchair and for those not using one is conducted in the analysis section for the two case
studies.
A social deprivation index was also added to the accessibility maps, to help in identifying areas where there are higher pro-
portions of socially vulnerable individuals, and where an individual in a wheelchair will suffer from lower accessibility more sig-
nificantly than those not using a wheelchair, residing in the same area. Socially vulnerable individuals have been shown to be more
transit dependent (Foth et al., 2013), and accordingly, wheelchair users that are socially vulnerable are more likely to suffer from
accessibility constraints imposed by the public transport system. In contrast, wheelchair users with lower social vulnerability are
more likely to have other options to access job opportunities. In this regard, poor accessibility for wheelchair users is likely to have
greater impacts in areas characterized by a higher proportion of socially vulnerable individuals. To generate a social deprivation
index for both regions, median income, unemployment rate, percentage of recent immigrants (2006–2011) and percentage of tenants
spending more than 30% of total income towards shelter costs in every CT were standardized using a Z-score approach. The stan-
dardized scores were then summed with equal weights to create a social deprivation indicator value for each census tract, a method
similar to Foth et al. (2013).
The second part of the analysis is where we conducted a direct comparison by calculating the ratio between accessibility with and
without a wheelchair by public transport to jobs in both regions. A high ratio (ratio nearer to 100%) indicates a small gap in
accessibility, meaning people in a wheelchair are receiving the same level of service as the rest of the population. While a low ratio
(less than 60%) indicates a big discrepancy between the accessibility experienced by the two studied populations. Areas with low
levels of accessibility in both regions were excluded from the ratio analysis. CTs that fell within the lowest tier of accessibility for non-
wheelchair users (using the Jenks natural breaks method) were excluded. The reason for excluding these areas was that the findings
can be misleading, as most areas with low levels of job accessibility were found to have very high ratios. The level of public transport
service in these low accessibility areas is generally low, with limited to no subway or rail service. Being served only by bus services
(which are wheelchair accessible), these areas are characterized by a high ratio. The high ratio could suggest that no improvement is
needed in these areas to increase the level of accessibility of individuals in a wheelchair, while in reality the level of service received
by both wheelchair and non-wheelchair users is poor.
6. Results and analysis
Commencing with the City of Toronto, Fig. 2 shows the accessibility by public transport maps at 8:00 am on a weekday for a
person not in a wheelchair and for a person in a wheelchair. For the general population in Toronto (map A), the importance of the
subway is evident as accessibility is much higher in the CTs where subway stations are located. Accessibility then decreases as
6E. Grisé et al. Transportation Research Part A xxx (xxxx) xxx–xxx
Fig. 2. Job accessibility by public transport in the City of Toronto.
distance from the CBD increases with exceptions around subway stations.
Focusing on accessibility levels for people in a wheelchair in Toronto (map B), a reduction in the number of jobs that can be
accessed within 45 min is observed. Accessibility is still generally higher along the subway lines for wheelchair users. However, some
areas around subway and commuter lines have low accessibility, as there are significant gaps in wheelchair access of subway stations
or commuter rail stations. On average, wheelchair users in the City of Toronto have access to 267,257 jobs, compared to 355,941 jobs
7E. Grisé et al. Transportation Research Part A xxx (xxxx) xxx–xxx
accessible to an individual not in a wheelchair. These results suggest that, on average, 75% of the jobs accessible to the general
population are accessible to an individual in a wheelchair. Furthermore, 38% of the CTs have high levels of accessibility (more than
500,000 jobs), however when considering wheelchair accessibility, this proportion to 20% of the CTs. These findings indicate that
accessibility to jobs is largely reduced when using the wheelchair accessible network in the City of Toronto.
The 20% most socially vulnerable CTs in the City of Toronto experience, on average, greater levels of accessibility (417,762 jobs)
relative to the City’s average (355,941 jobs). This is also the case for wheelchair accessibility, where 326,825 jobs can be reached
using a wheelchair from the most socially vulnerable CTs, compared to 267,257 jobs for all CTs in the City of Toronto. When
comparing accessibility for wheelchair users and non-users in socially vulnerable areas in the City of Toronto, a ratio of 78% is
observed (75% for the City of Toronto). Accordingly, socially vulnerable areas are experiencing a similar reduction in accessibility to
the rest of the City.
The 20% most socially vulnerable CTs in the City of Toronto are split generally into two categories, those that lie centrally within
the City and those on the periphery. On average a person in a wheelchair living in a socially vulnerable area in the center of Toronto
(CTs within 5 km of the Toronto’s major public transport hub Union Station, see Fig. 1), will have access to 513,756 jobs within
45 min in the a.m. peak compared to 675,102 that a person not in a wheelchair can access at the same time, which corresponds to a
ratio of 76%. Meanwhile for socially vulnerable neighborhoods outside the center of Toronto, a person in a wheelchair commuting at
8 a.m. will have access to 314,156 jobs within 45 min compared to 257,422 jobs, or 82% of jobs that a person not in a wheelchair can
access at the same time. The higher ratio is likely explained by the fact that many socially vulnerable neighborhoods outside the
center of the City of Toronto are mainly served by bus services. Since all TTC buses are wheelchair accessible, the difference in
accessibility is lower than areas that are served by subway and commuter rail, as well as inaccessible streetcars serving many east-
west routes in the central CTs of Toronto. However, a high ratio in these areas is not indicative of high accessibility by wheelchair,
since general accessibility is also low.
As shown in Fig. 3, accessibility by public transport in Montreal for the general population portrays a similar narrative to that of
Toronto, with accessibility highest within the more central CTs and those closest to the subway and commuter rail lines. The
accessibility for a wheelchair user by contrast, demonstrates a startling drop, which is greater than that revealed in Toronto. On
average, wheelchair users on the Island of Montreal have access to 46% of the jobs that are accessible for an individual not in a
wheelchair (190,488 jobs compared to 418,092 jobs). Also, only 3% of the CTs have access to more than 500,000 jobs for an
individual in a wheelchair, compared to 50% of the CTs for an individual not in a wheelchair. These discrepancies indicate an
important drop in accessibility between individuals in a wheelchair and individuals who are not, which is far more pronounced than
in Toronto.
With respect to the 20% most socially vulnerable CTs in Montreal, they also experience, on average, greater levels of accessibility
(490,768 jobs) relative to the region’s average (418,092 jobs). Wheelchair accessibility is also higher in the most socially vulnerable
CTs, where 231,309 jobs can be reached using a wheelchair from the most socially vulnerable CTs, compared to 190,488 jobs for the
Island of Montreal. A similar ratio between wheelchair accessibility and non-wheelchair accessibility is observed for socially vul-
nerable areas (47%) compared to the whole region (46%).
Evaluating these numbers in central and non-central regions of the Island of Montreal, we found that for socially vulnerable areas
in the center of Montreal (CTs within 5 km of Montreal’s major public transport hub Gare Centrale, see Fig. 1), a person commuting in
a wheelchair will have access to 349,280 jobs within 45 min in the a.m. peak compared to 667,285 jobs that a person not in a
wheelchair can access at the same time, which is approximately 52%. In socially vulnerable neighborhoods in the non-central areas of
Montreal, an individual in a wheelchair will have access to 161,915 jobs compared to 386,934 jobs that a person not in a wheelchair
can access at the same time, which is a 42% ratio. The higher ratio in central areas can be explained by the proximity to wheelchair-
accessible subway stations, while many non-central socially vulnerable CTs are located in proximity to non-wheelchair accessible
subway or commuter rail stations.
The findings for the Island of Montreal are not consistent with the findings from Toronto, where the gap in job accessibility for
those living in socially vulnerable areas is more pronounced in central areas of the City (76%) compared to non-central areas of
Toronto (82%). Non-central socially vulnerable CTs are mainly served by bus service in the City of Toronto, whereas many non-
central socially vulnerable CTs on the Island of Montreal are located in proximity to subway service. In this regard, improvements to
wheelchair accessibility by public transport for socially vulnerable neighborhoods on the Island of Montreal can be achieved by
increasing the number of wheelchair accessible stations in non-central areas, whereas in the City of Toronto, improvements to the
overall level of service in non-central socially vulnerable areas would be needed.
6.1. Accessibility ratio
By evaluating accessibility to jobs for individuals in a wheelchair compared to a person not in a wheelchair, large gaps in
accessibility were observed for wheelchair users. In this section we want to understand what is most significantly contributing to
these gaps, and to highlight areas in need of improvements in universal design of the public transport networks. To do so we focus on
areas that have good public transport access for non-wheelchair users, namely around subway stations and commuter rail stations,
which are areas where wheelchair users are most greatly excluded from. Accordingly, for the purpose of this analysis, only CTs with
medium and high levels of accessibility are considered. The gap in accessibility in areas with poor public transport accessibility is
moderate since the overall level of service, which is predominantly provided by buses, requires improvements for the entire po-
pulation, which is not the focus of the study.
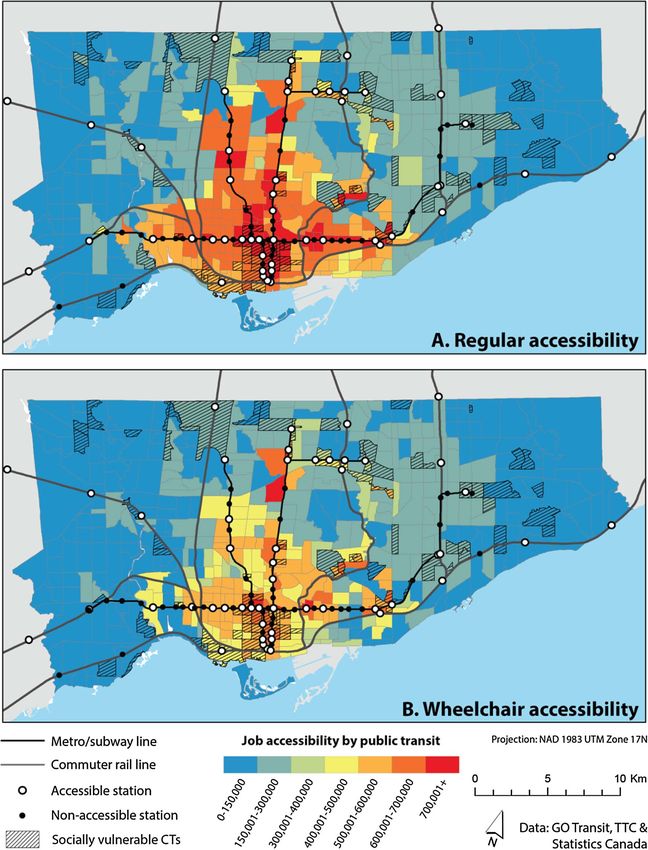
Fig. 4 shows the ratio between the levels of accessibility to jobs at 8:00 a.m. for a person in wheelchair compared to a person not
8E. Grisé et al. Transportation Research Part A xxx (xxxx) xxx–xxx
Fig. 3. Job accessibility by public transport in Montreal.
using a wheelchair for both case studies, for CTs with medium and high levels of accessibility. The same ratio is also derived for the
20% most socially vulnerable CTs separately.
Commencing with the cities as a whole, in Toronto, around 50 per cent of CTs have an accessibility ratio above 80 per cent, and
more than 80 per cent of CTs have a ratio above 60 per cent. In Montreal, only 2 per cent of CTs have a ratio above 80 per cent and
almost 30 per cent of CTs have a ratio over 60 per cent. In contrast, over 50 per cent of Montreal CTs have a ratio below 40%. In the
9E. Grisé et al. Transportation Research Part A xxx (xxxx) xxx–xxx
100%
90%
Proportion of census tracts
80%
70%
60% 81 % - 100%
50% 61 % - 80 %
40% 41 % - 60 %
30% 21 - 40 %
20% 0 - 20 %
10%
0%
Toronto Toronto Montreal Montreal
(socially (socially
vulnerable CTs) vulnerable CTs)
Fig. 4. Proportion of census tracts that fall within each accessibility ratio interval in the City of Toronto and the Island of Montreal, for all CTs and socially vulnerable
CTs.
20 per cent most socially vulnerable CTs in Toronto, we can see that these neighborhoods are marginally better off, where a lower
proportion of them have a ratio below 60 per cent compared to the rest of the region. The proportion of socially vulnerable CTs with a
ratio below 20 per cent is lower in the most socially vulnerable Montreal CTs, but no socially vulnerable CT in Montreal has a ratio
above 80 per cent.
Overall, these results further highlight that the Island of Montreal is characterized by greater gaps in wheelchair accessibility.
Nonetheless, in both the City of Toronto and the Island of Montreal, no census tracts characterized by medium and high levels of
accessibility have a ratio of 100%. Since any gap below 100% should be resolved to ensure equal access to jobs for wheelchair and
non-wheelchair users, these findings highlight that all areas need improvements in wheelchair accessibility, especially through the
retrofitting of subway and commuter rail systems in Montreal and Toronto as will be discussed below. Fig. 5 highlights the differences
in these ratios spatially. Again, in these maps we only display accessibility ratios of CTs with medium and high levels of accessibility
to focus our analysis on the gap in accessibility between public transport users in a wheelchair and those not using a wheelchair.
These maps can be used by public transport planners and city officials, to identify priority areas for improving public transport
accessibility for wheelchair users.
When comparing the two public transport networks, and accessibility ratios, the effect of large gaps in accessible subway stations
and commuter rail stations is evident. Within Toronto, CTs with the lowest ratios (less than 40%) are mainly located around non-
accessible stations as excluding these stations from the network to run the wheelchair accessible model would have unsurprisingly
resulted in a significant reduction in subsequent accessibility. There are two regions in Toronto, where the accessibility ratio is lowest
(under 20%). These areas are located in CTs located just south of the Bloor-Danforth line, which is the major east-west subway line.
Low ratios in job accessibility can be largely attributed to gaps in subway station accessibility, where individuals living in proximity
to these stations must either take a bus to a nearby wheelchair accessible station, or consider other alternatives to reach their desired
destinations. These low ratios can be addressed by retrofitting of the subway stations on the Bloor-Danforth line in these areas.
Within Montreal, very low ratios (under 20%) are largely found in areas surrounding the non-central portions of the Green
subway line, which extends from the Southwest to the Northeast of the region, through Gare Centrale. This is again unsurprising as
the entire Green line consists of only two wheelchair accessible stations that are interchange stations, which results in a dramatic
reduction in accessibility for wheelchair users in contrast to the general population. High and medium ratios (above 40%) are mainly
located around stations that are accessible to wheelchair users on the north-eastern portion of the Orange subway Line (the U-shaped
subway line that crosses to the North Shore of Montreal) and downtown, where there is the greatest concentration of wheelchair
accessible stations and the only wheelchair accessible commuter rail line serves portions of this corridor. The spatial concentration of
accessible subway stations and commuter rail stations is evident on the map, and results in an extremely unequal distribution of job
accessibility for wheelchair users, across the Island of Montreal. Accordingly, these gaps in subway station accessibility in Montreal
need to be addressed, both in the long term by planning the retrofitting of stations in areas with large gaps, as well as in the short term
by increasing alternatives for these individuals, such as feeder bus service to accessible subway stations.
Furthermore, the 20% most socially vulnerable CTs are displayed on the maps, in order to identify areas where there are high
proportions of socially vulnerable individuals, who are likely to be negatively affected by low accessibility to jobs by public transport.
Accordingly, from a social equity perspective, socially vulnerable CTs should receive special attention for improvements in universal
design of the public transport systems, especially those currently characterized by a low ratio. In the City of Toronto, a few socially
vulnerable CTs are experiencing very low accessibility ratios on the western portion Bloor-Danforth line. On the Island of Montreal,
several pockets of socially vulnerable CTs are experiencing low ratios, namely around the western portion of the Orange subway line,
and on the eastern areas of the Island. By displaying accessibility ratios and socially vulnerable CTs, these maps highlight areas which
10E. Grisé et al. Transportation Research Part A xxx (xxxx) xxx–xxx
Fig. 5. Accessibility ratio.
are in need of improvements, both from a social and spatial perspective.
7. Discussion and conclusion
Developing public transport service that follows universal design principles is an important target for public transport agencies to
ensure that the built environment is not disabling individuals in a wheelchair. In this study, we evaluated public transport networks
11E. Grisé et al. Transportation Research Part A xxx (xxxx) xxx–xxx
in two Canadian cities, Montreal and Toronto, where both cities are retrofitting their networks to ensure that all individuals can use
the public transport system. The objective of this study was to generate a methodology using accessibility measures to jobs to identify
the gaps in accessibility by public transport to jobs for wheelchair users compared to non-wheelchair users. Using GTFS data that
provide details regarding whether public transport stations are accessible for individuals in a wheelchair and whether trips are
operated with an accessible vehicle, we calculated the number of jobs that can be reached within 45 min of travel by public transport
for an individual in a wheelchair and compared this number to the total number of accessible jobs for a person not in a wheelchair.
The results of this study contribute to the accessibility literature by presenting a new method of evaluating the performance of the
transport and land use system that considers how well the public transport network is able to connect wheelchair users in a region to
employment opportunities. The methods of this study can be replicated in other contexts where physical access information is
provided by transit agencies within GTFS data as well as demonstrating how transit agencies can apply such data to generate
accessibility measures that are sensitive to physical access. In a robust quantitative culture, measuring the level of transit (in)
accessibility for these disadvantaged groups will have important impacts for bringing attention to how significant this issue is. The
findings demonstrate how large the gap in accessibility to jobs is between wheelchair users and the general population currently is,
which points to the need for interventions to increase access for individuals with physical disabilities. Furthermore, we identified
areas in both cities that have high proportions of socially vulnerable individuals, to highlight locations in the network that should be
identified as priority locations for intervention. Access to employment opportunities through public transport in socially vulnerable
neighborhoods is particularly critical for the well-being of physically disabled individuals, who are more likely to lack alternative
means for mobility. While this study focused on public transport trips for individuals in a wheelchair, findings from this research can
be of value for many individuals beyond those in a wheelchair, for example older adults, individuals traveling with a stroller, or
travelers with heavy bags or luggage.
In the City of Toronto, there are clear goals to retrofit all inaccessible subway stations by 2025, in accordance with the AODA
legislation. As of 2016, approximately half of Toronto’s subway stations were wheelchair accessible, and to this effect on average,
wheelchair users in Toronto have access to 75% of jobs that are accessible to users without a disability. Accordingly, job accessibility
for individuals traveling in a wheelchair is lower than regular accessibility, which is particularly evident around inaccessible subway
stations and areas in the downtown core which are predominantly served by inaccessible streetcars. The STM’s scheduled accessi-
bility plan aims to have 41 subway stations accessible by 2025, which is phase 1 of their accessibility plan. However 11 subway
stations were accessible at the time of this analysis and as a result has revealed more severe disparities in accessibility levels.
Individuals traveling in a wheelchair in Montreal have access to only 46% of the jobs accessible to other users.
A major difference in the wheelchair accessibility ratio between these two cities can be explained by large spatial gaps in subway
and commuter rail station access in Montreal. Accessible stations can only be found on one line of both the subway and commuter rail
network, and as a result, there are large gaps in the region where individuals in a wheelchair cannot access the subway system. It is
evident by the results of the ratio of accessibility measures, that subway access and access to rail service is imperative to job
accessibility, because of the efficient and frequent service offered by rail.
The process of retrofitting subway stations with elevators to ensure universal design principles are met is time consuming due to
the construction and financial challenges associated with adding elevators in older structures. However, in the shorter term, oper-
ating wheelchair accessible feeder bus service to stations with elevators can help in reducing the noticeable gap in accessibility. In
order to make this policy more feasible, and to reduce spatial gaps in network accessibility, it is recommended that subway station
upgrades are prioritized at locations where there are no nearby accessible stations. Such an approach will likely increase the number
of destinations accessible by public transport for individuals in a wheelchair.
Public transport agencies are facing rising costs of delivering paratransit service for individuals with physical or cognitive dis-
abilities, particularly with the aging population. Transitioning individuals in a wheelchair who are otherwise able to use the con-
ventional system if physical barriers are removed, is a more feasible and cost-effective strategy for public transport agencies
(Rosenbloom, 2007). In select cities, for example Toronto, paratransit services are moving towards a Family of Services model, which
aims for increased integration of paratransit service with the conventional network, for increased independence and freedom for
customers, as well as the goal of greater spontaneity of trips for these individuals (Toronto Transit Commission, 2017a). However, the
effectiveness of this policy would be hindered in areas of a city with large gaps of accessible stations in the subway system.
We acknowledge the several limitations in this study which when considered, raise further questions regarding the true level of
accessibility for wheelchair users. One limitation relates to the nature of the jobs. It is of course not possible that anyone would be a
suitable candidate for all jobs that they could reach within the threshold. Studies such as ours, risk being misinterpreted or used to
pursue a narrative that disparages the unemployed, regardless of their disability status. The structural nature of employment or
underemployment of course means that many factors such as job sector, seniority, and specifications of any role have to be considered
by individuals when determining what pool of jobs are available to them. This study does not distinguish jobs by sector or any other
criteria that would reflect the employment climate for an individual in reality. It instead broadly measures the total number of jobs
available to society as a whole. Nevertheless, job accessibility is a general indicator of the quality of public transport in relation to
land use activities.
Another related limitation is that we do not account for the numbers of individuals that have access to every job, by car or public
transport. In other words, the competition effect is not included in this study. While such measure is relevant to assess the effect of
accessibility on employment outcomes or mode choice, the competition component falls outside the scope of this paper, where the
aim is to assess the geographical access to jobs provided by the land use and transport systems to individuals with a disability, relative
to the general population. Including job competition would yield similar results, since from a geographical perspective, the com-
petition for individuals with a disability and the general population is the same.
12E. Grisé et al. Transportation Research Part A xxx (xxxx) xxx–xxx
It would be unwise to claim that the presence of provincial legislative standards is the sole reason for relatively better wheelchair
accessibility in Toronto when compared with Montreal. The nature of how infrastructure was originally designed and constructed
many years ago in both cities plays a large role in determining whether buildings have to be retrofitted. Public transport agencies can
conceivably attain the title of a universally accessible network at considerably less cost where their original infrastructure was either
intentionally or unintentionally constructed in a wheelchair accessible manner. As we see more definitive ambitions for standards in
Ontario accessibility legislation, we also see greater accessibility of wheelchair users in Toronto, although we have demonstrated that
some areas remain poorly served by accessible public transport service. Montreal by contrast, has substantial network gaps for
wheelchair users, given that one entire subway line has only two accessible stations. Whilst STM has developed their own ambitions
to make the network universally accessible, there is no existing provincial legislation that enforces this to be achieved by a given
time. We cannot speculate at this stage whether a future federal disability act will require and enforce all provinces in Canada to
adopt equivalent standards to the AODA by a given date or whether such an act would merely suggest and recommend measures, as
per the current Quebec legislation. Were it to aspire for the same impact as the United States ADA, then it would certainly be
worthwhile returning to a similar study in future to evaluate the impact on accessibility for wheelchair users that such legislation
provides.
A potential next step in this analysis for researchers, planners or public transport practitioners to consider is to model accessibility
changes as a result of the installation of an elevator at a rail or metro station or by converting a streetcar or bus route to a fully
accessible route. This would allow public transport agencies to quantify the benefits associated with designing specific stations or
routes to be fully accessible, which can be applied to devise a priority list of future projects. This approach is similar to studies that
measured the accessibility benefits associated with proposed public transport infrastructure (for example Manaugh and El-Geneidy
(2012)). However, we emphasize the importance of identifying areas with low levels of wheelchair accessibility to guide decision-
making processes that will minimize the number of individuals who do not have reasonable access to public transport service.
Acknowledgements
We would like to thank Melinda Morang for her assistance with the modelling of wheelchair trips in ArcGIS. This research was
funded by the Social Sciences and Humanities Research Council of Canada (SSHRC) and the Natural Sciences and Engineering
Research Council of Canada (NSERC). We would like to thank the three anonymous reviewers for their feedback on the earlier
versions of the manuscript.
References
Agence Métropolitaine de Transport, 2017. Accessibility on the Mascouche line. Retrieved 06/06/2017, from https://rtm.quebec/en/accessibility/mascouche-line.
Labour Market Outcomes of Persons with Disabilities in British Columbia. Victoria, B.C.
Ben-Akiva, M., Lerman, S., 1979. Disaggregate travel and mobility choice models and measures of accessibility. In: Hensher, D., Stopher, P. (Eds.), Behavioural Travel
Modelling. Croom-Helm, London, pp. 654–679.
Benoit, C., Jansson, M., Jansenberger, M., Phillips, R., 2012. Disability stigmatization as a barrier to employment equity for legally-blind Canadians. Disab. Soc. 28 (7),
970–983.
Bocarejo, J., Oviedo, D., 2012. Transport accessibility and social inequities: a tool for identification of mobility needs and evaluation of transport investments. J.
Transp. Geogr. 24, 142–154.
Bromley, R.D.F., Matthews, D.L., Thomas, C.J., 2007. City centre accessibility for wheelchair users: the consumer perspective and the planning implications. Cities 24
(3), 229–241.
Canada, S., 2011. Profile of Census Tracts.
Coppola, P., Nuzzolo, A., 2011. Changing accessibility, dwelling price and the spatial distribution of socio-economic activities. Res. Transp. Econ. 31 (1), 63–71.
Currie, G., 2011. New Perspectives and Methods in Transport and Social Exclusion Research. Emerald, Bingley.
Delmelle, E., Casas, I., 2012. Evaluating the spatial equity of bus rapid transit-based accessibility patterns in a developing country: the case of Cali, Colombia. Transp.
Policy 20, 36–46. http://dx.doi.org/10.1016/j.tranpol.2011.12.001.
El-Geneidy, A., Levinson, D., 2006. Access to Destinations: Development of Accessibility Measures Access to Destinations. University of Minnesota, Minneapolis, MN.
El-Geneidy, A., Levinson, D., Diab, E., Boisjoly, G., Verbich, D., Loong, C., 2016. The cost of equity: assessing transit accessibility and social disparity using total travel
cost. Transp. Res. Part A: Policy Practice 91, 302–316.
Evcil, A.N., 2009. Wheelchair accessibility to public buildings in Istanbul. Disab. Rehab.: Assistive Technol. 4 (2), 76–85.
Foth, N., Manaugh, K., El-Geneidy, A., 2013. Towards equitable transit: examining transit accessibility and social need in Toronto, Canada, 1996–2006. J. Transp.
Geogr. 29, 1–10. http://dx.doi.org/10.1016/j.jtrangeo.2012.12.008.
Geurs, K., van Wee, B., 2004. Accessibility evaluation of land-use and transport strategies: review and research directions. J. Transp. Geogr. 12, 127–140.
Golub, A., Martens, K., 2014. Using principles of justice to assess the modal equity of regional transportation plans. J. Transp. Geogr.phy 41, 10–20.
Gouvernement du Québec, 2004. Act to secure handicapped persons in the excercise of their rights with a view to achieving social, school and workplace integration E-
20.1.
Government of Ontario, 2005. Accessibility for Ontarians with Disabilities Act, 2005. O. Reg. 191/11.
Guzman, L., Oviedo, D., Rivera, C., 2017. Assessing equity in transport accessibility to work and study: the Bogotá region. J. Transp. Geogr. 58, 236–246.
Hagg, M., El-Geneidy, A., 2010. Making the Montreal indoor city accessible to people with disabilities. In: Paper presented at the 89th Transportation Research Board
Annual Meeting, Washington D.C., USA.
Handy, S., 1994. Regional versus local accessibility: implications for non-work travel. Transp. Res. Rec. (1400), 58–66.
Hansen, W., 1959. How accessibility shapes land use. J. Am. Inst. Planners 25 (2), 73–76.
Imrie, R., Kumar, M., 1998. Focusing on disability and access in the built environment. Disab. Soc. 13 (3), 357–374.
Kitchen, R., Law, R., 2001. The socio-spatial construction of (in)accessible public toilets. Urban Stud. 38, 287–298.
Korsu, E., Wenglenski, S., 2010. Job accessibility, residential segregation, and risk of long-term unemployment in the Paris region. Urban Stud. 47 (11), 2279–2324.
Legrain, A., Buliung, R., El-Geneidy, A., 2016. Travelling fair: targeting equitable transit by understanding job location, sectorial concentration, and transit use among
low-wage workers. J. Transp. Geogr. 53, 1–11.
Levinson, D., 2007. Density and dispersion: the co-development of land use and rail in London. J. Econ. Geogr. 8 (1), 55–77.
Lillie, E., Alvarado, B., Stuart, H., 2013. Unemployment among Canadians with physical and a co-morbid mental disability: an examination of the 2006 Participation
and Activity Limitation Survey (PALS). Disab. Health J. 6 (4), 352–360.
13You can also read