Swedbank Investor presentation - February 2018
←
→
Page content transcription
If your browser does not render page correctly, please read the page content below

Swedbank Investor
presentation
February 2018
© Swedbank Information class
Public
Disclaimer
Certain statements made in this presentation are forward looking statements. Such statements are based on current expectations
and are subject to a number of risks and uncertainties that could cause actual results and performance to differ materially from
any expected future results or performance, express or implied, by the forward looking statements. Factors that might cause
forward looking statements to differ materially from actual results include, among other things, regulatory and economic factors.
Swedbank AB assumes no responsibility to update any of the forward looking statements contained herein.
No representation or warranty, express or implied, is made or given by or on behalf of Swedbank AB or its directors, officers or
employees or any other person as to the accuracy, completeness or fairness of the information or opinions contained in this
presentation. None of Swedbank AB or any of its directors, officers or employees nor any other person accepts any liability
whatsoever for any loss howsoever arising from any use of this presentation or its contents or otherwise arising in connection
therewith.
This presentation does not constitute or form part of any offer or invitation to sell or issue, or any solicitation of any offer to
purchase or subscribe for, any securities of Swedbank AB, nor shall it or any part of it nor the fact of its distribution form the basis
of, or be relied on in connection with, any contract or investment decision.
© Swedbank Information class
Public
2
Table of contents

        Executive summary                4
1. Swedbank overview                     5
2. Quarterly financial update            15
3. Capital considerations                25
4. Liquidity and funding                 30
5. Cover pool data                       39
6. Swedish and Baltic economy            46
7. Swedish housing and mortgage market   55
8. Appendix                              70

© Swedbank   Information class
             Public
                                              3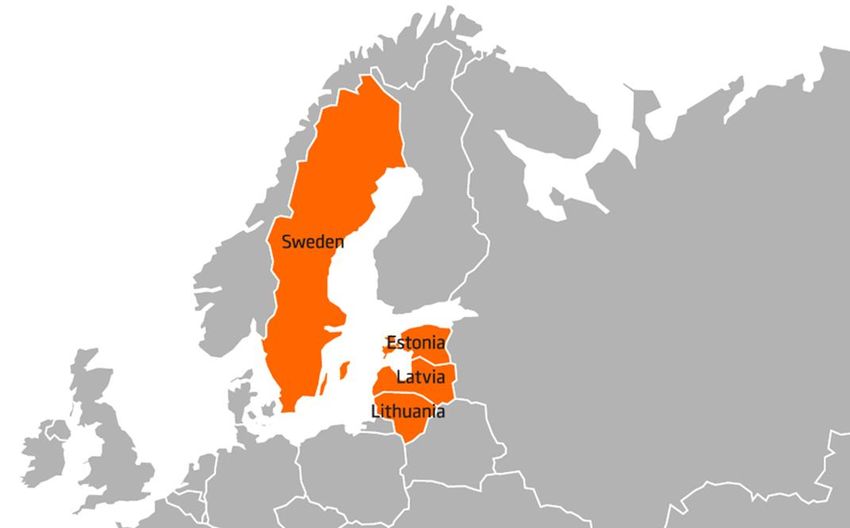
Executive summary
 Strong financial position                                                                                           Top 10 shareholders
■ Sweden’s largest retail bank with a leading position in our three Baltic home markets                              1.    Sparbanksgruppen, 10.3%
                                                                                                                     2.    Folksam, 7.0%
■ ROE target of at least 15%                                                                                         3.    AMF, 5.5%                            Our four
                                                                                                                     4.    Alecta, 4.5%
■ Strong asset quality!                                                                                              5.    Swedbank Robur, 4.1%
                                                                                                                                                                 home
                                                                                                                     6.    Sparbanksstiftelser, 3.3%            markets
■ Solid liquidity and funding position – survival horizon more than 12 months                                        7.    BlackRock, 2.5%
■ One of the best capitalised banks in Europe* with significant buffers to both MDA and Loss                         8.
                                                                                                                     9.
                                                                                                                           Vanguard, 2.4%
                                                                                                                           Norges Bank, 2.0%
     absorption trigger levels                                                                                       10.   SEB Fonder, 1.8%
■ Dividend policy of 75% - for six consecutive years                                                                 Swedish owners, 59.5%
     *According to EBA stress test 2016                                                                              Int’l owners, 40.5%               Sweden
    Swedbank Q4 2017 (Q3 2017) – Robust performance!
■     ROE:                                        14.4% (15.0%)
■     Cost/income ratio:                          0.42 (0.37)
■     CET1 capital ratio:                         24.6% (23.9%) – with requirements of 21.9% (fully loaded CRD IV)                                              Estonia
■     Leverage ratio:                             5.2% (4.7%)                                                                                                 Latvia
■     Credit impairment ratio:                    0.08% (0.06%)                                                                                            Lithuania
■     Share of impaired loans:                    0.55% (0.55%)
■     Total provision ratio for impaired loans:   45% (45%)
■     Liquidity and funding:                      LCR: 173%, NSFR: 110%
■     Credit ratings:                             AA-(S)/AA-(S)/Aa3(S) from S&P/Fitch/Moody’s

© Swedbank          Information class                             Dec 2017
                    Public
                                                                                                                                                                           4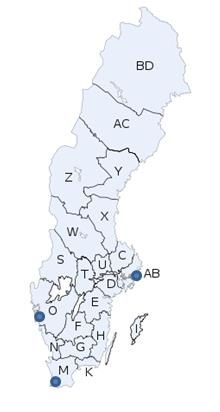
This is
                                                   Swedbank

                            1. Swedbank overview

© Swedbank   Information class
             Public
Swedbank                                                                                                                         This is
                                                                                                                                Swedbank
Low-risk, cost efficient and well capitalised
     Large and diversified customer base                                              Low risk
     Leading retail bank in our 4 home markets                                        Credit impairment ratio

     7m PRIVATE CUSTOMERS                                                             0.08%
     Focus on Mid-corp and SME segments                                               Market-leading cost efficiency
     18% corporate lending market share in Sweden                                     Cost income ratio

     600k CORPORATE CLIENTS                                                           39%
     Stable profitability                                                             Solid capitalisation
     Return on equity target of at least 15%                                          270bps buffer to regulatory requirement

     15.1%                                                                            24.6%

© Swedbank    Information class                  Note: Numbers for full year 2017
              Public                             Source: Swedbank Fact book 4Q 2017
                                                                                                                                           6
Market leading position in our home markets This is
Swedbank
Loans (private)* Loans (corporate)* Deposits (private) Deposits (corporate) Payments** Funds
17% 21% 20% 20%
23%
36%
80% 64%
Sweden 77% 83% 79% 80%
37% 42%
46% 45% 44% 41%
54% 63% 55% 56% 58%
59%
Estonia
18% 16%
31% 32%
42%
50% 58%
69% 50%
68% 84%
Latvia 82%
18% 23%
34% 40% 37%
51% 49%
66% 60% 63%
Lithuania 82% 77%
* Excluding the Swedish National Debt Office and repurchase agreements Swedbank Other
** Bank Giro for Sweden, domestic payment transactions (Estonia, Latvia, Lithuania)
© Swedbank Information class Source: Swedbank Fact book 4Q 2017
Public
7Strong financial position This is
Swedbank
Low risk Stable earnings Market-leading cost
Liquidity and capital ratios (%) Profit before impairments (SEK bn)
efficiency
Total expenses (SEK bn)
10 20
NSFR LCR CET1 ratio, CRDIV (RHS)
One-offs from disposals Acquisition of Sparbanken…
200 30
8 18
25
150
20 6 16
100 15 4
14
10
50 2
5 12
2012 2013 2014 2015 2016 2017 Target
0 0 0
18
2012 2013 2014 2015 2016 2017 Q4 12 Q4 13 Q4 14 Q4 15 Q4 16 Q4 17
Credit impairment (bps) Return on equity (%) Cost / income ratio (%)
40 18 60
16 55
30 14
12 50
20 10
45
8
10
6 40
0 4
2 35
-10 0
30
Q4 12 Q4 13 Q4 14 Q4 15 Q4 16 Q4 17 2012 2013 2014 2015 2016 2017
2012 2013 2014 2015 2016 2017
© Swedbank Information class Source: Swedbank Fact book 4Q 2017
Public
8Stable and profitable business mix This is
Swedbank
- retail bank profile
Total income Net Interest Income Net Commission Income
NII NCI NGL Other
• 86% of total loans in Sweden • Sweden’s largest fund
100% • 51% Swedish mortgages manager (SEK1.2trn AuM)
90% • 5th largest card acquirer &
10th largest card issuer in
80% • Baltic banking very profitable Europe
70% • 10% of Group lending
60% • 20% of Group operating Other
13%
50% profit, FY2017
Asset
40%
Management
Lending and 11%
30% deposits
2017
63% Total
20% Payment,
income Cards
9%
10%
Treasury,
0% Trading and
2015 2016 2017 Capital
Markets
4%
© Swedbank Information class Source: Swedbank Fact book 4Q 2017
Public
9Swedbank strategy
Strategy
An available
full-service bank
Sustainability
and customer Offering based on
Low risk value through a customer need and
responsible expectations
core business
High cost
efficiency
© Swedbank Information class
Public
10Key priorities Strategy
Customer Interaction Savings Lending & Payment
Seamless omni-channel Regain market share through Fully-digital
customer journey high-quality digital savings offer mortgage process
Enhance corporate relationships
Proactive, tailor-made product Increase focus on
with our improved cash
offers and advice pension savings
management solution
One financial access point for Customer-centric Most convenient payments
customers Financial Planning Platform solutions for consumers
© Swedbank Information class
Public
11Digitalisation – cost and income opportunities Strategy
90% of our customers are happy or very happy with our digital services
Increase revenue via digital banking Improve cost and sales efficiency
• Customers increasingly connected via our • Further potential in manual to digital sales
digital channels transformation
• Higher transaction volumes
• More cross-selling opportunities 100%
80%
Customers 60%
w ithout Internet
bank agreement 40%
Digitally active 29%
customers 20%
47%
Connected 0%
customers (less Payments Savings & Lending Insurance
than monthly pensions
usage)
24% Digital sales Manual sales
© Swedbank Information class Note: Data relates to Swedish Banking
Public
122017 Strategic achievements Strategy
Launched in Sweden Retail channels
Already operating in the Baltics
Fully digital consumer lending Positive AuM inflows
Strategic co-operation with Kepler Cheuvreux Personal finance app for customers
Mina Tjänster
Enhanced equity capabilities Fintech partnership
SmartID launched in the Baltics PayEx acquisition
Enables faster transaction process for customers Integration and new launches begun
Digital customer identification Enhanced merchant omni-
and authorisation channel payment solutions
© Swedbank Information class
Public
13Swedbank creates value Strategy
% SEK Return on Equity
30 14 >15% target
*
25 12
20
10 15.1% FY 2017
8
15 Common Equity Tier 1 ratio
6
10
One of the highest among European banks
4
5 2
24.6%
0 0
2012 2013 2014 2015 2016 2017
Dividend per share
Return on Equity (LHS) CET1 capital ratio (LHS) 75% payout ratio for 6th year in a row
Dividend per share (RHS)
SEK 13.00
* Dividend proposal (for the financial year of 2017) - to be decided by the Annual General Meeting in March 2018
© Swedbank Information class Source: Swedbank Fact book 4Q 2017
Public
14Quarterly
financial
update
2. Quarterly financial
update
© Swedbank Information class
PublicSwedish Banking Quarterly
financial
Solid mortgage volume growth update
SEKm Q4 17 Q3 17 ▲QoQ • Net interest income
Net interest income 3 861 3 812 49
– Continued mortgage loan volume growth and
Net commission income 1 952 1 859 93
stable back book margins
Other income 625 443 182
Total income 6 438 6 114 324
• Net commission income
Total expenses 2 309 2 204 105 – Benign stock market development supported
Profit before impairments 4 129 3 910 219 asset management and brokerage income
Credit impairments 264 66 198 – PayEx included for the full quarter
Ratios Q4 17 Q3 17 • Other income
ROE, % 21.2 21.6 – Higher contribution from Entercard and life
C/I ratio 0.36 0.36 insurance
Volumes, SEKbn Q4 17 Q3 17 ▲QoQ • Solid asset quality
Loans 1 150 1 138 12
Deposits 525 519 6
© Swedbank Information class Dec 2017
Public
16Baltic Banking Quarterly
financial
Record high profitability update
SEKm Q4 17 Q3 17 ▲QoQ • Net interest income
Net interest income 1 116 1 060 56
– Lending to households continues to grow
Net commission income 711 565 146
– Stable margins
Other income 226 218 8
Total income 2 053 1 843 210 – Firm deposit growth
Total expenses 737 647 90 • Net commission income
Profit before impairments 1 316 1 196 120
– Benefited from annual performance fees
Credit impairments -12 -26 14
• Positive FX effects
Ratios Q4 17 Q3 17
• Stable asset quality
ROE, % 20.8 18.2
C/I ratio 0.36 0.35
Volumes, SEKbn Q4 17 Q3 17 ▲QoQ
Loans 149 146 3
Deposits 185 172 13
© Swedbank Information class Dec 2017
Public
17Large Corporates & Institutions Quarterly
Result reflected mixed market dynamics financial
update
SEKm Q4 17 Q3 17 ▲QoQ • Stable net interest income
Net interest income 934 896 38
• Net commission income
Net commission income 656 525 131
Net gains and losses 332 554 -222
– PayEx contributed positively
Other income 42 32 10 – Positive stock market performance increased
Total income 1 964 2 007 -43 asset management and custody income
Total expenses 867 841 26 – Annual covered bond market maker fees
Profit before impairments 1 097 1 166 -69
• Net gains and losses
Credit impairments 59 195 -136
– Low FX and fixed income trading activity
Ratios Q4 17 Q3 17
ROE, % 14.2 13.0
– Negative valuation effects
C/I ratio 0.44 0.42 • Lower credit impairments
Volumes, SEKbn Q4 17 Q3 17 ▲QoQ
Loans 203 204 -1
Deposits 128 129 -1
© Swedbank Information class Dec 2017
Public
18Group results Quarterly
financial
Robust performance update
SEKm Q4 17 Q3 17 ▲QoQ
• Mortgage volume growth strengthened net
Net interest income 6 326 6 208 118
interest income
Net commission income 3 291 2 917 374
Net gains and losses 356 525 -169 • Stock market performance and full quarter
Other income 1 003 768 235 PayEx inclusion benefited net commission
Total income 10 976 10 418 558 income
Total expenses 4 563 3 883 680
Profit before impairments 6 413 6 535 -122
• FX effects and lower market activity
Credit impairments 311 235 76
impacted net gains and losses negatively
Other impairments 86 107 -21
• Expenses
Tax 1 277 1 444 -167
Net profit 4 737 4 743 -6 – Restructuring charge of SEK 300m
Ratios Q4 17 Q3 17 – PayEx included for the full quarter
ROE, % 14.4 15.0
• Solid asset quality
C/I ratio 0.42 0.37
CET1 capital ratio, % 24.6 23.9
© Swedbank Information class Dec 2017
Public
19Capital Quarterly
Strong capitalisation – no excess capital financial
update
24.2% 24.6% 23.9% 24.6%
• CET1 capital increased by SEK 0.4bn
21.9%
– Positive effect from net profit of SEK 1.1bn
excl. dividend
– Negative effect from IAS19 of SEK 0.6bn
• REA decreased by SEK 11.1bn
• Buffer above minimum requirements of
Q1 2017 Q2 2017 Q3 2017 Q4 2017 CET1 capital
ratio
around 270bps
requirement
© Swedbank Information class Dec 2017
Public
20Capital Quarterly
financial
Lower REA update
SEKbn
425 • REA decreased by SEK 11.1bn
419.5
– Received VISA-related proceeds
420
reduced REA
415 – Year-end effects reduced REA
-7.3
410 -1.1 -0.7 408.4
-2.0
405
400
Q3 2017 Credit risk Market risk CVA Other Q4 2017
© Swedbank Information class Dec 2017
Public
21Group results – FY 2017 FY
financial
Strong result • ROE of 15.1% - target achieved update
SEKm FY 2017 FY 2016 ▲YoY • Strong organic income generation
Net interest income 24 595 22 850 1 745 – One-off tax-free gains:
Net commission income 12 030 11 333 697 • SEK 2.1bn from VISA in 2016
Net gains and losses 1 934 2 231 -297 • SEK 0.7bn from Hemnet in 2017
Other income 3 879 4 407 -528
Total income 42 438 40 821 1 617
• Underlying expenses in line with FY 2017
Total expenses 16 415 15 627 788
guidance of SEK 16.1bn
Profit before impairments 26 023 25 194 829 • Strong asset quality
Credit impairments 1 285 1 367 -82
– Lower-than-anticipated credit impairments
Other impairments 196 66 130
Tax 5 178 4 209 969
• Higher tax expense - changed dividend
Net profit 19 350 19 539 -189 policy in Estonia and tax on subord. liabilities
Ratios FY 2017 FY 2016 • CET1 capital ratio of 24.6%
ROE, % 15.1 15.8 • Board proposal – dividend of SEK 13.00 per
C/I ratio 0.39 0.38 share
CET1 capital ratio, % 24.6 25.0
– 75% pay-out ratio: Six consecutive years
© Swedbank Information class Dec 2017
Public
22Group Quarterly
financial
Solid asset quality update
Credit impairments, SEKm Q4 17 Q3 17 ▲QoQ • Resilient asset quality in all business
Swedish Banking 264 66 198
segments
Baltic Banking -12 -26 14
Large Corporates & Institutions 59 195 -136
• Lower-than-anticipated credit
Swedbank Group 311 235 76 impairments for the full year (0.08%)
Ratios Q4 17 Q3 17
Credit impairment ratio, % 0.08 0.06
Share of impaired loans, gross % 0.55 0.55
Total provision ratio for impaired
45 45
loans, %
© Swedbank Information class Dec 2017
Public
23ROE target of 15% remains Outlook
2018
• Additional investments to further accelerate our digitisation and automation efforts
– Channel transformation
– Digital payment solutions and e-commerce
– Customer offerings
– Automation
• Investments will allow us to offset underlying cost inflation and over-time lead to net
cost reductions
– The re-organisation of our IT and business development processes – a key facilitator
• Total annual expenses for 2018 and 2019 will be below SEK 17bn
• ROE target of 15% remains
• No excess capital – dividend policy of 75% remains
© Swedbank Information class
Public
24Capital
– fully
loaded
CRD IV
3. Capital considerations
© Swedbank Information class
PublicComposition of Swedbank’s CET1 and total
Capital
– fully
loaded
capital ratio requirements CRD IV
270bp
30.7%
Systemic Risk
27.7% charge in Pillar 2
24.6% 2.0% 25% REA Mortgage
Floor
21.9% 15.9%
Individual Pillar 2
8.2%
2.0% charge
Capital Conservation
Pillar 2
13.3%
6.8% Buffer
2.3%
Countercyclical
2.5% Available Distributable Items
buffer (2.0%)
1.8% Swedbank AB (parent comp) FY 2016** FY 2017
Automatic MDA 1.3%
Restrictions Share premium reserve 13 206 13 206
2.5% Systemic Risk Buffer
Retained earnings 41 277 43 099
3.0% Available distributable items 54 483 56 305
1.3%
11.3% 14.8% Min. Additional T1 Dividend* -14 695
Pillar 1
3.0% 3.5% Comprehensive income 6 988
and T2 capital
other 195
ADI Q1 2017 46 971
Minimum CET1
4.5% 4.5% * paid out in April 2017
Requirement
** Based on fully audited numbers
** The calculation of the ADI is based on the Annual report,
Swedbank CET1 Requirements Swedbank CET1 Capital Ratio Swedbank Total Capital Swedbank Total Capital ratio why this exercise as per Q4 2017 should be seen as an
Requirements example based on changes during the year.
© Swedbank Information class Dec 2017
Public
26Capital
Regulatory uncertainty remains – fully
loaded
CRD IV
• Basel proposal – largely as expected
– Awaiting final details from EU and then Swedish regulator on new standardised approach
– Likely long phasing in period – potentially until 2027
– Comfortable buffers to current capital requirements
– Feel great comfort in our capital generation capacity
– No need to review current dividend policy on the back of the proposal
• IFRS 9
– Limited impact on CET1 capital ratio of – 6bps as per 1 Jan, 2018
© Swedbank Information class Sep 2017
Public
27Capital
MREL needs in line with expectations – fully
loaded
– no imminent issuance plan CRD IV
• Requirements for 2018 set and published by the Swedbank MREL requirements
Swedish National Debt office (NDO) on 20
Based on Risk Exposure Amount Based on total liabilities
December 2017 SEKbn
140 14%
+ own funds
– 7.3% based on Total liabilities + Own funds 31.8% 12.9%
30.7%
120 12%
– 34.8% based on Risk Exposure Amount (REA)
100 10%
• Transition period until 1 Jan, 2022 21.4%
80 8% 7.3%
– Already in compliance with current senior unsecured
debt outstanding 60 13.4% 6%
– Issuance need to the equivalent of around SEK 87bn 40 4%
in subordinated MREL eligible securities to meet
20 2%
requirement by 1 Jan 2022
• Sweden to adopt EU insolvency law 0
Loss absorption amount Swedbank total capital
0%
NDO Swedbank total
Recapitalisation amount Senior unsecured debt >1Y* requirement liabilities + own
– Expected by year end 2018 SREP 2017** funds***
*Nominal amount, ** Based on FY 2016 numbers, *** FY 2017, based on consolidated situation
© Swedbank Information class Dec 2017
Public
28Asset portfolios – low risk Asset
quality
Group loan book* Q4 2017, total SEK 1 502bn CET1 – EBA stress test, 2016, %
25%
Hotels and restaurants, Retail
Shipping and offshore, Transportation 8%
Manufacturing
20%
Other corporate lending 7%
15% 2015
Other property management
2016
15%
10% 2017
Residential properties
2018
Agriculture and forestry
5%
0%
SHB Nordea SEB Swedbank
Loan distribution
Household loans 70% Sweden Baltic banking
(90% mortgages)
30%
Private Private
45%
Corporate 55% Corporate
70%
Tenant ow ner associations
* Loans to the public excl. loans to credit institutions and SNDO
© Swedbank Information class Dec 2017
Public
29Liquidity
and
funding
4. Liquidity and funding
© Swedbank Information class
PublicCore balance sheet structure Liquidity
and
funding
SEKbn SEKbn
1 800
Assets 1 800
Liabilities
1 600 1 600 CET1
Suppl. capital
Simplified balance sheet
Lithuania Senior
Latvia unsecured debt
1 400 Estonia 1 400
1 200 Other corporate 1 200
lending, Sweden &
other Nordic countries
Deposits
1 000 1 000
Other private, Sweden
800 800
600 600
Swedish
400 400
mortgage loans
Covered
bonds
200 200
0 0
Q4 2017 Q4 2017
© Swedbank Information class Dec 2017
Public
31Covered bond strategy Liquidity
and
funding
Covered bond strategy Swedish households’ financial assets
Sweden SEKbn
100% 12 000
SEK 300-375bn
Thousands
90%
10 000
80%
70%
8 000
60%
50% 6 000
EUR/USD
40%
SEK 100-150bn 4 000
30%
20%
2 000
Other
10%
SEK 20-50bn
0% 0
1980 1990 2000 2005 2010 2015 2016
7Y Deposits, cash and retail bonds (LHS) Equities (LHS)
Pension savings and mutual funds (LHS) Other financial assets (LHS)
Maturity, years Total financial assets (RHS)
© Swedbank Information class Dec 2017
Public
32Senior unsecured debt strategy Liquidity
and
funding
SEKbn*
Senior unsecured debt maturity profile
60 Senior unsecured debt
40
20
0
2018 2019 2020 2021 2022 2023 2024-
*Nominal amount
© Swedbank Information class Dec 2017
Public
33Conservative funding position Liquidity
and
funding
• LCR 173% (Swedish FSA definition FFFS 2012:6)
• NSFR 110% (Basel committee)
• Issued SEK 181bn of term funding FY 2017
• Plan to issue around SEK 145bn in 2018
Term funding issuance – completed and planned SEKbn
Prefunded for more than 12 months
SEKbn
700
100 Covered bonds Senior unsecured debt
90 Planned, covered bonds Planned, senior unsecured debt 600
Survival horizon
80
500
70
60 400
50
300
40
30 200
20
100
10
0 0
0 20 40 60 80 100 120 140 160 180 200 220 240 260 280 300 320 340 365
Days forward
© Swedbank Information class Dec 2017
Public
34Long-term funding maturity profile Liquidity
and
funding
Long-term funding maturity profile, by funding source Long-term funding maturity profile, by currency
SEKbn SEKbn
Senior unsecured debt Covered bonds
200 200
150 150
Other
GBP
100 100 USD
EUR
SEK
50 50
0 0
2018 2019 2020 2021 2022 2023 2024- 2018 2019 2020 2021 2022 2023 2024-
© Swedbank Information class Dec 2017
Public
35Private placements – active in both covered Liquidity
and
funding
bonds and senior unsecured debt
• All major currencies • FRN’s (SEK and EUR) – issued with a
• Bullet format, FRN or Fixed “strike adjustment spread”*
• EUR 10m equivalent minimum size • Program formats available:
– Senior unsecured debt: MTN, NSV and potentially
• Sweet spots:
USD 144a format
– Senior: 2.5-5Y
– Covered bonds: MTN, RCB and Norwegian CB
– Covered: 3-8Y program
– Longer tenors also possible
• Open to larger placements with smaller investor
groups
• Open to tap existing bonds
• Listing is optional
*Spread added to the coupon to avoid negative coupon fixings. Bond issued above par to compensate for this. The above par value reflects the NPV of the adjusted
spread
© Swedbank Information class
Public
36Liquidity reserve Liquidity
and
According to the template defined by the Swedish Bankers' Association funding
SEKm
1
Cash and holdings in central banks 208 370
Deposits in other banks available overnight 3
Securities issued or guaranteed by sovereigns, central banks or multilateral development banks 88 006
Securities issued or guaranteed by municipalities or public sector entities 5 636
Covered bonds 46 621
- Issued by other institutions 44 349
- Own issued 2 272
Securities issued by non-financial corporates 292
Securities issued by financial corporates (excl. covered bonds) 409
Other
Total2 349 337
1) Including loans to the Sw edish Ntional Debt Office
2) 95% of the securities in the liquidity reserve per Q4 2017 are rated AAA. The rating requirement is AA-.
Assets included in the liquidity reserve should comply w ith the follow ing:
- assets shall be under the control of the Treasury function in the bank
- assets can not be encumbered
- market values are used for the assets
- only unencumbered securities receiving 0-20% risk w eight under the standardised approach to credit risk of the Basel II framew ork can be included
- securities received in reverse repo transactions shall be included in the liquidity reserve and securities used as collateral for repo transactions shall be excluded
© Swedbank Information class Dec 2017
Public
37Rating Liquidity
and
funding
• On 1 September 2017, Moody’s affirmed Swedbank's ratings at Aa3/P-1 with a stable outlook. The ratings reflect Swedbank’s
strong credit quality, solid regulatory capital and stable earnings, underpinned by its established franchise in Sweden. Swedbank is
also expected to be broadly resilient to the risks in the residential housing market and household sector in Sweden.
• May 26, 2016, Fitch upgraded the rating to AA- from A+, with a stable outlook. The main drivers behind the upgrade
are: Execution of the low risk strategy including conservative risk-returns and underwriting standards, strong retail
franchise and continued strong capitalisation.
• November 24, 2017, S&P affirmed the rating of Swedbank at AA-/A-1+, with a stable outlook. The rating reflect Swedbank’s
strong business position, given the market-leading retail position, strong revenue performance, and efficiency, as well as prudent
management and strategy. S&P also assess the capital and earnings as strong, reflecting the strong earnings capacity. The stable
outlook on Swedbank resilient earnings and capital as Sweden's economy benefits from improvements in Europe's economic
environment and the domestic housing market adjusts to higher volumes and stricter amortization requirements.
S&P (Stable) Moody's (Stable) Fitch (Stable)
Short Long SACP1 Short Long BCA1 Short Long VR1
Swedbank A-1+ AA- a+ P-1 Aa3 a3 F1+ AA- AA-
Swedbank Mortgage A-1+ AA- - P-1 Aa3 - - - -
Covered bonds - AAA - - Aaa - - - -
1
Standalone Rating
© Swedbank Information class Dec 2017
Public
38Swedbank is a labeled issuer of
the ECBC Covered Bond Label
Foundation
(www.coveredbondlabel.com )
5. Cover pool data
© Swedbank Information class
PublicCover pool data1 Swedbank is a labeled issuer of
the ECBC Covered Bond Label
Foundation
(www.coveredbondlabel.com )
Rating, S&P / Moody’s AAA / Aaa Repayment structure 7
Total pool size SEK 928.6bn – Amortising 68%
Geographic distribution Sweden 100% – Interest only 32%
Current OC-level 85.5%
Weighted average seasoning 2 66 months Average loan size SEK 577 975
Average LTV 3, 4 Number of loans outstanding 1 606 567
– WA LTV on property level (Max LTV) 49% Number of borrowers 1 119 065
Non-performing loans 5 None Number of properties 752 474
Dynamic pool Yes
Fixed /Floating interest loans 6
– Fixed 29.3% 1 As per 31 Dec, 2017
Public sector loans not included
– Floating
2
70.7% 3 Index valuation as per Sep, 2017
4 Maximum LTV: Residential 75%, Commercial 60%, Forest and Agriculture 70%
5 Past due loans > 60 days are not eligible for the cover pool
6 Floating interest loans < 365 days
7 Property level of cover pool
© Swedbank Information class Dec 2017
Public
40Cover pool data Swedbank is a labeled issuer of
the ECBC Covered Bond Label
Foundation
(www.coveredbondlabel.com )
Type of loans Geographical distribution, Sw eden, per cent 31 Dec
(based on loan volum e) (based on loan volum e) 2017
Residentials 91.9% North 6.5
of w hich Single-family housing 56.9% Norrbotten county (BD) 1.4
of w hich Tenant ow ner rights 20.7% Västerbotten county (AC) 2.4
of w hich Tenant ow ner association 9.6% Västernorrland county (Y) 1.5
of w hich Multi-family housing 4.7% Jämtland county (Z) 1.2
Public 0.7% Middle (including Stockholm ) 43.9
Commercial 0.8% Dalarna county (W) 2.0
Forest & Agricultural 6.6% Gävleborg county (X) 2.1
100.0% Värmland county (S) 2.0
Örebro county (T) 2.5
Västmanland county (U) 2.4
Population, Sep 2017 Uppsala county ( C) 4.1
(thousands) Södermanland county (D) 2.1
Sw eden 10 094 Stockholm county (including Stockholm) (AB) 26.7
Stockholm, county 2 299 South (including Göteborg and Malm ö) 49.6
Västra Götaland, county (incl. Gothenburg) 1 686 Västra götaland county (Including Göteborg) (O) 17.9
Skåne, county (incl. Malmoe) 1 340 Östergötland county (E) 4.2
Jönköping county (F) 3.5
Halland county (N) 4.1
Kronoberg county (G) 2.1
Kalmar county (H) 2.9
Skåne county (including Malmö) (M) 12.9
Blekinge county (K) 1.4
Gotland county (I) 0.6
100.0
© Swedbank Information class Dec 2017
Public
41Cover pool loan-to-value distribution Swedbank is a labeled issuer of
the ECBC Covered Bond Label
• Weighted average LTV on property level 49% Foundation
(www.coveredbondlabel.com )
LTV distribution per property1 LTV distribution by volume1, 2
30% 30%
25% 25%
20% 20%
15% 15%
10% 10%
5% 5%
0% 0%
00-10 10-20 20-30 30-40 40-50 50-60 60-70 70-75 00-10 10-20 20-30 30-40 40-50 50-60 60-70 70-75
1Public loans of 0.7% of the cover pool are excluded as they are either guaranteed by a Swedish municipality or the government and have therefore no
LTV assigned to them. 2 LTV distribution as defined by the Association of Swedish Covered Bond Issuers (www.ascb.se)
© Swedbank Information class Sep 2017
Public
42Cover pool loan type and loan-to-value Swedbank is a labeled issuer of
distribution the ECBC Covered Bond Label
Foundation
(www.coveredbondlabel.com )
WA LTV per property type1
Percentage of the pool Average LTV per loan type
120% 120%
100% 100%
80% 80%
60% 60%
40% 40%
20% 20%
0% 0%
Single-family Tenant owner Tenant owner Multi-family Commercial Forestry & Total all
1
homes rights associations housing Agricultural types
(apartments)
1excluding public sector loans of 0.7%
© Swedbank Information class Dec 2017
Public
43Strong resilience to house price changes Swedbank is a labeled issuer of
the ECBC Covered Bond Label
Foundation
(www.coveredbondlabel.com )
House price sensitivity of the cover pool • Current OC-level of 85.5%
90%
OC, Q417
• 2% legal minimum requirement
80% Min req. 2%
• Can withstand a severe house price drop
70%
and still be able to issue AAA-rated
60% covered bonds
Over-collateralisation
50%
40%
30%
20%
10%
0%
0% -5% -10% -15% -20% -25% -30% -35% -40% -45% -50%
House price drop
© Swedbank Information class Dec 2017
Public
44Overview of the Swedish covered bond legislation
The Covered Bond Act entered into force on July 1, 2004 and is over-sighted by the Swedish FSA. Its main
characteristics are:
Dual recourse to the issuer and cover pool
The Covered Bond Act Dynamic, regulated pool of assets, frequently monitored by the Swedish FSA via appointment of an
independent inspector
Regulated valuation of cover pool assets which remain on the balance sheet
The cover pool may consist of certain mortgage credits, public credits and supplemental assets. There is no
requirement to segregate mortgage and public credits.
Maximum LTVs: Residential 75%, Agricultural 70%, Commercial 60%
Loan-to-value ratios and Maximum 10% commercial loans and 20% supplemental assets in cover pool
other limitations Regular monitoring of the property values, revaluation of property prices in case of significant drop (generally
interpreted as 15% drop)
The S.O. Act amended, effective as of 21 June 2016, requires that the nominal value of the cover pool shall, at all
times, be at least two per cent. higher than the aggregate nominal value of the liabilities relating to the covered
bonds..
Regional constraint on collateral assets (Mortgage - EEA, Public - OECD)
Matching requirements The cover pool value shall always exceed the aggregate value of claims (including derivatives)
A sound balance in terms of FX, interest rates and maturities must be achieved. It is deemed to exist when the
present value of the cover pool at all times exceed the present value of liabilities (including derivatives), even on a
stressed basis. Present value cover must hold even after 1% upward and downward shift in the yield curve and a
10% change in the currency
Non-performing assets in the cover pool which are more than 60 days overdue must be disregarded for the
purposes of the matching tests
Benefit of a priority right
over the cover pool Holders of covered bonds and relevant derivative counterparties benefit from a priority claim over the cover pool
should the institution be declared bankrupt and rank pari passu ahead of unsecured creditors and all other creditors
of the institution in respect of assets in the cover pool
The registered assets in the cover pool, the covered bonds and any relevant derivative contracts are required to be
Administration in event of maintained as a unit and kept segregated from other assets and liabilities of the bankruptcy estate of the institution.
bankruptcy The administrators-in-bankruptcy are then required to procure the continued timely service of payments due under
the covered bonds and any relevant derivative contracts
© Swedbank Information class Source: www.ascb.se
Public
45Swedish
and Baltic
macro
6. Swedish and Baltic
economies
© Swedbank Information class
PublicSweden - Strong growth gradually slowing Swedish
and Baltic
macro
Key economic indicators1, 2016-2019
Real GDP (calendar adjusted)
Most recent
2.9 (Q3)
2016
3.0
2017E
2.6
2018F
2.7
2019F
2.1
• Kingdom of Sweden rated
CPI growth, average 1.7 (Dec) 1.0 1.8 2.1 2.8 Aaa/AAA/AAA
CPIF growth, average 1.9 (Dec) 1.4 2.0 1.9 1.9
Unemployment rate (15-74), % of labor force 6.5 (Dec)2 6.9 6.7 6.4 6.3
Savings ratio (households),% of disp. income … 16.5 16.1 16.9 16.5
Real disposable income (households) … 3.3 2.1 3.3 1.5
Sources: Statistics Sweden & Swedbank Research
1 Annual percentage growth in percent unless indicated otherwise.
2 Seasonally adjusted and smoothed
Domestic demand drives growth Sentiments remain elevated
© Swedbank Information class Feb 2018
Public
47The Swedish economy Swedish
and Baltic
Households remain cautious Housing investments to be replaced by other investments macro
Percentage points
of GDP
Exports picking up
Overall investments are trending higher
© Swedbank Information class Feb 2018
Public
48The Swedish economy, con’t Swedish
and Baltic
Strong employment; wages and unemployment lag Solid public finances macro
4.0 % of GDP 49
3.0 47
45
2.0
43
1.0
41
0.0
39
-1.0 37
-2.0 35
Budget balance forecast Public debt (Maastrict), rhs forecast
Sources: Swedbank Research & Macrobond.
Gradually increasing inflation Stable krona
© Swedbank Information class Feb 2018
Public
49The Swedish credit market Swedish
and Baltic
Lending to households dampens Interest rates remain low; while margins are stable macro
A gradual tightening of monetary policy Quantitative easing formally ended in 2017
© Swedbank Information class Feb 2018
Public
50Baltics – continued growth albeit at slower rates Swedish
and Baltic
macro
Key economic indicators1, 2015-2019
Most recent 2016 2017E 2018F 2019F
Real GDP Estonia 4.2 (Q3) 2.1 4.4 3.9 3,0 Ratings
Latvia 4.2 (Q4) 2.1 4.7 4.2 3.2 • Republic of Estonia: A1/AA-/A+
CPI growth, average
Lithuania
Estonia
3.6 (Q4)
3.4 (Dec)
2.3
0.1
3.8
3.4
3.2
3,0
2.5
2.5
• Republic of Latvia: A3/ A-/A-
Latvia 2.2 (Dec) 0.1 2.9 3.7 2.5 • Republic of Lithuania: A3/ A-/A-
Lithuania 3.9 (Dec) 0.9 3.7 3.3 2.5
Unemployment rate (15-74), % of labor force Estonia 5.2 (Q3) 6.8 6,0 7,0 7.2
Latvia 8.5 (Q3) 9.6 8.8 8.1 7.5
Lithuania 6.6 (Q3) 7.9 7.2 6.9 6.9
1 % growth rate unless indicated otherwise, Y/Y growth for the most recent data
Real economic growth peaked in 2017 Unemployment is declining
© Swedbank Information class
Public
51Estonia: Growth to slow after peak Swedish
and Baltic
Economic growth expanded in the fastest pace in five years in 2017 macro
Domestic demand and export the main drivers Export and manufacturing output accelerate
© Swedbank Information class
Public
52Latvia: Solid growth to continue Swedish
and Baltic
Supported by strong confidence, pro-cyclical fiscal policy, rapid wage growth, global tailwinds macro
Sharp cyclical pick up in growth to moderate in 2019 Sentiments are strengthening
© Swedbank Information class
Public
53Lithuania: GDP growth will revert to potential Swedish
and Baltic
Weaker household consumption and export growth, but investments to pick up macro
Growth has peaked and start to ease Capacity constrains will limit export growth
© Swedbank Information class
Public
54Swedish
housing
and
mortgage
market
7. Swedish housing and
mortgage market
© Swedbank Information class
PublicSwedish
The decline in prices is not unexpected housing
and
mortgage
• Strong price increases in recent years due to high demand and limited supply market
• Supply has increased on the back of a surge in housing investments
• Stricter borrowing criteria both by lenders and authorities
Home prices and macroprudential measures
2010 2011 2012 2013 2014 2015 2016 2017 2018
20%
Valueguard HOX Sweden house price index y/y
15%
10%
5%
0%
-5%
1 2 3 4 7 8 9 10 11 12
-10% 5 6
© Swedbank Information class
Public
56Swedish
Price developments have varied across the housing
and
mortgage
country and type of housing market
• Price increases, and recent falls, have been most pronounced in the Stockholm area
• Prices of apartments most volatile, again in the Stockholm area
• Single-family houses are holding up better
Flats +177%, houses +104% since 2005 1) Trends and average house prices, December 20172)
Tenant owner rights
1 month 3 months 12 months SEK/sqm
Sweden total -3% -7% -2% 34 944
Stockholm greater area -3% -7% -6% 53 998
Gothenburg greater area -2% -6% +4% 42 650
Malmoe greater area -2% -8% +8% 26 399
Single-family homes
1 month 3 months 12 months SEK
Sweden total -2% -3% +5% 2 814 000
Stockholm greater area -3% -6% -1% 5 271 000
Gothenburg greater area -1% -3% +4% 4 335 000
Malmoe greater area -1% -3% +7% 3 573 000
1) Source: Valueguard (HOX index)
2) Source: Mäklarstatistik
© Swedbank Information class
Public
57Swedish
Supply increase puts pressure on prices, but housing
and
mortgage
supports transaction volumes market
• Following recent years’ investment increase, supply will continue to grow
• Demand and number of transactions is still high, especially in large city areas
• Housing shortages still persist, in particular in the larger cities
Housing investments support continued supply Transactions increase, as well as supply
80 000
19 000
70 000
17 000
60 000
15 000
50 000
13 000
40 000
30 000 11 000
20 000 9 000
10 000 7 000
0 5 000
Jan-10 Jan-11 Jan-12 Jan-13 Jan-14 Jan-15 Jan-16 Jan-17 Jan-18
Number of transactions
Newly added for sale on Hemnet
Housing starts (lagged 2 yr) Finished housing
Newly added for sale incl new production
Source: Statistics Sweden Source: Mäklarstatistik and Hemnet
© Swedbank Information class
PublicSwedish
Household borrowing dampens while financing housing
and
mortgage
costs remain low market
• Mortgage volume growth benefitting from new housing supply, housing turnover and higher
mortgage amounts by existing borrowers
• Housing financing costs at historically low level
• Reasonable to expect some slowdown from last year’s 7.4% market growth
Mortgage growth and housing prices Low mortgage costs
© Swedbank Information class
Public
59Swedish
Structural foundation for the housing and housing
and
mortgage
mortgage market market
• Full recourse (very limited debt forgiveness possibilities)
• No securitisation (on balance sheet), no sub-prime market, no 3rd party origination
• Restricted buy-to-let market – limited speculation
• 64% home ownership
• Rental market is regulated
• Transparent credit information (credit information agency, www.uc.se)
– Publicly available information regarding income, debt, payment track record etc.
• Consumer credit legislation requires affordability calculations including stress test of higher interest rate and
conservative cost of living
• Strong social security and generous unemployment benefit system
© Swedbank Information class
Public
60Swedish
Household fundamentals support the housing housing
and
mortgage
market market
• Population growth and urbanisation trends continue
• Solid labour market developments
• Solid balance sheets among households
High population growth and urbanisation Solid labour market Strong household balance sheets
The overcrowding rate is defined as the
percentage of the population living in an
overcrowded household.
© Swedbank Information class
Public
61Swedish
Overall indebtedness among Swedish housing
and
mortgage
households remains low market
• Of appr. 4 million households less than 50% carry a mortgage
• Median debt-to-income ratio of mortgage holders less than 300%
• Less than 15% of mortgage holders have a debt to income ratio of more than
600%
Debt ratios of Swedish households Distribution of debt ratios in 2016
Total debt as % of gross income No. of households w/ mortgages
450000
100%
>600 400000
350000
80%
400-600 300000
60% 250000
200-400 200000
40% 150000
0-200
100000
20% No 50000
mortgages 0
0% 0-100 100-200 200-300 300-400 400-500 500-600 600-700 >700
2011 2012 2013 2014 2015 2016 Source: Riksbank Total debt as % of post tax income
Source: Riksbank
© Swedbank Information class
Public
62Swedish
The Swedish economy underpins the housing
and
mortgage
housing market market
• Fiscal policy will be supportive and public debt is at a historic low level
• Monetary policy to remain expansionary
• Economic growth expected to continue at solid rates despite weakening housing
investments
Expansionary fiscal policy Gradually tightened monetary policy Slowdown in growth from high rates
4.0 % of GDP 49
0.25 %points
3.0 47
45
2.0 0.05
43
1.0
41
0.0 -0.15
39
-1.0 37
-0.35
-2.0 35
-0.55
2015 2016 2017 2018 2019
Budget balance forecast
Public debt (Maastrict), rhs forecast Market pricing Swedbank forecast
Outcome Riksbank forecast December 2017
Sources: Swedbank Research & Macrobond. Sources: Swedbank Research & Macrobond
© Swedbank Information class
Public
63Swedish
Swedbank and the real estate market housing
and
mortgage
market
• Swedbank has a low risk residential property portfolio
• Origination discipline and profitability have been
prioritised over volume
• Engagement in low risk projects with well-known
residential property developers will continue
© Swedbank Information class
Public
64Swedish
Swedbank has a low risk residential property housing
and
mortgage
portfolio market
Real estate lending, net loans in Sweden, SEKbn
1 200
• Swedbank has pursued a low risk
• Private mortgages: SEK 759bn, average
strategy by tightening origination
1 000 LTV 54% standards, and prioritised price and
• Tenant Owner Associations (“TOA”): SEK risk over volume growth
109bn
800
759
SEK 95bn existing TOA, average LTV 40% • Bulk of assets in low risk segments
SEK 14 bn TOA under construction
600
• Property Management: SEK 187bn, average • Average LTVs in lower ranges
LTV 58%
400 SEK 64bn in residential property management • Exposures towards residential
(rental apartment properties)
109 SEK 123bn in other property management
property developers of SEK 21bn
200
64 • Construction SEK 16bn
123 21 SEK 7bn residential property development
0 16
SEK 9bn infrastructure, groundwork, craftsmen
Total real estate Of which:
portfolio Residential
property
development
© Swedbank Information class
Public
65Swedish
Private mortgages – a low risk portfolio housing
and
mortgage
market
• Low average LTVs (54%)
• Low historic losses (0.04% on average during the last 25 years)
• About 73% of total loans to single family homes
• Swedbank has grown, but at a slower rate than the market
Growth but lower than the market High diversification Only 1% above 75% LTV
9 Loan growth in % Loans net1) by geography Loans1) to Private Mortgage by LTV-bucket
8 20
18 SEKbn 87% with 99% with
7 LTVSwedish
Tenant Owner Associations – low leverage housing
and
mortgage
market
• Total loan portfolio SEK 109bn, of which SEK 14bn is construction loan for new
development:
– 50-80% needs to be pre-sold and before final financing 100% needs to be sold
– When the construction is finalised about 60% of construction loans will be repaid through equity from the TOA
members
• Low historic losses (average 0.17% over the last 25 years)
Growth but lower than the market Portfolio reflects market Average LTV of only 40%
12 Loan growth in % Loans net1) by geography Loans1) to Tenant Owner Associations by LTV-bucket
4
10
SEKbn 95% with 100% with
8 12% LTV 50 000 inhabitantsSwedish
Residential property developers - low exposure housing
and
mortgage
market
• Total exposures of SEK 21bn, more than half of it to the larger listed construction firms, with
which Swedbank has long-term relations
– SEK 14bn of the exposures are related to tenant-owner rights projects through loans to Tenant Owner
Associations backed by residential property developers
• 99% of these projects will be finalised in 2018 and 2019
– SEK 7bn of the exposures are related to residential rental housing and other non-residential projects
• Pre-sale level of tenant owner rights close to 90%
Mainly exposures to the larger construction firms Tenant owner rights related construction loans1) – the risk is highly mitigated
Loans1), SEKbn By geography Finalisation year Average % pre-sold by
finalisation year2)
100
Large building firms 7% 1% 90
10
29% 80
25% 70
New developers 4 SEK 60
14bn 55% 50
4% 70% 40
Smaller building firms 7 9% 30
20
10
0 10 Stockholm region 2018 2019 0
Gothenburg region 2020- 2018 2019 2020-
Malmö region
© Swedbank Information class 1) As of 31 December 2017
Public
68Swedish
Residential property management – stable housing
and
mortgage
cash-flow generation market
• Total exposures of SEK 64bn towards residential property management companies
– Financing of rental apartment properties
• Well-known companies with solid finances and high collateralization
• Strong and stable cash-flow generation, no speculation and low vintage risk
Slower growth in 2017 Regional cities dominate Average LTV of 58%
8 Loans net1) by geography Loans1) to Residential Prop Mgmt by LTV-bucket
Loan growth, %
1.4
SEKbn 86% with 99.7% with
6 1.2 LTVAppendix
© Swedbank Information class
PublicSwedbank – largest retail bank in our four This is
Swedbank
home markets
Sweden
Latvia
Population 10.0m
Population 2.0m
Private customers 4.1m
Private customers 0.9m
Corporate customers 270 000
Corporate customers 83 000
Organisations 68 000
Branches 36
Branches 218
Cards 1.0m
Cards 4.2m
Number of card purchases 38.5m
Number of card purchases 323m
Digitally active customers* 0.7m
Digitally active customers* 3.1m
Estonia Lithuania
Population 1.3m Population 2.9m
~86%*
Private customers 0.9m Private customers 1.5m
Corporate customers 135 000 Corporate customers 69 000
Branches 34 Branches 63
Cards 1.1m Cards 1.7m
Number of card purchases 50.9m ~10%* Number of card purchases 36.3m
Digitally active customers* 0.6m Digitally active customers* 0.7m
* Share of loan book
© Swedbank Information class Source: Swedbank Factbook 4Q 2017
Public * Number of customers that have made a payment, transfer, application, investments or lending activity in the last month
71Swedbank – low-risk bank with strong capital This is
Swedbank
base
• Low risk – a Board of Directors’ strategic priority – ensures access to funding
markets and low funding cost
• Retail profile and four home markets a key feature Liquidity & capital, %
NSFR LCR CET1 ratio, CRDIV (RHS)
– 86% of total loans originated in Sweden - Swedish mortgages account for 50% of 200 30
total loans
150
– 91% of total loans are collateralised (78.5% real estate and 12.5% other collateral) 20
100
• Strong capital position – Board of Directors’ decision to maintain a buffer above 10
50
prevailing SFSA capital requirements to have operational flexibility – current buffer
around 270bp 0 0
2012 2013 2014 2015 2016 2017
• Conservative funding and liquidity position – survival horizon longer than 12 months Credit impairment ratio, bps
40
assuming closed funding markets, NSFR 110% and LCR 173%
30
• Baltic operations self-funded – loan-to-deposit ratio < 100%
20
10
0
-10
Q4 12 Q4 13 Q4 14 Q4 15 Q4 16 Q4 17
© Swedbank Information class Dec 2017
Public
72Swedbank – strong and stable earnings This is
Swedbank
capacity
• Four home markets – Sweden, Estonia, Latvia and Lithuania
– Strong and stable economies
– Market-leading position in all home markets
– Largest customer base in all home markets
• Retail profile ensures stable earnings with low volatility
• High cost efficiency – a strategic priority – ensures good profitability
• Stable earnings support a low risk profile and a strong capital position Profit before impairments, SEKbn
10
One-offs from disposals
8
6
4
2
0
Q4 12 Q4 13 Q4 14 Q4 15 Q4 16 Q4 17
© Swedbank Information class Dec 2017
Public
73Swedbank – market leader in cost efficiency This is
Swedbank
• Best-in-class cost efficiency – an executive management strategic priority
• Executive management strongly focused on cost and change management
Total expenses, SEKm
− Integrated in corporate culture 20
Acquisition of Sparbanken…
− Focus on straight-through-processing 18
− Evolving household banking model – digitisation trend 16
• Retail profile a key feature 14
− Four home markets – Sweden, Estonia, Latvia and Lithuania – reduce 12
complexity 2012 2013 2014 2015 2016 2017 Target
− Largest private and SME customer base 60
18
C/I ratio, %
− High degree of digitisation in home markets 55
50
45
40
35
30
2012 2013 2014 2015 2016 2017
© Swedbank Information class Dec 2017
Public
74Focus on sustainable business
Improved sustainability scores First green bond issued in October (5yr EUR 500m)
Swedbank issued its first Green Bond Approximately 72% of the amount was
Dow Jones Proceeds will allocated to investors with dedicated green
• Finance sustainable real-estate funds.
Sustainability • Renewable energy
Index • Reduction of carbon emissions With our established Green Bond
• Contribute to several of the UN framework Swedbank intends to be a
2011 2012 2013 2014 2015 2016 2017
Sustainable Development Goals. regular issuer in the green bond market.
Swedbank Robur’s sustainability funds Eligible green assets Sustainable Development Goal
Nordic Swan Since October 2017, five of Swedbank Robur's active Renewable energy SDG7 and SDG13
managed sustainability funds have the Nordic Swan Ecolabel.
Ecolabel Sustainability work is also further progressing in the
Energy efficiency SDG7, SDG11 and SDG13
management of the Access Index-based funds. Sustainable management of living natural resources SDG15
Pollution prevention and control SDG6 and SDG11
Stronger Environmental Management System (EMS) Clean transportation SDG9 and SDG11, SDG13
Swedbank’s upgraded Environmental Management System
ISO was certified with the new and more rigorous standard Sustainability Indicators: towards the 2030 Agenda
ISO14001:2015.
Swedbank has developed a new methodology, Sustainability Indicators, to review the
progress towards the UN 2030 Agenda for Sustainable Development. The aim is to support
Swedbank is included in The Sustainability Yearbook 2018 the business looking at ESG (environmental, social, governance) criteria and help to
identify weaknesses and strengths in Sweden and the Baltic countries operations.
The The Sustainability Yearbook lists the world’s most sustainable Progress towards UN SDGs, % of benchmark*
companies in each industry as determined by their score in Estonia Latvia Lithuania Sw eden
Sustainability RobecoSAM’s annual Corporate Sustainability Assessment. Sustainable medium-term grow th (SDGs #4, 8, 9) 71 61 64 90
Social inclusion (SDGs # 1, 3, 5, 10) 56 55 55 89
Yearbook Environmental protection (SDGs # 6, 7, 11, 12, 13) 58 72 70 82
Governance and institutions (SDGs # 16, 17) 70 51 62 97
Dow nw ard/stable trend during last 5 years (4 years for governance) – ↓
* Benchmark is 90 or 10th percentile of the EU 28 in 2015. In total 40 indicators covering 14 from 17 SDGs, aggregated to four pillars.
Traffic lights - Sw eden: >90% for green, 70-90% for yellow 0-70% for red; Baltics: >80% for green, 60-80% for yellow , 0-60% for red.
© Swedbank Information class
Public
75Our objective Strategy
• Daily banking is fully digital – 100% self service
• Meet our customers with relevant offerings, in our own or external channels
• Data and knowledge automation – to foresee needs, provide proactive offering and advice.
This will generate loyalty as well as increased sales
• Have an attractive financial platform for customers and 3rd party suppliers, providing value-
added and competitive edge
• Branches attract new customers - build the brand and increasingly focus on corporate
customers
© Swedbank Information class
Public
76Sweden – the dominating home market This is
Swedbank
• Total lending to the public amounts to SEK 1 502bn (as per Q4 2017), out of
which around 86% is originated in Sweden
• Estonia makes up 48% of total lending in the Baltics
Lending distributed by countries
Sweden 85.8% SEK 1 288bn
Estonia 4.7%
Swedish Mortgage loans (private+corp)
Latvia 2.1% Other corporate (incl. LC&I, Sweden)
Lithuania 3.1%
Other* 4.3%
0 200 400 600 800 1000 1200 1400 * Mostly Norway and Finland
© Swedbank Information class Dec 2017
Public
77Oil sector still under pressure Asset
quality
• Loan portfolio negatively impacted by lower oil price, SEK 13.4bn
– Less than 1% of total loans gross
– Derivatives exposures of SEK 1.0bn (incl. collateral)
• Net, unchanged provisions* in Q4
10 LC&I Shipping & Offshore, loans gross, SEK 24bn 14 Oil-related, exposure by risk grade, SEKbn
2016-12-312 2017-12-31 12
8 56% of the portfolio is
negatively impacted by 10
lower oil price
6
8
4 6
4
2
2
0 0
Def 0 1 2 3 4 5 6 7 8 9 10 11 12 13 14 15 16 17 18 19 20 21
2014-12-31 2015-12-31 2016-12-31 2017-12-31
© Swedbank Information class * Total provisions of SEK 1 358m for the whole Shipping and Offshore sector with a provision ratio (for impaired
Public loans) of 30%.
78Capital
No automatic sanctions for breaching the – fully
loaded
Pillar 2 capital requirements CRD IV
21.9%
● “It is particularly important that FI has the possibility of giving due
consideration to the specific situation…in which a firm in financial stress
finds itself… For example, certain risks included in the assessment
of the Pillar 2 basic requirement might have materialized, which 10.6%
might mean there are no longer grounds for requiring the firm to
hold capital for them”.
● “It ought to be positive for financial stability that a firm has the Pillar 2 CET1
possibility… to restore its capital without the firm necessarily becoming requirements
subject to priory specified and automatic legal restrictions. In other Automatic MDA
words, firms are hence given the possibility of re-establishing their Restrictions
capital in a strained situation without automatic restrictions on Pillar 1 CET1
requirements
distributions or, depending on the size of the capital shortage, a
formal resolution phase being activated." 11.3%
● “Hence…a firm may freely choose…the most suitable way of restoring
the capital in that specific situation. For example, the firm is not
obliged to halt or limit dividends or interest payments on Tier 1
capital contributions, if the firm can identify other and more
appropriate ways of restoring the capital sufficiently quickly.”
Swedbank CET1 requirements
© Swedbank Information class Dec 2017
Public
79You can also read