Digital Oldham Business Intelligence Service January 2019 - Dan Hodgson, Laurence Rafferty, Martin Burroughs - Oldham Council
←
→
Page content transcription
If your browser does not render page correctly, please read the page content below
Digital Oldham
             Business Intelligence Service
                    January 2019

Dan Hodgson, Laurence Rafferty, Martin Burroughs

Final V1.0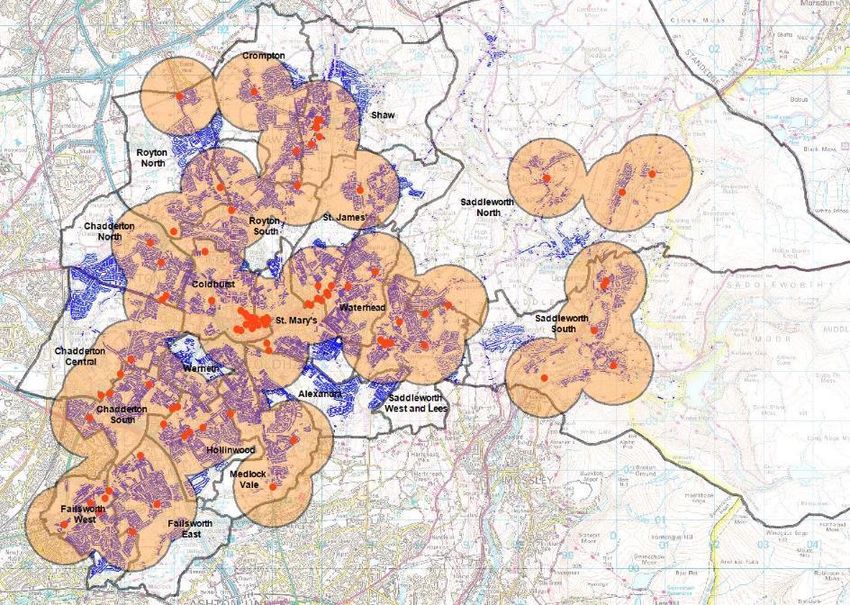
Contents
Contents

 Introduction                                                 3

 Infrastructure & Availability                                4
   Current Broadband Speeds & Access                          5

   Broadband Speeds & Products                                6

   3G & 4G Coverage                                           12

   5G & “Full Fibre” Broadband Rollout                        13

 Digital Engagement                                           14
   Customer Insight: Technology & Internet Usage Profiles     15

   Historical Analysis                                        18

   Communication Preferences                                  19

   Social Media                                               21

   Customer Insight: Online Account Management                26

   MyAccount Engagement                                       28

   Council Social Media                                       30

 Technology & Industry                                        31
   Customer Insight: Access to Technology & Online Services   32

   Wi-Fi Hotspots & Libraries in Oldham                       37

   Digital Industry Within and Around the Borough             39

 Digital Literacy & Skills                                    42

 Appendices
   A: National & Local Targets & Measures                     45

                                            2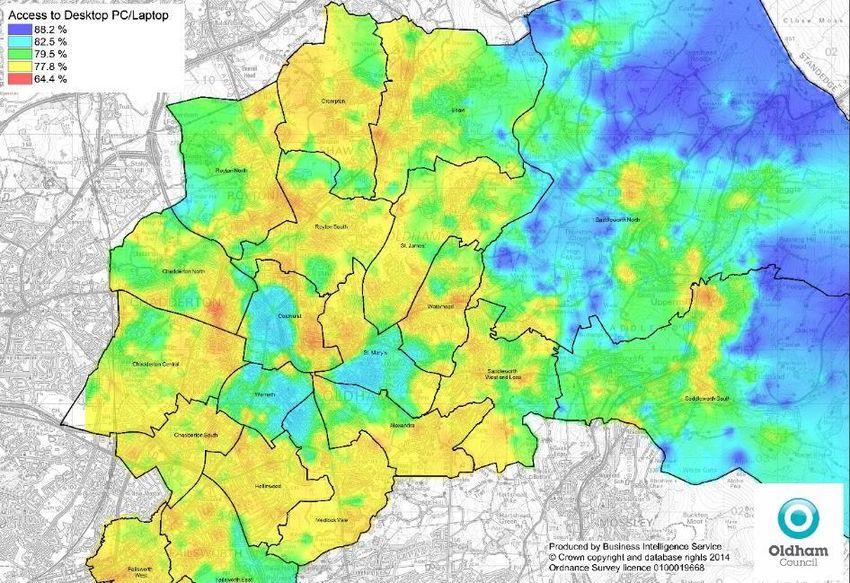
Introduction
This report seeks to bring together an array of intelligence on digital communications in
Oldham.
What This Report Will Inform
There is a continual demand for intelligence of this sort, for a variety of business purposes,
which is often hard to satisfy as effectively as should be the case.
This report should thus inform and enhance:
The evidence base for marketing campaigns,
The prioritisation and shaping of work streams within the Resident First programme
or SDA programmes,
The writing of the Economic Strategy and any future local Digital Strategy,
Individual service or elected member enquiries,
The evidence base for response to regional proposals and emerging funding bids.
Key Findings
Infrastructure - Oldham’s overall digital infrastructure is good. However, there are
pockets of poorer coverage, particularly broadband in Failsworth and parts of
Saddleworth, and 2G/3G around some deprived communities and rural fringes.
Digital Access - Different communities within Oldham have access to, and use, the
digital world in very different ways. In broad terms, prosperous, older peripheries tend
to use the internet for transactions, but not for social interaction, whilst many poorer
communities are the opposite. This can create a “poverty premium”, and creates
inclusivity challenges when moving our services to electronic delivery.
“Free” Internet - This is widely available through the borough, via libraries or wifi
hotspots. However, there are areas with no provision at all within walking distance,
notably Holts and Alt.
Future Developments
This is intended to be a rolling document, and relevant data and research will be added
periodically, as it becomes available.
In particular, we will seek to reflect the following
Mosaic (Experian) data - Many of the detailed maps and statistics shown are based
on modelled Mosaic data. Whilst this does allow for a detailed picture, the underlying
surveys were last updated in 2013, and there is thus a lag. A major update is
expected in 2019, with annual updates to follow.
Digital Literacy - At present, little information is available at a local level. However,
work by Lloyds Bank is intended to lead to local figures being produced, so we will
monitor this, and include them when they become available.
3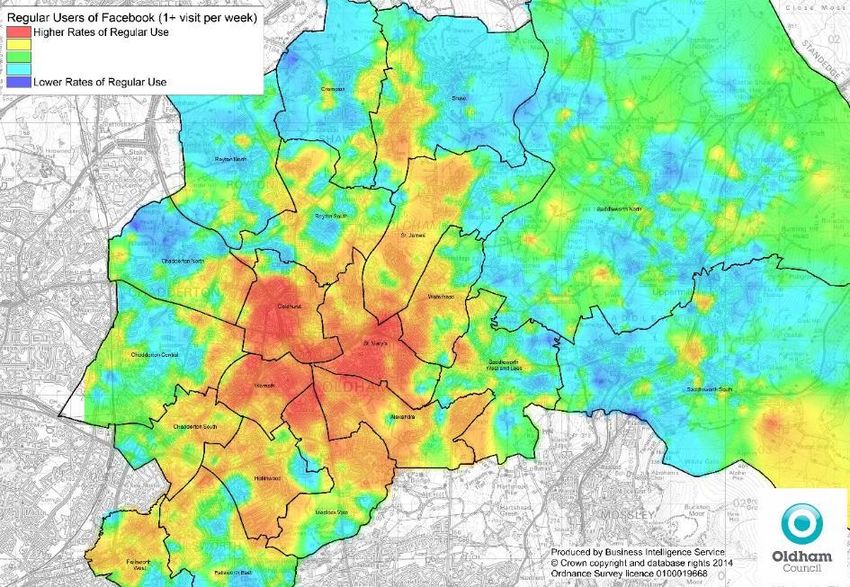
Infrastructure & Availability
Key Points
Broadband Availability - 99.1% of Oldham’s Residents and Businesses have
the potential to access Fibre Internet (speeds of over 24 Mbps).
Broadband Uptake - 81.1% of Oldham’s Residents and Businesses actually
use Fibre Internet in their premises.
Ultrafast Availability - 66.4% of Oldham’s Residents and Businesses have the
potential to access Ultrafast Internet (speeds of over 100 Mbps).
Ultrafast Uptake - 34% of Oldham’s Residents and Businesses actually use
Ultrafast Internet in their premises.
Slow Connections - Patches where connection speeds are under 20 Mbps can
be found in Lees, Grasscroft, Diggle, and Failsworth.
Mobile Internet - There is excellent 4G coverage throughout the borough,
although there are pockets (eg Fitton Hill, Grotton) where there is a relatively
weak signal for 2G/3G coverage.
5G Mobile Internet - There are plans to launch access to 5G in Greater
Manchester over the next few years. These will likely be centred around the city
centre area.
4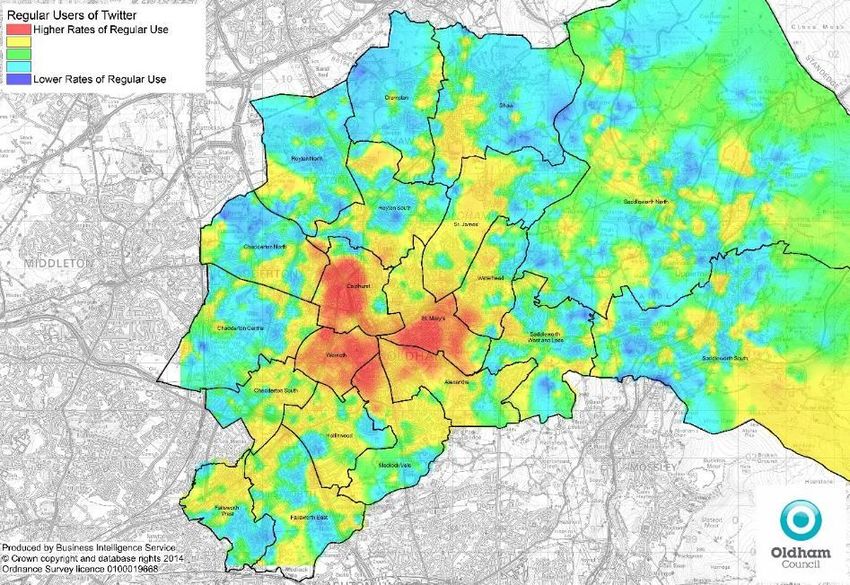
Current Broadband Speeds & Access
Broadband Availability
Oldham has well developed internet infrastructure, with practically all of the borough’s
population able to access fibre optic broadband in their homes. As Fig 1 demonstrates, there
is close to 100% coverage within the central Oldham area. However, the lower end of
Saddleworth appears to have less access, and whilst lower levels may also be noted on the
border of Moston and Failsworth, this falls primarily within the borough of Manchester.

    Fig 1 & 1A: Broadband Availability in Oldham and Saddleworth (2018) mapped by Output Area1
Lower access levels are found at the south end of Grasscroft, to the east of Greenfield near
Dove Stone Reservoir, and towards the north of Diggle.

1Mapping produced using Consumer Data Research Centre tools & research
https://maps.cdrc.ac.uk/#/geodemographics/vulnerability/default/BTTTFFT/10/-0.1500/51.5200/

                                                     5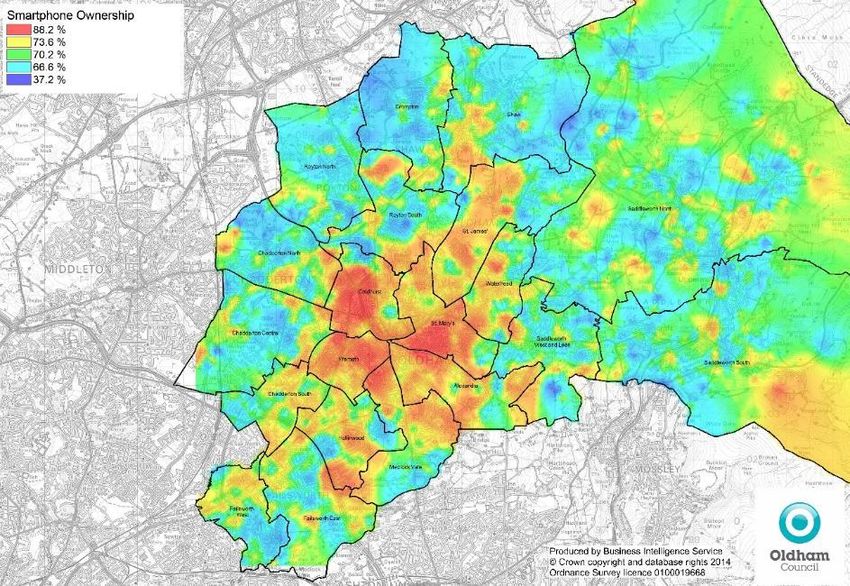
Broadband Speeds & Products
Broadband availability, however, is only part of the equation, as there are many different
speeds and suppliers available, with marketing jargon making it difficult to compare
products. The table below (Fig 2) outlines the currently accepted definitions in the UK.
Please note that they vary by country, and have evolved over time, but that any mention
within this document will refer to these classifications.

 Connection          Download           Notes
 Type                Speed
 Standard            0.5 – 8 Mbps       Also known as “Dial Up” or ADSL. Relies on copper
 (not broadband)                        telephone cable – now largely redundant in the UK.
 High Speed          16 – 24 Mbps       Employs upgraded (ADSL2+) copper telephone
                                        lines. Areas where fibre optic cabling hasn’t been
                                        installed rely on this, or else it is employed as a
                                        budget option for those with basic needs.
 Superfast           25 – 80 Mbps       Requires “Fibre to the Cabinet” (FTTC), with copper
                                        wiring linking the ‘cabinet’ to individual households –
                                        this means the greater the distance from the
                                        ‘cabinet’ a property is, the slower the available
                                        speed. This is the most common connection type
                                        available in the UK, with BT generally being the
                                        owner and maintainer of the infrastructure. BT, Sky,
                                        PlusNet, and TalkTalk are key suppliers, but there
                                        are many other smaller companies offering
                                        Superfast products.
 Ultrafast           80 – 160 Mbps      The main supplier of Ultrafast Broadband in the UK
                                        is Virgin Media, who use their own national fibre
                                        network, which was laid in the late 1990s. They are
                                        the only significant supplier using “Fibre to the
                                        Home” (FTTH) connections and hence any ‘Ultrafast’
                                        availability is likely through them. Other ‘Ultrafast’
                                        products (such as BT Infinity 3 & 4) require
                                        installation of additional equipment and can be
                                        expensive. These products approach ‘Hyperfast’
                                        speeds (up to 300 Mbps) and are more often used
                                        by SMEs, than residences.
 Hyperfast/Gigabit   500+ Mbps          Hyperfast and Gigabit broadband is currently only
                                        available in areas of central London and a few other
                                        large cities (including Greater Manchester, though
                                        not within Oldham Borough). There are also pockets
                                        of remote rural communities where no fibre was
                                        previously installed, which have had Hyperfast
                                        internet fitted instead – though these are few and far
                                        between.
        Table 1: Broadband in the UK definitions, upload speeds and additional information

                                                6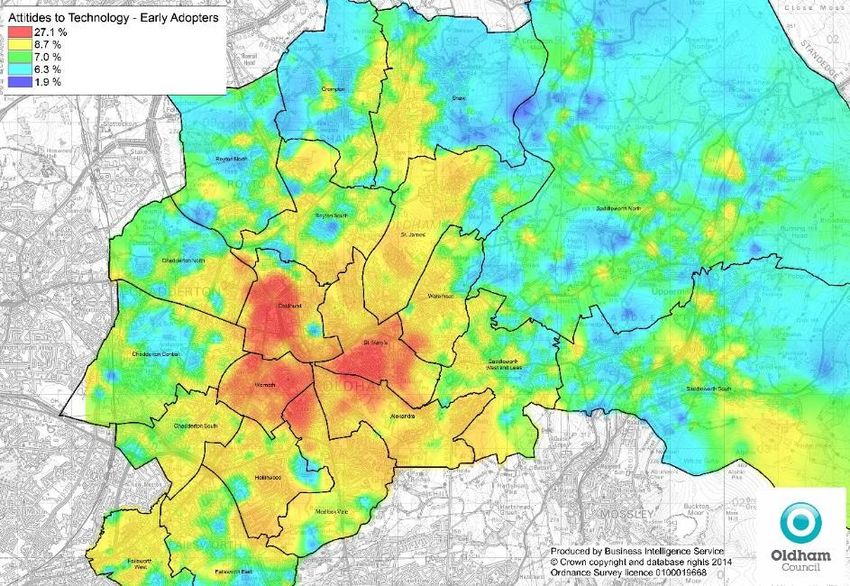
Broadband Availability in Oldham

The breakdown of the type of the level of broadband coverage in the borough can be seen in
Fig 3 – clearly Superfast connections are all but ubiquitous throughout Oldham (99.1%) with
a very high level of coverage present as far back as 2015. The level of Ultrafast connections
however currently covers close to two thirds (66.43%) of the borough – this will mostly
consist of Virgin Media’s network (BT Openreach is likely to become a bigger player in years
to come).

                               Fig 2: Broadband availability in Oldham2

Currently, less than 1 in 200 (0.49%) of the borough’s premises (both residential and
business) are unable to access at least “High Speed” broadband (16+ mbps) connections.
This means Oldham has the joint 5th best rate in Greater Manchester, with Tameside
(0.15%), Bury (0.30%), Bolton (0.34%) and Trafford (0.40%) having a better rate, whilst
Wigan has the same. Stockport (0.52%) and Rochdale (0.59%) have slightly worse rates,
whilst Manchester (1.46%) and Salford (1.89%) have significantly worse rates.

Oldham performs similarly in terms of “Ultrafast” broadband (100+ mbps) connections. We
have the 5th worst rate in Greater Manchester with 66.43%. This compares to a Greater
Manchester low of 48.04% in Tameside, and a Greater Manchester high of 90.33% in
Wigan.

2   Data taken from ThinkBroadband analysis https://labs.thinkbroadband.com/local/oldham,E08000004
                                                  7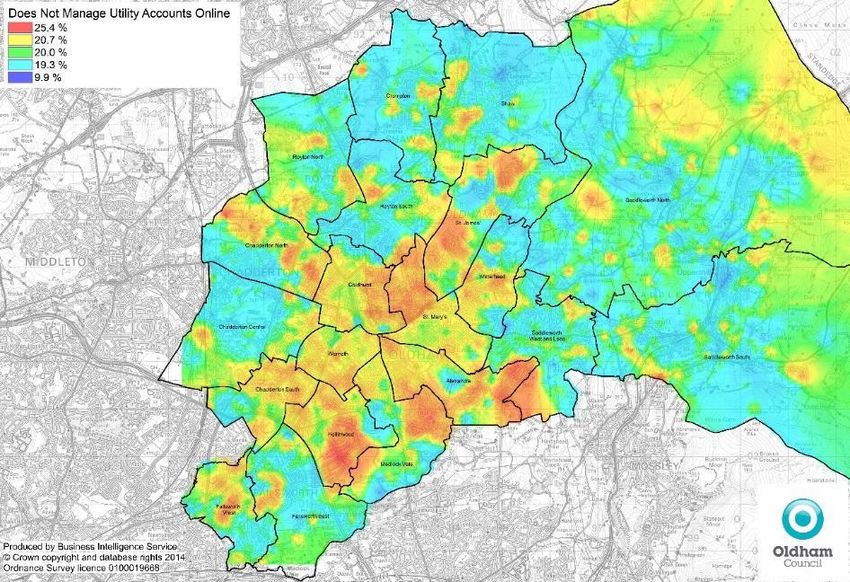
Download and Upload Speeds in Oldham
Both download and upload speeds in Oldham have been increasing significantly and
consistently over time. Calculated mean and median download and upload speeds can be
seen below, along with their linear trend lines. Note that the mean speeds are considerably
higher than the median speeds. This is due to the increasing uptake of Superfast and
Ultrafast broadband in the borough.

                   Fig 3: Download & Upload Actual Speed Test Results in Oldham3

3   Data taken from ThinkBroadband analysis https://labs.thinkbroadband.com/local/oldham,E08000004
                                                 8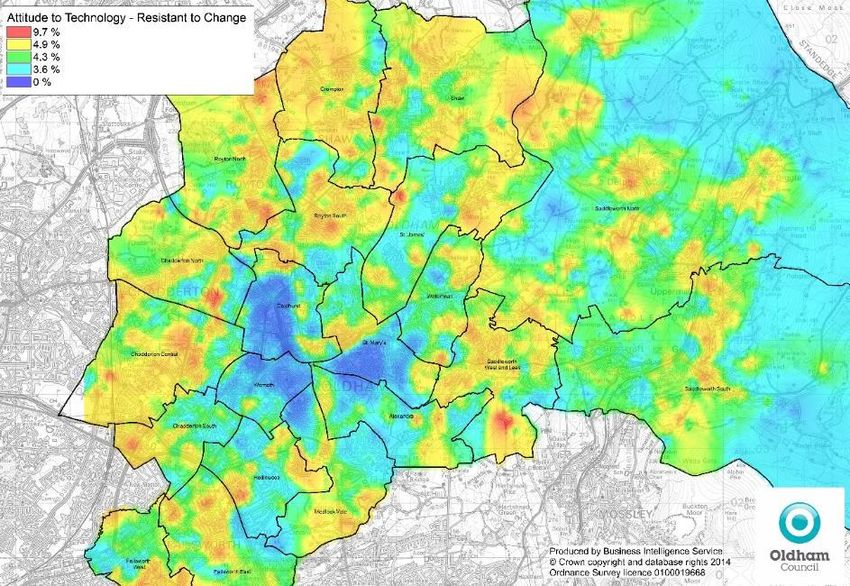
Broadband Uptake in Oldham

The same source also details the estimated real-world take-up of various broadband options
in the borough. This details that around a fifth of the borough still relies on ADSL-type
connections (18.8%), whilst almost half of Oldham’s households use Superfast ‘FTTC’
connections (47.1%), and a third (34%) have Ultrafast cabled connections. These Ultrafast
connections consist of Virgin Media customers.

                             Fig 4: Types of Broadband used in Oldham4

From the above graph we can see that, over time, people in Oldham are generally replacing
their ADSL connections with FTTC connections. Since the drop to around 30% in July 2012,
the number of people using Virgin Media’s FTTH connection has stayed relatively stable.

According to estimates from Mosaic (Experian), 2.9% of the borough do not access the
internet at all, whilst 5.7% access it less than daily.

4   Data from ThinkBroadband - https://labs.thinkbroadband.com/local/oldham,E08000004
                                                 9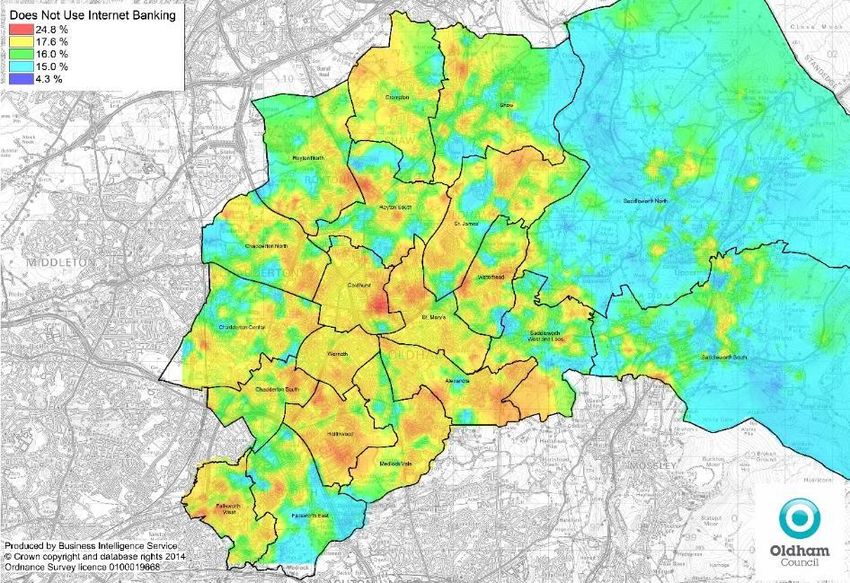
Broadband Speeds by Area

Despite the wide availability of broadband services in the borough, there is some variation in
the speeds available when comparing geographical areas. Fig 5 shows a large proportion of
Oldham residents have access to good quality connections (green), or at least
adequate/average download speeds (white). There do however, appear to be distinct areas
where high-speed coverage falls below that seen in the rest of the borough.

                    Fig 5: Broadband Speeds in Oldham by Output Area as of 20175

There are distinct sections of ‘average’ quality broadband coverage to be found in Failsworth
(See Fig 5A), though only a fraction of the section in white actually lies within Oldham
Borough. The surrounding area, which is a part of Manchester Local Authority, also suffers
from poor upload speeds. It would seem likely that this area as a whole is ripe for investment
in infrastructure by broadband providers. If pressure were required to bring this issue to the
fore, it would seem sensible to do so in concert with Manchester City Council. As well as
this, the areas known as Luzley Brook and Heyside (between Royton and Shaw) and South
Fitton Hill and Bardsley in Medlock Vale, are also only capable of achieving middling
download speeds.

5 Mapping produced using Consumer Data Research Centre tools & research
https://maps.cdrc.ac.uk/#/geodemographics/vulnerability/default/BTTTFFT/10/-0.1500/51.5200/
                                                    10
Fig 5A: Broadband Speeds in Failsworth by Output Area as of 2017 6
There is also a clear lack of high speed connections across Saddleworth (figure 5B). In
particular there are pockets of very low service to be found around Rhodes Hill (south of
Lees), north of Diggle, and around Grasscroft, as well as a number of isolated properties
found to the west of Delph and Dobcross. However, the main residential areas of Uppermill,
Dobcross, Diggle and Delph all appear to be capable of receiving at least average
broadband speeds.
Fig 5B: Broadband Speeds in Saddleworth by Output Area as of 20176
6 Mapping produced using Consumer Data Research Centre tools & research
https://maps.cdrc.ac.uk/#/geodemographics/vulnerability/default/BTTTFFT/10/-0.1500/51.5200/
11Mobile Broadband - 3G & 4G
The coverage of current-generation mobile data in the borough is relatively strong. Fig 6
shows the strength of both previous generation technologies (i.e. 2G and 3G signal) as well
as current generation 4G service. Where 4G is concerned there are few areas with
demonstrably low signal strength, and these are generally to be found at the very edges of
built up areas, or in-between rural communities. 2G/3G coverage does have some notable
areas of weak signal, including Fitton Hill, Holts, Grotton, parts of Hollinwood and many
rurban fringes.
The caveat here, is that this data is gathered by crowd sourcing, so is more reliable where
there are many instances of data traffic, such as along roads. As such, it is less reliable in
infrequently visited areas, such as houses in remote areas.
2G/3G
4G
Fig 6: 2G/3G and 4G coverage in Oldham created using live User Data7
7 Mapping produced using Consumer Data Research Centre tools & research
https://maps.cdrc.ac.uk/#/geodemographics/vulnerability/default/BTTTFFT/10/-0.1500/51.5200/
125G & “Full Fibre” Broadband Rollout
In terms of next-generation connectivity, there is a need for unlimited ‘full fibre’ broadband
and ‘5G’ infrastructure within the borough, as well as the wider Greater Manchester area.
This will ensure that local demand for information, both personal and industrial, is met well
into the future.
Levels of ‘full fibre’ connectivity are currently well below 1% in Oldham, and the borough isn’t
part of a national Hyperfast broadband rollout, though plans are being formed at a GM-level
to install the infrastructure for such connectivity.
GM has been successful in securing £23.8m of capital funding through the Local Full Fibre
Network (LFFN) Challenge. This will be used to connect over 1500 GM Local Authority
buildings, GM Fire and Rescue buildings, and Health and Social Care Partnership (CCGs)
premises/sites across the region. Additional funding will also be sourced locally. It is
expected that delivering full fibre to public sector premises in GM can have a
transformational impact on digital infrastructure across the City Region, leading to an
increase in full fibre coverage from 2% now to around 25% by the end of 2020. If this is
achieved, Greater Manchester, by far, will then have the best high speed digital
infrastructure coverage of any city-region in the UK.
Further investment has come via the Gigabit Voucher Scheme, which provides small
grants to businesses to update their internet connections. Active through 2018, but now
continuing with smaller grants, this scheme gave out 34 grants totalling £99k to Oldham
businesses- the fourth highest figure in GM, after Manchester, Stockport and Salford. It is
not clear whether this positively reflects digital awareness in Oldham or negatively reflects
greater infrastructure issues. Either way, this impacts positively on businesses with a total of
between 200 and 450 full time employees.
Regarding 5G mobile internet, this is directly linked to the level of full-fibre internet
infrastructure available. This is because data towers will require full fibre internet
infrastructure to process and distribute the amount of data required for such high download
and upload rates. Provided the above infrastructure is in place, the rollout of 5G technologies
should not be far behind.
13Digital Engagement
Key Points
Internet User Classifications – Oldham’s central wards have a high
proportion of “e-Withdrawn” individuals. Where the internet is used, it is likely
to be in the form of social media and games, often over mobiles, rather than
transactional services.
Internet User Classifications – A 2014 analysis also highlights the number of
“Young and Mobile” users in Central Oldham. This makes sense given the
young age profile of these areas.
Social Media – Regular users of Facebook and Twitter are concentrated
around the centre of Oldham. This corresponds with the concentration of
“Young and Mobile” individuals in the area.
Disengagement – The central areas of Oldham also have the highest
concentration of individuals who use the internet less than daily, and who do
not have an active email account. This corresponds with the concentration of
“Passive and Uncommitted” users in central Oldham.
Online Account Management – Saddleworth has the highest rate of online
banking usage, as well as the highest rate of online utility management
accounts.
14Technology Usage and Digital Engagement Snapshots
Mosaic (Experian) customer insights data can be used to provide estimates on the
characteristics of Oldham’s residents. This is accomplished by modelling likely behaviour, by
placing people into categories using data available on them. The latest Mosaic data for
Oldham is based on 2013 statistics (but with 2018 residents) and this is important to bear in
mind when viewing the figures below. It is likely that most, if not all, of these figures will have
changed in line with national and local trends in the last 5 years, although the overall
patterns shown almost certainly remain valid.
Internet and Social Media Engagement
Disengagement Snapshot Engagement Snapshot
Doesn't Access Twitter at All 65.1% Uses Twitter Daily 13.5%
Doesn't Access Facebook at All 26.7% Uses Facebook Daily 45.3%
Doesn't Use Online Banking 26.0% Uses Online Banking Daily 19.6%
Doesn't Manage Utilities Online at All 20.4% Uses Utility Manager Daily 10.5%
Doesn't Have Internet at Home 12.3% Has Internet at Home 87.7%
Doesn't Have a Mobile Phone 6.3% Has a Mobile Phone 93.7%
Uses Internet Less than Daily 5.7% Uses Internet More than Daily 67.0%
Doesn't Access the Internet at All 2.9% Uses Internet at Least Daily 94.3%
Doesn't Access Email at All 1.9% Uses Email Daily 76.8%
Whilst not having a smart TV may not impact people’s lives too much, not accessing the
internet, either as a personal choice or due to a lack of availability, can greatly limit the
opportunities available to individuals. Similarly, with the ever increasing number of high
street bank closures, not accessing online banking could make managing personal finances
ever more difficult. From the council’s perspective, those individuals who are disengaged
with technology are the hardest to reach, and therefore the hardest to help. There is a risk
that vulnerable individuals, who are also disengaged with technology, may get left behind.
15Customer Insight: Technology & Internet Usage Profiles
User Profiles – Current Picture
The way in which different socio-economic groups in different areas of the borough use the
internet is important to factor in when considering how best to support Oldham’s digital
infrastructure. Research conducted by the Consumer Data Research Centre has categorised
how different communities across the UK generally use the internet, giving us an idea of the
main needs – and barriers – that specific areas might be experiencing.
Fig 7 shows Oldham and the surrounding areas categorised as one of ten broad groups,
according to the most commonly found type of resident in the area. Explanations of the
groups which appear on this chart can be seen below figure 7 - descriptions have been
condensed to reflect the likely components of Oldham’s residents, and the areas within the
borough which they can be found.
Fig 7: Internet User Classifications by Output Area in Oldham (2018) 8
Located around central Oldham wards with pockets around Royton, Sholver & Failsworth.
This Group comprises individuals who are the least engaged with the Internet. The socio-
economic profile of the population is characterised by less affluent white British individuals,
or areas of high ethnic diversity. It has the highest rate of unemployment, social housing,
and people that don’t have access to, or have access but never engage with, the Internet. It
also expresses the lowest rate of engagement in information seeking, financial services, and
access via a mobile device. Online shopping is also particularly low, with the exception of
Clothing on Credit - suggesting an opportunistic dimension to Internet usage.
8 Mapping produced using Consumer Data Research Centre tools & research
https://maps.cdrc.ac.uk/#/geodemographics/vulnerability/default/BTTTFFT/10/-0.1500/51.5200/
16Located in the suburbs of Oldham including Chadderton, Shaw, St James’ and Failsworth
In this group, many individuals have limited or no interaction with the Internet. Members of
this Group have few distinctive characteristics in conventional socioeconomic terms, albeit
higher levels of employment in semi-skilled and blue-collar occupations. Individuals are
rarely online and most commonly report use once a week or less. There is a mild preference
for access via smartphones. The Internet is typically used for social networks, gaming and
some limited online shopping.
Located around settlements in Saddleworth, the eastern edge of Lees and North of Shaw
Users undertake online shopping, particularly for groceries perhaps because of the limited
local offer from ‘bricks and mortar’ retailers. Users tend to be late middle-aged or elderly,
and as might be expected, include a high percentage of retired home owners. The preferred
method of engagement with the Internet is personal computers located at home, with low
levels of mobile access. In addition to shopping users search for information or access
online banking rather an engage with social networks or gaming: the Internet is used as a
utility rather than a conduit for entertainment.
Found in pockets in Diggle, Saddleworth South and between Royton and Shaw
The e-Veterans represent affluent families, usually located in low-density suburbs, with
populations of mainly middle-aged and highly qualified professionals. They are likely to be
frequent and experienced users of the Internet, having the second highest levels of Internet
access at work (after the e-Professionals users). They engage with the Internet using
multiple devices, and in a variety of ways. They are fairly mature users, and have higher
levels of engagement for information seeking, online services, and shopping, but relatively
less so for communication and entertainment, particularly social networks or gaming.
User occupy large areas of Royton, Shaw and Lees, central Uppermill and Delph
Members of this Group are ageing and predominantly White British, retired and relatively
affluent. They make average use of the Internet, typically using a personal computer at
home. Despite being infrequent users, they are adept enough to use the Internet for
information seeking, financial services and online shopping, but less so for social networks
streaming or gaming.
To be found in swathes of Royton, Shaw and Lees plus isolated pockets of Chadderton
This Group exhibit modal Internet user characteristics but are drawn from a wide range of
social echelons as defined using conventional socioeconomic data, and most likely
represent heterogeneous neighbourhoods. Their level of engagement is average across
most attributes, characterising the typical user.
17Historical Analysis
Similar work was undertaken by CDRC in 2014 (figure 8) with a different set of archetypes
being matched to small geographical regions. The variety compared to the 2018 data
produced demonstrates how difficult it can be to classify complex areas where change is
quick – this is particularly true of compressed urban communities.
Fig 8: Internet User Classifications by Output Area in Oldham (2014) 9
Comparing the 2014 and 2018 analyses, the clearest difference is in the communities of
West Central Oldham. Whilst these were classified as withdrawn and uncommitted in the
2018 data set, the 2014 analysis seems to focus more on the younger age range that these
areas will likely boast. This is due to the prevalence of South Asian communities in these
areas, leading them to be classified as “Young and Mobile”. “E-Withdrawn” and “Young and
Mobile” share several characteristics, particularly the preference for mobile over desktop
devices. The true picture of Oldham likely includes elements of both classifications, across a
broad spectrum of users from young and engaged, to disenfranchised, to first-generation
immigrants for whom the internet will never be a major factor.
Another change of note is in Saddleworth’s perceived usage. The analysis conducted in
2014 seems to suggest a large number of uncommitted internet users - particularly in
Uppermill. This has shifted to a much more tech-savvy cohort in the 2018 data set, despite
the assumptions of a mainly white, middle-class, professional cohort holding true. This shift
may have occurred for a variety of reasons. Improvements in infrastructure, increasingly
digitally skilled older generations, and increasing reliance on the internet in managing a
variety of accounts, applications, etc, could all play a role.
9 Mapping produced using Consumer Data Research Centre tools & research
https://maps.cdrc.ac.uk/#/geodemographics/vulnerability/default/BTTTFFT/10/-0.1500/51.5200/
18Communication Preferences
Email Usage
Email usage is strong across almost all groups, but the propensity for it to be the preferred
communication method varies. In terms of Oldham’s communities, Figure 9 shows there is
strong preference for this method of contacting organisations in Saddleworth, Royton and
Shaw, with relatively low uptake in areas of central Oldham. In central Oldham, poorer white
communities and South Asian populations dominate, giving rise to a number of possible
explanations – lower desktop/laptop usage in both groups could make writing emails a more
laborious task, or else lower English literacy levels could pose a barrier, especially if an
issue is perceived as being complex.
Fig 9: Mosaic Prediction of distribution of Residents Preferring to Contact Organisations via Email10
10
This and subsequent Mosaic maps produced by Business Intelligence Service using Experian
Mosaic data © Experian 2018
19Online Forms
Using other online contact methods (via forms etc) is less preferable to almost all groups,
when compared to email communication (Figure 10), with only residents in Saddleworth (and
specifically the north of the district) seeming to have a penchant for contacting organisations
in this way. This may be due to lower smartphone ownership in the area, which coincides
with the lack of 4G coverage in the area. Email communication is more popular and simpler
to implement than online forms. In situations where quantitative data (and hence an online
form) isn’t required, email communication would be preferable to maximise responses.
Fig 10: Mosaic Prediction of distribution of Residents Preferring to Contact Organisations Online 11
11 Produced by Business Intelligence Service using Experian Mosaic data © Experian 2018
20Social Media
High regular use of social media platforms provides organisations an opportunity to reach a
large number of individuals who may otherwise not be engaged in local issues. It is also
likely that those using such media are generally more youthful (though the average age of
users is shifting upwards).
Facebook
In Oldham’s case (shown in Figure 11), Saddleworth’s residents are resistant to Facebook
use, as too are the inhabitants of Chadderton. In central Oldham, however, there is much
higher regular use and this can be tied closely to higher smartphone usage/lower laptop and
PC ownership in these areas. It may also be indicative of the more youthful population
prevalent in these areas, in both the White British and South Asian communities, which
typically interact with Facebook multiple times a day.
Fig 11: Mosaic Prediction of the distribution of Regular Facebook Users in Oldham12
12 Produced by Business Intelligence Service using Experian Mosaic data © Experian 2018
21Twitter
Twitter provides an opportunity for messages and news to be distributed and shared quickly
amongst networks, and typically has an older demographic but lower overall usage than
Facebook. Figure 12 demonstrates high engagement within Oldham is confined to the
central wards with much lower use in the outlying districts, particularly Royton & Crompton
and Chadderton.
Fig 12: Mosaic Prediction of the distribution of Regular Twitter Users in Oldham 13
13 Produced by Business Intelligence Service using Experian Mosaic data © Experian 2018
22Daily Internet Usage
Individuals who do not use the internet on a daily basis may be a good indication of those
who, for whatever reason, have not fully integrated with the digital world. Indeed, it may even
signify those who are disengaged with society more generally. We would expect individuals
who do not use the internet daily to be reluctant to transition to using the internet for account
management and information storage (among other things).
The heat map in Figure 13 shows a distinct area around Oldham town centre where the rate
of those who do not use of the internet on a daily basis approaches 1 in 10. This is
essentially areas with a large South Asian population, and is probably representative of
generational change: whilst younger generations can be classified as “Prospectors”, very
web savvy and extensively using mobiles and WhatsApp, older residents or first/second
generation arrivals may be far more internet-resistant.
Elsewhere in the borough, around 1 in 20 people can be expected to use the internet less
frequently, with a relatively even distribution that may be attributable to a mix of deprivation
and distributions of older people.
Fig 13: Mosaic Prediction of the distribution of Oldham residents using the internet less than daily 14
14 Produced by Business Intelligence Service using Experian Mosaic data © Experian 2018
23Access to an Email Account
Individuals who do not accessing emails, so presumably don’t have an active email account,
is a good indication of those who do not interact with the online world in any organised or
meaningful way - as email often acts as a gateway to other online pursuits. Without it,
account management, social media, and more, are inaccessible.
Using Customer Insight data provided by Experian, we can identify areas of the borough
where lack of email use might be a factor. The heat map shown in Figure 14 shows that –
although limited to around 3% in affected areas – the issue isn’t concentrated in a single
area. Instead, large areas of Coldhurst, St Mary’s, Werneth, St James’, Alexandra, Medlock
Vale and Hollinwood all see relatively low levels when compared to the districts of Royton &
Crompton, Chadderton and Saddleworth where only 1-1.5% are thought not to access
emails. As with regular internet access, those included in this measure are more likely to be
elderly and/or less financially secure – email use may not be seen as a necessity in either
case.
Fig 14: Mosaic Prediction of the distribution of Regular Facebook Users in Oldham 2018)15
15 Produced by Business Intelligence Service using Experian Mosaic data © Experian 2018
24Perception of Technology
Opinions on technology within the borough are thought to vary greatly (Figure 15) with
clearly defined areas sharing similar opinions on the benefits technology brings to our lives.
Areas such as Coldhurst, Werneth and St Mary’s in particular are more likely to think that
technology can support and enhance human interactions, which clearly correlates with the
elevated social media usage noted in these localities.
As the distance from the centre of Oldham increases, so too does the lack of faith in
technology’s positive effects on human relationships (perhaps correlating with an increase in
age) with the lowest rates being found in rural Saddleworth.
Fig 15: Mosaic Prediction of the distribution of those believing human interactions improved by
technology16
16 Produced by Business Intelligence Service using Experian Mosaic data © Experian 2018
25Customer Insight: Online Account Management
Online Banking
The use of internet banking demonstrates the ability and willingness to handle important
financial matters online. This tells us that the individual could likely handle other financial
interactions online. A lack of internet banking use could also correspond to individuals who
are less adept at managing their money, and thus more likely to experience financial
difficulties. In Figure 16 we can see that higher levels of internet banking is patchy, with
areas such as Royton, Hollinwood, Coldhurst, Waterhead, and the Holts estate, particularly
so.
It is the more financially-stable communities in Saddleworth which show the best rates of
online bank account management. This is despite the more advanced age profile of the
area, which we might have expected to decrease usage. Whilst the higher rate may be due
to the higher levels of wealth in these areas, it may also be linked to the higher prevalence of
professionals, who are more likely to deal with technology on a day to day basis in their job
roles and be more technologically savvy.
Fig 16: Mosaic Prediction of the distribution of Oldham residents not engaging with Internet Banking 17
17 Produced by Business Intelligence Service using Experian Mosaic data © Experian 2018
26Online Utility Management
Similarly to online bank account management, higher rates of online utility account
management likely indicates financial awareness, whilst lower rates likely indicate
vulnerability.
There appears to be a high degree of correlation between levels of internet banking and
levels of online utility management. However, there appears to be a higher rate of individuals
who engage with of online utility account management. The lack of physical premises to visit
for utility management (as opposed to a traditional bank with a high street presence) may
have pushed more users towards this online solution.
Fig 17: Mosaic Prediction of the distribution of online utility account management 18
18 Produced by Business Intelligence Service using Experian Mosaic data © Experian 2018
27MyAccount Engagement
MyAccount is Oldham Council’s single-login customer account, which will ultimately be used
to integrate all customer transactions. However, it is currently only implemented for Council
Tax and Housing Benefit transactions.
Around 9.5% of council tax payers are currently using MyAccount. There appears to be
significant turnover in MyAccount users, probably linked to newcomers to Oldham being
more likely to use the service and also having greater churn. Those that do not use
MyAccount are often users of Direct Debit, which is a low-cost approach, but does not offer
the potential for integrated customer transactions. Around a third of households use neither
MyAccount nor Direct Debit. These alternative methods increase collection and processing
costs for the council.
Fig 18: Overview of MyAccount take-up and analysis conducted by Business Intelligence
28MyAccount penetration (fig 19) is geographically fragmented, and patterns are difficult to
interpret. It does appear that rural areas have low take-up, and areas of social housing (and
some private rented) have highest take-up. This is especially true where those areas include
relatively recent new builds, where there is likely to be a high turnover of people entering the
borough.
Fig 19: Penetration of the council’s MyAccount online system
29Council Social Media
Facebook
Oldham Council has a series of Facebook accounts, inspired by the “Love Where You Live”
Campaign. The Council’s main account is “I Love Oldham”, and there are sub accounts for
sub regions, such as the “I Love Chadderton” page.
From the above, we can see that the number of people who “like” the council’s Facebook
page is steadily increasing. The sharp increase of users around the end of February 2018
coincides with “the Beast from the East”, a cold wave which led to heavy snowfall in the
region. As such, this increase in users is likely due to people using social media to check for
school closures, road closures, gritting services, and other snow related news. From the 1st
of January 2018 to the 1st of January 2019, the page increased in size by 2,866 followers.
This is an average of over 7 new likes per day.
Oldham Council Leader Sean Fielding’s Video Blog is published via the Council’s Facebook
page. Though the figure is volatile, it averages around 10,000 views per vlog. This is a
significant increase from when the Leader’s Blog was written, and attracted around 1,000
views per publication. This shows people’s preference for video, rather than written, content.
One other interesting metric to mention, is the prevalence of smart phone usage over
laptop/desktop usage. Only around 1% of Facebook newsfeed views were made on a laptop
or desktop. This demonstrates the changing ways in which people utilise social media, and
the shift to people now using it on the go.
Twitter
At the time of writing, Oldham Council had 21,380 followers on Twitter. This number grows
by an average of around 2 followers per day. In a typical month, there are around 15,000
profile visits, and around 1,000 mentions of Oldham Council’s profile.
In recent times, residents have taken to twitter to report issues they have. One notable
example is people tweeting bins which need emptying. The social media team does not have
the capacity to directly deal with these issues, and this necessitates channel shifting within
the council. Similarly to the prevalence of smartphone usage for Facebook above, this
demonstrates the changing ways in which people engage with the council, and their
expectation that the council change with them.
30Technology & Industry
Key Points
Device Ownership – Smartphone ownership is most common in the areas
surrounding the centre of Oldham. The pattern for Desktop or Laptop
ownership is similar, but with a swathe of high rates across Saddleworth. This
is potentially due to the high rate of professionals in these areas.
Attitudes Towards Technology – As a general rule, the farther from the
centre of Oldham you get, the fewer “Early Adopters” there are, and the more
resistant to technology people get.
Wi-Fi Hotspots – Most areas in Oldham are within walking distance of a free
Wi-Fi hotspot. Alexandra, Holts, and the westerly section of Chadderton are
the main areas which do not have easy access to free Wi-Fi hotspots.
Library Computers – There are 12 libraries across the borough which have
computer facilities for residents to access. Chadderton South, Werneth,
Alexandra and St James/Waterhead all lack local access to such resources.
31Customer Insight: Access to Technology & Online Services
As with the previous chapter, Mosaic data provides us with insights to technologies owned,
but care must be taken to consider recent technology trends.
Technology Owned (or Have Access to) Snapshot
Smartphone 72.7%
Tablet 51.8%
Laptop 85.2%
PC 70.6%
Smart TV 25.0%
Since 2013, national trends have seen a rise in Smartphone, Tablet, and Smart TV
ownership. Laptop ownership has remained roughly stable, whilst PC ownership has
declined. It seems likely that PC ownership has declined due to advancements in computer
technology meaning that portable alternatives, such as laptops and tablets, can do
everything that a PC can, whilst also being more convenient. The rise in the ownership of
Smart TVs could be linked to the rise in uptake of streaming sources such as Netflix, as both
have been increasing since 2013.
32Smartphone Ownership
Smartphone ownership is likely to be high amongst teens, young adults, and most residents
of working age. Despite the age of the data used, the trends shown are still relevant. The
highest rates of ownership are found around the central wards (fig 20), with strong usage
along the main road corridor through Failsworth and in the Holts estate. This high usage
could be due to a number of factors – the younger demographics of the south Asian
communities situated close to the centre of town will certainly play a role. It is also possible
that attitudes towards personal finances amongst the white British communities in these
areas contribute to the higher levels of smartphone ownership.
One knock-on effect of this reliance on mobile internet access is that it will make online-only
processes such as application for Universal Credit more challenging, effectively applying a
“poverty premium”.
Areas with much lower take-up tend to centre around Royton, Shaw and Saddleworth in
particular. These areas are more likely than others in the borough to have older residents.
Fig 20: Mosaic Prediction of the distribution of residents owning/having easy access to a
Smartphone19
19 Produced by Business Intelligence Service using Experian Mosaic Customer Insight Data
33Computer Ownership
The patterns noted in those owning PCs (either desktop or laptop) does not present a
significantly different picture (fig. 21) to that for smartphone ownership. Higher rates were
found towards central Oldham, where smartphone ownership was also higher. Lower rates
of ownership can been seen across Royton South, Crompton, St James’, and the band of
wards across the south of the borough including Chadderton South, Werneth, Medlock Vale
and Holinwood. The highest levels can be seen in Saddleworth, most likely due to the high
rate of professionals located in these wards.
As noted in the Smartphone analysis, the data used to create these analyses is likely to be
out-of-date – in reality, households without a PC or laptop may have settled on a tablet as an
easy-to-use and accessible method of connecting to the internet at home and elsewhere.
Fig 21: Mosaic Prediction of the distribution of PC/Laptop ownership in Oldham 20
20 Produced by Business Intelligence Service using Experian Mosaic data © Experian 2018
34Attitudes Towards Technology
The willingness to actively engage with new technology, systems, or processes is
advantageous when trialling new systems or ways of working. By recognising areas in which
there is a high proportion of ‘early adopters’, likely future trends in tech usage amongst the
borough’s residents can be identified.
Using Experian Customer Insight analysis, we can identify the central Oldham wards of St
Mary’s, Coldhurst, and Werneth as, by far, the most likely to be home to tech-savvy
residents. Few other areas have anywhere near their density of ‘early adopters’. Residents
in the North and East of the borough are less likely to actively seek out and use new
technology.
Fig 22: Mosaic Prediction of the distribution of residents who actively purchase and trial new and
cutting-edge technology21
21 Produced by Business Intelligence Service using Experian Mosaic data © Experian 2018
35The distribution of residents with an actively resistant attitude to technology is fragmented
with few distinct trends. Areas such as Royton, Crompton, Shaw, Chadderton, Holts and
settlements in Saddleworth all tend more strongly to resistance – these areas should be
actively targetted in any campagn aiming to increase online interactions.
Fig 23: Mosaic Prediction of the distribution of residents resistant to technological advances 22
22 Produced by Business Intelligence Service using Experian Mosaic data © Experian 2018
36Wi-Fi Hotspots & Libraries in Oldham
Wi-Fi
Free public Wi-Fi ‘hotspots’ allow individuals who would otherwise struggle to connect to the
internet, easy access. These hotspots also allow residents to access the web whilst away
from home, potentially allowing them to complete tasks as they arise, rather than having to
put them off until they return home. Hotspots can also be utilised by residents to maintain
communication and engagement whilst out and about in the borough.
Oldham appears well-catered for when considering the Wi-Fi access points present in the
borough (Figure 24 illustrates a half mile radius around each to demonstrate areas which are
within a conservative ‘walking distance’ of these points).
Central Oldham, Failsworth, and settlements in Saddleworth appear particularly well
provided for, though gaps in this coverage exist - particularly in Alexandra, Holts, and the
westerly section of Chadderton. The effect of a lack of Wi-Fi hotspots is likely greater in
Alexandra and Holts, as they are more deprived areas than Chadderton. Individuals in
Alexandra and Holts who do not have Wi-Fi at home may find it difficult to apply for jobs due
to the increasingly online nature of job applications, and may also struggle to develop their
online skills. Whilst good public transport links exist within Oldham, those individuals who do
not have internet access at home are likely to be the same people who find the cost of public
transport prohibitive, and in Holts in particular geographic position is likely to exacerbate this
issue.
Fig 24: Wi-Fi Hotspot Locations in Oldham. 0.5 mile radii drawn to reflect ‘easy walking distance’. 23
23 OfCom Open Data & Analysis https://www.ofcom.org.uk/research-and-data/data/opendata
37Libraries
Libraries are an excellent resource for those who lack traditional laptop/desktop equipment,
which is useful for tasks such as submitting job applications, and completing education
assignments. Each location depicted in figure 25 marks the location of one of Oldham’s
libraries with public ICT facilities (although, in some cases, this may be limited to just 1 or 2
workstations). A half mile radius has been illustrated around each location to illustrate what
could be considered ‘easy walking distance’ from each site.
Most major areas of the borough have a library with ICT facilities in their centre, though there
are some exceptions – Chadderton South, Werneth, Alexandra and St James/Waterhead all
lack local access to such resources. Although each of these areas have good transport links
with Oldham town centre (and hence the Central Library) this lack of resource could be seen
as a barrier to those who do not have the means to access desktop sites at home.
Fig 25: Locations of Oldham’s Libraries. 0.5 mile radii drawn to reflect ‘easy walking distance’.
38Digital Industry Within and Around the Borough
Analysis has been undertaken at a Greater Manchester level on the prevalence of digital
industry across the city-region, as well as the number of the skilled individuals which
underpins them.
In terms of digital businesses units (of whatever description) in the area (figure 29), Oldham
appears not to support many within its central wards, with some higher rates to be found in
Chadderton on the western edge of the borough – possibly as a result of the business parks
situated close to the M60 motorway – as well as in Saddleworth.
Fig 29: Digital Industries in Greater Manchester, 2014 (Oldham highlighted in green box) 24
24 Mapping and analysis taken from GM Deep Dive
http://www.neweconomymanchester.com/media/1761/04-digital-creative-deep-dive-report-final.pdf
39Figure 30 appears to confirm that the latter is more likely to be made up of cottage-industry-
type businesses. Meanwhile, denser groupings can be seen around Chadderton as well as
in the very centre of Oldham. By contrast, Manchester and Salford take the lion’s share of
the industry in the region, with the majority of workers based around Manchester City Centre
and Media City UK. Good levels of business enterprise are seen in the southern boroughs
as well as across parts of Bury and Rochdale, which both have a strong concentration of
skilled digital workers in one of their central wards.
Fig 30: Digital Industries employment Greater Manchester, 2014 (Oldham highlighted in green box) 25
Selected Digital Enterprises
The following is a selective list of digital enterprises within Oldham.
Inclusive Technology- leading supplier of software and hardware for people with
special needs. Based in Saddleworth.
Purple Wifi- international enterprise WiFi solutions with international footprint.
Founded in Oldham, with a base in Chadderton.
Web Applications UK- developers of web software suites, based in central Oldham.
Pay360 by Capita- online payment solutions, based in central Oldham.
Jobskilla-online training platform connecting the unemployed with training and
support, based in Shaw.
25 Mapping and analysis taken from GM Deep Dive
http://www.neweconomymanchester.com/media/1761/04-digital-creative-deep-dive-report-final.pdf
40Local Resources
Hack Oldham
What is it?
Hack Oldham is a non-profit, community owned and operated, co-working and maker space,
located in Oldham’s Independent Quarter. A maker space is a community-operated, not for
profit workspace, where people with common interests - often in computers, machining,
technology, craft, science, digital art or electronic art, can meet, socialise, and collaborate.
What does it offer?
Co-working Maker Space Events
Flexible desk hire for start- Public workshop facilities There is a wide range of
ups, sole traders, and including 3D printing, laser events and workshops
SME's, high speed internet, cutting, electronics, available. These include
free refreshments, and an reprographics, and a wide meet-ups and clubs, and
environment of likeminded range of tools and cover topics such as STEM,
people. equipment. textiles, and Minecraft.
One of the Events Hack Oldham offer is a “Digital Drop In”. This is a chance to get help with
basic IT questions, bring in your device for advice and tips, or get advice on what kind of
device will suit your needs. You can find out how to get online, understand how to better use
your phone, discover free software alternatives, and learn which device is right for you.
Website
www.hackoldham.com
41Digital Literacy & Skills
Key Points
10% of the working population in the North West have no Basic Digital Skills.
76% of those with no Basic Digital Skills are retired.
78% of individuals in the North West have all of the Basic Digital Skills.
42Digital Skills & Literacy
A recent report commissioned by Lloyds Bank and conducted by Ipsos Mori examined the
‘Digital Skills’ of the UK. Part of this was a set of ‘Basic Skills’, which are defined in figure 26
below. These cover all of the basic ICT tasks an individual might be expected to carry out in
any employment, to apply for a job, to participate in educational courses, or to complete
personal administrative tasks and search for information or advice.
Fig 26: ‘Basic Digital Schools’ as defined by Lloyds Bank Digital Inclusion Report 201826
Whilst data is not yet available a council level, it is estimated that 10% of the working
population in the North West, and 8% in the UK, do not possess any of the basic digital skills
listed above. At the UK level, 76% of those with zero basic digital skills are retired.
On the other hand, 78% of individuals in the region possess the full suite of these abilities,
compared with 79% nationally. When considering the financial implications of having basic
digital skills, 71% of respondents agreed that the internet helped them to save money, whilst
66% concurred that using internet and/or mobile banking helped them to avoid overdraft
fees. 68% of over 60s are identified as being ‘online’.
There appears to be an aspiration to supply this type of intelligence to local authority level.
We are attempting to obtain this, but to date there has been no publication.
26 Taken from Lloyds Bank Digital Index Report 2018
https://www.lloydsbank.com/banking-with-us/whats-happening/consumer-digital-index.asp
43Fig 27: North West Highlights from Lloyds Bank Digital Inclusion Report 2018 27
27 Taken from Lloyds Bank Digital Index Report 2018
https://www.lloydsbank.com/banking-with-us/whats-happening/consumer-digital-index.asp
44Appendix A
National & Local Targets & Measures
The current UK government has set out 7 areas in which they aim to improve the county’s
digital clout, with a particular emphasis on supporting the nation’s industry post-Brexit.
Culture, Media and Sport Secretary Karen Bradley MP gives the following as the
government’s main aims:
CONNECTIVITY - Build world-class digital infrastructure for the UK
To complete rollout of 4G and Superfast Broadband by 2020, with over £1 billion to
be invested in ‘full fibre’ and 5G infrastructure.
DIGITAL SKILLS - Give everyone access to the digital skills they need
Adults to have free training in basic digital skills, and ensure specialist digital skills
are promoted and supported.
DIGITAL SECTORS - Make the UK the best place to start/grow digital business
Encourage innovation-friendly regulation, invest in R&D funding and create
conditions for AI industry to thrive and grow.
WIDER ECONOMY - Helping every British business become a digital business
To make sure businesses have the knowledge and means to access to the best
digital technology and data to drive innovation and productivity.
SAFE & SECURE CYBERSPACE - Make the UK safe to live & work online
Introduce a new approach of Active Cyber Defence, using the skills, knowledge and
expertise of GCHQ working with the UK’s ISPs to provide a new level of protection.
DIGITAL GOVERNMENT - Maintain the UK as a leader in serving citizens online
Work, across government and the public sector, to harness the potential of digital to
radically improve the efficiency of our public services and infrastructure.
DATA - Unlocking the power of data in the UK economy
Introduce GDPR and continue to improve public confidence in data’s power and
usage.
It is obvious that each of these elements will, in some way at least, affect Oldham in the near
future if they do not already – economic growth is a particular focus of these aims and
should be acknowledged as a blueprint for future growth in the borough.
More locally, Greater Manchester mayor Andy Burnham has set out a further seven, more
specific, targets for the Combined Authority (figure 28) – many of which share features with
those set out by the current government – to be reached in the coming 3-8 years.
Intelligence on how Oldham fits into this picture of is not yet obtainable, but will be included
in this document once it is made available.
45Fig 28: Table shows key digital objectives set out for Greater Manchester by Mayor Andy Burnham 28
28 Taken from GM-CA Digital Strategy 2018-2020
https://www.greatermanchester-ca.gov.uk/download/meetings/id/2957/12a_digital_strategy
46You can also read