Self rated health in individuals with and without disease is associated with multiple biomarkers representing multiple biological domains
←
→
Page content transcription
If your browser does not render page correctly, please read the page content below
www.nature.com/scientificreports
OPEN Self‑rated health in individuals
with and without disease
is associated with multiple
biomarkers representing multiple
biological domains
L. Kananen1,2,3, L. Enroth1,2, J. Raitanen1,2, J. Jylhävä2,4, A. Bürkle5, M. Moreno‑Villanueva5,
J. Bernhardt6, O. Toussaint7,32, B. Grubeck‑Loebenstein8, M. Malavolta9, A. Basso9,
F. Piacenza9, S. Collino10, E. S. Gonos11, E. Sikora12, D. Gradinaru13, E. H. J. M. Jansen14,
M. E. T. Dollé14, M. Salmon15, W. Stuetz16, D. Weber17, T. Grune17,18,19, N. Breusing19,
A. Simm20, M. Capri21, C. Franceschi21,22, P. E. Slagboom23, D. C. S. Talbot24, C. Libert25,26,
S. Koskinen27, H. Bruunsgaard28, ÅM. Hansen29,30, R. Lund29,31, M. Hurme2,3 & M. Jylhä1,2*
Self-rated health (SRH) is one of the most frequently used indicators in health and social research.
Its robust association with mortality in very different populations implies that it is a comprehensive
measure of health status and may even reflect the condition of the human organism beyond clinical
diagnoses. Yet the biological basis of SRH is poorly understood. We used data from three independent
European population samples (N approx. 15,000) to investigate the associations of SRH with 150
biomolecules in blood or urine (biomarkers). Altogether 57 biomarkers representing different organ
1
Faculty of Social Sciences (Health Sciences), Tampere University, Tampere, Finland. 2Gerontology Research
Center (GEREC), Tampere, Finland. 3Faculty of Medicine and Health Technology (MET), Tampere University,
Tampere, Finland. 4Department of Medical Epidemiology and Biostatistics, Karolinska Institutet, Stockholm,
Sweden. 5Molecular Toxicology Group, University of Konstanz, Konstanz, Germany. 6BioTeSys GmbH,
73728 Esslingen, Germany. 7Research Unit On Cellular Biology, University of Namur, Rue de Bruxelles, 61,
5000 Namur, Belgium. 8Research Institute for Biomedical Aging Research, University of Innsbruck, Rennweg, 10,
6020 Innsbruck, Austria. 9Advanced Technology Center for Aging Research, Scientific Technological Area, IRCCS
INRCA, Ancona, Italy. 10Nestlé Research, Nestlé Institute of Health Sciences, EPFL Innovation Park, 1015 Lausanne,
Switzerland. 11Institute of Biology, Medicinal Chemistry and Biotechnology, National Hellenic Research
Foundation, Athens, Greece. 12Laboratory of the Molecular Bases of Ageing, Nencki Institute of Experimental
Biology, Polish Academy of Sciences, 3 Pasteur Street, 02‑093 Warsaw, Poland. 13Carol Davila University of
Medicine and Pharmacy, Bucharest, Romania. 14National Institute for Public Health and the Environment
(RIVM), Centre for Health Protection, P.O. Box 1, 3720 BA Bilthoven, The Netherlands. 15Straticell, Science Park
Crealys, Rue Jean Sonet 10, 5032 Les Isnes, Belgique. 16Institute of Nutritional Sciences (140), University of
Hohenheim, 70593 Stuttgart, Germany. 17Department of Molecular Toxicology, German Institute of Human
Nutrition Potsdam-Rehbruecke (DIfE), Nuthetal, Germany. 18Department of Nutritional Toxicology, Friedrich
Schiller University Jena, Dornburger Str. 24, 07743 Jena, Germany. 19Institute of Nutritional Medicine (180),
University of Hohenheim, 70593 Stuttgart, Germany. 20Department of Cardiothoracic Surgery, University Hospital
Halle, Ernst‑Grube Str. 40, 06120 Halle (Saale), Germany. 21DIMES‑ Department of Experimental, Diagnostic
and Specialty Medicine, ALMA MATER STUDIORUM, CIG-Interdepartmental Center “L.Galvani”, University
of Bologna, 40126 Bologna, Italy. 22Department of Applied Mathematics of the Institute of ITMM, National
Research Lobachevsky State University of Nizhny Novgorod, Nizhny Novgorod, Russian Federation. 23Section
of Molecular Epidemiology, Leiden University Medical Centre, Leiden, The Netherlands. 24Unilever Science
and Technology, Beauty and Personal Care, Sharnbrook, UK. 25Center for Inflammation Research, VIB, Ghent,
Belgium. 26Department of Biomedical Molecular Biology, Ghent University, Ghent, Belgium. 27National Institute
for Health and Welfare, Helsinki, Finland. 28Department of Clinical Immunology, Rigshospitalet, University Hospital
of Copenhagen, Copenhagen, Denmark. 29Department of Public Health, University of Copenhagen, Copenhagen,
Denmark. 30National Research Centre for the Working Environment, Copenhagen, Denmark. 31Center for Healthy
Aging, University of Copenhagen, Copenhagen, Denmark. 32O. Toussaint is deceased. *email: marja.jylha@tuni.fi
Scientific Reports | (2021) 11:6139 | https://doi.org/10.1038/s41598-021-85668-7 1
Vol.:(0123456789)www.nature.com/scientificreports/
systems were associated with SRH. In almost half of the cases the association was independent
of disease and physical functioning. Biomarkers weakened but did not remove the association
between SRH and mortality. We propose three potential pathways through which biomarkers may
be incorporated into an individual’s subjective health assessment, including (1) their role in clinical
diseases; (2) their association with health-related lifestyles; and (3) their potential to stimulate
physical sensations through interoceptive mechanisms. Our findings indicate that SRH has a solid
biological basis and it is a valid but non-specific indicator of the biological condition of the human
organism.
Self-rated health (SRH) is one of the most frequently used measures in epidemiological, clinical and social
research. It is known to predict mortality, future functional status and outcome of treatment in populations that
vary by age, gender, social class, health status, country and culture1,2. In many studies SRH remains a signifi-
cant predictor of mortality after adjustment for several other health indicators2. However, the wider the array
of objectively measured health variables, the weaker is the independent predictive power of SRH3,4. Therefore
it is plausible that the association between SRH and mortality is not causal but is due to the ability of the self-
assessment to more exhaustively capture the realm of `health` and the objective bodily condition than most
other health i ndicators2,5.
Jylhä (2009) has suggested that when asked to evaluate their general health status, respondents will take into
account any individual relevant information that they think describes their “health”. This information is then
considered in the context of the social and psychological situation. Empirical studies show that individuals
will mainly take into account their medical diagnoses and functional status1, but also experienced symptoms,
medication and other signs of health problems, and particularly in the absence of any evident health problems,
different health-related lifestyles and risk f actors6.
A number of studies have found associations between SRH and biomarker levels (i.e. quantities of biomol-
ecules) in blood, such as white cell count, albumin and haemoglobin3, HDL cholesterol3,7–9, leptin10, TNF-α and
IL-1ra11, CD19+ cells and IgG12, CRP13–15, IL-613,16,17, fasting plasma glucose and glycosylated haemoglobin18
and vitamin D19,20. The findings are fragmented, however, as each study usually addresses only a few indicators.
Furthermore, most samples have been small, and in many cases other health data have been less than optimal.
At least in part, these associations probably reflect the severity and symptoms of chronic diseases. Yet it is pos-
sible to hypothesize that the level of and changes in some biomarkers may, through interoceptive processes, be
associated with sensations and symptoms that individuals take into account in their self-ratings of health. Overall,
little is known about the experiential counterparts of variations in blood biochemistry, although the connections
of fatigue with peripheral inflammation for example, are well d escribed21,22.
In order to understand the potential of SRH as a measure of health in clinical practice and research, it is
important to know how accurately SRH reflects the condition of the human body. In the present explorative study,
we investigated the associations of SRH with a wide array of biomolecule levels measured in blood and urine.
These biomarkers provide more detailed information about the condition of the human body than diagnostic
names alone as they can reflect the stage and severity of current pathologies as well as the physiological processes
taking place in individuals without clinical diagnoses. We hypothesize that the possible association between
SRH and biomarkers is largely, but not entirely, explained by diseases and physical functioning, which at least
to some extent reflects the severity of diseases. We also hypothesize that the association of SRH and mortality is
partly explained by the measured biomarkers. We addressed the following questions: (i) to what extent are the
biomarkers available in the study associated with SRH; (ii) to what extent are the associations between biomarkers
and SRH explained by disease diagnoses and physical functioning; and (iii) do the biomarkers associated with
SRH explain part of the association between SRH and mortality? Analyses i) and iii) were also performed for
individuals without diagnosed diseases. We used three extensive population-based data sets: MARK-AGE, the
Copenhagen Aging and Midlife Biobank (CAMB), and Health 2000, covering a total of approx. 15,000 individu-
als and 150 biomarkers.
Results
Participant characteristics. In MARK-AGE (n = 3,187) 12% rated their health as excellent, 35% as very
good, 41% as good, 11% as fair and 1.4% as poor. In CAMB (n = 5,335) the figures were 9.1%, 41%, 40%, 8.6%
and 1.4%, respectively. In Health 2000 (n = 6,444) 32% rated their health as good, 30% as rather good, 27% as
moderate, 8% as rather poor and 3.5% as poor. Table 1 shows the participants’ characteristics by SRH. In all three
data sets poorer SRH was associated with a higher number of diseases and poorer physical functioning (Table 1;
Chi-square test: p < 0.001).
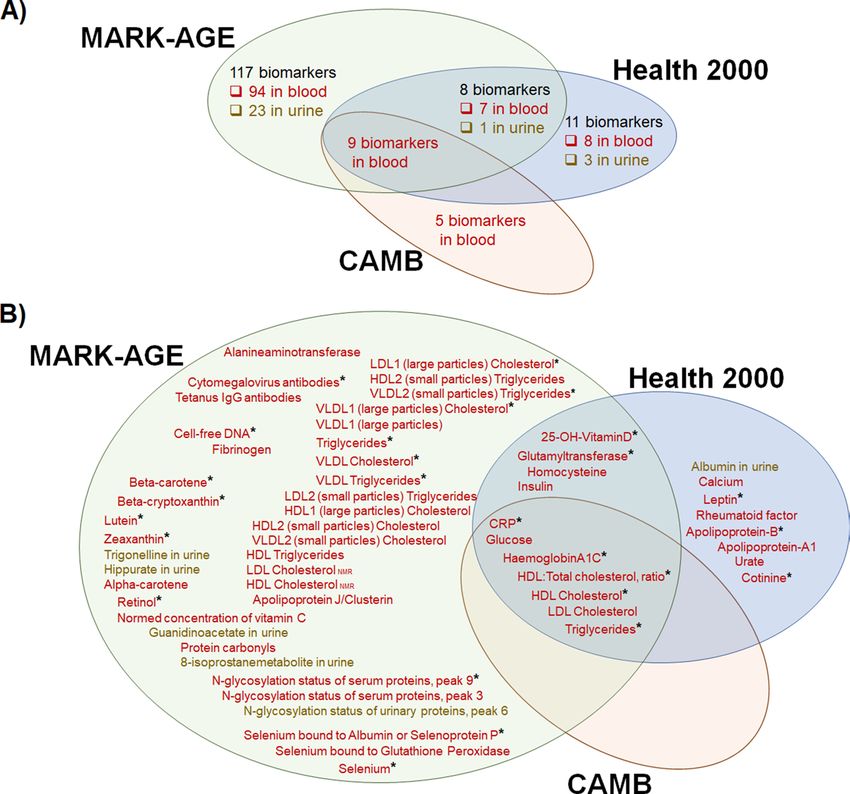
Biomarkers associated with SRH. Out of the 150 biomarkers investigated (Fig. 1A, Supplementary
information 1, Supplementary information 2: Table S1 and S2), 57 were significantly associated with SRH in
linear regression analyses that were adjusted for age and gender (model i). Table 1 shows the means and medians
by SRH for these 57 biomarkers. Eleven of them were available in two or three data sets (Table 2, Supplementary
information 2: Table S1 and S2) and they showed similar directions of associations across the data sets. Of the 57
biomarkers, 46 were available for analysis in one data set only (Table 3, Supplementary information 2: Table S1
and S2).
When additionally adjusted for number of diseases and physical functioning (model ii), 26 biomarkers were
still associated with SRH. Seven of these biomarkers were available in two or three data sets (Table 2) and 19
Scientific Reports | (2021) 11:6139 | https://doi.org/10.1038/s41598-021-85668-7 2
Vol:.(1234567890)www.nature.com/scientificreports/
MARK-AGE CAMB Health 2000
’good’, ’very good’ or ’good’, ’very good’ or ’moderate’, ’rather
Self-rated health ’excellent’ ‘poor’ or ‘fair’ ’excellent’ ‘poor’ or ‘fair’ good’ or ’good’ ‘poor’ or ‘rather poor’
Sample size
% (N) 88 (2798) 12 (389) 90 (4799) 10 (536) 88 (5679) 12 (765)
Age
Min–Max, years 18–92 35–78 48–62 49–62 30–99 30–97
Mean (Median), years 57 (59) 62 (64) 54 (56) 54 (56) 52 (49) 65 (67)
Male
% (N) 88 (1338) 12 (177) 90 (3296) 10 (363) 88 (2554) 12 (349)
Female
% (N) 87 (1460) 13 (212) 90 (1503) 10 (173) 88 (3125) 12 (416)
Number of diseases
No diseases, % (N) 95 (1572) 5 (85) 97 (2418) 3 (81) 97 (2489) 3 (85)
One disease, % (N) 87 (856) 13 (131) 90 (1699) 10 (195) 92 (1777) 8 (163)
Two diseases, % (N) 73 (280) 28 (106) 79 (564) 21 (153) 79 (882) 21 (232)
Three diseases, % (N) 62 (83) 39 (52) 58 (102) 42 (74) 71 (397) 29 (160)
4 + diseases, % (N) 32 (7) 68 (15) 33 (16) 67 (33) 52 (134) 48 (125)
Difficulties in physical functioning, sum of scores
0, % (N) 98 (485) 2 (10) 98 (1386) 2.2 (31) 97 (1766) 3 (64)
1 or 2, % (N) 92 (1584) 8 (137) 93 (2915) 7 (210) 95 (2907) 5 (159)
3 or 4, % (N) 78 (687) 22 (193) 67 (474) 33 (229) 76 (259) 24 (237)
5 or 6, % (N) 46 (42) 54 (49) 27 (24) 73 (66) 46 (259) 54 (305)
Concentration of
biomarker, unit,
Domain mean (median)
Amino acid metabo- Alanine minotrans-
24 (22) 26 (24) – – – –
lism ferase, U/l
Calcium status Calcium, mmol/l – – – – 2.4 (2.4) 2.4 (2.4)
Endocrine function Leptin, ng/l – – – – 17 (11) 22 (15)
Glucose, mmol/l 5.2 (5.1) 5.7 (5.3) 5.5 (5.3) 5.9 (5.4) 5.5 (5.3) 6.0 (5.5)
Glucose metabolism Haemoglobin A1C, % 6.0 (5.9) 6.3 (6.1) 5.3 (5.3) 5.5 (5.5) 5.3 (5.2) 5.7 (5.4)
Insulin, mU/ml 6.1 (5) 8.5 (5.7) – – 9.1 (7.0) 13 (9.0)
CRP, mg/l 2.1 (1.2) 3.4 (1.8) 2.2 (1.1) 3.9 (1.9) 2.0 (0.7) 4.0 (1.4)
CMV antibodies, U/l 39 (22) 53 (37) – – – –
Immune system Tetanus IgG antibod-
3.7 (1.6) 2.6 (0.78) – – – –
ies, IU/ml
Rheumatoid factor,
– – – – 19 (15) 30 (15)
IU/ml
Continued
Scientific Reports | (2021) 11:6139 | https://doi.org/10.1038/s41598-021-85668-7 3
Vol.:(0123456789)www.nature.com/scientificreports/
Concentration of
biomarker, unit,
Domain mean (median)
Apolipoprotein-A1, g/l – – – – 1.6 (1.6) 1.6 (1.5)
Apolipoprotein-B, g/l – – – – 1.2 (1.2) 1.3 (1.3)
Clusterin (ApoJClu;
Apolipoprotein J/
70 (68) 75 (74) – – – –
Clusterin in serum),
µg/ml
HDL:Total cholesterol,
28 (27) 27 (26) 25 (24) 24 (23) 23 (22) 22 (20)
ratio, %
HDL1 (large particles)
30 (27) 29 (26) – – – –
Cholesterol, mg/dl
HDL2 (small particles)
38 (38) 37 (36) – – – –
Cholesterol, mg/dl
HDL2 (small particles)
5.2 (5.0) 5.8 (5.7) – – – –
Triglycerides, mg/dl
HDL Cholesterol,
1.5 (1.5) 1.4 (1.4) 1.5 (1.5) 1.4 (1.3) 1.3 (1.3) 1.3 (1.2)
mol/l ELISA
HDL Cholesterol, mg/
72 (70) 70 (67) – – – –
dl NMR
HDL Triglycerides,
8.0 (7.6) 9.1 (8.9) – – – –
mg/dl
LDL1 (large particles)
59 (58) 50 (50) – – – –
Cholesterol, mg/dl
Lipid metabolism LDL2 (small particles)
7.1 (6.3) 7.9 (6.96) – – – –
Triglycerides, mg/dl
LDL Cholesterol,
3.3 (3.3) 3.2 (3.2) 3.0 (3.0) 2.9 (2.9) 3.7 (3.6) 3.7 (3.7)
mmol/l ELISA
LDL Cholesterol, mg/
130 (130) 120 (120) – – – –
dl MARK-AGE, NMR
Triglycerides, mg/dl
MARK-AGE, NMR
mmol/l 110 (94) 130 (110) 1.8 (1.5) 2.0 (1.8) 1.6 (1.3) 1.9 (1.6)
H2000 & CAMB, ELISA
VLDL1 (large par-
ticles) Cholesterol, 14 (11) 17 (13) – – – –
mg/dl
VLDL1 (large parti-
cles) Triglycerides, 40 (26) 51 (34) – – – –
mg/dl
VLDL2 (small
particles) Cholesterol, 9.8 (9.1) 10.8 (9.9) – – – –
mg/dl
VLDL2 (small par-
ticles) Triglycerides, 12 (11) 14 (12) – – – –
mg/dl
VLDL Cholesterol,
26 (22) 30 (25) – – – –
mg/dl
VLDL Triglycerides,
54 (40) 67 (49) – – – –
mg/dl
8-isoprostane metabo-
Lipid oxidation prod-
lite, in urine, mM/L/ 7.3 (6.7) 8.3 (7.3) – – – –
uct; oxidative stress
mM creatinine
Marker of tissue
Cell-free DNA, µg/ml 0.71 (0.70) 0.74 (0.72) – – – –
damage
Continued
Scientific Reports | (2021) 11:6139 | https://doi.org/10.1038/s41598-021-85668-7 4
Vol:.(1234567890)www.nature.com/scientificreports/
Concentration of
biomarker, unit,
Domain mean (median)
25-OH-VitaminD,
52 (49) 44 (41) – – 45 (43) 42 (41)
nmol/l
Alpha-carotene,
0.19 (0.14) 0.16 (0.11) – – – –
µmol/l
Beta-carotene, µmol/l 0.69 (0.57) 0.50 (0.42) – – – –
Beta-cryptoxanthin,
0.31 (0.22) 0.22 (0.15) – – – –
µmol/l
Hippurate in urine,
15 (12) 13 (10) – – – –
area (a.u.)
Nutrition
Lutein, µmol/l 0.29 (0.27) 0.24 (0.2) – – – –
Normed concentration
of vitamin C, pmol/ 2400 (2100) 2300 (2000) – – – –
µg DNA
Retinol in serum,
1.8 (1.7) 1.7 (1.7) – – – –
µmol/l
Trigonelline in urine,
1.3 (1.0) 1.2 (0.74) – – – –
area (a.u.)
Zeaxanthin, µmol/l 0.048 (0.043) 0.039 (0.033) – – – –
Nutrition (alcohol); Gamma-glutamyl-
21 (14) 28 (16) – – 35 (23) 49 (28)
liver function transferase, U/l
One-carbon
Guanidinoacetate in
metabolism; creatine 10.7 (8.9) 9.4 (7.2) – – – –
urine, area (a.u.)
metabolism
One-carbon metabo-
Homocysteine, µmol/l 15 (14) 16 (15) – – 12 (11) 15 (13)
lism; CV health
Protein carbonyls,
Oxidative stress 0.58 (0.58) 0.59 (0.59) – – – –
nmol/mg
N-glycosylation status
of serum proteins, %, 2.5 (2.4) 2.7 (2.6) – – – –
peak 9
N-glycosylation status
Protein modification of urinary proteins, %, 3.0 (3.0) 3.4 (3.2) – – – –
peak 6
N-glycosylation status
of serum proteins, %, 7.2 (7.0) 6.9 (6.7) – – – –
peak 3
Purine metabolism;
anionic form of uric Urate, µmol/l – – – – 300 (290) 330 (320)
acid
Selenium in plasma,
110 (110) 110 (110) – – – –
ppb
Plasma Selenium
bound to Albumin or 91 (89) 85 (83) – – – –
Selenium metabolism
Selenoprotein P, ppb
Plasma Selenium
bound to Glutathione 23 (22) 23 (22) – – – –
Peroxidase, ppb
Smoking exposure Cotinine, µg/l – – – – 120 (10) 130 (9)
Tissue repair Fibrinogen, mg/ml 3.6 (3.4) 4.0 (3.8) – – – –
Albumin in urine,
Renal function – – – – 14 (3.1) 45 (4.3)
mg/l
Table 1. Participant characteristics by SRH. The 57 biomarkers presented in the table were all
associated with SRH in linear modelling when adjusted for age and gender (model i). a.u. arbitrary unit,
CMV cytomegalovirus, CRP C-reactive protein, CV cardiovascular, ELISA enzyme-linked immunosorbent
assay, HDL high-density lipoprotein, IU international unit, IL interleukin, LDL low-density lipoprotein,
NMR nuclear magnetic resonance, OH hydroxyl, ppb parts per billion, VLDL very low-density lipoprotein.
biomarkers in one data set only (Table 3). A schema of the analysis pipeline and summaries of the findings are
shown in Supplementary information 2 (Figure S1, Table S1 and S2) and Fig. 1B.
As examples of replicated and new findings representing different biological domains, Fig. 2 shows the asso-
ciations of eight selected biomarkers, categorized as quartiles, with SRH. Most of these analyses showed a graded
association of poorer SRH with poorer biomarker levels.
Mortality analysis. In the Health 2000 data the association between SRH and mortality (iii) was analysed
using Cox regression analysis. Out of 5,957 participants with a full set of data for relevant variables, 1,207 (20%)
died between 2000 and 2015. The average survival time for the deceased participants was 8.1 (SD 4.2) years.
Scientific Reports | (2021) 11:6139 | https://doi.org/10.1038/s41598-021-85668-7 5
Vol.:(0123456789)www.nature.com/scientificreports/
Figure 1. A summary of (A) the number of biomarkers in the analysis in the three data sets and (B) biomarkers
associated with SRH, adjusted for age and gender (Model i, in the full samples). Sample types are indicated
with colors: red = blood, yellow = urine, and * symbol indicates that association was significant also after the
adjustment for diseases and physical functioning (Model ii, in the full samples).
A graded relationship was found between SRH and mortality in models adjusting for age and gender, and
then additionally for diseases (Fig. 3). In the third model the analysis was further adjusted for ten biomarkers
that were significantly associated with SRH (model ii, results shown in Tables 2 and 3: leptin, apolipoprotein B,
cotinine, HbA1C, HDL:total cholesterol ratio, HDL cholesterol, triglycerides, 25-hydroxy-vitaminD, gamma-
glutamyltransferase and CRP). The association between SRH and mortality was weakened after the addition of
these biomarkers to the model, but it still remained significant: hazard ratios (95% CIs) 1.1 (0.9, 1.4), 1.3 (1.0,
1.5) and 2.0 (1.6, 2.5), respectively.
Analyses for individuals without diseases. All analyses were also conducted separately for subsamples
of individuals who had no disease diagnoses (MARK-AGE n = 1657, CAMB n = 2499, Health 2000 n = 2574).
Descriptive statistics for these participants are shown in Supplementary information 2: Table S3. In linear regres-
sion models adjusted for age and gender, 8 biomarkers that were available for analysis in two or three data sets
(p < 0.05 in all data sets ) and 8 biomarkers that were available in one data set (Bonferroni-adjusted p value < 0.05)
were significantly associated with SRH (Supplementary information 2: Table S1, S4 and S5). As in the results for
the whole data, CRP, triglycerides and HDL cholesterol showed a significant association in all three data sets,
and vitamin D in the two data sets where it was available. For the biomarkers that in the full data were signifi-
cantly associated with SRH, with only few exceptions, the direction of the associations was the same among the
“healthy” participants, although the associations in the latter group did not always reach statistical significance.
Results for all biomarkers from the analysis in healthy individuals are shown in Supplementary information 3.
For the subsample of individuals without diagnoses (n = 2,408) in the Health 2000 data, the association
between SRH and mortality was analysed using Cox regression analysis. During the 15-year follow-up the
number of deaths was 193 (8%), and average survival time for the deceased participants in this sample was 9.2
(SD 4.0) years. In this subsample SRH was a significant dose-responsive predictor of mortality (Supplementary
information 2: Figure S2). When the biomarkers that showed a significant association with SRH in the full data
analysis (Table 2 and 3, model (ii) were included in the model, and when good SRH was set as the reference
category, hazard ratios (95% CIs) for rather good, moderate and poor SHR were 1.2 (0.9, 1.7), 1.3 (0.9, 1.9) and
2.3 (1.3, 3.8), respectively.
Scientific Reports | (2021) 11:6139 | https://doi.org/10.1038/s41598-021-85668-7 6
Vol:.(1234567890)www.nature.com/scientificreports/
MARK-AGE CAMB Health 2000
+ physical + physical + physical
functioning and functioning and functioning and
number of diseases number of diseases number of diseases
Domain Biomarker βi pi βii pii βi pi βii pii βi pi βii pii
Muscle metabolism; Creatinine − 0.0011 0.24 − 0.0012 0.15 – – – – − 0.00062 0.50 − 0.0016 0.046
renal health Creatinine in urine 0.00091 0.75 0.0030 0.24 – – – – − 0.00079 0.74 0.00084 0.69
Glucose and lipid
Adiponectin − 0.0058 0.012 − 0.0028 0.18 – – – – − 0.0016 0.53 − 0.00050 0.82
metabolism
Insulin 0.014 < 0.001 0.0059 0.003 – – – – 0.0011 0.007 0.00036 0.32
Glucose 0.089 < 0.001 0.043 < 0.001 0.047 < 0.001 0.0092 0.17 0.063 < 0.001 0.015 0.086
Glucose metabolism
Haemoglobin
0.18 < 0.001 0.080 < 0.001 0.21 < 0.001 0.072 < 0.001 0.18 < 0.001 0.075 < 0.001
A1C, %
Iron metabolism Ferritin 0.00025 0.18 0.00010 0.54 – – – – 0.00055 < 0.001 0.00041 < 0.001
HDL:Total cho-
− 0.011 < 0.001 − 0.0080 < 0.001 − 0.0089 < 0.001 − 0.0068 < 0.001 − 0.0098 < 0.001 − 0.0069 < 0.001
lesterol
HDL Cholesterol − 0.33 < 0.001 − 0.16 < 0.001 − 0.27 < 0.001 − 0.16 < 0.001 − 0.24 < 0.001 − 0.10 0.001
Lipid metabolism
Cholesterol, total − 0.074 < 0.001 − 0.015 0.31 − 0.034 < 0.001 − 0.0045 0.60 − 0.015 0.17 0.023 0.018
LDL Cholesterol − 0.062 < 0.001 − 0.010 0.55 − 0.027 0.039 0.0080 0.49 − 0.029 0.014 0.017 0.11
Triglycerides 0.0020 < 0.001 0.0011 < 0.001 0.092 < 0.001 0.044 < 0.001 0.10 < 0.001 0.054 < 0.001
Nutrition; UVB
25-OH-VitaminD − 0.0052 < 0.001 − 0.0040 < 0.001 – – – – − 0.0064 < 0.001 − 0.0026 < 0.001
exposure
Nutrition (alcohol
Glutamyl trans-
problem); liver 0.0022 < 0.001 0.0013 0.009 – – – – 0.0022 < 0.001 0.0016 < 0.001
ferase
function
One-carbon
metabolism; CV Homocysteine 0.0070 0.008 0.0026 0.28 – – – – 0.018 < 0.001 0.0056 0.019
health
Immune system CRP 0.035 < 0.001 0.020 < 0.001 0.028 < 0.001 0.011 < 0.001 0.016 < 0.001 0.0053 0.004
Oxygen transfer Haemoglobin − 0.0052 0.30 − 0.0028 0.52 0.044 0.012 0.014 0.35 0.0011 0.27 0.0018 0.039
Table 2. Associations between biomarkers and SRH in linear regression analysis, adjusted for (i) age and
gender and (ii) additionally for number of diseases and physical functioning. CRP C-reactive protein,
CV cardiovascular, HDL high-density lipoprotein, IU international unit, IL interleukin, LDL low-density
lipoprotein, OH hydroxyl, UVB ultraviolet B light, VLDL very low-density lipoprotein. This table presents
the results for all biomarkers (n = 17) available in two or three data sets (MARK-AGE, CAMB, and/or Health
2000). Criteria for significant association of a biomarker was p < 0.05 in all data sets where it was analysed.
p-values less than 0.05 are shown in bold. Results for all biomarkers are shown in Supplementary information
1.
Discussion
The underlying assumption of this work was that SRH is a more comprehensive and sensitive indicator of
the condition of the human organism than medical diagnoses or measures of physical functioning alone. We
hypothesized that if this was true, SRH should show an association with blood and urine biomarkers that reflect
the physiological regulation of the organism. Therefore, we analysed 150 biomarkers from almost 15,000 par-
ticipants enrolled in three population-based studies. Altogether 57 biomarkers showed a significant association
with SRH, and for 26 of them the association was upheld when the number of chronic diseases and physical
functioning were taken into account. In subsamples of individuals without chronic diseases, 16 biomarkers were
associated with SRH. These associations were almost exclusively in a logical direction, i.e. a “worse” biomarker
level was associated with poorer SRH and vice versa. Moreover, biomarkers weakened the association between
SRH and mortality.
We had no a priori hypothesis as to which biomarkers are important regarding SRH. In this explorative study
we included all blood and urine measures that were available in the study samples. Our results confirm the pre-
vious evidence for most biomarkers that have been reported to be associated with SRH, and they additionally
reveal a large number of new associations. These biomarkers are descriptive of various biological systems of the
human body, including inflammation (e.g. CRP), lipid and glucose metabolisms (e.g. cholesterol and HbA1C),
oxidative stress (e.g. protein carbonyls) and tissue damage (cell-free DNA), as well as of lifestyles and environ-
mental exposures (e.g. carotenoids, vitamin D, cotinine). Many of the biomarkers associated with SRH are also
known to be biomarkers of a geing23.
When selected biomarkers—CRP, HDL cholesterol, HbA1C, 25-hydroxyl-vitamin-D, zeaxanthin, apolipo-
protein-B, cell-free DNA and protein carbonyls—were picked up as examples and examined as quartiles, poorer
biomarker levels were fairly constantly associated with higher odds for poorer SRH in all data sets (Fig. 2).
CRP is a proinflammatory marker and known to be associated with SRH13–15. A few studies have also reported
an association between poorer SRH and lower HDL cholesterol3,7–9 and higher HbA1C18 levels. In our study
lower vitamin D level was associated with poorer SRH in both data sets where it was available, and a similar,
Scientific Reports | (2021) 11:6139 | https://doi.org/10.1038/s41598-021-85668-7 7
Vol.:(0123456789)www.nature.com/scientificreports/
+ physical functioning and
number of diseases
Domain Biomarker Data set βi pi βii pii
Selenium metabolism Selenium MARK-AGE − 0.00564 8.28 × 10⁻¹⁶ − 0.00433 9.24 × 10⁻¹²
Selenium bound to Albumin
Selenium metabolism MARK-AGE − 0.00645 5.84 × 10⁻¹⁶ − 0.00490 1.15 × 10⁻¹¹
or Selenoprotein P
Smoking exposure Cotinine Health 2000 0.000382 7.33 × 10⁻¹⁴ 0.000294 1.41 × 10⁻¹⁰
Nutrition Lutein MARK-AGE − 0.663 2.12 × 10⁻¹² − 0.526 5.88 × 10⁻¹⁰
Nutrition Beta-cryptoxanthin MARK-AGE − 0.421 7.01 × 10⁻¹⁴ − 0.308 1.27 × 10–09
Endocrine function Leptin Health 2000 0.00892 1.82 × 10⁻²⁶ 0.00375 1.11 × 10–06
Nutrition Beta-carotene MARK-AGE − 0.251 2.39 × 10⁻¹⁶ − 0.135 1.20 × 10–06
Lipid metabolism Apolipoprotein-B Health 2000 0.177 4.02 × 10–05 0.180 3.10 × 10–06
VLDL1 (large particles)
Lipid metabolism MARK-AGE 0.0110 1.81 × 10⁻¹² 0.00658 3.44 × 10–06
Cholesterol
Nutrition Zeaxanthin MARK-AGE − 3.42 1.06 × 10⁻¹¹ − 2.06 5.98 × 10–06
Lipid metabolism VLDL Triglycerides MARK-AGE 0.00242 3.65 × 10 –13
0.00132 1.39 × 10–05
VLDL1 (large particles)
Lipid metabolism MARK-AGE 0.00253 1.45 × 10⁻¹² 0.00138 2.15 × 10–05
Triglycerides
Lipid metabolism VLDL Cholesterol MARK-AGE 0.00686 2.93 × 10⁻¹¹ 0.00394 2.47 × 10–05
VLDL2 (small particles)
Lipid metabolism MARK-AGE 0.0229 3.60 × 10⁻¹³ 0.0119 3.58 × 10–05
Triglycerides
N-glycosylation status of
Protein modification MARK-AGE 0.0577 1.26 × 10–05 0.0462 9.70 × 10–05
serum proteins, peak 9
Tissue damage Cell-free DNA MARK-AGE 0.693 2.08 × 10 –07
0.464 9.99 × 10–05
LDL1 (large particles) Cho-
Lipid metabolism MARK-AGE − 0.00515 2.13 × 10⁻¹⁵ − 0.00233 0.000108
lesterol
Nutrition Retinol MARK-AGE − 0.145 8.15 × 10 –05
− 0.126 0.000154
Immune system Cytomegalovirus antibodies MARK-AGE 0.00182 1.05 × 10–07 0.00113 0.000235
Purine metabolism Urate Health 2000 0.00129 5.02 × 10⁻¹⁴ 0.000205 0.190
HDL2 (small particles) Tri-
Lipid metabolism MARK-AGE 0.0570 3.16 × 10⁻¹³ 0.0240 0.000805
glycerides
Lipid metabolism HDL Cholesterol, NMR MARK-AGE − 0.00561 8.12 × 10–09 − 0.00285 0.00125
Nutrition Trigonelline in urine MARK-AGE − 0.0913 8.78 × 10–09 − 0.0469 0.00112
Guanidinoacetate (3–97s) in
Creatine metabolism MARK-AGE − 0.0139 2.39 × 10 –08
− 0.00604 0.00753
urine
Nutrition Hippurate in urine MARK-AGE − 0.00894 2.61 × 10 –08
− 0.00396 0.00663
LDL2 (small particles) Tri-
Lipid metabolism MARK-AGE 0.0229 1.84 × 10 –07
0.0126 0.00148
glycerides
HDL1 (large particles) Cho-
Lipid metabolism MARK-AGE − 0.00592 3.45 × 10–07 − 0.00283 0.00715
lesterol
HDL2 (small particles)
Lipid metabolism MARK-AGE − 0.0129 6.50 × 10–07 − 0.00731 0.00174
Cholesterol
Lipid metabolism LDL Cholesterol, NMR MARK-AGE − 0.00243 2.26 × 10–06 − 0.000635 0.176
Transporter protein Albumin in urine Health 2000 0.000491 5.83 × 10–06 0.0000643 0.512
Immune system Tetanus IgG antibodies MARK-AGE − 0.0132 6.35 × 10–06 − 0.00871 0.000904
VLDL2 (small particles)
Lipid metabolism MARK-AGE 0.0171 6.59 × 10–06 0.0103 0.00254
Cholesterol
Aminoacid metabolism Alanineaminotransferase MARK-AGE 0.00685 7.76 × 10 –06
0.00337 0.0149
Calcium status Calcium Health2000 0.652 1.21 × 10–05 0.210 0.118
Lipid metabolism HDL Triglycerides MARK-AGE 0.0169 1.32 × 10–05 0.00684 0.0504
N-glycosylation status of
Protein modification MARK-AGE − 0.0424 2.35 × 10–05 − 0.0261 0.0039
serum proteins, peak 3
Oxidative stress Proteincarbonyls MARK-AGE 0.704 2.94 × 10–05 0.537 0.0004
Nutrition Alpha-carotene MARK-AGE − 0.333 3.03 × 10–05 − 0.0743 0.304
Tissue repair and revasculari-
Fibrinogen MARK-AGE 0.0469 3.86 × 10–05 0.0256 0.0125
zation
Selenium bound to Glu-
Selenium metabolism MARK-AGE − 0.0117 4.82 × 10–05 − 0.00891 0.000565
tathione Peroxidase
Lipid metabolism Apolipoprotein-A1 Health 2000 − 0.177 4.90 × 10 –05
− 0.0469 0.231
N-glycosylation status of
Protein modification MARK-AGE 0.0343 8.28 × 10 –05
0.0254 0.00119
urinary proteins, peak 6
Lipid metabolism Apolipoprotein J/Clusterin MARK-AGE 0.00310 9.39 × 10 –05
0.00159 0.0264
8-isoprostanemetabolite, in
Lipid oxidation product MARK-AGE 0.0184 0.000104 0.00804 0.0600
urine
Continued
Scientific Reports | (2021) 11:6139 | https://doi.org/10.1038/s41598-021-85668-7 8
Vol:.(1234567890)www.nature.com/scientificreports/
+ physical functioning and
number of diseases
Domain Biomarker Data set βi pi βii pii
Immune system Rheumatoid factor Health 2000 0.000820 0.000126 0.000447 0.0200
Normed concentration of
Nutrition MARK-AGE − 0.0000410 0.000169 − 0.0000231 0.0183
vitamin C
Table 3. Associations between biomarkers and SRH in linear regression analysis, adjusted for (i) age and
gender and (ii) additionally for number of diseases and physical functioning. CRP C-reactive protein, HDL
high-density lipoprotein, LDL low-density lipoprotein, NMR nuclear magnetic resonance, VLDL very low-
density lipoprotein. The Table shows 46 biomarkers that were available for analysis in one data set only and
were associated with SRH in Model (i). 19 of them were associated with SRH also in Model (ii). The results
for all biomarkers are shown in Supplementary information 1. Statistical significance level was at Bonferroni-
adjusted p value of 0.05, and p values below this threshold are shown in bold.
Figure 2. Associations of the eight selected biomarkers, categorized as quartiles, with poor self-rated health.
Odds ratios (ORs) and 95% confidence intervals (CIs) are from the logistic regression models, adjusted for
age and gender. The “best” biomarker quartile was used as reference category. (A–H): C-reactive protein
(CRP), high-density lipoprotein (HDL) cholesterol, haemoglobin A1C (HBA1C), 25-hydroxyl-vitamin-D
(25-OH-vitaminD), zeaxanthin, apolipoprotein-B (Apo-B), cell-free DNA (cf-DNA) and protein carbonyls,
respectively. The biomarkers were selected as examples of replicated and new associations representing different
biological domains.
Figure 3. Association of self-rated health with mortality in the Health 2000 data (n = 5,957; deceased n = 1,207;
15-year follow-up). In Cox proportional hazards models (iii) hazard ratios (HRs) and 95% CIs were adjusted for
(1) age and gender; (2) then additionally for number of diseases; and then (3) additionally for 10 biomarkers.
strong association was also seen among individuals without chronic conditions. Previous studies with smaller
Scientific Reports | (2021) 11:6139 | https://doi.org/10.1038/s41598-021-85668-7 9
Vol.:(0123456789)www.nature.com/scientificreports/
samples have likewise shown an association between vitamin D and SRH19,20. Recent studies have connected
low vitamin D concentration with multiple extra-skeletal processes such as cancer progression, coronary heart
disease, depression and a range of immune f unctions24–26. The mechanisms of these associations are not well
known, but it has been suggested that low vitamin D level should be understood as a marker of ill health rather
than a causal f actor27,28.
This is the first study to report associations between SRH and e.g. zeaxanthin, apolipoprotein-B, cell-free
DNA and protein carbonyls. Zeaxanthin is a carotenoid pigment present in the eye and obtained from the diet
(e.g. egg yolk and orange peppers)29. It has antioxidative properties and is suggested to have a protective role
against eye diseases (especially age-related macular degeneration) as well as cardiovascular diseases and cancer30.
Apolipoprotein B is mostly known as the LDL carrier protein, and it is an important contributor to atheroscle-
rosis and cardiovascular disease31. Circulating cell-free DNA is a marker of cellular death and tissue damage
in many acute and chronic conditions (e.g. sepsis, trauma, aseptic inflammation, cardiovascular diseases and
cancer)32–37. Elevated levels of protein carbonyls (i.e. plasma protein oxidation levels) are a marker of oxidative
stress and observed in various pathologies such as Alzheimer’s disease, rheumatoid arthritis, diabetes, sepsis,
renal dysfunction and respiratory f ailure38.
We suggest that there are three main pathways through which biomarkers measured in blood or urine can
affect SRH. First, several biomarkers are characteristics of clinical diagnoses. For certain biomarkers such as
cholesterol or glucose levels the role is well-known as is their significance as risk factors of disease. Individuals
who are asked to rate their own health may be inclined to interpret high values (if they know them) as signs of
poorer health. Yet respondents may not necessarily consider their biomarker levels or even be aware of them
when asked to assess their health, but instead consider their disease diagnoses, symptoms or decreased physical
functioning caused by their diseases. In this case the association between biomarkers and SRH is indirect and
mediated by the association of SRH with diseases known to the respondents. This hypothesis for disease pathway
is supported by the finding that associations between biomarkers and SRH were more marked among individuals
with disease than those without.
Second, it is known that particularly individuals without major health problems take account of health-related
lifestyles and behavioural risk factors as components of SRH6,39. In the present study better SRH was associated
with higher levels of carotenoids (zeaxanthin, beta-carotene, lutein, beta-cryptoxanthin and beta-carotene) in
plasma, and hippurate and trigonelline in urine. These molecules serve as markers of fruit and vegetable intake.
Worse SRH was associated with higher cotinine and gamma-glutamyltransferase levels, which serve as markers
for smoking exposure and alcohol consumption, respectively. Again it is plausible that the route from biomarkers
to SRH is indirect, i.e. that respondents assess their health as good or poor not on the basis of their biomarker
levels but rather particular health-related lifestyles that are considered healthy or unhealthy.
Third, an interesting but poorly understood mechanism is the possibility that a biomarker level or change
in biomarker level in the body might stimulate physical sensations, and that these sensations are interpreted as
information about the state of one’s health. This is not a novel hypothesis but was suggested by Stenback as early
as 1964 and later by Kaplan and Camacho in 1983 as one potential explanation for the association between SRH
and mortality40,41. Since these studies, research has continued to accumulate about the interoceptive processes
through which information on internal states of the body is communicated to the brain to enable the regula-
tion of vital inner processes and the maintenance of physiological stability21,42–44.Most of the research data on
interoceptive signalling of humoral processes, i.e. changes in blood substance levels, concerns inflammation:
higher circulating levels of inflammatory biomarkers, cytokines, are known to underlie symptoms such as fatigue,
general malaise, poor appetite and low mood21,22, and they are known to be associated with poor SRH45,46. In our
study, higher levels of inflammatory markers such as CRP and IL-18 showed associations with poor SRH, and
for CRP this was true in all three data sets independently of diseases and physical functioning. Yet the empirical
evidence on interoceptive signalling of humoral processes remains haphazard and for other blood-measured
substances than inflammatory markers almost non-existent.
In our study, as in many previous ones, SRH showed a strong, robust association with mortality. Poorer SRH
predicted mortality even after adjusting for chronic conditions in the total sample and in the subsample without
chronic conditions. Adjusting for biomarkers weakened this association in both situations, which supports our
initial hypothesis.
We were able to utilize three large population-based data sets from multiple European countries, but, unfor-
tunately, not all biomarkers were available in more than one data set, which would allowed the principles of
conventional replication studies. For some of the biomarkers investigated the association with SRH had already
been reported earlier. The strengths of our study included the fact that we had access to a large number of new
biomarkers; that several of them were available in more than one data set; that we had access to data on chronic
conditions and physical functioning; and that in one sample it was also possible to investigate mortality. Multi-
morbidity indicated by the number of disease diagnoses is an effective descriptive of health and has prognostic
value47–49. In our analysis, the six clinical diagnoses available for analysis in the three study samples were com-
mon and chronic. However, several important diagnostic categories were absent from our analysis, and we had
no information on disease severity other than physical functioning. Therefore, the data available was not ideal
to adjust for disease. These are the major limitations of the study. In our exploratory analyses, linear regression
models were used to provide an easily understandable overview on the associations of SRH, basically an ordi-
nal variable, with biomarkers; this approach is consistent with several earlier studies, and based on observed
continuity in its association with many other health variables. Further, because of the explorative approach, we
decided not to construct organ-specific or cluster-based groupings of the biomarkers, and as the role of individual
biomarkers in connection to SRH is not known, we decided to include all available measures in our analyses
without selection. The mechanisms linking biomarkers with SRH were also beyond the scope of this study.
Further studies are needed to shed light on the full pathways between SRH and the biological state of the body.
Scientific Reports | (2021) 11:6139 | https://doi.org/10.1038/s41598-021-85668-7 10
Vol:.(1234567890)www.nature.com/scientificreports/
In conclusion, our study demonstrated strong and logical associations of SRH with numerous biomarkers
measured in blood and urine, even independently of chronic diseases and functional status. Poorer SRH was
associated with worse biomarker levels and vice versa. These biomarkers were descriptive of many different organ
systems and bodily processes. The findings suggest that SRH has a solid biological basis. Our results also lend
support to the notion that SRH is a robust, comprehensive but non-specific indicator that can more exhaustively
capture health-related processes than many conventional measures of health and disease. To verify the potential
of SRH in research and in clinical practice, multidisciplinary research is needed to explore the mechanisms that
convey messages from body biology to individuals’ subjective assessments.
Methods
Study populations. In MARK-AGE, questionnaires and interviews were conducted and biological data
collected between 2008 and 2012 at the following recruiting centres: Hall in Tyrol/Innsbruck (Austria), Namur
(Belgium), Esslingen (Germany), Athens and surrounding regions (Greece), Bologna (Italy), Warsaw (Poland),
Tampere (Finland) and Leiden (The Netherlands)50,51. The total number of participants in this analysis was 3,187
(age range 18–92 years).
CAMB collected questionnaire data and biological samples from 5,335 participants (age range 48–62 years)
in 2009–2011. This data set comprises participants from three cohort studies: the Metropolit 1953 Danish Male
Birth Cohort (MP), the Copenhagen Perinatal Cohort (CPC) born in 1959–1961, and the Danish Longitudinal
Study on Work, Unemployment and Health (DALWUH) born in 1949 or 1 95952.
Health 2000 is a nationwide survey conducted in 2000–2001 with a randomly selected sample (n = 8,028) of
the Finnish population aged 30 years or over53. For this analysis we used a subsample of 6,444 participants (age
range 30– 99 years) with relevant information.
No human participants were directly involved in the current study and only data was taken for the current
study.
Measures. SRH was assessed in interviews and questionnaires. In MARK-AGE and CAMB, SRH was
inquired by asking: “In general, would you say your health is…?”; and in Health 2000 by asking: “Is your pre-
sent state of health…?”. The response options were “poor”, “fair”, “good”, “very good” or “excellent” (CAMB and
MARK-AGE) and “poor”, “rather poor”, “moderate”, “rather good” or “good” (Health 2000). In linear regression
models, SRH was used as a continuous variable ranging from 0 to 4, with a higher value referring to poorer SRH.
For the other analyses, the two poorest SRH categories (poor & fair in MARK-AGE and CAMB; poor & rather
poor in Health 2000) were combined into one. Then, as an outcome in logistic regression analyses (in Fig. 2),
SRH was dichotomized as poor versus all other categories. In mortality analysis (Health 2000) SRH was grouped
into four categories: (1) good, (2) rather good, (3) moderate and (4) poor.
A total of 150 biomarkers measured in blood and urine were available for analysis (full list shown in Supple-
mentary information 1): 134 biomarkers in MARK-AGE, 14 in CAMB, and 28 in Health 2000. All measurements
were carried out in accordance with relevant guidelines and regulations. Altogether 17 biomarkers were available
in two or three of the study populations. A few biomarkers were measured with two different but equivalent
measurements. The proportion of missing biomarker data ranged from 0.05 to 25%. A few biomarkers represent-
ing different biological domains were selected for inclusion in Fig. 2 as examples of previously shown and new
associations with SRH. For this illustration, biomarker levels were categorized as quartiles.
The indicator of physical functioning came from interviews, questionnaires and hand grip strength meas-
urements. A summary variable for physical functioning was constructed out of three components: (1) ability to
walk 0.5 mile (in MARK-AGE), 0.25 mile (in CAMB) or 0.5 km (in Health 2000); (2) ability to run 100 m (in
CAMB and Health 2000) or do vigorous activities such as running, lifting heavy objects, participating in strenu-
ous sports (in MARK-AGE); and (3) hand grip strength (MARK-AGE, CAMB, Health 2000). In each of these
three components, more points corresponded to poorer functioning. The components of walking and running &
vigorous activities were scored as 0 = no limitations, 1 = moderate limitations and 2 = highly limited or cannot do
at all. Hand grip strength was grouped in tertiles (categories 0, 1 and 2). The scores from the three components
were added together to obtain a sum score of physical functioning, ranging from 0 to 6.
Disease diagnoses, including cardiovascular diseases, hypertension, diabetes, cancer/tumour, respiratory
diseases and arthritis were obtained from interview and questionnaire data. The variable “number of diseases”
ranged from 0 to 6 diseases, but in the final analyses it was categorized as 0, 1, 2, 3 or 4 + diseases. In addition,
subsamples with participants without any of the above mentioned diagnoses were extracted in each data set
(MARK-AGE n = 1,657; CAMB n = 2,499; Health 2000 n = 2574; characteristics in Supplementary information
2: Table S3).
Mortality data were only available for the Health 2000 sample. Dates of death were drawn from the National
Register on Causes of Death maintained by Statistics Finland, and the length of follow-up was 15 years.
Statistical analysis. The association between each individual biomarker and SRH was first explored using
linear regression analysis in the three independent cross-sectional data sets (MARK-AGE, CAMB and Health
2000). SRH was the dependent variable, and the models were adjusted for (i) age as a continuous variable and
gender, and (ii) additionally for the number of diseases and physical functioning. All MARK-AGE analyses were
adjusted for recruitment centre. The nominal p-value threshold was set at 0.05 for biomarkers that were available
in two or three data sets (specifically, it was required that the p-value threshold had to be met in all data sets),
and, to control the multiple testing problem, at Bonferroni-adjusted p-value of 0.05 for biomarkers that were
available in one data set only. Additionally, logistic regression models were used to analyse the associations of
Scientific Reports | (2021) 11:6139 | https://doi.org/10.1038/s41598-021-85668-7 11
Vol.:(0123456789)www.nature.com/scientificreports/
eight selected biomarkers, categorized as quartiles, with poor SRH, adjusted for age and gender. The results of
the eight selected biomarkers were visualized as forest plots (Fig. 2).
Next, the association of SRH with all-cause mortality in the Health 2000 data set was analysed using Cox
proportional hazard modelling (iii). 1) The model was adjusted for (1) age and gender; (2) additionally for
number of diseases; and (3) furthermore additionally for the biomarkers that were associated with SRH in the
linear regression analysis (Model ii). The nominal p-value threshold was set at 0.05. These results were visual-
ized as forest plot (Fig. 3).
Finally, we repeated the analyses of the associations between SRH and the biomarkers in all three data sets
and the mortality analysis in the Health 2000 data in subsamples without disease diagnoses. The criteria for
statistical significance were the same as in the main analysis.
The data was processed, analysed and visualized using R software (R 3.4.0) and IBM SPSS software version
24.0 (IBM Corp., Armonk, New York, USA). In each model, participants with missing data for a biomarker,
mortality, age, gender, SRH, physical functioning or number of diseases were excluded from the analyses.
Ethics approval. Human participants were not directly involved in the current study and only existing data
was taken for the current analysis. The study was conducted in accordance with the Declaration of Helsinki
ethical principles and all research participants gave their informed consent to be part of the study. The studies
(MARK-AGE, CAMB, Health 2000) were approved by the local ethics committees51–53.
Data availability
The data used in the current study are not publicly available for ethical reasons. However, data are available upon
request from the Health 2000 survey, MARK-AGE and CAMB for researchers who meet the criteria for access
to confidential data. Data from the MARK-AGE study are available from the MARK-AGE steering commit-
tee (contact: Alexander Bürkle, alexander.buerkle@uni-konstanz.de). Data from CAMB are available from the
Copenhagen Aging and Midlife Biobank steering committee (https://camb.ku.dk/, contact: Rikke Lund, rilu@
sund.ku.dk). Health 2000 data are available from THL on request, subject to the submission of approved study
proposals and a data transfer agreement (contact: terveys-2000-2011@thl.fi).
Received: 9 February 2020; Accepted: 1 March 2021
References
1. Jylhä, M. What is self-rated health and why does it predict mortality? Towards a unified conceptual model. Soc. Sci. Med. 69,
307–316 (2009).
2. Idler, E. & Benyamini, Y. Self-rated health and mortality: a review of twenty-seven community studies. J. Health Soc. Behav. 38,
21–37 (1997).
3. Jylhä, M., Volpato, S. & Guralnik, J. M. Self-rated health showed a graded association with frequently used biomarkers in a large
population sample. J. Clin. Epidemiol. 59, 465–471 (2006).
4. Fried, L. P. et al. Risk factors for 5-year mortality in older adults: the cardiovascular health study. JAMA 279, 585–592 (1998).
5. Mackenbach, J. P., Simon, J. G., Looman, C. W. & Joung, I. M. Self-assessed health and mortality: could psychosocial factors explain
the association?. Int. J. Epidemiol. 31, 1162–1168 (2002).
6. Chen, H., Cohen, P. & Kasen, S. Cohort differences in self-rated health: evidence from a three-decade, community-based, longi-
tudinal study of women. Am. J. Epidemiol. 166, 439–446 (2007).
7. Park, S., Ahn, J. & Lee, B. K. Self-rated subjective health status is strongly associated with sociodemographic factors, lifestyle, nutri-
ent intakes, and biochemical indices, but not smoking status: KNHANES 2007–2012. J. Korean Med. Sci. 30, 1279–1287 (2015).
8. Shirom, A., Toker, S., Melamed, S. & Shapira, I. The relationships between self-rated health and serum lipids across time. Int. J.
Behav. Med. 19, 73–81 (2012).
9. Tomten, S. E. & Hostmark, A. T. Self-rated health showed a consistent association with serum HDL-cholesterol in the cross-
sectional Oslo Health Study. Int. J. Med. Sci. 4, 278–287 (2007).
10. Nixon Andreasson, A. et al. Associations between leptin and self-rated health in men and women. Gend. Med. 7, 261–269 (2010).
11. Unden, A. et al. Inflammatory cytokines, behaviour and age as determinants of self-rated health in women. Clin. Sci. 112, 363
(2007).
12. Nakata, A., Takahashi, M., Otsuka, Y. & Swanson, N. G. Is self-rated health associated with blood immune markers in healthy
individuals?. Int. J. Behav. Med. 17, 234–242 (2010).
13. Christian, L. M. et al. Poorer self-rated health is associated with elevated inflammatory markers among older adults. Psychoneu-
roendocrinology 36, 1495–1504 (2011).
14. Tanno, K. et al. Poor self-rated health is significantly associated with elevated C-reactive protein levels in women, but not in men,
in the Japanese general population. J. Psychosom. Res. 73, 225–231 (2012).
15. Leshem-Rubinow, E. et al. Self-rated health is associated with elevated C-reactive protein even among apparently healthy individu-
als. Isr. Med. Assoc. J. 17, 213–218 (2015).
16. Andreasson, A. N. et al. Inflammation and positive affect are associated with subjective health in women of the general population.
J. Health. Psychol. 18, 311–320 (2013).
17. Arnberg, F. K., Lekander, M., Morey, J. N. & Segerstrom, S. C. Self-rated health and interleukin-6: longitudinal relationships in
older adults. Brain Behav. Immun. 54, 226–232 (2016).
18. Jarczok, M. N. et al. Investigating the associations of self-rated health: heart rate variability is more strongly associated than inflam-
matory and other frequently used biomarkers in a cross sectional occupational sample. PLoS ONE 10, e0117196 (2015).
19. Rafiq, R. et al. Associations of serum 25-hydroxyvitamin D concentrations with quality of life and self-rated health in an older
population. J. Clin. Endocrinol. Metab. 99, 3136–3143 (2014).
20. Tepper, S. et al. Vitamin D status and quality of life in healthy male high-tech employees. Nutrients 8, 366. https://doi.org/10.3390/
nu8060366 (2016).
21. Quadt, L., Critchley, H. D. & Garfinkel, S. N. The neurobiology of interoception in health and disease. Ann. N. Y. Acad. Sci. 1428,
112–128 (2018).
22. Dantzer, R., O’Connor, J. C., Freund, G. G., Johnson, R. W. & Kelley, K. W. From inflammation to sickness and depression: when
the immune system subjugates the brain. Nat. Rev. Neurosci. 9, 46–56 (2008).
Scientific Reports | (2021) 11:6139 | https://doi.org/10.1038/s41598-021-85668-7 12
Vol:.(1234567890)You can also read


