COUNTRY HEALTH SYSTEMS SURVEILLENCE (CHESS) A BRIEF ASSESSMENT IN BURKINA FASO - WORLD HEALTH ORGANIZATION
←
→
Page content transcription
If your browser does not render page correctly, please read the page content below
Country Health Systems Surveillence (CHeSS)
a brief assessment in Burkina Faso
Population: 14.0, 3.1% growth rate (2006 census)
Percent urban: 23%
Number of administrative areas: 13 regions, 45 provinces, 63 health districts, 300+ departments,
and about 9000 villages
Background
The scale‐up for better health is unprecedented in both potential resources and the number of
initiatives involved. Such a grand experiment requires a harmonized monitoring and evaluation
effort that reinforces both country and global needs to demonstrate results, secure future
funding, and enhance the evidence base for intervention. Eventually, the scale‐up efforts will be
judged by country progress towards the health‐related MDGs, the degree to which major health
constraints in countries have been addressed, and adherence to the Paris Declaration on Aid
Effectiveness.
A common framework for monitoring performance and evaluation of the scale‐up for better
health aims to ensure that the demand for accountability and results from single donors and
joint initiatives is translated into well‐coordinated efforts to monitor performance and evaluate
progress in countries. It translates the tenets of the Paris declaration to a common
accountability and results framework. It stresses the importance of working in ways that
contribute to strengthening country organizational capacity and health information systems, as
well as enabling evidence‐informed decision making and improved country performance. The
global framework with its M&E implications and the six principles are shown in Annex A.
The global framework needs to be made operational at the country level. The Country Health
Systems Surveillance platform (CHeSS) aims to improve the availability, quality and use of the
data needed to inform country health sector reviews and planning processes, and to monitor
health‐system performance.1 There are three dimensions to this process to strengthen the
monitoring and evaluation component of the country compact:
Demand and use of information: improve the use of evidence in decision‐making processes,
focusing on country plans
Supply of data and statistics: increase availability and quality of data used for decision
making
Enhance institutional capacity: support country capacity for assessment and monitoring of
health systems and their performance
The accountability and results framework aims to identify a minimum set of indicators with
clear‐cut measurement strategies. These indicators will be the basis for regular reporting of
reliable results to assess progress against targets and performance within and between
countries. The framework, indicators and measurement strategies should cover specific
(disease) programmes and health systems strengthening in general, as well as form a basis for
global reporting. This should be supported by global efforts to minimize reporting requirements
for countries.
1
Country Health Systems Surveillance. Report of a meeting in Bellagio, October 2008. WHO and Rockefeller
Foundation.
1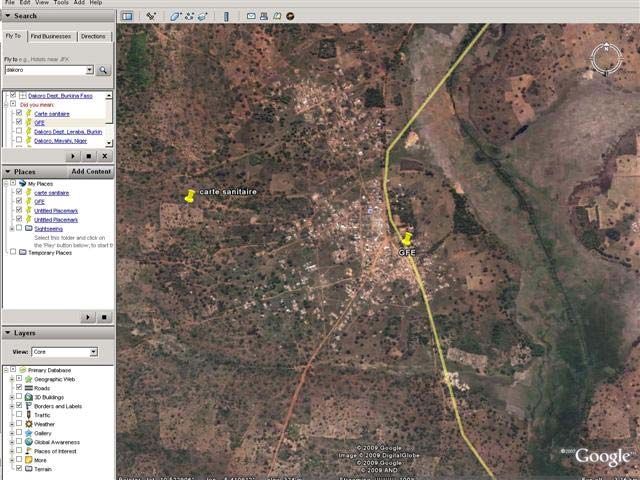
1. Country review processes

Review of Burkina Faso's second Poverty Reduction Strategy Paper (PRSP‐2), finalized in 2004, is
leading the way for the first Annual Sector Review (ASR) to take place in 2010. The PRSP‐2 (Box
8) includes a critical health component insofar as specific MDG targets are defined; the IDA and
IMF Joint Staff Advisory Note (2005) estimates that MDG targets related to poverty and
nutrition could be met, but those related to education, reproductive health, and gender need
enabling policies and programs to bring them into reach. Indeed, several key documents
concerning health have been produced and review committees have been established to
prepare for the ASR. Key sectoral partners included WHO, UNICEF, EU, Belgium, the Global Fund,
BAD, BID and others.

The National Development Plan for Health, the PNDS 2001‐2010, was developed to
operationalize the National Health Policy. The development of the PNDS was followed up by a
Triennial Plan 2001‐2003 to operationalize implementation in 2003‐2005. The 2006‐2010 Plan,
like the first five year period, aims to reduce mortality and morbidity and to improve the
intermediary objectives necessary for these reductions.

The 2006‐2010 Plan was developed in technical committees consisting of members from the
Ministry of Health, regional and district health authorities, and technical and financial partners.
The Plan takes into account the National Health Policy, the PNDS, the PRSP, the MDG, reports
from monitoring committees reporting on PNDS implementation, and the PNDS Evaluation 'Mi‐
parcours'.

The 2006‐2010 Plan is based on 'rapid results intervention packages' where the focus is on a set
of financing interventions and monitoring of related indicators that are expected to have an
impact on HIV/AIDS, malaria, maternal and child health, and nutrition.

In 2003, two technical entities were created to oversee the implementation of the PNDS, the
multisectoral Comité de suivi and the Technical secretariat. The Comité de suivi has six thematic
sub‐committees that were formed to provide regular oversight of the PNDS implementation,
including: 1. Human resources, 2. Decentralization, 3. Institutional strengthening of MOH, 4.
Private sector, 5. Sectoral approach and health financing, and 6. Indicators. (An observation was
made by one partner, however, that the sub‐committees do not function as expected for the
PNDS review and they should be made to function more effectively for the Annual Sector
Review.) It was further envisioned to create an external committee to evaluate the PNSD 2001‐
2010 prior to the development of the PNSD 2011‐2020.

Quarterly Progress reports are produced with input from the Direction régionales de la santé
(DRS), the Centres hospitaliers régionaux et universitaires (CHR/CHU) and the Districts sanitaires
(DS). Based on the Progress reports, the Technical secretariat produces a Synthesis report,
which contributes to decisions taken on actions to strengthen districts to accomplish their
annual action plans. The indicators monitored in these progress reports were revised in 2003
and 2005, and again reviewed for the PNDS 2006‐2010. A workshop was held in July 2008 to
obtain an updated list of indicators for the progress reports, and to reach consensus on which
indicators will be regularly tracked.

The Health Metrics Network conducted an assessment in 2008 which highlights the strengths
and weaknesses of the national health information system, in particular as regards Resources
and indicators, Information products including data quality, Dissemination and use of

                                                                                                 2
information, and Synthesis of information. The assessment findings and recommendations will
be taken forward at a multi‐country workshop in Dakar, April 2009.
A mission in March 2009 was made by a University of Oslo team to introduce the DHIS M&E
system. A three day workshop to discuss a data warehouse has been tentatively scheduled, but
the final date is still pending the availability of the MOH M&E unit. Phase one of data archiving
work was initiated in 2008, by the Accelerated Data Programme (ADP) team based at OECD, to
assist the Institut National de la Statistique with establishing a searchable survey catalogue of
micro and meta data. Follow‐up work is planned to hold a DDI production workshop and to
install the open‐source National Data Archive (NADA) application. For a description of the
project and a list of surveys to be archived, see the Burkina Faso INSD/OECD report (January
2009).
Burkina Faso is not currently an IHP+ Compact signatory. Although there have been high level
discussions regarding signing a compact, Burkina Faso has taken the decision to not sign (which
would entail developing and finalizing a compact draft, validating it by a country team at
national level, organizing a high‐level round table, and signing and implementing the Compact).
Rather, the Burkina delegation to the IHP+ meeting in Lusaka (March 2008) recommends further
reflection and observation of other signatory countries to determine the value‐added in signing
the Compact.
Financing of the Annual Health Sector Review is ensured by the State budget. The Programme
d'appuis au développement sanitaire (PADS) is the common funding modality that was created
in 2002 to ensure that districts receive necessary funding. Partners contributing to this fund
include the Netherlands, Sweden, France, UNFPA, UNICEF, and others. The WHO is not yet
contributing but discussions are underway. The fact that WHO contributions for technical
assistance, for example, must go through the Ministry of Finance, presently creates a
tremendous delay and road block for tapping into their technical assistance resources‐‐ requests
for TA may take 1‐2 years to pass through the Ministry of Finance. The World Bank does not
accept such joint funding arrangements so is not a contributor. Donors that invest in
infrastructure (e.g., Taiwanese, ADB, Islamic Foundation) also are not contributing to PADS.
Overall, the PADS has significantly reduced the number of funding sources and resulted in
common planning and procurement mechanisms, but unfortunately some contributors continue
to earmark their funds for certain activities or geographical areas. The funding of districts plans
are based on 'rapid results intervention packages' for MDGs 1, 4, 5, and 6 and categorized into
intermediate objectives by theme area (see below). The resulting 200+ district activity budget
lines are then funded by the national budget and partner commitments.
2. Monitoring & Evaluation
The MOH/DEP has finalized the final list of intermediary indicators and quarterly district
progress indicators to be monitored. There are total of 42 indicators to be monitored in the
PNDS to track intermediary progress, including 19 input/process indicators, 18 outcome
indicators, and 7 impact indicators. Indicators are reported and tracked annually, except 6
which are tracked bi‐annually, and 5 impact indicators that are reported every five years (Annex
B).
Intermediary indicators are divided into major thematic areas:
I. Increase health coverage (1‐5) (input/process indicators)
II. Improve service quality and utilization (6‐12) (3 outcome and 4 input/process)
3III. Strengthen the fight against infectious and non‐infectious diseases (13‐24) (11 outcome and
1 impact)
IV. Reduce HIV transmission (25‐26a/26b) (outcome/impact)
V. Develop human resources (27‐28) (input/process)
VI. Reduce HIV transmission (29‐31) (input/process)
VII. Increase financial resources for the health sector (32‐35) (input/process)
VIII. Strengthen institutional capacity of the MOH (36‐37) (1 input/process and 1 outcome)
IX. Impact indicators (38‐42) (impact)
District progress report indicators. There are, in addition, 92 indicators to measure in the
quarterly Progress reports at district level, categorized into 10 major sub‐areas:
1. Coordination (1‐4)
2. Community participation (5‐7)
3. Support to Health centers (8‐15)
4. Supervision (16‐21)
5. Health Information System (22‐30)
6. 'Contrôle' (31‐32)
7. Availability of MEG (33‐36)
8. Curative, preventive and promotional health care (37‐68, including curative, vaccination,
antenatal and delivery care, infant health and family planning.
9. Complete package of activities (69‐84, including consultations, surgery and hospitalization)
10. Implementation of district plan (85‐92)
The Canevas et guide (Jan. 2009) provides a list of the 45 essential medicines (Annex 1), as well
as the 20 tracer generic medicines (Annex 2). An example of the quarterly report form is
provided in Annex 3, it is seven pages long.
3. Data sources
Over the past decade, data for population based indicators were collected by the INSD through
national surveys and the national population census. Indicators calculated from routine data
have been reported by the MOH/DEP. Note that a detailed assessment of the quality of these is
presented in the Health Metrics Network assessment report (2008).
Population Census.
The INSD conducted a population census was conducted in 1996, and again in 2006.
Preliminary results are available for 2006.
Health Management Information System (HMIS).
Patient registration and reporting of health service provision scored very high in the
HMN self‐assessment. The MOH health information division has developed an MS‐Access
database called RASI (Rapports Activité de Santé Informatisé) which is implemented in all
districts since 2006. RASI furthermore constitutes a database of health facilities, with a unique
code, but is not necessarily up to date to include all public and private facilities. There is also a
Système d'information de Gestion d'indicateurs de Santé (SIGIS), also a MS‐Access database,
which is considered more up to date than RASI. See Annex E for detailed information on the
2006 Carte Sanitaire, using HMIS data.
Population based surveys.
A schedule for national survey to be conducted in the coming decade was not available.
4‐ 4 Demographic and Health Surveys (DHS) have been conducted: 2009 DHS will be conducted in
the summer, with HIV and parasitemia testing, also 2003 DHS, 1998/1999 DHS, 1992/1993 DHS
‐ Multiple Indicator Cluster Survey (MICS) 1996
‐ EBCVM 2003
‐ World Health Survey (WHS) 2003
‐ Questionnaire des Indicateurs de Bien Etre (QUIBB) 2007
‐ 2 HIV Most at risk population surveys ‐ 2 national surveys in 2005 and 2006, on commercial sex
workers. Also case detection activities among military, miners and truckers (2003).
‐ District Comprehensive Assessment (DCA) in 13 districts, 2008 (Global Fund Health Impact
Evaluation)
‐ Other social/economic ‐ Household economic survey 2001 (WB?); Ouagadougou
Employment survey 2001‐2003 (ILO?); annual agricultural surveys (1994‐2008)
Facility assessments.
‐ DCA 2008 in 13 districts, SAM/Health Mapper 2005
Vital registration.
Vital registration information is reported to Administration Territoriale. According to
the HMN self‐assessment (Dec. 2008) this aspect of the information system constitutes the
weakest data management system.
Demographic Sentinel Sites.
There are four DSS in Burkina Faso, 3 of which are IN‐DEPTH network sites: 1) Nouna is
the longest‐established site, 2) ISSP has a site in urban Ouaga, 3) Sapone is 20 km from Ouaga,
and 4) Caya is 5 km from Ouaga and IRSS is currently registering it with IN‐DEPTH.
Disease surveillance.
‐ acute outbreak disease surveillance, such as meningitis, yellow fever etc. (to be determined)
‐ ANC sentinel sites: 3 sites established in 1997. Currently 13 sites with 6 urban and 7 rural. 2nd
generation protocol is used. 6500‐7000 pregnant women per year are tested for HIV and STI.
‐ TB ‐ fairly well functioning system according to an in‐depth evaluation of the results from GF
evaluation study in 2008
Administrative data.
‐ Financing‐ The first National Health Accounts (NHA) exercise, using WHO‐recommended
methodology, was conducted in 2005 and documented health expenses in 2003 and 2004. The
second NHA was conducted in 2007, to take into account 2005 expenses with sub‐accounts for
malaria and HIV/AIDS. The most recent NHA, in 2008, with sub‐accounts in HIV, TB and malaria,
covers expenses from 2003 to 2006. The NHA 2008 report proposes putting in place tools that
would facilitate collection of financial data in 'real time'.
‐ Human resources (to be determined)
‐ facility database with GPS coordinates and basic service information is available at the MOH‐
MOH/DGIST, however, it needs to be updated with the GF DCA facility assessment data in 13
districts, as well as a plan to update facility information in the remaining districts.
4. Data quality control mechanisms
Ascertaining the quality of clinic reporting systems.
‐ Reporting of completeness and timeliness of facility reports: The MOH/DEP collects monthly
reports from facilities and enters these routinely reported data in an eletronic database (RASI).
5This routine automatically reveals reports that are missing and/or reports that are not complete.
Whether timeliness and completeness of reporting is assessed on a regular basis is unknown,
and whether follow‐up is done on missing or incomplete reports is also unknown.
‐ Assessments to verify the accuracy of the reports (e.g. revisits): MOH/DGISS indicates that it is
too expensive to revisit facilities to recheck data. However, the DEP makes field supervision
visits and is responsible for tracking district level indicators; these data therefore may provide a
cross‐check to the routine data that are reported monthly.
‐ Reconciliation of survey and facility data: not aware that this is done regularly, although during
the mission in March/April 2009 an initial attempt was made by the consultant to reconcile or
update official facility codes and geo‐reference points from the DCA facility assessment, the
2005 SAM, and the MOH/RASI facility data base.
‐ Independent evaluation mechanisms in the countries: Not aware of any mechanisms.
5. Data access, analysis and dissemination
The Direction des Etudes et de la Planification (DEO/MOH) has been prolific in using their
routinely collected data to report regularly on the status of health indicators at the national and
district levels. Findings are published annually in the Annuaire Statistique Santé. Specific areas
of reporting in the Annuaire include maternal health, nutrition, curative care, sexually
transmitted diseases, in‐patient care, surgery, laboratory, health education, special interest
diseases, malaria, and health in the workplace. A series of indicators related to hospital
consultations is also presented in the Annuaire. In 2007, DEP also published a Tableau de Bord
that presents trends for key indicators in detailed tables, figures and maps.
DEP produces regular Progress Reports based on six‐month supervision visits to districts, which
are further used to produce a Synthesis report of findings. Another useful publication produced
in 2007 is Indicateurs essentiels de système national d'information sanitaire: Manuel de
reference. This manual includes indicator definitions, data source, and instructions on their
calculation.
In terms of datasets of routine data, the Direction General of Health Information & Statistics
(DGISS) uses the RASI and the SIGIST for storing and analysis of routine data. Partial databases
of health facilities include Health mapper (c. 1997‐2004, 2005) and the DCA Facility census
(2008). Microdata for the latter have been archived by IRSS and will be available on the web
after a dissemination workshop in June 2009.
DEVINFO is not functioning sufficiently to provide information on MDGs, etc.
5. Institutional capacity
The MOH DEP has been strategically divided into the newly created Direction General of Health
Information & Statistics (DGISS), and a reorganized DEP. This new direction has been elevated to
a high status within the Ministry and will expand routine data collection functions that were
previously all under DEP. Several sub‐departments are also to be developed under the new
direction. The DGISS is currently reviewing its tools, includes the MS‐Access databases for
routine data, RASI and SIGIST.
6One of the main functions of the DEP/MOH (Direction des Etudes et de la Planification) is district
supervision and overseeing the implementation of district annual health plans. Progress status
is documented and synthesized in regular performance reviews.
Research institutions. The Institut de Recherche en Sciences de la Santé (IRSS), in Ouagadougou,
was created in 1997 as one of four National Centers of Scientific Research and Technology. It
employs a team of 15‐20 interdisciplinary researchers, including epidemiologists, demographers,
pharmacists, biostatisticians, nutritionists, health economists and anthropologists. IRSS
conducts operational research in HIV/AIDS, malaria, nutrition and tuberculosis. Examples of
recent research activities include: Impact du programme d’accélération de l’accès aux ARV dans
le fonctionnement des formations sanitaires (World Bank); Evaluation des 5 ans du Fond
Mondial de lutte contre le VIH, la Tuberculose et le paludisme au Burkina Faso (Macro
International); Facteurs explicatifs des disparités spatiales de prévalence du VIH/sida au Burkina
Faso; Pratiques de prise en charge des personnes vivant avec le VIH au Burkina faso (TDR/WHO);
Système de Surveillance Démographique et Epidémiologique de Kaya (KaDESS); Les
caractéristiques des revenus des professionnels de la santé et leur relation avec la fourniture
des soins au Benin, Burkina Faso et Niger (Alliance for Health Policy and systems research/WHO);
Stigmatisation et fréquentation des structures de PEC des PVVIH par les hommes au Burkina
Faso.
The GREFSaD, in Bobo‐Dioulasso, is another research institution with about a dozen fulltime
staff and broad experience in data collection and data analysis, including experience gained in
collecting household information on PDAs for the Global Fund Evaluation DCA. Some examples
of GREFSaD's research portfolio include an assessment of the maternal mortality initiative
(IMMPACT), the prevalence, prevention and treatment of obstetrical fistulaire, the development
of civil society, validation study of using the verbal autopsy instrument on a PDA, the prevalence
of HIV among infants born to HIV+ mothers who received PMTCT prophylaxis, and other
research topics. Funding sources for these and other research projects include national sources
(e.g., MOH and SP/CNLS) and international sources (e.g., Aberdeen University, London School of
Hygiene and Tropical Medicine, Bill and Melinda Gates Foundation, Wellcome Trust, Macro
International, DFID, USAID, and French state funding.
6. Conclusions and recommendations
The strengths of the MOH monitoring & evaluation system are a result of many years of
experience in collecting routine data. An electronic database tracks facility‐level data, and these
data have been used to generate trends for a variety of indicators at national and sub‐national
levels. These results are made available regularly in quarterly and annual publications, in hard
copies or electronically, and are presented in detailed tables, graphics and maps to facilitate the
reader's interpretation.
Pressing forward, the greatest challenges lie in two major areas. First, there needs to be
established a systematic and independent mechanism to check the quality of routine data.
Second, databases need to be updated. In particular, the facility database needs to be updated
on a regular basis to ensure all facilities, public and private, are operating according to national
norms. The new DGISS is also currently reviewing its tools and may decide that the MS‐Access
data bases of routine data currently in use could stand improvement in efficiency; consultation
on this topic has been initiated with the University of Oslo on the DHIS.
7In particular, below are several strategies that would strengthen data sources (routine
administrative data and other sources) and serve to inform the health sector review process
starting in 2010:
1. Incorporate regular monitoring and evaluation of health facilities into annual review. One
mechanism would be to conduct an annual facility census in a selection of districts, whereby the
facility database would be replenished on a scheduled basis. For example, another sample of
one‐fifth of districts (about 13 districts), to build on the original 13 selected during the Global
Fund Evaluation, may be selected in the next year in which a facility census would be conducted.
2. Incorporate validation measures into the facility assessment to verify data at the central
level vis‐à‐vis data from facilities aggregated to the district/regional level data. A few key
variables and time periods could be selected to validate at the time of the facility census.
3. Facility data should be integrated into the MOH M&E system and made available for further
analysis, mapping, etc. The IHSN Accelerated Data Project (ADP) has trained two research
institutions to archive microdata on the web. A link could be established to access these data on
the MOH M&E website.
4. Strengthen capacity for primary data collection. Existing capacity, for example the capacity
acquired in the course of the Global Fund Evaluation District comprehensive assessment (DCA),
could be reinforced among other partners (such as DGISS) so that primary data collection can be
done increasingly independently and not reliant on scarce, expensive assistance from the north.
In particular, data management capacity should be strengthened, including the designing of
questionnaire applications, data collection and verification of data quality, and data analysis.
This capacity strengthening could be done on a regional basis. For example, two research
institutions in Burkina Faso, IRSS and GREFSaD, have already accumulated substantial
knowledge and capacity with survey data management since the DCA, including collecting data
with PDAs. The existing capacity could be built upon through further applied training of these
and other national staff, as well as with participants from other countries in the region. The
training would use as a basis the country‐adapted questionnaires to be fielded (i.e., a revised
Facility census that includes specific information for the PNDS intermediary goals, essential
medicines, and other modules as determined by the country). Burkina Faso could position itself
to lend such expertise on a regional basis until other countries acquire the needed technical
level and field experience.
5. Continue supporting DGISS capacity and its collaboration with partners. A technical person
is invited from DGISS to attend a workshop on archiving the DCA facility database from the
Global Fund Evaluation. The workshop on the IHSN Microdata Management Toolkit will take
place in Nairobi, May 4‐8, 2009.
6. Further strengthen effective communication tools to inform decision making process
WHO‐HQ may provide support to implement the above recommendations, at the request of the
MOH‐DIGIST to indicate their collaboration with an entity with prior experience and capacity to
do this (e.g. IRSS). WHO‐HQ may also provide assistance in conducting a validation of some key
central level indicators, either as part of the facility assessment or a stand‐alone exercise. This
should be done upon request of the MOH‐DIGIST, and in collaboration with an independent
entity such as IRSS.
8List of Contacts:
Cabral, K. Djamila. WHO/WR
Kano, Hamissou. Director of the National Institute for Statistics (INSD)
Kielem, David. WHO
Kounda, Seni. Research Institute for Health Sciences (IRSS)
Mbonji, Peter. WHO Inter‐country Team, M&E focal point
Meda, Nicolas. Coordinator of the Global Fund Impact Evaluation
Mothebesoane, Seipati. WHO Making Pregnancy Safer
Nitiema, Abdoulaye. DEP
Ouédraogo, Boureima. Directeur general for Health information and statistics (DGIS), MOH
Sawadogo, Janvier. Asst. to the director DGIS, MOH
Sanou, Souleyman. Directeur general of health, MOH
Soumbey‐Alley, Edoh. WHO Regional Advisor, Health Information Systems
Touré, Boka. Coordinator of the WHO Inter‐country Team
Traore, Waramou. Secretary of Task Force for the Global Fund Impact Evaluation
van der Horst, Jan. HIV/AIDS Advisor, Dutch Embassy
9Annex A IHP+ common evaluation framework: global
The top section of the framework shows the sequence used in monitoring and evaluation
frameworks from inputs and processes to outputs, outcomes and impact. At the bottom of the
figure, the proposed actions for improved monitoring of performance and evaluation are shown.
The framework for evaluation of the scale‐up in the spirit of the Paris declaration can be
translated into the following six principles:
1. Collective action: the primary focus should be on the contribution of the collective efforts to
scale‐up the health sector response in countries.
2. Alignment with country processes: monitoring performance and evaluation should build
upon national processes that countries have established to evaluate and review progress in
the implementation of national health sector plans.
3. Balance between country participation and independence: evaluation processes should be
driven by country needs but conducted in a manner which maintains their independence.
4. Harmonised approaches to performance assessment: evaluations of the scale‐up should
use common protocols and standardized outcome indicators and measurement tools, with
appropriate country adaptations and leadership, minimizing the separate evaluation efforts
of individual initiatives, grants and programmes.
5. Capacity building and health information system strengthening: systematic involvement of
country institutions in performance monitoring and evaluation is necessary to strengthen
health information systems and promote local capacity for analysis and application of
information and evidence.
6. Adequate funding: as a general guide between 5% and 10% of the overall scale‐up funds
need to be set aside for monitoring performance, evaluation, operational research and
strengthening health information systems.
IHP+ COMMON EVALUATION FRAMEWORK
Inputs Process Outputs Outcomes Impact
Improved survival
Funding National plan Increased service Child mortality
Governance, HR, medical products, information
Access, safety, quality, efficiency
Health system strengthened
Improved services
Domestic sources implementation utilization and Maternal mortality
International sources Systems strengthening intervention Adult mortality due to
Priority interventions coverage infectious diseases
scale-up
Improved nutrition
Plan Capacity building Reduced inequity Children
Coherent, prioritised Programmes (e.g. gender, Pregnant women
and funded Institutions socio-economic
People position) Reduced morbidity
HIV, TB, malaria, repr.
health
Harmonization Accountability Responsiveness
Aligned international Performance Improved equity
efforts with national monitoring No drop-off non-
plan health sector Social and financial
Well coordinated and Results focus and interventions (e.g. risk protection
harmonized support evaluation water & sanitation) Reduced
impoverishment due to
Use for better health expenditures
practices
M & E action
Aid process Implementation Health system monitoring Coverage monitoring Impact monitoring
monitoring Monitoring
Resource tracking
Strengthen country health information systems
Evaluation: process, health systems strengthening, impact
10Annex B List of 42 official PNSD intermediate indicators
I. LA LISTE DES INDICATEURS RETENUS DANS LE CADRE
DU SUIVI DU PNDS
Source de
Indicateur / Programme Type d’indicateur Niveau de collecte vérification Périodicité
I Accroissement de la couverture sanitaire
nationale
1 Rayon moyen d’action des formations sanitaires
(CSPS) Ressource/Processus Districts SNIS Annuelle
2 Pourcentage des formations sanitaires
fonctionnelles selon les normes minimales en Ressource/Processus National Enquêtes Tous les 2 ans
3 Pourcentage des formations sanitaires
remplissant les normes minimales en équipement Ressource/Processus National Enquêtes Tous les 2 ans
4 Pourcentage de districts opérationnels Ressource/Processus Régions Supervision Annuelle
5 Pourcentage des formations sanitaires privées
transmettant régulièrement des rapports
statistiques à la DEP (SNIS) Ressource/Processus Régions Rapport Annuelle
II Amélioration de la qualité et l’utilisation des
services
6 Nombre de médicaments traditionnels
enregistrés à la nomenclature nationale Résultat National Rapport Annuelle
7 Nombre de nouveaux contacts par habitant et
par an dans les structures de soins de 1er niveau SNIS/ Rapp.
(CMA et CSPS) Résultat Districts Progrès Annuelle
8 Pourcentage de dépôts MEG n’ayant pas connu SNIS/ Rapp.
de rupture des 10 molécules essentielles Ressource/Processus Districts Progrès Annuelle
9 Pourcentage de DRD n’ayant pas connu de SNIS/ Rapp.
rupture des 45 molécules essentielles Ressource/Processus Districts Progrès Annuelle
10 Taux d’hospitalisation Résultat Districts/Hôpitaux SNIS Annuelle
11 Pourcentage d’hôpitaux transmettant
régulièrement des rapports statistiques aux DRS et
à la DEP Ressource/Processus Hôpitaux SNIS Annuelle
12 Pourcentage de formations sanitaires disposant
d’un système fonctionnel de traitement des
déchets biomédicaux Ressource/Processus Districts/Hôpitaux Enquêtes Tous les 2 ans
III Renforcement de la lutte contre les maladies
transmissibles et non transmissibles
SNIS/ Rapp.
13 Taux de couverture en CPN2 Résultat Districts Progrès Annuelle
SNIS/ Rapp.
14 Proportion de césariennes réalisées Résultat Districts Progrès Annuelle
15 Taux d’accouchements assistés par
duvpersonnel qualifié dans les formations SNIS/ Rapp.
sanitaires Résultat Districts Progrès Annuelle
SNIS/ Rapp.
16 Taux de couverture en PENTA 1 Résultat Districts Progrès Annuelle
SNIS/ Rapp.
17 Taux de couverture en PENTA 3 Résultat Districts Progrès Annuelle
18 Taux de couverture en Vaccin antirougeoleux SNIS/ Rapp.
(VAR) Résultat Districts Progrès Annuelle
19 Taux de prévalence contraceptive couple SNIS/ Rapp.
années protection Résultat Districts Progrès Annuelle
20 Taux de couverture en Vitamine A chez les
enfants de 6 à 59 mois Résultat Districts Rapport Annuelle
SNIS/ Rapp.
21 Taux de guérison des cas de tuberculose Résultat Districts Progrès Annuelle
22 Taux de létalité du paludisme grave chez les SNIS/ Rapp.
enfants de moins de 05 ans Résultat Districts Progrès Annuelle
1123 Taux de létalité des complications obstétricales
vues dans les formations sanitaires dans les
structures de santé (CSPS, CM, CMA, CHR et
CHN) Résultat Districts/Hôpitaux Enquêtes Annuelle
24 Incidence du tétanos néonatal (OMD,
intervention à gain rapide) Impact SNIS Annuelle
IV Réduction de la transmission du VIH/Sida
25 Pourcentage de personnes atteintes de Sida
justifiables du traitement qui sont sous traitement SNIS/ Rapp.
antirétroviral (ARV) Résultat Districts Progrès Annuelle
21 Pourcentage des femmes enceintes infectées
par le VIH qui reçoivent un traitement complet SNIS/ Rapp.
pour réduire la transmission mère enfant Résultat Districts Progrès Annuelle
Sero
26 Prévalence de la syphilis Résultat/impact National surveillance Annuelle
V Développement des ressources humaines
27 Pourcentage de structures sanitaires publiques
(CSPS, CMA et CHR) remplissant les normes SNIS/ Rapp.
minimales en personnel de santé Ressource/Processus Districts/Hôpitaux Progrès Annuelle
28 Ratio différentes catégories de personnel par
rapport à la population Ressource/Processus National SNIS Annuelle
VI Amélioration de la transmission du VIH
29 Coût moyen des prestations et des ordonnances
à chaque niveau du système de soins Ressource/Processus Districts/Hôpitaux Enquêtes Tous les 2 ans
30 Coût moyen de la prise en charge du paludisme Ressource/Processus Districts/Hôpitaux Enquêtes Tous les 2 ans
31 Nombre de districts disposant de mécanismes Direction Régionale
de partage de risques maladie fonctionnels Ressource/Processus de la Santé Enquêtes Tous les 2 ans
VII Accroissement des financements en faveur
de la santé
32 Taux de mobilisation des ressources Ressource/Processus Districts Bilan financier Annuelle
33 Taux d’absorption des ressources mobilisées Ressource/Processus Districts Bilan financier Annuelle
34 Pourcentage du budget de l’Etat alloué à la
santé Ressource/Processus National Bilan financier Annuelle
35 Taux d’exécution du budget de l’Etat Ressource/Processus National Bilan financier Annuelle
VIII Renforcement des capacités
institutionnelles du Ministère de la santé
36 Nombre de réunions du Comité Suivi du PNDS
tenues Résultat Rapport Annuelle
37 Proportion de directions centrales disposant de
plans de renforcement mis effectivement en
oeuvre Ressource/Processus National Rapport Annuelle
IX Indicateurs d’impact
Enquête
Démographique
38 Ratio de mortalité maternelle Impact National et de Santé Tous les 5 ans
Enquête
Démographique
39 Taux de mortalité Infantile Impact National et de Santé Tous les 5 ans
Enquête
Démographique
40 Taux de mortalité infanto juvénile Impact National et de Santé Tous les 5 ans
41 Taux de prévalence du VIH/SIDA Impact National Enquête Annuelle
1242 Taux d’insuffisance pondérale chez les enfants Enquête
de moins de 5 ans (OMD, intervention à gain Démographique
rapide) Impact National et de Santé Tous les 5 ans
13Annex C Intermediate indicators
Below is a selection of six of the official PNDS indicators that may be monitored with the DCA
Facility census instrument, using data collected during the Global Fund Impact Evaluation in
2008.
Intermediate indicator 2 (MOH/DEP 2009). Percentage of health centres functioning according
to minimal requirements for infrastructure
The DCA Facility census 2008 collects data on infrastructure elements including but not limited to
power, improved water source, communication, emergency transport, overnight observation
beds. If the questionnaire does not include the nationally defined 'minimal requirements' for
infrastructure then the questionnaire can be adapted for future rounds.
Percentage of health facilities with basic elements of infrastructure,
in 13 districts, DCA 2008
Overnight observation
beds
Emergency transport
Communication
Improved water source
(500 m)
Continuous power source
0% 10% 20% 30% 40% 50% 60% 70% 80% 90% 100%
n=555 health facilities
14Percentage of health facilities with basic elements of infrastructure, DCA 2008
Nouna (n=28)
Bousse (n=22)
Kongoussi (n=36)
Manga (n=33)
Leo (n=32)
Bobo (Sect.22) (n=95)
Diebougou (n=15)
Sindou (n=28)
Djibo (n=31)
Ouahigouya (n=98)
Bogodo (Sect. 30) (n=86)
Ouargaye (n=25)
Diapaga (n=26)
0% 20% 40% 60% 80% 100%
Continuous power source Improved water source (500 m) Communication
Emergency transport Overnight observation beds
15Intermediate indicator 3 (MOH/DEP 2009). Percentage of health centres fulfilling minimal
requirements for equipment.
The DCA Facility census 2008 collects data on availability of basic equipment including, but not
limited to, child and adult weighing scales, thermometer, stethoscope and blood pressure cuff.
Likewise, information is collected on availability of higher level equipment such as anaesthesia
machine, oxygen, infusion, and radio and internet. If the questionnaire does not include the
nationally defined 'minimal requirements' for equipment then the questionnaire may be adapted
for future rounds.
Percentage of health centers with basic equipment*,
in 13 districts, DCA 2008
Nouna (n=28)
Bousse (n=22)
Kongoussi (n=36)
Manga (n=33)
Leo (n=32)
Bobo (Sect.22) (n=95)
Diebougou (n=15)
Sindou (n=28)
Djibo (n=31)
Ouahigouya (n=98)
Bogodo (Sect. 30) (n=86)
Ouargaye (n=25)
Diapaga (n=26)
0% 10% 20% 30% 40% 50% 60% 70% 80% 90% 100%
n= 555 health facilities
*Basic equipment includes: adult scale, child scale, thermometer, stethoscope, blood pressure cuff
16Intermediate indicator 9 (MOH/DEP 2009). Percentage of district medicine depots (DRD) with
no stock‐outs for 45 tracer medicines.
The DCA Facility census 2008 collects data on 13 of 45 tracer medicines and their availability in
health facilities. The questionnaire may be adapted in future rounds to include other tracer
medicines.
Availability of essential generic tracer medicines in health facilities
in 13 districts, DCA 2008
100%
90%
80%
70%
60%
50%
40%
30%
20%
10%
0%
e
le
le
CT
ol
P
ci n
le
e
ne
e
ne
RO
ol
in
in
/S
zo
zo
m
zo
/A
xo
illi
az
xa
oc
in
sS
ar
da
ta
na
na
m
ox
ia
ic
Qu
lo
yt
id
cé
et
en
di
co
ox
ft r
te
of
ns
Ox
im
ch
ra
ro
ar
eb
Flu
Am
Ce
pr
Fa
‐tr
Pa
Sa
et
Co
Ci
M
Co
M
n= 555 health facilities
17Availability of Amoxicilline, Ceftriaxone, Ciprofloxacin, Cotrimoxazole,
DCA 2008
Nouna (n=28)
Bousse (n=22)
Kongoussi (n=36)
Manga (n=33)
Leo (n=32)
Bobo (Sect.22) (n=95)
Diebougou (n=15)
Sindou (n=28)
Djibo (n=31)
Ouahigouya (n=98)
Bogodo (Sect. 30) (n=86)
Ouargaye (n=25)
Diapaga (n=26)
0% 10% 20% 30% 40% 50% 60% 70% 80% 90% 100%
Amoxicilline Ceftriaxone Ciprofloxacin Co‐trimoxazole
18Availability of Fluconazole, Mebendazole, Metrodinazole,
DCA 2008
Nouna (n=28)
Bousse (n=22)
Kongoussi (n=36)
Manga (n=33)
Leo (n=32)
Bobo (Sect.22) (n=95)
Diebougou (n=15)
Sindou (n=28)
Djibo (n=31)
Ouahigouya (n=98)
Bogodo (Sect. 30) (n=86)
Ouargaye (n=25)
Diapaga (n=26)
0% 10% 20% 30% 40% 50% 60% 70% 80% 90% 100%
Fluconazole Mebendazole Metrodinazole
19Availability of Oxytocine, Paracetamol, sachets SRO,
DCA 2008
Nouna (n=28)
Bousse (n=22)
Kongoussi (n=36)
Manga (n=33)
Leo (n=32)
Bobo (Sect.22) (n=95)
Diebougou (n=15)
Sindou (n=28)
Djibo (n=31)
Ouahigouya (n=98)
Bogodo (Sect. 30) (n=86)
Ouargaye (n=25)
Diapaga (n=26)
0% 10% 20% 30% 40% 50% 60% 70% 80% 90% 100%
Oxytocine Paracétamol Sachets SRO
20Availability of Coartem/ACT, Fansidar/SP, Quinine,
DCA 2008
Nouna (n=28)
Bousse (n=22)
Kongoussi (n=36)
Manga (n=33)
Leo (n=32)
Bobo (Sect.22) (n=95)
Diebougou (n=15)
Sindou (n=28)
Djibo (n=31)
Ouahigouya (n=98)
Bogodo (Sect. 30) (n=86)
Ouargaye (n=25)
Diapaga (n=26)
0% 10% 20% 30% 40% 50% 60% 70% 80% 90% 100%
Coartem/ACT Fansidar/SP Quinine
21Intermediate indicator 12 (MOH/DEP 2009). Percentage of health centres with a functional
system for treating biomedical wastes.
The DCA Facility census 2008 collects data on mechanisms of biomedical waste disposal in health
facilities. (Information on sterilization mechanisms is also collected.)
Treatment of biomedical waste, sharps and infectious waste,
in 13 districts, DCA 2008
50%
45%
40%
35%
30%
25%
20%
15%
10%
5%
0%
Burn in Open burning Dump without Remove offsite Other/No sharps
incinerator burning
Sharps Infectious waste
n= 555 health facilities
22Disposal mechanisms of infectious waste,
DCA 2008
Nouna (n=28)
Bousse (n=22)
Kongoussi (n=36)
Manga (n=33)
Leo (n=32)
Bobo (Sect.22) (n=95)
Diebougou (n=15)
Sindou (n=28)
Djibo (n=31) Burn in incinerator
Open burning
Ouahigouya (n=98) Dump without burning
Remove offsite
Bogodo (Sect. 30) (n=86)
Other/No sharps
Ouargaye (n=25)
Diapaga (n=26)
0% 10% 20% 30% 40% 50% 60% 70% 80% 90% 100%
23Intermediate indicator 27 (MOH/DEP 2009). Percentage of public health centers (CSPS, CMA,
CHR) fulfilling minimal requirements for health personnel.
The DCA Facility census 2008 collects information on the type of health personnel at each facility
(full time and part time), their presence at time of interview, and specific training formations
within the past two years. Information can be adjusted to present the nationally defined
'minimal requirements' for health personnel, and the percentage of facilities fulfilling the
requirements.
Average number of full‐time health professionals per health facility,
in 13 districts, DCA 2008
2.5
2.0
1.5
1.0
0.5
0.0
Medical doctors Asst. medical officers Certified/registered Certified/registered All 4 health
nurses midwives professionals
n= 555 health facilities
24Average number of full‐time health professionals per health facility,
DCA 2008
Nouna (n=28)
Bousse (n=22)
Kongoussi (n=36)
Certified/registered midwives
Manga (n=33) Certified/registered nurses
Asst. medical officers
Leo (n=32)
Medical doctors
Bobo (Sect.22) (n=95)
Diebougou (n=15)
Sindou (n=28)
Djibo (n=31)
Ouahigouya (n=98)
Bogodo (Sect. 30) (n=86)
Ouargaye (n=25)
Diapaga (n=26)
0.0 0.2 0.4 0.6 0.8 1.0 1.2 1.4 1.6 1.8
25Intermediate indicator 28 (MOH/DEP 2009). Ratio of various categories of health personnel per
population.
Average number of health personnel per 10,000 inhabitants,
in 13 districts, DCA 2008
4.0
3.5
3.0
2.5
2.0
1.5
1.0
0.5
0.0
Medical doctors Asst. medical officers Certified/registered Certified/registered All 4 health
nurses midwives professionals
n= 555 health facilities
Average number of health personnel per 10,000 inhabitants,
DCA 2008
Nouna (n=28)
Certified/registered midwives
Bousse (n=22)
Certified/registered nurses
Kongoussi (n=36) Asst. medical officers
Medical doctors
Manga (n=33)
Leo (n=32)
Bobo (Sect.22) (n=95)
Diebougou (n=15)
Sindou (n=28)
Djibo (n=31)
Ouahigouya (n=98)
Bogodo (Sect. 30) (n=86)
Ouargaye (n=25)
Diapaga (n=26)
0.0 1.0 2.0 3.0 4.0 5.0 6.0
26Note: Base population 2006 projected with 3.2% average growth rate for 2000‐2005 (UN Population
Division)
27Annex D Documentation and references:
Ministry of Economy and Development. 2004. Burkina Faso Poverty Reduction Strategy Paper.
Copie pdf
Ministry of the Economy and Finance/Bureau central du recensemen. Recensement général de
la Population et de l'Habitation 2006: Résultats définitifs. July 2008. Copie pdf
Ministry of the Economy and Finance/INSD and OECD. 2009. Programme statistique acceleré,
Burkina Faso. Rapport de la première phase de la première étape: Archivage des données
d'enquêtes et de recensements. Copie Word
Ministry of Health/DEP. Annuaire Statistique Santé 2007. June 2008. Direction des Etudes et de
la Planification. Ouagadougou. Copie pdf
Ministry of Health/DEP/Secretariat technique. Canevas et guide d'élaboration des rapports de
progrès des districts sanitaires. Jan. 2009. Copie pdf
Ministry of Health/DEP. Indicateurs essentiels de système national d'information sanitaire:
Manuel de reference. August 2007. Copie Word
Ministry of Health/DEP. Tableau de Bord de la Santé 2007. Direction des Etudes et de la
Planification. Ouagadougou. Copie pdf
Ministry of Health/Plan National de développement sanitaire 2001‐2010. Rapport final:
Evaluation à mi‐parcours du PNDS au Burkina Faso. Sept. 2005. Copie pdf
Ministry of Health/Plan National de développement sanitaire 2001‐2010. Tranche 2006‐2010.
March 2007. 2005. (Hard copy only)
Rapport de Mission de la Delegation du Burkina Faso et des Partenaires a la Réunion
Internationale de l'Equipe Inter‐Pays du secteur de la Santé a Lusaka (Zambie), MOH, March
2008 (Hard copy only)
Ministry of Health/DEP. Rapport d'Activité Sanitaire Informatisé (RASI) Manuel de l'Utilisateur.
Copie pdf
Ministry of Health. 2008. Comptes Nationaux de la Santé 2006: Sous comptes VIH/SIDA,
Tuberculose et Paludisme de 2003 à 2006. Copie pdf
Reseau de metrologie sanitaire evaluation du système d'information sanitaire, Rapport du
Burkina Faso. December 2008. [HMN Assessment final report, Burkina Faso Dec. 2008] Copie
Word
28Annex E 2006 Burkina Faso Carte Sanitaire
2006 Burkina Faso Carte Sanitaire: Summary of Desk Review:
This summarizes a rapid desk review by Lemarchand and Greenwell, based on information
provided about the 2006 Carte Sanitaire on a CD‐ROM. The objective was not to conduct an
exhaustive review, rather to formulate recommendations for WHO as to how they might
support the DGISS/MOH in updating the 2009 Carte Sanitaire.
Content
Themes
1. Demography
Population by region, admin district, density, by sex, by major age group, by pregnant
women
14 demographic indicators, limited trend info.
2. Infrastructure
By 8 facility types, and name/owner
The number of facilities by type, by region and district
% of facilities with water, electricity, comm., sewage
14 international partners, by type
3. Partner interventions
Number of specific medical personnel, density and the norme, by region and district
4. Personnel
Number of personnel type by region, district, and density and target ('Niv. Atteinte de
norme'), and by type of health center.
5. Health situation
15 National indicators and trend info
12 district indicators, no trend info
5 specific diseases, by district/region
Total state budget, national level, and percent for health, trend info
6. SES situation
14 national indicators, trend info where available
Assessment: Overall the content for existing themes is pretty good. However, information on
specific services, staff training, drugs, lab and equipment do not appear to be available. Also,
most data are aggregated at the district/region level, and not analyzable by facility observations.
There is not trend data, mostly 2004 data only, but the 2009 update should provide valuable
comparison data for the major themes.
Presentation
There was not a copy of the final report on the cd.
The Access database is user‐friendly. Automatically generated reports and maps are good.
The maps are nicely presented.
29Assessment: Nice presentation using an older version of ARCVIEW GIS.
Database
Data are in an Access database with about 40 relational tables. The database is not documented
using international documentation and archiving standards to facilitate use from outside
analysts.
Assessment: A relational database such as Access is not feasible for further analysis because
only discrete tables can be viewed or exported. The DHIS2 software should address this problem
by providing a platform that has greater potential for providing data in a full dataset that is
conducive to further analysis.
Data quality
Difficult to assess quality since data are not in one exportable data file. A more in‐depth
assessment could compare a selection of common indicators (2008 GFE and 2006 Carte
Sanitaire), such as available personnel, at the district level. TBD
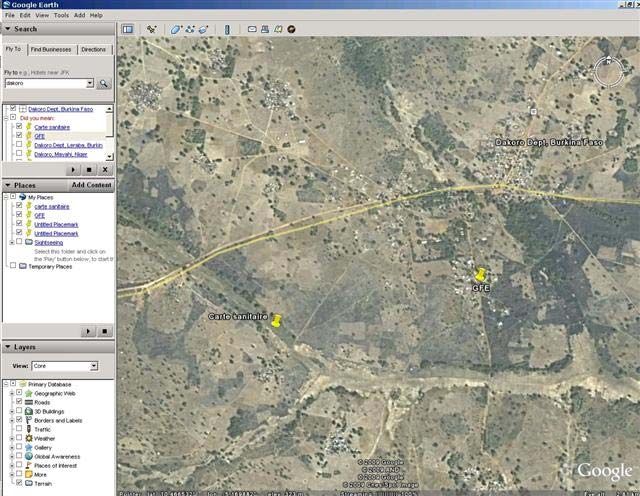
Mapping
An examination of the 2006 Carte Sanitaire database revealed that for many facilities, if not
most, GPS coordinates are not accurate. A comparison of facility coordinates for facilities in the
2008 GFE districts with those from the 2006 Carte Sanitaire/Health Mapper showed significant
discrepancies. In Lebara district, for example, geographic coordinates for the same facilities
deviated from 1‐1.3 km (Annex E1). The GF coordinates appear more accurate since it
designated a facility located in a village, whereas coordinates from the other sources showed
the same facility outside of the village in non‐inhabited areas (Annex E2 and E3).
The reason for these discrepancies is that health facilities from the 2006 Carte Sanitaire are geo‐
referenced using a variety of available mapping sources such as gazeteers and very few health
facilities were geo‐referenced using GPS devices. For the 2008 GFE, the geographic coordinates
were collected using a GPS device.
Recommendations for WHO support of the 2009 Carte Sanitaire update
1. GPS coordinates should be updated with precise measurements. To start, the coordinates
could be updated with measurements from the GFE, new facilities, and facilities in non‐GFE
districts would require a visit.
2. Technical assistance could be provided to assist in presentation of the updated information.
For example, a WHO cartographer could work with DGISS on presenting maps using more recent
software.
3. Technical assistance could be provided to assist with interpretation of 2004‐2009 trends, and
potentially new baseline information.
3. Collaborate with the DHIS‐2 team and DGISS to program routine data collection of relevant
facility indicators‐‐ as defined in the national strategic plan.
4. Documentation and archiving of annual data sets would greatly facilitate the dissemination
and use of these data by outside analysts.
30Annex E1. Comparing different GPS measures from different sources, for the same facilities
(Note: the 2006 Carte Sanitaire probably relied on some earlier Health Mapper coordinates that
were probably obtained from a secondary source such as a Gazeteer, rather than a GPS device)
31Annex E2. Facility in Lebara district, two measurements (2008 GFE and 2006 Carte Sanitaire)
32Annex E3. Another facility in Lebara district, two measurements (2008 GFE and 2006 Carte
Sanitaire)
33You can also read