EVERY CHILD ALIVE The urgent need to end newborn deaths - Unicef
←
→
Page content transcription
If your browser does not render page correctly, please read the page content below
EVERY CHILD ALIVE The urgent need to end newborn deaths
Acknowledgements
(listed alphabetically by surname)

Production lead: Guy Taylor
Principal writers: Siobhan Devine, Guy Taylor
Data and analysis: Liliana Carvajal-Aguirre, Lucia Hug, Tyler Porth, Danzhen You
Technical analysis and review: Maaike Arts, France Begin, Ted Chaiban,
Laurence Chandy, Chika Hayashi, Mark Hereward, Vrinda Mehra,
Anastasia Mshvidobadze, Luwei Pearson, Stefan Peterson, Katherine Rogers,
David Sharrow, Irum Taqi, Nabila Zaka and Willibald Zeck.
Thanks to Sinae Lee, Padraic Murphy and Maria Eleanor Reserva for providing
additional support to data analysis and review.

Editing: Tara Dooley, Meg French, Katherine Rogers
Copy-editing: Kristin Moehlmann
Fact checking: Xinyi Ge, Yasmine Hage
Design: QUO Global

The authors of this report are particularly indebted to colleagues in UNICEF
country offices, in particular UNICEF Ethiopia, UNICEF Kyrgyzstan and UNICEF
Malawi, for their support, and to Dr. Margaret E. Kruk of the Harvard T. H. Chan
School of Public Health, and Professor Joy Lawn of the London School of
Hygiene and Tropical Medicine, for their valuable insights.
EVERY CHILD ALIVE
The urgent need to end newborn deaths
© United Nations Children’s Fund (UNICEF), 2018       Photograph credits

Permission is required to reproduce any part of       Cover:    © UNICEF/UN0157449/Ayene
this publication. Permission will be freely granted   Page 4:   © UNICEF/UNI39905/Chute
to educational or non-profit organizations.
                                                      Page 7:   © UNICEF/UNI150965/Asselin
Please contact:                                       Page 9:   © UNICEF/UN0157425/Ayene
Private Fundraising and Partnerships                  Page 10: © UNICEF/UNI139096/Chute
UNICEF, Palais des Nations                            Page 15: © UNICEF/UNI100595/Asselin
1211 Genève 10, Switzerland
                                                      Page 17: © UNICEF/UN0147842/BOSCH/AFP
                                                      Page 18: © UNICEF/UN0155830/Zammit
                                                      Page 23: © UNICEF/UN0157421/Ayene
                                                      Page 24: © UNICEF/UNI100590/Asselin
                                                      Page 27: © UNICEF/UN0146977/Voronin
                                                      Page 28: © UNICEF/UNI182031/Rich
                                                      Page 30: © UNICEF/UNI100801/Asselin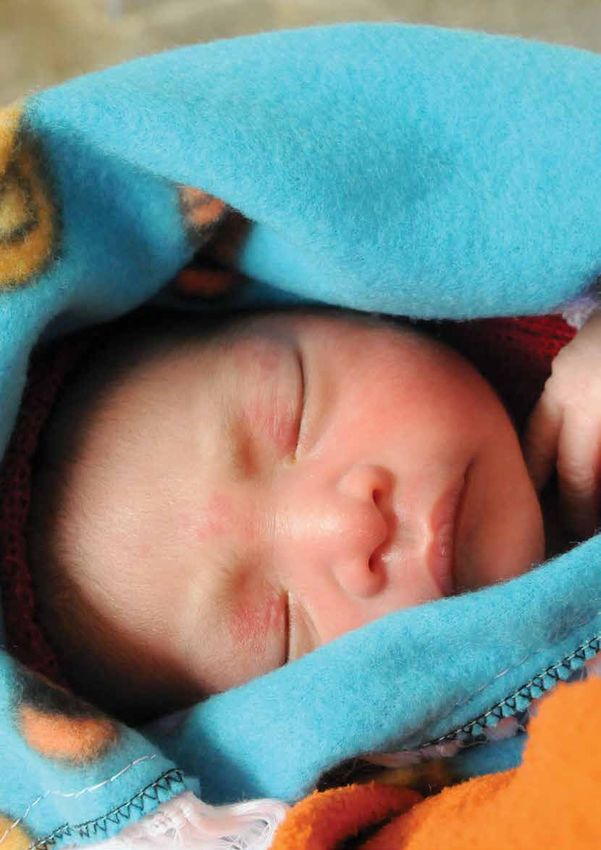
Contents

Executive summary                                                     1

The challenge of keeping Every Child Alive                            5

  Stillbirth: A tragedy shrouded in silence                           6

Where babies are dying                                               11

  The riskiest places to be born                                     11

  The safest places to be born                                       13

  The risk to newborns varies among and within countries             14

An agenda for action                                                 19

  Expanding access to health services is critical                    19

  Access is not enough – quality is key                              19

  The way forward                                                    20
     1 Place: Clean, functional health facilities                    20
     2 People: Well-trained health-care workers                      21
     3 Products: Life-saving drugs and equipment                     21
     4 Power: Dignity, respect and accountability                    22

Keeping Every Child Alive                                            25

Endnotes                                                             29

Annex: Newborn mortality rates and country ranking by income group   31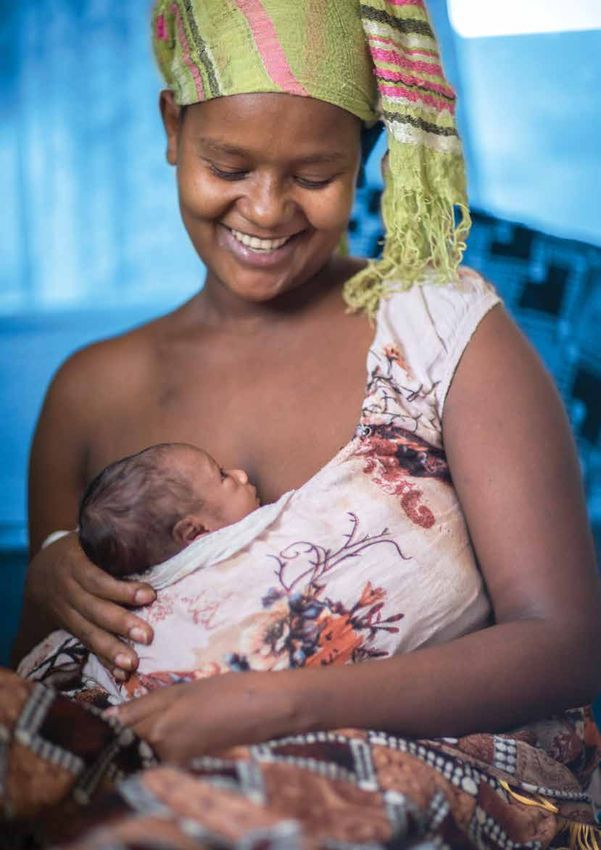
Imagine for a moment that you are about to give birth.
You are at home, accompanied only by a few
members of your family. You are in pain, but you have
no access to a doctor, nurse or midwife. You know
there is a real risk that both you and the baby you
have been waiting to meet may not survive the birth.
Even if you and the baby survive, you know that the
coming days and weeks will be filled with danger.

Imagine now that you are a midwife, preparing to
deliver a premature baby. The health centre where
you work has no running water, no electricity and
few supplies. You are standing in the dark, your mobile
phone clenched between your teeth, its dim glow the
only light available to guide you. The mother before
you is 16 years old. She is entering the active phase
of labour. You are her only source of medical help
and hope.

These scenarios illustrate the harsh reality faced
by millions of mothers, babies and health
workers around the world. It is a reality that
we can and must change to keep
EVERY CHILD ALIVE.
Executive summary

Every year, 2.6 million babies die before turning one month old.1 One million of them
take their first and last breaths on the day they are born. Another 2.6 million are stillborn.

Each of these deaths is a tragedy, especially because the vast majority are preventable.
More than 80 per cent of newborn deaths are the result of premature birth,
complications during labour and delivery and infections such as sepsis, meningitis and
pneumonia. Similar causes, particularly complications during labour, account for a large
share of stillbirths.

Millions of young lives could be saved every year if mothers and babies had access to
affordable, quality health care, good nutrition and clean water. But far too often, even
these basics are out of reach of the mothers and babies who need them most.

Deaths among children aged 1 month to 5 years old have fallen dramatically in recent
decades. But progress in reducing the deaths of newborn babies – those aged less than
1 month – has been less impressive, with 7,000 newborns still dying every day. This is
partly because newborn deaths are difficult to address with a single drug or intervention
– they require a system-wide approach. It is also due to a lack of momentum and global
commitment to newborn survival. We are failing the youngest, most vulnerable people
on the planet – and with so many millions of lives at stake, time is of the essence.

As this report shows, the risk of dying as a newborn varies enormously depending on
where a baby is born. Babies born in Japan stand the best chance of surviving, with just
1 in 1,000 dying during the first 28 days.2 Children born in Pakistan face the worst odds:
Of every 1,000 babies born, 46 die before the end of their first month – almost 1 in 20.

Newborn survival is closely linked to a country’s income level. High-income countries
have an average newborn mortality rate (the number of deaths per thousand live births)
of just 3.3 In comparison, low-income countries have a newborn mortality rate of 27.
This gap is significant: If every country brought its newborn mortality rate down to the
high-income average, or below, by 2030, 16 million newborn lives could be saved.

A country’s income level explains only part of the story, however. In Kuwait and the
United States of America, both high-income countries, the newborn mortality rate is 4.
This is only slightly better than lower-middle-income countries such as Sri Lanka and
Ukraine, where the newborn mortality rate is 5. Rwanda, a low-income country,
has more than halved its newborn mortality rate in recent decades, reducing it from 41
in 1990 to 17 in 2016, which puts the country well ahead of upper-middle-income
countries like the Dominican Republic, where the newborn mortality rate is 21.
This illustrates that the existence of political will to invest in strong health systems that
prioritize newborns and reach the poorest and most marginalized is critical and can
make a major difference, even where resources are constrained.

                                  EVERY CHILD ALIVE The urgent need to end newborn deaths   1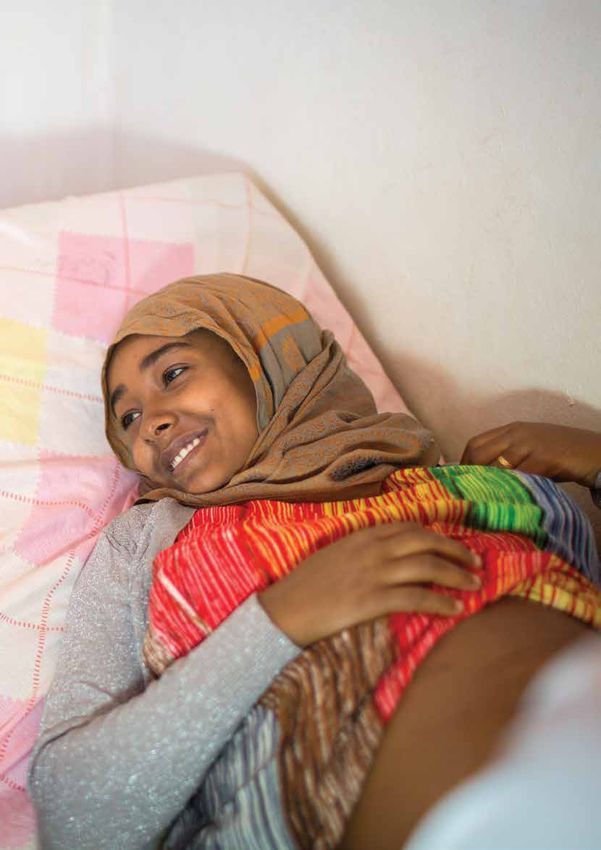
Executive summary

Moreover, national mortality rates often mask variations within countries:
Babies born to mothers with no education face almost twice the risk of dying
during the newborn period as babies born to mothers with at least a secondary
education. Babies born to the poorest families are more than 40 per cent more
likely to die during the newborn period than those born to the least poor.4

If we consider the root causes, these babies are not dying from medical causes
such as prematurity or pneumonia. They are dying because their families are
too poor or marginalized to access the care they need. Of all the world’s
injustices, this may be the most fundamental.

The good news is that progress is possible, even where resources are scarce.
Successes in countries like Rwanda offer hope and lessons for other countries
committed to keeping every child alive. Specifically, they show that two steps
are critical:
1 Increasing access to affordable health care
2 Improving the quality of that care

Low levels of access to maternal and newborn health services provided by
skilled health providers correlate strongly with high newborn mortality rates.
In Somalia, a country with one of the world’s highest newborn mortality rates
(39), there is only one doctor, nurse or midwife for every 10,000 people.
In the Central African Republic, where the newborn mortality rate is 42,
there are only three. In comparison, Norway, which has a newborn mortality
rate of 2, has 218 skilled health workers per 10,000 people. Brazil,
an upper-middle-income country with a newborn mortality rate of 8, has 93.

Improving access to maternal and newborn health services is therefore a               Quality of care
necessary first step in bringing down rates of newborn mortality. And yet,            Quality of care is defined as
if the quality of services is inadequate, the mere presence of a health facility or   the extent to which health-care
                                                                                      services improve desired health
health worker is not enough to make the difference between life and death.            outcomes. To achieve quality
                                                                                      care and improve outcomes,
Saving lives is never simple, and no single government or institution,                doctors, nurses and midwives
acting alone, will meet the challenge of ending preventable newborn deaths.           must have the training,
                                                                                      resources and incentives to
Indeed, providing affordable, quality health care for every mother and baby,          provide timely, effective and
starting with the most vulnerable, will require:                                      respectful treatment for every
                                                                                      mother and every child.
• Place: Guaranteeing clean, functional health facilities equipped with
  water, soap and electricity within the reach of every mother and baby               To drive progress on quality of
                                                                                      care, reduce preventable
• People: Recruiting, training, retaining and managing sufficient numbers of          maternal and newborn illness
  doctors, nurses and midwives with the competencies and skills needed to             and death, and improve every
                                                                                      mother’s experience of care,
  save newborn lives                                                                  WHO and UNICEF in 2017
                                                                                      launched the Quality of Care
• Products: Making the top 10 life-saving drugs and articles of equipment             Network, dedicated to
  available for every mother and baby (see Figure 6)                                  improving the quality of care
                                                                                      for maternal, newborn and
• Power: Empowering adolescent girls, mothers and families to demand and              child health.
  receive quality care

  2   EVERY CHILD ALIVE The urgent need to end newborn deaths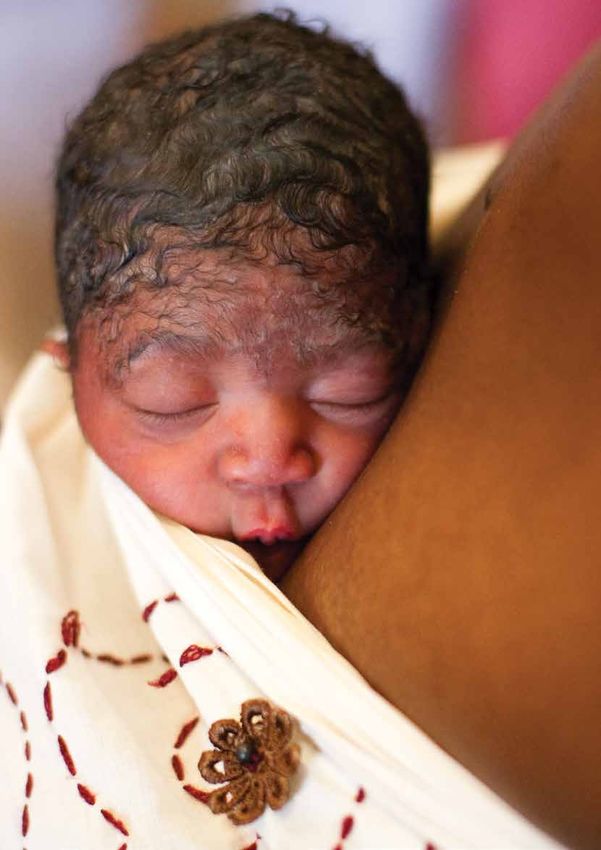
Executive summary

Universal Health Coverage          UNICEF’s global Every Child ALIVE campaign is an urgent appeal to
Universal health coverage is       governments, businesses, health-care providers, communities and individuals
defined as a situation in which    to fulfil the promise of universal health coverage5 (UHC) and keep every child
all people have access to health
services that not only treat       alive. The campaign, which aims to build consensus for the principle that every
illness, but also promote good     mother and every baby deserves affordable, quality care, supports UNICEF
health and prevent people from     and partners as we work together to realize the promise of Place, People,
getting sick in the first place.
Universal health coverage
                                   Products and Power in 10 focus countries: Bangladesh, Ethiopia,
is also about ensuring that        Guinea-Bissau, India, Indonesia, Malawi, Mali, Nigeria, Pakistan and the
services are of high quality       United Republic of Tanzania. Together, these countries account for more than
and that people do not suffer      half of the world’s newborn deaths.
financial hardship when paying
for them.
                                   You can learn more about the campaign and how you can help by visiting
                                   www.unicef.org/every-child-alive. Every effort to save newborn lives, no matter
                                   how big or small, can keep newborns alive. No child should lose their chance
                                   to survive and thrive so early in life. And no parent should have to watch a child
                                   suffer or die – especially when the solutions needed to keep them alive and
                                   healthy exist.

                                                          EVERY CHILD ALIVE The urgent need to end newborn deaths   3
The challenge of keeping
                                   Every Child Alive

  Newborn deaths now               Around the world, an estimated 7,000 newborn babies die every day. More
  account for a greater,           than 80 per cent of those deaths are the result of causes that could have been
  and growing, share of all        prevented with basic solutions such as affordable, quality health care delivered
  deaths among children
                                   by well-trained doctors, nurses and midwives, antenatal and postnatal nutrition
  younger than 5.
                                   for mother and baby, and clean water. While newborn mortality rates have
                                   fallen in recent decades, they still lag behind the impressive gains made for
                                   children 1 month to 5 years old. Between 1990 and 2016, the mortality rate in
                                   this age group dropped by 62 per cent – almost two thirds. In contrast, the
                                   newborn mortality rate declined by only 49 per cent. As a result, newborn
                                   deaths now account for a greater, and growing, share of all deaths among
                                   children younger than 5.

Figure 1                           a) Mortality rates                                                                                b) Number of deaths
Mortality rates and deaths,                                                   100                                                                         15
1990–2016
                              Mortality rate (deaths per 1,000 live births)

                                                                                     93
                                                                                                                                                               12.6
                                                                               80
                                                                                                                                                                      11.3

                                                                                                                                                          10                 9.9
                                                                                                                                      Deaths (millions)

                                                                               60
                                                                                                                                                                                     8.3

                                                                                                                                                                                           7.0
                                                                               40                                           41
                                                                                     37                                                                                                          5.6
                                                                                                                                                           5   5.1
                                                                                                                                                                      4.5
                                                                                                                                                                             4.0
                                                                                                                                                                                     3.5
                                                                               20                                           19                                                             3.1
                                                                                                                                                                                                 2.6

                                                                                0                                                                          0
                                                                                      1990 1995 2000 2005 2010           2016                                  1990 1995 2000 2005 2010          2016

                                                                                          Under-five mortality rate                                              Under-five deaths
                                                                                          Newborn mortality rate                                                 Newborn deaths

                                   Note:                                            The estimates generated by the United Nations Inter-agency Group for Child Mortality Estimation are
                                                                                    made following annual consultations with Member States, and may differ from their official statistics
                                                                                    because the IGME estimates are standardized, based on all sources of data from the country available in
                                                                                    July 2017, and extrapolated forward to the year 2016.
                                   Source: United Nations Inter-agency Group for Child Mortality Estimation, 2017.

                                   Two main factors help explain this alarming pattern. First, the primary causes
                                   of newborn deaths include prematurity, complications around the time of birth,
                                   and infections such as sepsis, meningitis and pneumonia. These causes are
                                   mostly preventable, but often cannot be treated by a single drug or
                                   intervention. They require a system-wide approach.

                                   Second, and just as important, there has been a lack of global focus on the
                                   challenge of ending newborn mortality.

                                                                                                            EVERY CHILD ALIVE The urgent need to end newborn deaths                                5
The challenge of keeping Every Child Alive
Diarrhoea 1% Preterm birth Figure 2
complications 35%
Tetanus 1% Causes of newborn
Pneumonia 6% deaths, 2016
Other 7%
Congenital
abnormalities 11%
Intrapartum-related
events 24%
Sepsis or menigitis 15%
Note: Estimates are rounded and therefore may not add up to 100 per cent. Preterm birth complications refer
to complications occurring before the time of birth; intrapartum-related events are complications
occurring during the birth process.
Source: WHO and Maternal and Child Epidemiology Estimation Group (MCEE). 2018. Estimates for child causes
of death 2000-2016
Stillbirth: A tragedy shrouded in silence Special attention for
small and sick newborns
Just as the number of newborns who die during the first month is far too high, Every year, an estimated
so is the number of babies who are stillborn – born without signs of life. Every 15 million babies are born
preterm, in advance of
year, an estimated 2.6 million babies are stillborn, the vast majority in low- and 37 weeks of gestation.
middle-income countries. Half of the babies who are stillborn are alive at the
Preterm births expose mothers
start of labour.6 and babies to a host of
potentially fatal complications,
These deaths typically are not counted by public health systems or including low birthweight.
policymakers. In most cases, stillborn babies do not receive an official birth or And preterm babies who
survive the newborn phase
death certificate. Although they leave no official record, each loss leaves an often endure life-long
indelible imprint on the hearts of parents and families. complications, including
stunted growth and
And while global targets for newborn and child survival exist in the Sustainable learning disabilities.
Development Goals (SDGs), there is no target specific to stillbirth. Stillborn Data from around the world
babies and their parents deserve better. Recognizing this as a situation in need show a strong correlation
between the quality of
of correction, UNICEF calls on world leaders to take steps to make sure that postnatal care and the survival
every stillbirth is counted, and to set out and commit to ambitious targets on of high-risk newborns.
reducing stillbirth. A frequently mentioned
example of an intervention that
improves survival is Kangaroo
Many of the interventions and approaches that prevent newborn deaths can Mother Care, or early and
prevent stillbirths as well. The Every Newborn Action Plan, a comprehensive regular skin-to-skin contact
initiative launched in 2014 to prevent newborn mortality and stillbirth, between mother and baby.
estimated that the lives of 3 million mothers, newborns and stillborn babies Training health workers and
could be saved each year by improving care around the time of birth and implementing evidence-based
approaches like Kangaroo
providing special care for small and sick newborns.7 Mother Care at scale will
greatly reduce the risks to
preterm babies and help keep
Every Child Alive.
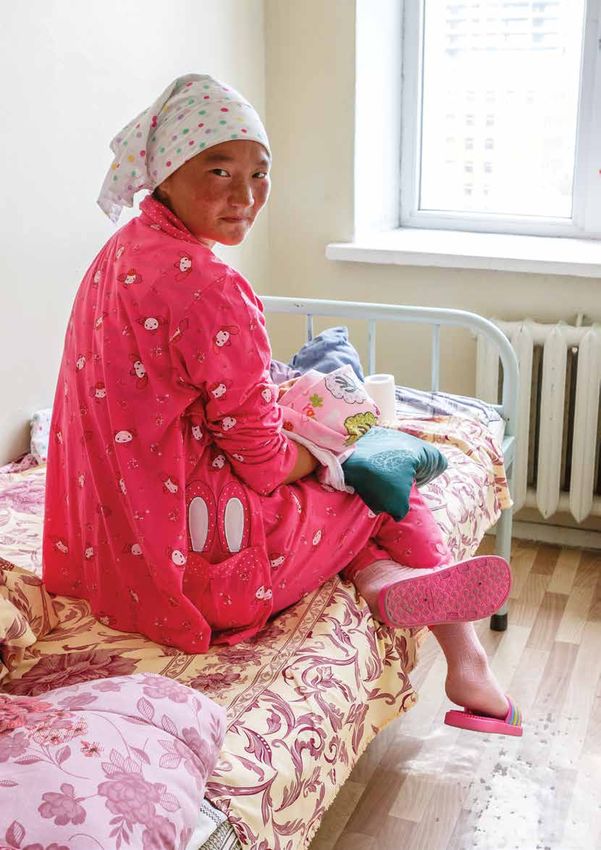
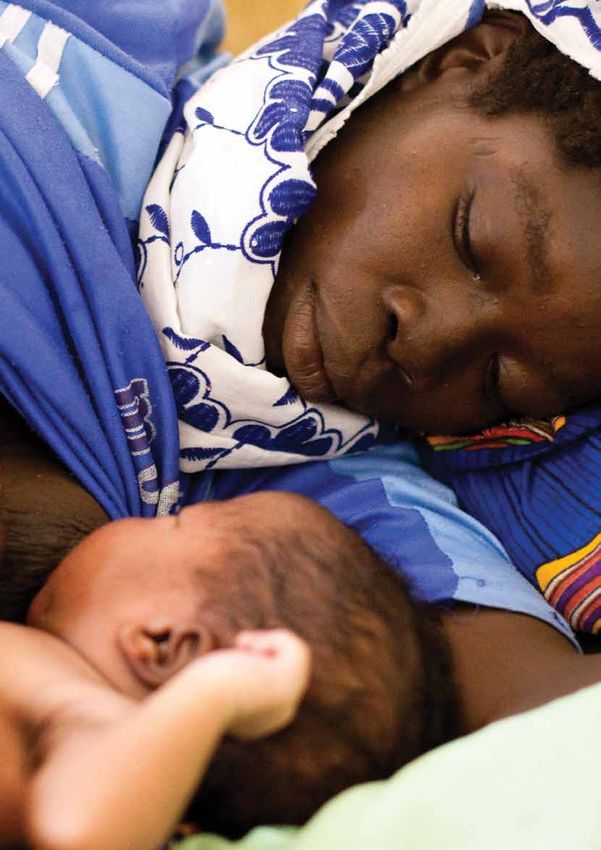
6 EVERY CHILD ALIVE The urgent need to end newborn deathsETHIOPIA Hawa Mustafa, 29, holds her 6-month old daughter, Muna Ibrahim, at a UNICEF-supported health centre in the remote Benishangul-Gumuz region of Ethiopia. Hawa’s first child was delivered at home and died almost immediately after being born. Her four other children, including Muna, were delivered at the health centre. While still above the national average, Benishangul-Gumuz’s newborn mortality rate fell by nearly 50 per cent between 2000 and 2016, from 65 deaths for every 1,000 live births to 35 deaths for every 1,000 live births. The improvement is due in part to the increasing number of women delivering their babies at centres like this one. Hawa’s story, as told to UNICEF staff: Ten years ago, I was pregnant with my first child. I laboured through intense pain for two days and delivered a baby boy, Mahmoud. He died right away. The heartbreak was unbearable. For six months, I couldn’t leave the house. My husband and family had to fetch the firewood and water. I know that if I’d delivered Mahmoud at the health centre, they would have been able to save him. I have four children now, all delivered here, and seeing them alive fills me with joy. It doesn’t matter if they’re screaming or fussing – I’m grateful that they’re alive. One day, maybe one of them will become a doctor.
Where babies are dying

                               Rates of newborn mortality vary among and within countries. In many
                               countries, there is little risk that a mother or baby will die during childbirth or
                               soon after. In others, the days before, during and after the birth are fraught
                               with danger.

                               The riskiest places to be born
                               Pakistan is the riskiest place to be born as measured by its newborn mortality
                               rate. For every 1,000 babies born in Pakistan in 2016, 46 died before the end
                               of their first month – a staggering 1 in 22. Of the 10 countries with the highest
                               newborn mortality rates, eight are in sub-Saharan Africa and two are in
                               South Asia.

Figure 3a                       Countries with highest
Countries with the highest      newborn mortality rates                Newborn mortality rate               Skilled health professionals
newborn mortality rates         in 2016                              (deaths per 1,000 live births)            per 10,000 population
in 2016, and the number of
                                Pakistan                                     45.6 [33.9, 61.5]                          14 (2014)
skilled health professionals
per 10,000 population           Central African Republic                     42.3 [25.7, 68.6]                            3 (2009)

                                Afghanistan                                  40.0 [31.6, 48.9]                            7 (2014)

                                Somalia                                      38.8 [19.0, 80.0]                            1 (2014)

                                Lesotho                                      38.5 [25.5, 55.6]                            6 (2003)

                                Guinea-Bissau                                38.2 [25.8, 55.2]                            7 (2009)

                                South Sudan                                  37.9 [20.5, 67.3]                             no data

                                Côte d’lvoire                                36.6 [26.3, 50.3]                            6 (2008)

                                Mali                                         35.7 [20.1, 60.7]                            5 (2010)

                                Chad                                         35.1 [27.4, 44.3]                            4 (2013)

                               Note:   Newborn mortality rates are estimates with uncertainty ranges. Numbers in brackets present the lower
                                       and upper uncertainty bounds of 90 per cent uncertainty intervals of the newborn mortality rate.
                                       Rankings are based on median estimates of newborn mortality rates (deaths per 1,000 live births),
                                       which do not account for uncertainties. As such, ranking positions are subject to change. Table excludes
                                       countries with fewer than 1,000 live births in 2016 or less than 90,000 total population. The estimates
                                       generated by the United Nations Inter-agency Group for Child Mortality Estimation are made following
                                       annual consultations with Member States, and may differ from their official statistics because the IGME
                                       estimates are standardized, based on all sources of data from the country available in July 2017, and
                                       extrapolated forward to the year 2016.
                               Source: United Nations Inter-agency Group for Child Mortality Estimation, 2017, WHO Global Health Workforce
                                       Statistics 2016 Update http://www.who.int/hrh/statistics/hwfstats/en/, accessed 30 January 2018.

                                                              EVERY CHILD ALIVE The urgent need to end newborn deaths                      11
Where babies are dying
Newborn mortality rate Skilled health
Figure 3b
Countries with lowest newborn (deaths per professionals per Countries with the lowest
mortality rates in 2016 1,000 live births) 10,000 population newborn mortality rates
in 2016, and the number of
Japan 0.9 [0.8, 1.0] 131 (2012)
skilled health professionals
Iceland 1.0 [0.7, 1.4] 201 (2015) per 10,000 population
Singapore 1.1 [1.0, 1.3] 76 (2013)
Finland 1.2 [0.9, 1.4] 175 (2012)
Estonia 1.3 [1.1, 1.6] 93 (2014)
Slovenia 1.3 [1.1, 1.6] 114 (2014)
Cyprus 1.4 [1.1, 1.9] 64 (2014)
Belarus 1.5 [1.2, 1.8] 150 (2014)
Republic of Korea 1.5 [1.4, 1.7] 79 (2014)
Norway 1.5 [1.3, 1.8] 218 (2014)
Luxembourg 1.5 [1.1, 2.0] 152 (2015)
Note: Newborn mortality rates are estimates with uncertainty ranges. Numbers in brackets present the lower
and upper uncertainty bounds of 90 per cent uncertainty intervals of the newborn mortality rate.
Rankings are based on median estimates of newborn mortality rates (deaths per 1,000 live births),
which do not account for uncertainties. As such, ranking positions are subject to change. Table excludes
countries with fewer than 1,000 live births in 2016 or less than 90,000 total population. Table includes
11 countries as Belarus, Republic of Korea, Norway and Luxembourg have the same newborn mortality
rate (1.5). The estimates generated by the United Nations Inter-agency Group for Child Mortality Esti-
mation are made following annual consultations with Member States, and may differ from their official
statistics because the IGME estimates are standardized, based on all sources of data from the country
available in July 2017, and extrapolated forward to the year 2016.
Source: United Nations Inter-agency Group for Child Mortality Estimation, 2017, WHO Global Health Workforce
Statistics 2016 Update http://www.who.int/hrh/statistics/hwfstats/en/, accessed 30 January 2018.
Eight of the countries with the highest newborn mortality rates are considered
fragile states.8 In these countries, crises including conflict, natural disasters,
instability and poor governance have often impaired health systems and
hampered the ability of policymakers to formulate and implement policies that
promote newborn survival.
However, there is a difference between newborn mortality rates and the
number of newborns who die each year. In countries with large numbers
of newborns, the mortality rates may be lower than in countries with fewer
newborns, but the actual number of deaths is higher. In these countries, scaled
up action to prevent newborn deaths, focusing particularly on the poorest and
most marginalized, will be critical for success in global efforts to end
preventable newborn mortality.
12 EVERY CHILD ALIVE The urgent need to end newborn deathsWhere babies are dying
Figure 4 Number of Share of Newborn
The 10 countries with the Countries with the largest newborn all global mortality rate
highest number of newborn number of newborn deaths deaths (in newborn (deaths per 1,000
deaths in 2016, and in 2016 thousands) deaths (%) live births)
newborn mortality rates India 640 24 25.4 [22.6, 28.4]
Pakistan 248 10 45.6 [33.9, 61.5]
Nigeria 247 9 34.1 [24.7, 46.3]
Democratic Republic of the Congo 96 4 28.8 [19.5, 41.5]
Ethiopia 90 3 27.6 [21.7, 35.2]
China 86 3 5.1 [4.3, 6.0]
Indonesia 68 3 13.7 [10.7, 17.5]
Bangladesh 62 2 20.1 [17.7, 22.5]
United Republic of Tanzania 46 2 21.7 [17.2, 27.6]
Afghanistan 46 2 40.0 [31.6, 48.9]
Note: Numbers in brackets present the lower and upper uncertainty bounds of 90 per cent uncertainty
intervals of the newborn mortality rate. Excludes countries with fewer than 1,000 live births in 2016 or
less than 90,000 total population. The estimates generated by the United Nations Inter-agency Group for
Child Mortality Estimation are made following annual consultations with Member States, and may differ
from their official statistics because the IGME estimates are standardized, based on all sources of data
from the country available in July 2017, and extrapolated forward to the year 2016.
Source: United Nations Inter-agency Group for Child Mortality Estimation, 2017.
The safest places to be born
At the other end of the spectrum, Japan, Iceland and Singapore are the three
safest countries in which to be born, as measured by their newborn mortality
rates. In these countries, only 1 in 1,000 babies dies during the first 28 days.
A baby born in Pakistan is almost 50 times more likely to die during his or her
first month than a baby born in one of these three countries.
Countries such as Japan, Iceland and Singapore have strong, well-resourced
health systems, ample numbers of highly skilled health workers, a
well-developed infrastructure, readily available clean water and high standards
of sanitation and hygiene in health facilities. Public health education, combined
with very high standards of medical care, guarantee universal access to quality
health care at all ages, and general standards of nutrition, education and
environmental safety are also high. These factors likely all contribute to very
low newborn mortality rates.
On average, high-income countries have a newborn mortality rate of 3,
compared with 27 for low-income countries. This gap is significant: If every
country brought its newborn mortality rate down to the high-income average,
or below, by 2030, 16 million newborn lives could be saved.
A country’s income level does not explain the whole story, however. Trinidad
and Tobago, a high-income country, has a newborn mortality rate of 13,
comparable to mortality rates in some lower-middle- and low-income countries.
Kuwait and the United States, high-income countries, report a newborn
mortality rate of 4, only slightly better than the rates in lower-middle-income
countries like Ukraine and Sri Lanka, which have mortality rates of 5. Equatorial
Guinea, an upper-middle-income country, has a newborn mortality rate of 32,
placing it among the 20 countries with the highest newborn mortality rates.
EVERY CHILD ALIVE The urgent need to end newborn deaths 13Where babies are dying
While high levels of income mean that financial resources exist to invest in
strong health systems, there is also a need for strong political will to direct
those investments. Such political will is not always present. Equally, when
resources are scarce, strong political commitment can ensure that the limited
resources that do exist are invested judiciously to build strong health systems
that prioritize newborns and reach the poorest and most marginalized.
Just as newborn mortality rates vary by country, so does progress in reducing
these rates. Some low- and lower-middle-income countries have achieved
impressive reductions in mortality rates despite limited resources. The
achievement of Rwanda, a low-income country, in reducing its newborn
mortality rate from 41 in 1990 to 17 in 2016 was made possible by a committed
government that took an active role in implementing a national insurance
scheme that reached the poorest, most vulnerable mothers. Rwanda also
instituted a comprehensive certification system for health facilities tailored to
the needs of local communities and accountable to local authorities.9, 10, 11
The risk to newborns varies among and
within countries
National averages mask variations within countries. Babies born to the poorest
families are more than 1.4 times more likely to die during the newborn period
than those born to the richest.12 Babies born to mothers with no education face
almost twice the risk of dying as newborns as babies born to mothers with at
least a secondary education.
In other words, babies are dying not just from medical causes such as
prematurity and pneumonia. They are dying because of who their parents are
and where they are born – because their families are too poor or marginalized
to access the care they need.
By household wealth quintile By mother’s education By residence Figure 5
41
Newborn mortality rate
by household wealth
36
34 35 quintile, mother’s education
32
30 31 and residence
25 25
22
Lowest Second Middle Fourth Highest No Primary Secondary Rural Urban
education or higher
Note: Analysis based on data from MICS or DHS surveys conducted since 2005. In countries which have
conducted multiple surveys during this period, data from the most recent survey are used. Wealth
quintile data are based on 57 surveys; data on mother’s education on 64 surveys; and data on residence
on 65 surveys.
Source: UNICEF analysis based on MICS and DHS.
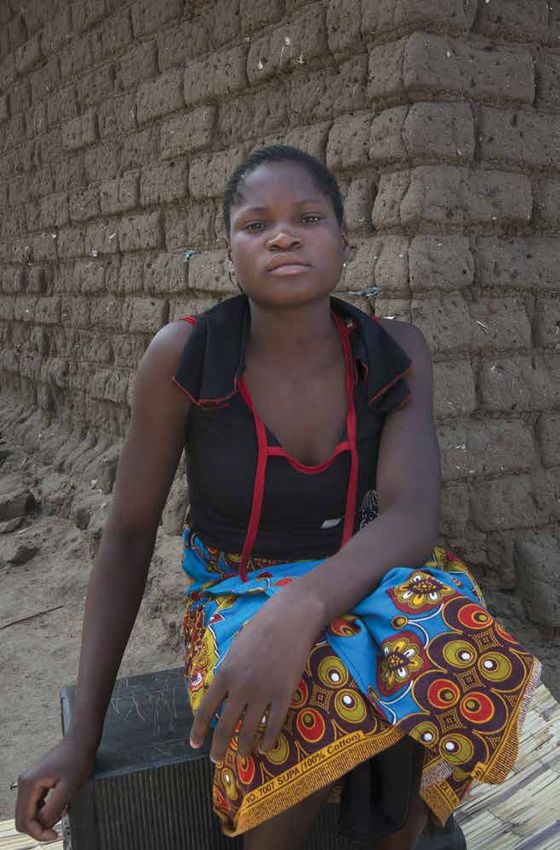
14 EVERY CHILD ALIVE The urgent need to end newborn deathsMALAWI Mary James, 18, lives in Likangala, a rural community in Malawi. On 16 August 2017, her child was born – and died. Mary’s story, as told to UNICEF staff: I felt like my heart was breaking. I had a name for the child but he never opened his eyes and he never cried, so we kept the name to ourselves. I told my sister that labour had started so we walked to the health centre. It is a long journey from here to the hospital and we went there on foot. When the child was delivered, he was so weak, he did not even cry. The staff did everything they could to save him. But in the evening, they told me the child is dying. I think it happened because there were not enough medical staff. When I see my friends’ children, I hope that one day I will be able to have a child of my own.
An agenda for action

                                      The hard-won progress in many low- and lower-middle-income countries offers
                                      valuable insights into what it will take to keep Every Child Alive.

                                      Expanding access to health services is critical
                                      Improving access to maternal and newborn health services is a necessary first
                                      step in bringing down rates of newborn mortality. For example, it is critical to
                                      have an adequate number of competent health-care workers, backed by
                                      facilities with the capacity to deal with the main causes of newborn mortality,
                                      easily accessed by communities. In most cases, the odds of survival increase
                                      dramatically when women give birth with the support of a skilled health
                                      attendant or in a health facility. In the Central African Republic, a country long
                                      beset by conflict, political instability and scarce resources, roughly half of all
                                      mothers do not deliver in a health facility. The country’s newborn mortality rate
                                      remains high, having fallen only slightly from 49 in 2000 to 42 in 2016.

The importance                        In contrast, Malawi, a low-income country, dramatically improved access to
of nutrition                          health services for mothers and newborns and achieved a commensurate
Millions of women enter               improvement in newborn survival. In 2000, just over half of women giving birth
pregnancy malnourished.
In addition to the risk this
                                      in Malawi did so with the support of a doctor, nurse or midwife. With steady
poses to the mother’s health,         support from policymakers and partners and an emphasis on building strong
nutritional deficiencies can          community health systems, the country increased that figure to 90 per cent
jeopardize the growth and             in 2016.13 From 2000 to 2016, Malawi’s newborn mortality rate also fell from
survival of her baby. In low- and
middle-income countries, one          41 to 23, a 44 per cent drop.14
in five babies is born too small
for its gestational age or has a
birthweight that is lower than
recommended. This form of
                                      Access is not enough – quality is key
malnutrition is linked to more        Access to health services is not enough, however. Equally important is the
than 20 per cent of newborn
deaths in these countries.15          quality of care. Supporting early initiation of breastfeeding is one of the ways
                                      health-care workers can help protect the lives of newborns. In countries like
After birth, breastmilk is a
baby’s first vaccine – the first      Rwanda and Nepal, where rates of early initiation of breastfeeding have
and best protection against           improved dramatically, newborn mortality has also fallen rapidly.16 And yet, in
illness and disease. It is critical   some countries, women attended at birth by a doctor, nurse or midwife have
that health workers provide
adequate nutritional counselling      lower rates of breastfeeding within the first hour after birth, when compared to
to mothers during pregnancy.          deliveries where a skilled attendant is not present.
Health workers can also
provide the essential support         In the Middle East and North Africa region, for example, the rate of early
that mothers need to begin
breastfeeding immediately             initiation of breastfeeding for births attended by a skilled health worker is
after delivery and continue           45 per cent compared with 58 per cent for births not attended by a skilled
exclusively for the first six         health worker.17 There are various reasons for this counter-intuitive finding:
months of their babies’ lives.
                                      Often health-care workers do not have the time, knowledge or skills to
                                      overcome misconceptions about breastfeeding or to support mothers who
                                      struggle to nurse. Additionally, they may follow practices that make
                                      breastfeeding more challenging, such as routinely separating newborns from
                                      their mothers immediately after birth for reasons such as assessment or
                                      washing, or feeding the baby another food or liquid in place of breastmilk.

                                                             EVERY CHILD ALIVE The urgent need to end newborn deaths   19
An agenda for action In any case, the consequences are grave: Delaying breastfeeding by 2–23 hours after birth increases the risk that a newborn will die by more than two fifths. Delaying it by 24 hours or more increases the risk by almost 80 per cent.18 Quality is not just about whether resources and services exist, but how they are deployed. Are facilities clean, equipped with running water and electricity? Are health workers adequately trained, paid and supervised? Do they have access to ample supplies of life-saving drugs and equipment, provided in a timely manner? And are mothers – particularly adolescent mothers – treated with dignity and respect? Far too often, poor and marginalized communities contend with poor quality health services. This, in turn, undermines their confidence in the local health system and drives down demand for services. Quality is also about health workers believing that the life of every mother and baby is worth saving, regardless of income, age, ethnicity, religion and social or cultural norms. It depends on communities and families sharing this belief and expecting that health-care providers will do everything possible to keep mothers and babies healthy. Unless quality of care is prioritized, the mere presence of a health facility or health worker will often not be enough to make the difference between life and death. In Pakistan, for example, the percentage of mothers who give birth in a health facility increased from 21 per cent to 48 per cent between 2001 and 2013, and the proportion of women giving birth with a skilled attendant more than doubled, from 23 per cent to 55 per cent over the same period.19 But despite these remarkable increases, largely the result of rapid urbanization and the proliferation of private sector providers not subject to satisfactory oversight, Pakistan’s very high newborn mortality rate fell by less than one quarter, from 60 in 2000 to 46 in 2016. The way forward Giving every newborn a fair chance to survive and thrive requires strong cooperation among governments, businesses, health-care providers, communities and families. These actors need to come together to demand and provide affordable, quality health care for every mother and baby, starting with the most vulnerable. During pregnancy, birth and the first days and weeks of life, that care must include access to clean, functional health facilities staffed by skilled health workers with access to essential drugs and equipment. What is required are the Places, People, Products and Power to provide universal health coverage and hold policymakers and providers accountable for the quality of services. 1 Place: Clean, functional health facilities Community-based health facilities can serve as the backbone of strong national health systems. To do so, however, they must be accessible and hospitable to all community members 24 hours a day, 7 days a week. They need uninterrupted clean water, sanitation facilities, and electricity. And they must be subject to routine supervision of cleanliness, staff performance and financial health. 20 EVERY CHILD ALIVE The urgent need to end newborn deaths
An agenda for action

                            Too often, health facilities and health-care workers are restricted by seemingly
                            simple factors such as inadequate water and sanitation. One study found that
                            35 per cent of health facilities in 54 countries did not have water and soap for
                            handwashing.20 Without even the most basic standards of hygiene, mothers
                            and babies are at risk of disease and infection. Simple upgrades like clean
                            toilets and functional handwashing stations make families more willing to visit
                            health facilities to access services, while also setting an important example for
                            them to replicate at home.21

                            As countries work to keep Every Child Alive, guaranteeing access to clean,
                            functional health facilities equipped with water, soap and electricity, within easy
                            reach of every mother and baby, should be a top priority.

                            2 People: Well-trained health-care workers
                            A trained pair of hands can keep a newborn alive. Indeed, doctors, nurses and
                            midwives provide an enormous range of services during pregnancy, birth and
                            beyond. These include: antenatal care, micronutrient supplementation, delivery
                            support, emergency obstetric care, postnatal care and treatment for small and
                            sick newborns, support for early and exclusive breastfeeding, and vaccination.

A trained pair of hands     An analysis by the World Health Organization found that meeting the
can keep a newborn alive.   Sustainable Development Goal for health and well-being would require
                            countries to have an estimated 44.5 doctors, nurses or midwives for every
                            10,000 people.22 Yet in the 10 countries with the highest rates of newborn
                            mortality, there are, on average, just 11 skilled health workers for every
                            10,000 people – far below the recommended minimum. In Somalia, there is
                            only one doctor, nurse or midwife for every 10,000 people. In contrast, in the
                            countries with the lowest rates of newborn mortality, there are, on average,
                            120 skilled health workers per 10,000 people, well above the recommended
                            minimum. In Norway, there are 218 doctors, nurses or midwives for every
                            10,000 people. Brazil, a middle-income country, has 93.

                            In addition to having sufficient numbers of skilled health workers, those
                            workers must be adequately trained, paid and supervised – as the
                            breastfeeding example (see page 19) demonstrates.

                            3 Products: Life-saving drugs and equipment
                            To provide quality care, skilled health workers need drugs, products and
                            equipment to address the most common causes of stillbirth and newborn
                            death. Some of these supplies are sophisticated, but many are simple. A piece
                            of cloth, for example, can be used to wrap a newborn onto his or her mother,
                            keeping the baby warm and promoting breastfeeding. Without this simple
                            product, a premature baby may not get the warmth and nutrition needed to
                            grow stronger in the first days of life. As a result, baby and mother may be kept
                            in a health facility for longer than necessary, increasing the risk of infection.
                            Frequently, however, these simple supplies are out of stock when needed.
                            Together, governments and businesses can help make the top 10 life-saving
                            products, drugs and articles of equipment available for every mother and baby
                            (see Figure 6).

                                                    EVERY CHILD ALIVE The urgent need to end newborn deaths    21
An agenda for action
Figure 6
Ambu-bags, used to manually resuscitate newborns who fail to breathe after birth The 10 most critical
products for newborn
Antibiotics to treat mothers and newborns who have infections survival
Blankets and cloth to keep the baby warm and support skin-to-skin contact,
including during breastfeeding
Chlorhexidine, a broad-spectrum antiseptic used to prevent infection of the umbilical
cord, which can lead to sepsis
Continuous positive airway pressure (CPAP) machines for premature babies whose
underdeveloped lungs make it difficult for them to breathe
Oxygen concentrator equipment, used to help very low-birthweight babies breathe
Phototherapy machines to reduce jaundice in newborns
Micronutrient supplements, especially iron and folic acid to prevent iron deficiency
anaemia in pregnant women and reduce the risk of low-birthweight babies and
complications at birth
Tetanus toxoid vaccine to prevent tetanus infection, which can result from
unhygienic birth conditions
Thermometers, used to closely monitor the temperature of sick newborns
4 Power: Dignity, respect and accountability
Empowering women and girls to make the best decisions for themselves and
their families and treating them with dignity and respect during pregnancy, birth
and beyond are critical components of quality care. Indeed, there is a strong
link between newborn mortality and the empowerment of girls and women.
In countries with the highest rates of newborn mortality, women often have
low levels of education, political participation and economic empowerment,
compared with men. Adolescent girls are particularly vulnerable: Their babies
are more likely to be small and have a significantly higher risk of dying during
the newborn period.23
A range of policies and interventions can help to empower adolescent girls,
mothers and families to demand and receive quality care. These include sexual
and reproductive health education, cash transfers to promote access to health
and nutrition services, efforts to solicit feedback from girls and women about
the health and nutrition services they receive and legally mandated policies for
family leave after the birth of a child.
22 EVERY CHILD ALIVE The urgent need to end newborn deathsKeeping Every Child Alive
When we talk in the cold language of statistics – of rates, averages,
percentages, indicators – it is easy to forget that we are talking about the lives
and deaths of real babies – babies who deserve to survive, to grow up healthy
and contribute to their societies. This report shines a light on the fact that
millions of newborn babies are denied this opportunity, dying too soon from
causes that are almost all preventable.
Action in the four areas outlined in this report – Place, People, Products,
Power – must be an urgent priority for every government, driving forward
progress towards a world with universal health coverage, where no newborn
dies of a preventable cause.
EVERY CHILD ALIVE The urgent need to end newborn deaths 25KYRGYZSTAN Dr. Baktygul watches Jiydegul hold her newborn son, Nurdan. After two days in the hospital, mother and son will be ready to go home. Dr. Baktygul’s story, as told to UNICEF staff: We were ready for the birth because today in this hospital, the conditions are really good. We have been trained and are connected to water. We have new windows and electric heaters to heat the birthing room. We always need to be ready, regardless of the circumstances. We are responsible for two lives – the life of the mother and of the child.
Endnotes

1    The newborn period is 28 days. In this report, ’a month’ and the newborn period are used interchangeably.
2    United Nations Inter-agency Group for Child Mortality Estimation (UN IGME), Levels and Trends in Child Mortality:
     Report 2017, Estimates developed by the UN Inter-agency Group for Child Mortality Estimation, United Nations
     Children’s Fund, New York, 2017.
3    In the body of this report, newborn mortality rate (NMR) figures are rounded to integer values for the sake of brevity and
     ease of reading. Unrounded figures are used in tables and for the purpose of determining positions in country rankings.
     This is due to the fact that for a number of low-mortality countries, rounded NMR values are equivalent (e.g. Japan,
     Iceland and Singapore all have a rounded NMR of 1), despite small differences in unrounded NMR values (Japan 0.9,
     Iceland 1.0, Singapore 1.1).
4    United Nations Children’s Fund, Committing to Child Survival: A promise renewed – Progress report 2014, UNICEF,
     New York, September 2014.
5    World Health Organization, Universal health coverage, http://www.who.int/healthsystems/universal_health_coverage/en/
6    Lawn, Joy E et al., Stillbirths: rates, risk factors, and acceleration towards 2030, The Lancet, Volume 387, Issue 10018,
     587-603 http://www.thelancet.com/journals/lancet/article/PIIS01406736(15)00837-5/abstract
7    World Health Organization and United Nations Children’s Fund, Reaching the Every Newborn National 2020 Milestones,
     WHO 2017, p.5
8    Fragile states are those listed on the World Bank Group’s annual ‘Harmonized List of Fragile Situations’. Criteria for
     inclusion on the list are: a harmonized average country policy and institutional assessment (CPIA) rating of 3.2 or less,
     the presence of a United Nations and/or regional peacekeeping operation or the presence of a United Nations and/or
     regional peace-building and political mission. The full list with details can be found at , accessed 6 September 2017.
9    Makaka, Andrew, Sarah Breen and Agnes Binagwaho, Universal health coverage in Rwanda: a report of innovations
     to increase enrolment in community-based health insurance, The Lancet, vol. 380, Special Issue, S1–S22,
     21 October 2012.
10   Ministry of Health, Republic of Rwanda, Rwanda Community Based Health Insurance Policy, April 2010, p.5,
     http://www.moh.gov.rw/fileadmin/templates/Docs/Mutual_policy_document_final1.pdf
11   Ministry of Health, Republic of Rwanda, Rwanda Hospital Accreditation Standards, October 2014, p.5, http://www.moh.
     gov.rw/fileadmin/templates/Clinical/RWANDA_HOSPITAL_ACCREDITATION_STANDARDS-SIGNED-1.pdf
12   United Nations Children’s Fund, Committing to Child Survival: A promise renewed – Progress report 2014, UNICEF,
     New York, September 2014.
13   United Nations Children’s Fund, UNICEF Global Databases: Maternal Newborn and Child Health, Division of Data
     Research and Policy New York, January 2018.
14   United Nations Inter-agency Group for Child Mortality Estimation, Levels and Trends in Child Mortality Report 2017, p. 27.
15   Lee, A.C, et.al, Estimates of burden and consequences of infants born small for gestational age in low and middle
     income countries with INTERGROWTH-21st standard: Analysis of CHERG assets, BMJ, 2017, 358, p. j3677
16   United Nations Children’s Fund, UNICEF Global Databases: Infant and Young Child Feeding: Early initiation of
     breastfeeding, Ever Breastfed, Division of Data Research and Policy New York, January 2018.
17   United Nations Children’s Fund, From the First Hour of Life: Making the case for improved infant and young child
     feeding everywhere, UNICEF, New York, October 2016, p. 38.
18   NEOVITA Study Group, Timing of initiation, patterns of breastfeeding, and infant survival: prospective analysis of pooled
     data from three randomised trials, The Lancet Global Health, vol. 4, pp. e266–275, April 2016.
19   United Nations Children’s Fund, UNICEF Global Databases: Maternal Newborn and Child Health, Division of Data
     Research and Policy New York, January 2018.
20   World Health Organization and United Nations Children’s Fund, Water, Sanitation and Hygiene in Health Care Facilities:
     Status in low- and middle-income countries and way forward, WHO, Geneva, 2016, p. 7.
21   World Health Organization and United Nations Children’s Fund, WHO/UNICEF Report: Water, Sanitation and Hygiene
     in Health Care Facilities: status in low-and middle-income countries and way forward. 10 Key Findings, WHO,
     http://www.who.int/water_sanitation_health/publications/wash-hcf-10things.pdf, accessed 24 January 2018.
22   World Health Organization, Health Workforce Requirements for Universal Health Coverage and the Sustainable
     Development Goals, Human Resources for Health Observer, no. 17, Geneva, 2016, p.21, available at , accessed 24 January 2018. The SDG index threshold
     of 4.45 physicians, nurses and midwives [per 1,000 population] “can support the development of global estimates,
     aggregate analyses and cross-country comparisons. It should not however be used as a benchmark for planning at
     national level, as it does not reflect the heterogeneity of countries in terms of baseline conditions, health system needs,
     optimal workforce composition, skills mix. It is important that use of the SDG index threshold does not result in an
     exclusive focus on physicians and nurses/midwives while underinvesting” in other health occupations critical to
     achieving the SDG and UHC goals. WHO recommends that “every country should consider its unique epidemiology,
     demography, finances and health system set-up, and the existing numbers, distribution, and skills mix of health workers,
     in the planning of the workforce it will need to meet the SDGs by 2030.”
23   World Health Organization, Adolescent Pregnancy Factsheet, updated January 2018, http://www.who.int/mediacentre/
     factsheets/fs364/en/

                                                               EVERY CHILD ALIVE The urgent need to end newborn deaths      29
Annex Newborn mortality rates and country
ranking by income group
Low income
Rank of newborn Rank of newborn
mortality rate mortality rate
using median Newborn mortality using median Newborn mortality
Country or value (from high rate (deaths per Country or value (from high rate (deaths per
territory to low) 1,000 live births) territory to low) 1,000 live births)
Central African 1 42.3 [25.7, 68.6] Burkina Faso 17 25.6 [18.7, 34.8]
Republic
Guinea 18 25.1 [19.0, 33.2]
Afghanistan 2 40.0 [31.6, 48.9]
Haiti 19 24.6 [17.2, 34.9]
Somalia 3 38.8 [19.0, 80.0]
Burundi 20 24.2 [18.3, 31.9]
Guinea-Bissau 4 38.2 [25.8, 55.2]
Malawi 21 23.1 [17.6, 30.3]
South Sudan 5 37.9 [20.5, 67.3]
Zimbabwe 22 22.9 [17.3, 29.8]
Mali 6 35.7 [20.1, 60.7]
Liberia 23 22.8 [15.4, 33.6]
Chad 7 35.1 [27.4, 44.3]
United Republic 24 21.7 [17.2, 27.6]
Sierra Leone 8 33.2 [24.2, 44.0] of Tanzania
Comoros 9 32.8 [13.8, 71.5] Uganda 25 21.4 [17.2, 26.5]
Benin 10 31.4 [23.2, 43.5] Nepal 26 21.1 [17.4, 25.6]
Democratic 11 28.8 [19.5, 41.5] Senegal 27 20.6 [15.9, 26.7]
Republic of the
Congo Madagascar 28 18.6 [12.3, 27.4]
Ethiopia 12 27.6 [21.7, 35.2] Eritrea 29 17.7 [10.8, 29.2]
Gambia 13 27.5 [13.8, 50.2] Rwanda 30 16.5 [10.4, 26.4]
Mozambique 14 27.1 [19.6, 37.9] Democratic 31 10.7 [6.5, 15.9]
People’s Republic
Togo 15 26.0 [19.6, 33.6] of Korea
Niger 16 25.7 [17.5, 36.9]
Note: Numbers in brackets present the lower and upper uncertainty bounds of 90 per cent uncertainty intervals of the newborn mortality rate.
Tables exclude countries with fewer than 1,000 live births in 2016 or less than 90,000 total population. The income classification follows the World
Bank income classification, 2017. Details can be found at: https://datahelpdesk.worldbank.org/knowledgebase/articles/906519-world-bank-country-
and-lending-groups>, accessed on 30 January 2018. The estimates generated by the United Nations Inter-agency Group for Child Mortality
Estimation are made following annual consultations with Member States, and may differ from their official statistics because the IGME estimates are
standardized, based on all sources of data from the country available in July 2017, and extrapolated forward to the year 2016.
Source: United Nations Inter-agency Group for Child Mortality Estimation, 2017.
EVERY CHILD ALIVE The urgent need to end newborn deaths 31Annex
Lower middle income
Rank of newborn Rank of newborn
mortality rate mortality rate
using median Newborn mortality using median Newborn mortality
Country or value (from rate (deaths per Country or value (from rate (deaths per
territory high to low) 1,000 live births) territory high to low) 1,000 live births)
Pakistan 1 45.6 [33.9, 61.5] Micronesia 27 17.2 [6.7, 41.4]
(Federated
Lesotho 2 38.5 [25.5, 55.6] States of)
Côte d'Ivoire 3 36.6 [26.3, 50.3] Cambodia 28 16.2 [9.9, 26.2]
Nigeria 4 34.1 [24.7, 46.3] Sao Tome and 29 15.0 [9.4, 24.7]
Principe
Mauritania 5 33.7 [17.2, 64.4]
Guatemala 30 14.0 [11.2, 17.5]
Djibouti 6 32.8 [20.7, 50.0]
Uzbekistan 31 13.8 [10.1, 18.0]
Sudan 7 29.4 [23.0, 37.5]
Indonesia 32 13.7 [10.7, 17.5]
Angola 8 29.3 [14.5, 54.1]
Egypt 33 12.8 [9.8, 16.7]
Lao People's 9 28.7 [19.6, 40.8]
Democratic Philippines 34 12.6 [9.0, 17.6]
Republic
Republic of 35 11.9 [8.3, 17.6]
Ghana 10 26.9 [20.2, 35.8] Moldova
Yemen 11 26.8 [19.0, 37.5] Vanuatu 36 11.8 [6.9, 19.4]
India 12 25.4 [22.6, 28.4] Kyrgyzstan 37 11.6 [9.9, 13.5]
Myanmar 13 24.5 [18.0, 32.2] Viet Nam 38 11.5 [8.9, 14.6]
Cameroon 14 23.9 [17.3, 32.6] State of Palestine 39 10.8 [7.5, 15.7]
Papua New 15 23.5 [13.3, 42.0] Jordan 40 10.6 [7.3, 15.2]
Guinea
Honduras 41 10.4 [7.4, 14.5]
Zambia 16 22.9 [16.2, 31.5]
Solomon Islands 41 10.4 [7.5, 14.4]
Kenya 17 22.6 [17.8, 28.6]
Cabo Verde 43 10.2 [7.6, 13.8]
Kiribati 17 22.6 [12.3, 38.3]
Mongolia 44 9.7 [6.3, 14.5]
Timor-Leste 19 21.6 [13.4, 34.1]
Syrian Arab 45 8.9 [6.5, 12.8]
Swaziland 20 21.4 [13.6, 33.2] Republic
Congo 21 20.5 [14.3, 28.7] Nicaragua 46 8.8 [5.3, 14.5]
Bangladesh 22 20.1 [17.7, 22.5] Tunisia 47 8.1 [5.6, 11.7]
Tajikistan 23 19.9 [11.3, 35.9] El Salvador 48 7.5 [5.0, 11.4]
Bolivia 24 19.0 [13.0, 27.9] Armenia 49 7.4 [5.2, 10.4]
(Plurinational
State of) Georgia 50 7.1 [6.2, 8.3]
Bhutan 25 18.1 [12.0, 26.7] Ukraine 51 5.4 [3.5, 7.0]
Morocco 26 17.8 [12.7, 24.8] Sri Lanka 52 5.3 [4.6, 6.2]
Note: Numbers in brackets present the lower and upper uncertainty bounds of 90 per cent uncertainty intervals of the newborn mortality rate.
Tables exclude countries with fewer than 1,000 live births in 2016 or less than 90,000 total population. The income classification follows the World
Bank income classification, 2017. Details can be found at: https://datahelpdesk.worldbank.org/knowledgebase/articles/906519-world-bank-country-
and-lending-groups>, accessed on 30 January 2018. The estimates generated by the United Nations Inter-agency Group for Child Mortality
Estimation are made following annual consultations with Member States, and may differ from their official statistics because the IGME estimates are
standardized, based on all sources of data from the country available in July 2017, and extrapolated forward to the year 2016.
Source: United Nations Inter-agency Group for Child Mortality Estimation, 2017.
32 EVERY CHILD ALIVE The urgent need to end newborn deathsAnnex
Upper middle income
Rank of newborn Rank of newborn
mortality rate mortality rate
using median Newborn mortality using median Newborn mortality
Country or value (from rate (deaths per Country or value (from rate (deaths per
territory high to low) 1,000 live births) territory high to low) 1,000 live births)
Equatorial Guinea 1 32.0 [18.6, 51.4] The former 26 8.3 [6.1, 13.3]
Yugoslav
Botswana 2 25.5 [11.3, 48.4] Republic of
Macedonia
Turkmenistan 3 22.3 [9.3, 49.9]
Brazil 28 7.8 [5.4, 10.3]
Gabon 4 21.8 [14.0, 33.2]
Mexico 28 7.8 [7.2, 8.4]
Dominican 5 20.8 [15.5, 27.9]
Republic Peru 30 7.5 [5.7, 10.0]
Guyana 6 20.0 [13.2, 30.5] Thailand 31 7.3 [3.9, 12.6]
Iraq 7 18.2 [13.2, 25.1] Libya 32 7.1 [4.7, 10.5]
Azerbaijan 8 18.1 [10.7, 31.0] Tonga 33 6.8 [3.7, 11.7]
Namibia 9 17.8 [12.0, 26.5] Turkey 34 6.5 [6.1, 7.0]
Algeria 10 15.6 [13.5, 18.3] Albania 35 6.2 [3.0, 12.5]
South Africa 11 12.4 [9.9, 15.2] Argentina 35 6.2 [5.8, 6.7]
Ecuador 12 11.2 [6.6, 19.1] Kazakhstan 37 5.9 [4.7, 7.3]
Paraguay 13 11.1 [6.7, 18.4] Costa Rica 38 5.7 [3.5, 7.8]
Jamaica 14 10.9 [6.4, 18.3] China 39 5.1 [4.3, 6.0]
Suriname 15 10.6 [4.6, 23.5] Maldives 40 4.8 [3.4, 6.4]
Bosnia and 41 4.7 [4.2, 5.2]
Belize 16 10.3 [9.0, 11.8] Herzegovina
Saint Vincent and 16 10.3 [8.0, 13.0] Lebanon 41 4.7 [2.2, 8.8]
the Grenadines
Malaysia 43 4.4 [3.9, 4.9]
Venezuela 16 10.3 [8.8, 11.9]
(Bolivarian Romania 44 4.3 [3.8, 4.9]
Republic of)
Bulgaria 45 3.8 [3.5, 4.2]
Iran (Islamic 19 9.6 [6.3, 14.4]
Republic of)
Serbia 46 3.7 [3.3, 4.2]
Panama 19 9.6 [5.2, 16.8]
Russian 47 3.4 [2.5, 4.5]
Saint Lucia 21 9.2 [7.3, 11.7] Federation
Samoa 21 9.2 [5.2, 14.6] Croatia 48 2.9 [2.6, 3.3]
Fiji 23 8.8 [6.6, 11.7] Cuba 49 2.4 [2.2, 2.6]
Colombia 24 8.5 [6.4, 11.1] Montenegro 49 2.4 [2.0, 2.9]
Mauritius 25 8.4 [7.4, 9.5] Belarus 51 1.5 [1.2, 1.8]
Grenada 26 8.3 [6.4, 10.5]
Note: Numbers in brackets present the lower and upper uncertainty bounds of 90 per cent uncertainty intervals of the newborn mortality rate.
Tables exclude countries with fewer than 1,000 live births in 2016 or less than 90,000 total population. The income classification follows the World
Bank income classification, 2017. Details can be found at: https://datahelpdesk.worldbank.org/knowledgebase/articles/906519-world-bank-country-
and-lending-groups>, accessed on 30 January 2018. The estimates generated by the United Nations Inter-agency Group for Child Mortality
Estimation are made following annual consultations with Member States, and may differ from their official statistics because the IGME estimates are
standardized, based on all sources of data from the country available in July 2017, and extrapolated forward to the year 2016.
Source: United Nations Inter-agency Group for Child Mortality Estimation, 2017.
EVERY CHILD ALIVE The urgent need to end newborn deaths 33You can also read