Blackpool Local Plan Evidence Base - Topic Paper: Managing the Location of Hot Food Takeaways
←
→
Page content transcription
If your browser does not render page correctly, please read the page content below
Blackpool Local Plan Evidence Base

Topic Paper: Managing the Location of Hot
Food Takeaways

December 2020 Update

                       1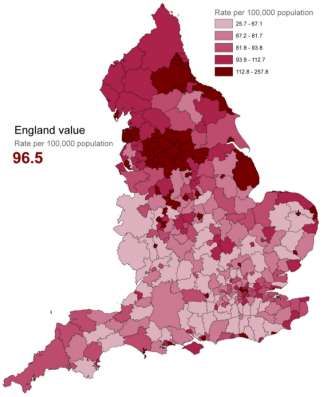
Contents
Executive Summary................................................................................................................................. 3
1.0        Introduction ................................................................................................................................ 4
2.0        Background ................................................................................................................................. 8
3.0        Planning Policy Context............................................................................................................. 10
4.0        Methodology............................................................................................................................. 15
5.0        Obesity and Health.................................................................................................................... 16
6.0        Obesity, Deprivation and Hot Food Takeaways ........................................................................ 18
7.0        Local strategies to improve health............................................................................................ 25
8.0        What have other authorities done?.......................................................................................... 26
9.0        Case Studies and Appeal Decisions ........................................................................................... 27
10.0       Discussion and Recommendations ........................................................................................... 30
Bibliography .......................................................................................................................................... 34

                                                                            2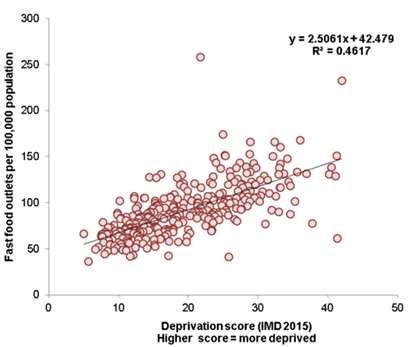
Executive Summary

National planning policy recognises the role of planning in promoting healthy communities, including
how the environment can impact on health and influence healthy lifestyle choices.

Across England there is an upward trend in the prevalence of obesity and the UK’s childhood obesity
rates are now ranked among the worst in Western Europe. Obesity contributes to a growing
prevalence of long-term conditions such as diabetes and cardiovascular disease as well as
contributing to a reduced quality of life.

The 2018/19 data from the National Child Measurement Programme indicates that Blackpool
children in Reception and in Year 6 are heavier than the national averages and the Blackpool Joint
Strategic Needs Assessment (Blackpool Health Profile 2017) (opens a new window) confirms that
75% of adults in Blackpool are overweight (compared to 63% in England) and 31% of adults are
obese (compared to 27% in England). This represents a significant proportion of the community in
Blackpool.

There is a growing global evidence base1 which indicates that policies which regulate people’s
exposure to fast food, contribute to improving diet and health.

The proliferation of hot food takeaways is a concern across Blackpool and although the availability of
fast food is not the only factor contributing to poor diet and obesity, the availability of cheap, high
density, high fat, high sugar and high salt food which is typically served in large portions, is a
contributing factor which needs to be taken in consideration as part of Blackpool’s approach to
managing weight and reducing obesity levels.

Blackpool has some of the most deprived areas in England and is the most deprived authority in the
country in terms of Health Deprivation and Disability Domain score and overall score. The Blackpool
Local Plan, Part 1: Core Strategy acknowledges the health priorities and inequalities in the town and
supports development which encourages healthy and active lifestyles.

This report identifies a direct correlation between high levels of childhood obesity, high levels of
deprivation and the high numbers of hot food takeaways in Blackpool wards, but does not identify
any particular correlation between high levels of childhood obesity and the numbers of hot food
takeaways within close proximity to schools.

Many local authorities have developed planning policies and guidance to control hot food takeaways
in response to local concerns about a proliferation of takeaways and the effect on diet, eating
behaviour and obesity, in particular childhood obesity.

1   Does neighbourhood fast-food outlet exposure amplify inequalities in diet and obesity? A cross-sectional study by The
American Journal of Clinical Nutrition, Published: 11 May 2016

                                                              3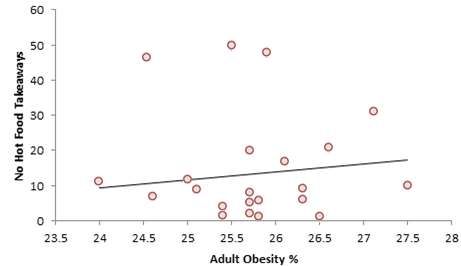
The report includes recommendations that the authority includes a policy in Part 2 of the Local Plan,
which restricts new hot food takeaway units (and prevents new restaurants from offering a hot food
takeaway service) in and around wards where there are high levels of childhood obesity.
1.0 Introduction
1.1 Obesity is a growing problem and is considered to be one of the most serious public health
challenges of the 21st century.
Key statistics:
In 2018, nearly two thirds of adults (63%) of adults in England are classed as being
overweight (a body mass index of over 25) and 27% of adults are classed as being obese
(a body mass index of over 30)2;
In 2018/19, almost a quarter of Reception children are overweight or obese and in Year
6, it is over a third3;
The obesity prevalence is higher for boys than girls in both Reception and Year 6 age
groups;
The obesity prevalence for children living in deprived areas is more than double that of
those living in the least deprived areas for both Reception and Year 6;
On average, there are more hot food takeaway outlets in deprived areas than in more
affluent areas;
People exposed to the highest number of takeaways are 80 per cent more likely to be
obese and 20 per cent more likely to have a higher Body Mass Index than those with the
lowest number of encounters4
Overweight children are much more likely to become overweight adults5
It is estimated that obesity is responsible for more than 30,000 deaths each year. On
average, obesity deprives an individual of an extra nine years of life, preventing many
individuals from reaching retirement age. In the future, obesity could overtake smoking
as the biggest cause of preventable death.6
Nearly a third of children are overweight or obese and younger generations are
becoming obese at earlier ages and staying obese for longer;
Obesity increases the risk of developing diseases and certain cancers, increases blood
pressure which is a factor in heart disease and type 2 diabetes;
The NHS in England spent an estimated £6.1 billion on overweight and obesity related ill-
health in 2014/15.
The annual spend on the treatment of obesity and diabetes is greater than the amount
spent on the police, the fire service and the judicial system combined7;
2 NHS Digital Health Survey 2015 (opens a new window)
3 NHS Digital (opens a new window)
4 Study by the British Medical Journal (opens a new window)
5 PubMed,gov article December 2015 (opens a new window)
6 Report by the National Audit Office on Obesity in England 2001 [PDF 870KB]
7 McKinsey Global Institute economic analysis of obesity [PDF 2064KB}
4 Councils are estimated to spend at least £352 million per annum on obesity related
social care costs8;
There was a 34% increase in spending on takeaway food between 2009 and 20169;
In 2016, 12.1% of all food spending was on takeaway food10;
In 2016, £9.9 billion was spent on takeaway food and this is estimated to rise to £11.2
billion by 202111;
Takeaways make up over 1/8th of the entire food services sector12
The food environment contribution to obesity:
The increasing consumption of out of home meals has been identified as an important
factor contributing to rising levels of obesity;13
The total number of takeaway food shops in England has risen by 4,000 since 2014, an
increase of 8% to 56,638 outlets14;
An analysis of the UK National Diet and Nutrition Survey found that more than a quarter
of adults and a fifth of children ate out once or more a week, and one fifth of adults and
children ate takeaway meals at home once per week or more;15
8 Making obesity everybody’s business [PDF 508KB]
9 Takeaway Economy Report 2017 (opens a new window)
10 Takeaway Economy Report 2017 (opens a new window)
11 Takeaway Economy Report 2017 (opens a new window)
12 Takeaway Economy Report 2017 (opens a new window)
13 GOV.UK Reducing Obesity: Future Choices (opens a new window)
14 Cambridge University’s Centre for Diet and Activity Research (opens a new window)
15 GOV.UK Encouraging Healthier Out of Home Food Provision (opens a new window)
5 Eating out of home foods,
and in particular fast food,
is associated with higher
levels of calories, fat and
salt;
Portion sizes for meals
eaten outside of the home
tend to be bigger;
Many pupils visit shops on
the way to or from school and the food and drink items that can be purchased are cheap
and tend to be high in calories, fat and sugar;
People in the UK are around 20% less active now than in the 1960s. If current trends
continue, we will be 35% less active by 2030;
In 2015, only 22% of children aged between 5 and 15 met the physical activity guidelines
of being at least moderately active for at least 60 minutes every day (23% of boys, 20%
of girls)16.
1.2 Given the scale and cost of obesity, and the significant burden on families, the health and
social care system, employers and society as a whole means prevention of obesity is a high
priority.
1.3 The national childhood obesity: a plan for action 2018 (opens a new window) sets out the
governments’ ambition to halve childhood obesity rates and reduce the gap in obesity
between children from the most and least deprived areas by 2030. This plan confirms that
local authorities have a range of powers and opportunities to create healthier environments,
including the power to develop planning policies to limit the opening of additional hot food
takeaway outlets close to schools and in areas of over-concentration.
1.4 Public health is a statutory responsibility for Councils and the planning system has an
important role in tackling public health issues, from making streets safer and more pleasant
to use, locating housing where there are services, reducing car dependency, creating green
spaces and protecting cultural and social facilities. Improving health and wellbeing is also a
requirement of the National Planning Policy Framework.
1.5 Local authorities in England are also beginning to use the planning system to prevent new
hot food takeaways from opening in certain areas. The aim of this approach is to restrict
access to unhealthy food, which along with other national and local authority initiatives will
assist in improving the health of the population, reducing levels of obesity and associated
preventable diseases.
1.6 This document sets out the Council’s priorities and objectives in relation to planning control
of hot food takeaways. It elaborates upon planning policies in relation to health and
wellbeing.
16
NHS Digital Health Survey 2015 (opens a new window)
61.7 Hot food takeaways (suis generis) are a different use class to restaurants or cafes (Class E),
drinking establishments (suis generis) and retail shops (Class E). Under the Town and
Country Planning (Use Classes) Order 1987 as amended, a suis generis hot food takeaway is
an establishment which primarily sells hot food for consumption off the premises.
72.0 Background
2.1 Published in October 2007, the Foresight report Tackling Obesities: Future Choices led to the
Improvement and Development Agency (IdeA) commissioning Sheffield Hallam University to
analyse the implications of the report for local government. Both reports identified the
importance of the built environment and the ability that planning has to improve access to
healthier lifestyles. The report also highlights that the environment can influence a person’s
choices for diet and activity and the access to cheap, readily available, calorie-rich food
makes it harder for an individual to lead a healthy lifestyle.
2.2 There has been an increase in the consumption of out-of-home meals which are often
cheap, convenient and available throughout the day. This has been identified as an
important factor contributing to the increase in obesity. Public Health England estimated in
2017 that there were 56,638 fast food and takeaway outlets in England, a rise of 8% since
2014. The Takeaway Economy Report 201717 commissioned by Just Eat confirms a 34%
increase in nominal expenditure on takeaway food from £7.9 billion in 2009 to £9.9 billion in
2016 and forecasts growth in the sector of up to 2.6% per annum, predicting that the
industry will be worth 11.2 billion by 2021. That report also confirms that 12.1% of total
spending on all food in the UK in 2016 was on takeaway food.
2.3 Healthy Weight, Healthy Lives [PDF 4,858KB] published in 2008 encourages local authorities
to use existing planning regulations to control more carefully the number and location of hot
food takeaway outlets.
2.4 In 2010, the Marmot Review [PDF 16,543KB] stated ”the lack of attention paid to health and
health inequalities (avoidable differences in health) in the planning process can lead to
unintended and negative consequences. A policy planning statement on health would help
incorporate health equity into planners’ roles.” The Healthy Urban Development Unit18 and
CABE19 demonstrate in numerous reports how good planning can have a positive impact on
public health and that designers can influence people’s well-being and design
neighbourhoods in a manner that promotes health and well-being.” The review goes on to
say “A new Planning Policy Statement on health could ensure that new developments are
assessed for their impact on health inequalities, for example limiting the number of hot food
takeaway outlets in a Super Output Area. This tool could help to provide a lever for local
authorities to change the way neighbourhoods are designed.”
2.5 NICE (National Institute for Healthcare Excellence) Guidance on prevention of cardiovascular
disease20 outlines that reducing salt and saturated fat intakes for the population will reduce
morbidity and mortality rates from cardiovascular disease. Furthermore it states that Trans
fats (Industrially-produced trans fatty acids (IPTFAs)) are a significant health hazard and that
sections of the population who regularly eat fried fast-food may be consuming substantially
higher amounts of Trans fats than those on a healthier, well balanced diet. This NICE
17 Takeaway Economy Report 2017 (opens a new window)
18 NHS Healthy Urban Development Unit: Using the planning system to control hot food takeaways 2013 [PDF 6363KB]
19 Design Council: Sustainable places for health and well-being [PDF 662KB]
20 NICE: Cardiovascular disease prevention 2010 (opens a new window)
8guidance also outlines that food from hot food takeaways and the ‘informal eating out
sector’ comprises a significant part of many people's diet and indicates that local planning
authorities have powers to control hot food takeaway outlets. It recommends that local
planning authorities are encouraged to restrict planning permission for hot food takeaways
and other food retail outlets in specific areas (for example, within walking distance of
schools) as well as consider the concentration of hot food takeaway outlets in specific areas
to address disease prevention. It further recommends that existing planning policy guidance
should be implemented in line with public health objectives.
2.6 Public Health England (PHE) and the Local Government Association have provided a briefing
on regulating the growth of hot food takeaway outlets21. It outlines the obesity epidemic in
England and the causal links between obesity and type 2 diabetes, raised blood pressure and
colorectal cancer. It acknowledges the complexity of the ways in which the environment
promotes obesity and explains that actions can be taken by local authorities to reduce the
extent of obesity promotion locally. It identifies that controlling the proliferation of hot food
takeaway outlets has a role to play. It is acknowledged that a causal link between hot food
takeaway outlets and obesity cannot be established but identifies that there is evidence of
associations between obesity and the availability of fast food.
2.7 PHE also published guidance Health matters: obesity and the food environment (opens a
new window) in March 2017 which outlines what role planning could have in tackling the
problem in relation to restricting the locations of new Hot Food Takeaways.
2.8 PHE and the Local Government Agency have developed a toolkit Strategies for encouraging
healthier ‘Out of Home’ food provision (opens a new window). This has been developed to
encourage local interventions that will further increase the opportunities for communities to
access healthier food whilst out and about in their local community. It outlines opportunities
both to manage new business applications and to work with existing food outlets to provide
healthier food. The toolkit has been created to support local authorities to work with
smaller food outlets such as takeaways, restaurants, bakers, sandwich and coffee shops,
mobile traders, market stalls, and corner shops.
2.9 In July 2017 PHE produced an evidence review on spatial planning for health22, providing a
resource for planning and designing healthier places23. The report provides the findings from
an evidence review examining the links between health and the built and natural
environment to help inform policy and support local action. The review concentrated on 5
built environment topics:
21 Healthy people, healthy places briefing: Obesity and the environment: regulating the growth of fast food outlets (PDF
777KB]
22 PHE Spatial Planning for Health: An evidence resource for planning and designing healthier places [PDF 2,029KB]
23 GOV.UK Spatial planning for health: evidence review 2017 (opens a new window)
9 Neighbourhood design
Housing
Access to healthier food
Natural and sustainable environment
Transport
2.10 Locally, the Joint Health and Well Being Strategy 2016-2019 (opens a new window) for
Blackpool outlines the largest health issues impacting on the lives of the local population
and strategies for addressing those issues, including outlining how planning policy can assist
in achieving healthy weight.
2.11 In January 2016, Blackpool Council became one of the first authorities in the country to sign
up to a healthy weight declaration24 which includes a commitment to consider planning
policies restricting hot food takeaways, specifically in areas around schools, parks and where
access to healthier alternatives are limited.
2.12 In January 2017, Blackpool Council launched the Healthier Choices Award25. This is a scheme
to help and support establishments in Blackpool to offer healthier food options and
encourages simple changes to the way food is prepared and cooked.
3.0 Planning Policy Context
National Planning Policy Framework (NPPF) (opens a new window)
3.1 The Government introduced a revised National Planning Policy Framework in 2019, with
healthy communities included as a common theme throughout the document.
Promoting healthy and safe communities – Para 91
Planning policies and decisions should aim to achieve healthy, inclusive and safe
places which enable and support healthy lifestyles, especially where this would
address identified local health and well-being needs – for example through the
provision of safe and accessible green infrastructure, sports facilities, local shops,
access to healthier food, allotments and layouts that encourage walking and cycling.
Promoting healthy and safe communities – Para 92
To provide the social, recreational and cultural facilities and services the community
needs, planning policies and decisions should take into account and support the
delivery of local strategies to improve health, social and cultural well-being for all
sections of the community.
Making effective use of land – Para 117
24 Blackpool Council Declaration on Healthy Weight (opens a new window)
25 Blackpool Council Healthier Choices Award (opens a new window)
10Planning policies and decisions should promote an effective use of land in meeting
the need for homes and other uses, while safeguarding and improving the
environment and ensuring safe and healthy living conditions.
Achieving well-designed places – Para 127
Planning policies and decisions should ensure that developments create places that
are safe, inclusive and accessible and which promote health and well-being, with a
high standard of amenity for existing and future users; and where crime and
disorder, and the fear of crime, do not undermine the quality of life or community
cohesion and resilience.
3.2 The range of issues that could be considered through the plan-making and decision making
processes, in respect of health and healthcare infrastructure, include how the local plan:
promotes health, social and cultural wellbeing and supports the reduction of health
inequalities;
considers the local health and wellbeing strategy and other relevant health
improvement strategies in the area
considers opportunities for healthy lifestyles (e.g. planning for an environment that
supports people of all ages in making healthy choices, helps to promote active travel
and physical activity, and promotes access to healthier food, high quality open
spaces and opportunities for play, sport and recreation).
National Planning Practice Guidance (opens a new window)
3.3 The National Planning Practice Guidance defines the role of health and wellbeing in planning
and ensures health and wellbeing is considered in local and neighbourhood plans and in
decision making. The guidance includes a range of issues that should be considered through
the plan making and decision making process in respect of health. The NPPG requires that:
the local plan promotes health, social and cultural wellbeing and supports the
reduction of health inequalities;
the local plan considers any local health and wellbeing strategies; and
opportunities for healthy lifestyles are considered (e.g. planning for an environment
that supports people of all ages in making healthy choices, promotes sustainable
travel modes and activity and promotes access to healthier food, high quality open
space and opportunities for play, sport and recreation).
3.4 Local planning authorities can consider bringing forward, where supported by an evidence
base, local plan policies and supplementary planning documents, which limit the
proliferation of certain use classes in identified areas, where planning permission is required.
3.5 Local planning authorities could have particular regard to the following issues:
proximity to locations where children and young people congregate such as schools,
community centres and playgrounds
11 evidence indicating high levels of obesity, deprivation and general poor health in
specific locations
over-concentration and clustering of certain use classes within a specified area
odours and noise impact
traffic impact
refuse and litter
Blackpool Local Plan, Part 1 – Core Strategy 2012-2027 [PDF 138,590KB]
3.6 The vision for Blackpool in 2027 includes that Blackpool has created a more equal society
with sustainable communities having fair access to quality jobs, housing, shopping, health,
education, open space, sport and recreation.
3.7 Goal 2 in the Core Strategy includes:
Strengthening community wellbeing to create sustainable communities and reduce
inequalities in Blackpool’s most deprived areas and to encourage healthier lifestyles.
Improving the health and well-being of Blackpool’s residents and reduce health
inequalities by maintaining good access to health care and encouraging healthy
active lifestyles, including access to open spaces, the coast, countryside, sport and
recreation facilities
3.8 The Core Strategy confirms that Blackpool is intensely urban and compact, largely built up to
its boundaries and that Blackpool’s Inner Area is densely populated and experiences a high
concentration of acute deprivation levels, leading to extreme health, social and economic
inequalities between the richest members of society and the poorest.
3.9 Regeneration within Blackpool Town Centre, the Resort Core and in deprived
neighbourhoods is crucial to strengthening the economy, balancing the housing market and
targeting investment to address decline and deprivation.
3.10 The Core Strategy acknowledges that the health of people in Blackpool is generally worse
than the national average and that the town records one of the lowest life expectancy rates
nationally and there are inequalities by deprivation and gender. The Core Strategy also
acknowledges that the health priorities in Blackpool include alcohol and drug misuse, mental
health, smoking and obesity.
3.11 There is a chapter in the Core Strategy entitled Strengthening Community Wellbeing which is
devoted to improving neighbourhoods and reducing inequalities, providing quality homes
and quality environs with the right community facilities where they are needed.
3.12 The following policies directly and indirectly relate to the health agenda.
CS1 – Strategic Location of Development
Blackpool’s future growth, development and investment will be focused on inner area
regeneration.
12 CS4 – Retail and Other Town Centre Uses
In order to strengthen Blackpool Town Centre’s role as the sub-regional centre for retail on
the Fylde Coast, its vitality and viability will be safeguarded and improved by focusing new
major retail development in the town centre to strengthen the offer and improve the quality
of the shopping experience. For Town, District and Local Centres within the Borough, retail
and other town centre uses will be supported where they are appropriate to the scale, role
and function of the centre.
CS5 – Connectivity
A sustainable, high quality transport network for Blackpool will be achieved by developing a
safe, enhanced and extended network of pedestrian and cycle routes to increase the
proportion of journeys made on foot or bike and changing travel behaviour by pro-actively
working with developers and other organisations to increase the proportion of journeys that
use sustainable transport.
Walking and cycling are important for their effectiveness in reducing road traffic as well as
improving health outcomes, an important consideration given the poor health statistics in
Blackpool. The Council will promote physical activity in line with the recommendations of
NICE Public Health Guidance19. Promotion of physical activity through urban and transport
planning has been shown to be an effective way of improving health outcomes in urban
areas.
CS6 – Green Infrastructure
High quality and well connected networks of green infrastructure in Blackpool will be
achieved by protecting and enhancing existing infrastructure, creating new green
infrastructure and connecting green infrastructure and emphasises that green infrastructure
has a vital contribution to the health and well-being of residents and visitors.
Easy access to good quality green space and infrastructure can provide benefits such as
increased life expectancy and reduced health inequalities, improvements in levels of physical
activity and health, and the promotion of psychological health and mental wellbeing
CS7 – Quality of Design
New development in Blackpool is required to be well designed, and enhance the character
and appearance of the local area and should incorporate well integrated car parking,
pedestrian routes and cycle routes and facilities and provide appropriate green
infrastructure including green spaces, landscaping and quality public realm as an integral
part of the development
High quality design is central to the creation of attractive, successful and sustainable places,
which in turn has a positive impact on the health and well-being of the communities who
live there.
CS10 - Sustainable Design and Renewable and Low Carbon Energy
13It is crucial that all developments incorporate measures that will address the significant
levels of fuel poverty experienced in Blackpool to improve the health and well-being of
communities and to meet the national requirements to reduce carbon emissions and
increase the supply of renewable energy.
All new non-residential development over 1,000m2 will be required to achieve BREEAM
‘very good’ (or any future national equivalent). (Health and well-being is a key focus of
BREEAM)
CS11 – Planning Obligations
Where appropriate, planning contributions will be sought in connection with a development
which may involve contributions to community infrastructure such as health and educational
facilities, sports or other community facilities.
CS12 – Sustainable Neighbourhoods
Sustainable communities should comprise a mix of age groups, incomes and lifestyles within
a safe, healthy and clean environment, with access to a full range of services and community
facilities.
The Council will support development and investment which creates a healthy, safe, secure
and attractive environment and public realm, which promotes local pride and a sense of
place. Neighbourhood improvement will focus on neighbourhoods in the Inner Area.
CS15 – Health and Education
Improving the health and education of Blackpool’s population is a major challenge, with the
gap in health and education inequalities between Blackpool and the rest of the UK
continuing to widen. Access to quality health and education facilities is integral to raising
educational achievement and improving the health and well-being of communities.
Achieving wider social, health and lifestyle goals is also closely linked to delivering major
physical change and the regeneration of the built environment.
People’s health and education is influenced by the settings of their everyday lives – where
they live, learn, play and work. There is a strong relationship between social and economic
factors such as low income and poor quality housing, with the state of health and levels of
educational attainment in local communities. Improved provision and access to quality
public services, which Policy CS15 aims to address, has a direct positive effect on the health
and well-being of residents.
Development will be supported that encourages health and active lifestyles and addresses
the Council’s health priorities.
CS17 – Blackpool Town Centre
To re-establish the town centre as the first choice shopping destination for Fylde Coast
residents and to strengthen it as a cultural, leisure and business destination for residents
14and visitors, new development will be supported which helps re-brand the town centre by
strengthening the retail offer and enhancing the quality of buildings, streets and spaces.
CS22 – Key Resort Gateways
Proposals for improvement and development will be supported to regenerate Central Drive,
Lytham Road, Dickson Road and Talbot Road as prominent and attractive gateways to the
resort and town centre by replacing poor quality seasonal and transient uses with more
viable uses.
4.0 Methodology
4.1 For the purposes of this data in this document, hot food takeaway uses have been counted
along with uses which actively advertise hot food takeaway services on mobile apps such as
Just Eat and Hungry House or which have a takeaway menu online. The data was collected in
the first quarter of 2018.
4.2 In order to establish where hot food takeaways are located in the town, data was been
sought from Environmental Services, which undertakes the food control and licensing
functions for Blackpool Council. Additional hot food takeaways were identified through the
Just Eat and Hungry House websites, through internet searches, a survey of the Town
Centre, District and Local Centres and through local knowledge.
4.3 Given the town’s main economy is tourism and tourism is focused primarily on the
Promenade within the Resort Core, hot food takeaways in this area were excluded from the
count as these units are generally seasonal and are not aimed at local residents. However,
units within the Town Centre off the Promenade have been included in the count. Typically,
hot food takeaways within the Town Centre are clustered around the edge, in some of the
towns most deprived and densely populated wards with more extreme health inequalities
than areas with fewer hot food takeaways. In any case, standalone hot food takeaway uses
would not normally be permitted in primary and secondary shopping frontages within the
Town Centre as this would be contrary to policies in the Core Strategy and the emerging
Local Plan Part 2: Site Allocations and Development Management Policies document.
4.4 The national Feat tool (Food Environment Assessment Tool) identifies hot food takeaways by
local authority across England. Whilst this tool was found to be useful, the hot food
takeaway data includes sandwich shops and 8 major retailers, 8 major restaurant chains and
some mobile caterers which for planning purposes are not classed as hot food takeaways.
Therefore the Council’s data doesn’t correlate directly with the data on FEAT.
4.5 Ward data relating to population and obesity levels in each ward was obtained through
Public Health England, with assistance from Public Health Blackpool. The Blackpool Joint
Strategic Needs document also links through to ward data from Public Health England.
4.6 The deprivation data for each Lower Super Output Area (LSOA) was obtained through the
Office for National Statistics (opens a new window) and the data extrapolated to ascertain
deprivation levels for each ward.
154.7 Childhood obesity data is collected annually by the National Child Measurement Programme
which involves recording the weight of children in Reception (aged 4-5 years) and Year 6
(aged 10-11 years) in schools. Map based ward data was obtained online at the NCMP and
Child Obesity Profile (opens a new window) and this data is updated annually.
5.0 Obesity and Health
5.1 Public Health England has identified a changing food culture. In previous decades, eating out
was an occasional treat for special occasions. However, now 1 in 6 meals are now eaten
outside of the home, 1 in 3 people in England eat takeaway food as least once a week, 1 in 3
children under the age of three eat at least one takeaway meal per week and 1 in 5 children
under the age of 3 eat takeaway food or ready-made adult meals, every day.
5.2 Childhood obesity can have a harmful effect on the body in a number of ways. Obese
children are more likely to have high blood pressure and high cholesterol which are risk
factors for cardiovascular disease, type 2 diabetes, breathing problems such as sleep apnoea
and joint problems to name a few. Children who are obese are at greater risk from bullying,
discrimination and low confidence and poor self-esteem which can continue into adulthood.
Obese children are also less likely to take regular exercise due to physical constraints and
exertion and poor body image which compounds the problem.
5.3 Being overweight or obese is often maintained into adulthood and adult obesity is
associated with a number of serious health conditions such as heart disease, asthma,
diabetes, stroke, skeletal and joint problems and some cancers and there is a reduced life
expectancy of around 9 years compared to those of a healthy weight.26
5.4 Life expectancy in Blackpool is 74.3 years for males (compared to the UK average of Life
expectancy of 79.5 years) and 79.4 years for females (UK average is 83.1 years). In terms of
the inequalities in Blackpool, life expectancy is 14.3 years lower for men and 9.3 years lower
for women in the most deprived areas of Blackpool than in the least deprived areas.
5.5 The Blackpool Joint Strategic Needs Assessment confirms that 75% of adults in Blackpool are
overweight (compared to 63% in England) and 31% of adults in Blackpool are obese
(compared to 27% in England) and confirms that obesity is an important factor contributing
to the inequality gap in life expectancy in Blackpool residents.
5.6 In terms of childhood excess weight and obesity, the tables below shows a comparison of
the Blackpool National Child Measurement Programme data between 2013/14 and 2018/19
and the average in England27:
Figure 1 Obesity levels in England between 2013 and 2019
England Obesity 2013/14 2014/15 2015/16 2016/17 2017/18 2018/19
Reception % 9.5 9.1 9.3 9.6 9.5 9.7
Year 6 % 19.1 19.1 19.8 20 20.1 20.2
26 Joint Strategic Needs Assessment for Blackpool Council (opens a new window)
27 NHS Digital website (opens a new window)
16Figure 2 Obesity levels in Blackpool between 2013 and 2019
Blackpool Obesity 2013/14 2014/15 2015/16 2016/17 2017/18 2018/19
Reception % 11.7 10.0 10.5 10 11.8 11.3
Year 6 % 22.0 22.0 22.5 21.1 22.6 24
Figure 3 Overweight and obesity levels in England between 2013 and 2019
England
Overweight and
Obesity 2013/14 2014/15 2015/16 2016/17 2017/18 2018/19
Reception % 22.5 21.9 22.1 22.6 22.4 22.6
Year 6 % 33.5 33.2 34.2 34.2 34.3 34.3
Figure 4 Overweight and obesity levels in Blackpool between 2013 and 2019
Blackpool
Overweight and
Obesity 2013/14 2014/15 2015/16 2016/17 2017/18 2018/19
Reception % 26.8 25.7 26.5 25.7 27.1 28.6
Year 6 % 35.7 38 40 34.3 37.8 38.6
5.7 The tables above show that in Blackpool, the prevalence of excess weight and obesity in
both Reception children and Year 6 children have been consistently much higher than the
national average.
5.8 The table below shows childhood trends in excess weight between 2006 and 2017, locally
and nationally:
Figure 5 PHE graph showing trends in excess weight between 2006 and 2017
5.9 The table below shows childhood trends in obesity between 2006 and 2017, locally and
nationally:
17Figure 6 PHE graph showing trends in obesity between 2006 and 2017
6.0 Obesity, Deprivation and Hot Food Takeaways
6.1 There is consistent evidence which links the number and density of hot food outlets and
deprivation. The Foresight report found that obesity levels tend to be higher in deprived
areas than in wealthy areas. Public Health England has found a strong association between
deprivation and the density of hot food takeaways (demonstrated in the graph below which
was published by Public Health England in 2017)28:
Figure 7 Association between levels of deprivation and the number of hot food takeaways in an area by PHE
6.2 Blackpool is currently the most deprived authority in England based on average deprivation
scores for all Lower Super Output Areas (LSOAs) (2015 Index), a position which has declined
since the 2004 Index of Deprivation, which placed Blackpool as 12th overall. Blackpool is also
28 PHE Obesity and the environment – Density of fast food outlets December 2017 [PDF 330KB]
18the most deprived authority in the country in terms of the Health Deprivation and Disability
Domain score.
6.3 The graph below shows a positive correlation between the number of hot food takeaways
and the deprivation rank of each ward in Blackpool (excluding the Promenade):
Figure 8 Deprivation score and the number of hot food takeaways published by PHE
6.4 The graph shows that there tends to be more hot food takeaways in the more deprived
wards than in less deprived wards. This data suggests that restricting new hot food
takeaways may prevent further amplification of deprivation.
6.5 In 2018/19 the obesity prevalence for children living in England in the most deprived areas
was more than double that of those living in the least deprived areas for both Reception and
Year 6. In that year, the obesity prevalence in Reception children ranged from 13.3% of
children living in the most deprived areas to 5.9% in the least deprived areas. In Year 6,
26.9% of children living in the most deprived areas were obese compared to 11.4% in the
least deprived areas. The PHE graphs29 below demonstrate that this deprivation gap is
increasing, with children in the most deprived areas increasingly living with excess weight or
obesity, whilst levels of excess weight and obesity in the least deprived areas is stable.
29
NHS Digital – national child measurement programme and deprivation (opens a new window)
19Figure 9 PHE graph showing levels of obesity in Reception aged children between 2006 and 2019
Figure 10 PHE graph showing levels of obesity in Year 6 aged children between 2006 and 2019
6.6 In Blackpool, the least deprived ward is Norbreck where 9.8% of children in reception (not
significantly different to the national average) and 18.6% of Year 6 children (under the
national average) are considered to be obese and there are 2 Hot Food Takeaways in that
ward. The most deprived ward is Bloomfield where 11.3% of children in reception
(significantly above the national average) and 24.5% of Year 6 children (significantly above
the national average) are considered to be obese and there are 58 Hot Food Takeaways in
that ward (48 if the on the Promenade are discounted).
6.7 The three most deprived wards in the town, Talbot, Bloomfield and Claremont have the
most hot food takeaways and levels of childhood obesity which are significantly above the
national average:
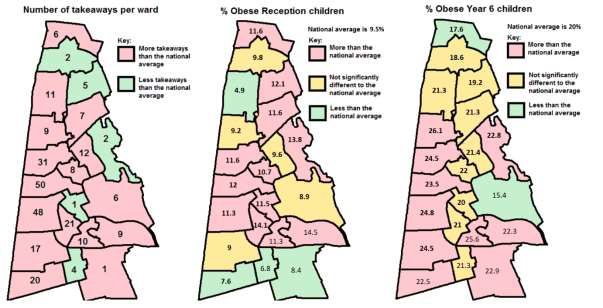
20Figure 11 Deprivation, childhood obesity levels and the number of hot food takeaways in Blackpool, by ward
HFT's
Blackpool Deprivation Deprivation % Obese % Obese
excluding
Wards Score 2015 Score 2019 Reception Year 6
Promenade
Hawes Side 42.5 45.8 11.3 25.6 10
Clifton 47.9 49.1 14.5 22.3 9
Park 53.4 52.6 13.8 22.8 2
Claremont 74.4 78.5 11.6 24.5 32
Bloomfield 83.4 87.2 11.3 24.8 48
Talbot 63.2 66.4 12 23.5 52
Warbreck 37.4 41.7 9.2 26.1 9
Victoria 49.2 52.3 14.1 21 21
Waterloo 52.1 53.6 9 24.5 17
Greenlands 27.1 29.5 11.6 21.3 7
Brunswick 58.9 62.9 10.7 22 8
Tyldesley 42.4 47.1 11.5 20 1
Ingthorpe 34.6 35.7 12.1 19.2 5
Stanley 23.7 27.4 8.4 22.9 1
Layton 35 40.2 9.6 21.4 12
Squires Gate 25.9 28.9 7.6 22.5 20
Anchorsholme 25.1 29.2 11.6 17.6 6
Norbreck 14.8 17.4 9.8 18.6 2
Highfield 28 31.2 6.8 21.3 4
Bispham 25.7 29.6 4.9 21.3 11
Marton 24.5 26.1 8.9 15.4 6
England average 21.8 21.7 9.5 20
Key:
Significantly better (-10%) than England average
Not significantly different to England average
Significantly worse (+10%) than England average
6.8 There is increasing research demonstrating strong links into the association between food
availability and obesity30. The graphs below compare adult and Reception and Year 6
childhood obesity levels with the number of hot food takeaways in each ward31. Each graph
30 Associations between exposure to takeaway food outlets, takeaway food consumption, and body weight 2014 study by
the BMJ (opens a new window)
31 Ward data from the Public Health England Local Health map (opens a new window)
21shows a positive correlation between a higher prevalence of obesity and the number of hot
food takeaways in a ward.
6.9 The graph below compares obesity levels in Reception age children with the number of hot
food takeaways by Blackpool ward (excluding the Promenade):
Figure 12 comparison of obesity levels in Reception age children with the number of hot food takeaways by Blackpool ward
(excluding the Promenade):
6.10 The graph below compares obesity levels in children in Year 6 with the number of hot food
takeaways by Blackpool ward (excluding the Promenade):
Figure 13 comparison of obesity levels in Year 6 age children with the number of hot food takeaways by Blackpool
6.11 The graph below compares obesity levels in adults with the number of hot food takeaways
by Blackpool ward (excluding the Promenade):
22Figure 14 comparison of obesity levels in adults with the number of hot food takeaways by Blackpool
6.12 Public Health England have identified that in England, there are on average 96.5 hot food
takeaways per 100,000 head of population:32
Figure 15 Heat map showing the number of hot food takeaways in a local authority area, per 100,000 people
6.13 In Blackpool, the average number of hot food takeaways per 100,000 head of population is
217 (196.5 when excluding units on the Promenade) compared to 96.5 nationally. In Talbot
ward, there are 959.6 Hot Food Takeaways per 100,000 population (804.83 when excluding
32 PHE Fast Food Map 2017 [PDF 330KB]
23units on the Promenade) and this is a significantly greater number than the national
average.
Figure 16 Number of hot food takeaways in Blackpool wards per 100,000 people
Hot Food Hot Food Takeaways
Number of Hot Food
Takeaways per per 100,000 population
Ward Takeaways excluding
100,000 excluding the
the Promenade
population Promenade
Talbot 52 959.6 804.83
Bloomfield 48 864.12 715.14
Claremont 32 437.64 437.64
Squires Gate 20 322.42 322.42
Victoria 21 307.6 307.6
Waterloo 17 361.29 267.04
Layton 12 174.7 174.7
Bispham 11 172.77 172.77
Warbreck 9 141.4 141.4
Hawes Side 10 141.18 141.18
Clifton 9 132.63 132.63
Brunswick 8 120.36 120.36
Greenlands 7 103.95 103.95
Anchorsholme 6 96.08 96.08
Marton 6 89.03 89.03
Highfield 4 61.78 61.78
Ingthorpe 5 50.97 50.97
Norbreck 2 33.08 33.08
Park 2 26.85 26.85
Stanley 1 15.56 15.56
Tyldesley 1 15.03 15.03
England
96.5 96.5
average
Key:
Significantly fewer (-10%) than England average
Not significantly different to England average
Significantly more (+10%) than England average
246.14 It is noted that even in wards with fewer than the national average number of hot food
takeaways, there is still a higher than national average number of obese children in
Reception and Year 6. However, taking Tyldesley ward as an example, which has 15 hot food
takeaways per 100,000 people (significantly under the national average), the 5 adjoining
wards have more or significantly more than the national average of hot food takeaways per
100,000 people (Talbot 804, Bloomfield 715, Waterloo 267, Hawes Side 141 and Marton 89).
This suggests that the number of hot food takeaways in adjoining wards also needs to be
considered when looking at the data.
Figure 17 Map based comparison between the number of takeaways per ward and levels of childhood obesity
7.0 Local strategies to improve health
7.1 All the local key indicators show that there is an urgent need to improve health in Blackpool
and health improvement is a key priority for the Council, the NHS Blackpool and all of our
relevant partner organisations.
7.2 Blackpool Council is committed to try and improve the health and well-being of its residents
and has set up free services to assist in healthier lifestyle choices and offers free access to
lifestyle coaches and health buddies with ongoing reviews and support, under the Healthy
Lifestyle service.
7.3 HeadStart is a scheme aimed at 10-16 year olds to improve resilience in young people and
improve mental well-being by building a resilience revolution across the whole of Blackpool.
7.4 Blackpool has a free 12 week Weight Management programme called Making Changes for
children aged 5 to 11 who are above a healthy weight, and their families. This programme
includes healthy eating advice, family exercise sessions, support plans including cooking at
home on a budget, gym and sports sessions and free access to the Council’s sports and
leisure facilities.
257.5 The Active Blackpool programme delivers a range of health and physical activity initiatives to
help improve the lifestyles of people in Blackpool including gym and exercise class activities,
a walking and cycling programme and a cardiac programme.
7.6 In January 2017, Blackpool Council launched the Healthier Choices Award33. This is a scheme
to help and support establishments in Blackpool offer healthier food options to the
population of Blackpool and it is about making simple changes to the way food is prepared
and cooked.
8.0 What have other authorities done?
8.1 As many as 164 (of 325 – 50.5%) local planning authorities in England have some form of
planning policy in place addressing takeaways (e.g. a policy in a local plan or a
supplementary planning document (SPD)) and more have draft policies waiting to be
adopted. Approaches used include exclusion zones around schools, restrictions in areas with
high levels of childhood obesity, restrictions centred on areas with high existing density of
takeaways and financial levies imposed on new takeaway business owners. Barking and
Dagenham, one of the first local authority’s’ to implement planning restrictions on new
takeaways, have reported a 15% decrease in takeaways since 2010. However, preventing
new hot food takeaways from opening due to health concerns, is a relatively new practice
and little evidence is available which would indicate what impact such planning policy
restrictions are having on local levels of childhood obesity.
Exclusion zones restricting new hot food takeaways
8.2 400m exclusion zones around schools are commonplace in Local Plans or adopted SPD’s and
this is a stance also favoured by the Mayor of London, Sadiq Khan in the draft London Plan.
Some authorities only have the exclusion zone in place around secondary schools as
generally, primary school children are not permitted to leave school at lunch time and are
usually accompanied to and from school by an adult. Manchester City Council has adopted a
policy which limits opening hours of hot food takeaways within 400m of a school, to after
5pm.
8.3 Some authorities also have a 400m exclusion zone around sixth form colleges, youth
facilities, community centres, playing fields, parks and leisure centres and some also impose
strict opening times so that hot food takeaways are not open during core school hours.
8.4 The 400m figure is based on research conducted by London Metropolitan University
suggesting that 400m was the maximum distance that students could walk to and back in
their lunch break. However, some authorities are proposing to reduce the exclusion zone to
200m (Braintree District Authority and Tower Hamlets Draft Plans) and Brighton and Hove’s
evidence base suggests an 800m exclusion zone would be required if a restrictive policy was
to be effective, but could not be justified in that authority. Some authorities refer to 400m
33 Healthier Choices Award (opens a new window)
26as being the equivalent to a 5 minute walk, others refer to 400m being the equivalent to a
10 minute walk.
Ward data
8.5 Authorities have also restricted the provision of new hot food takeaways in wards where
there are high levels of childhood obesity, until levels of childhood obesity fall within set
targets.
Over concentration of hot food takeaways
8.6 Some authorities have policies restricting the number of hot food takeaways in shopping
centres and on high streets, such as having no more than x percent of units within a centre
or a frontage being hot food takeaways, there should be no more than two hot food
takeaways beside each other or there should be at least x units of another use between hot
food takeaways. Some authorities have introduced area concentration limitations of no
more than 3 units within 400m.
8.7 These policies prevent over-concentrations of hot food takeaways in order to ensure there
are sufficient units available for other Class E uses (formerly Class A) and to protect amenity
in terms of late night noise, parking problems, anti-social behaviour, litter and vermin.
Policies which prevent over-concentrations of hot food takeaways also limit people’s
exposure to unhealthy food and safeguards retail floor space for perhaps healthier food
retailing.
Health Impact Assessments
8.8 Some authorities are requiring the submission of Health Impact Assessments with planning
applications, not just for larger developments but also for proposals for new hot food
takeaways. As part of these Assessments, financial contributions could be made/required
towards improving health infrastructure or if the Assessment indicates there would be harm
to health, permission is likely to be refused.
9.0 Case Studies and Appeal Decisions
9.1 North Tyneside adopted its’ Local Plan in July 201734. Policy DM3.7 relates to proposals for
hot food takeaways and like other authorities, this policy restricts hot food takeaways where
there would result in a clustering of hot food takeaway uses to the detriment of a defined
centre, where there would be an adverse impact on residential amenity, where there would
be two or more consecutive hot food takeaway uses in any one frontage. Where hot food
takeaway uses exist, a gap of two non-hot food takeaway uses shall be required before a
further hot food takeaway use is permitted in the frontage. The policy also includes the
400m exclusion zone around entry points of secondary schools. However, the policy goes on
to prevent the development of hot food takeaway uses in wards where there is more than
15% of the Year 6 pupils or 10% of Reception pupils classed as very overweight (percentages
found sound by the examination inspector) and confirms that an assessment will be made
34 North Tyneside Local Plan website (opens a new window)
27on an individual basis, the impact that a hot food takeaway would have on the wellbeing of
residents. This policy was developed following the publication of the evidence base in
relation to the use of the planning system to control Hot Food Takeaways in North
Tyneside35.
9.2 Whilst this policy was in draft form, two applications were refused for hot food takeaways in
North Tyneside on public health grounds only and subsequent appeals lost on the basis that
the policy hadn’t been through an examination process. One Inspector, in relation to a hot
food takeaway appeal ref APP/W4515/W/16/315471036 stated “Whilst the aim of Policy
DM3.7 in relation to promoting healthy communities is broadly consistent with the
Framework, I am aware that the LPPD has not been subject to an Examination in Public
albeit I note that the Council state that no objections to Policy DM3.7 have been received.
Notwithstanding this, and with regard to Paragraph 216 of the Framework, it is possible that
the policy could be amended or deleted as a result of the examination into the overall
soundness of the plan. As a consequence I can afford the policy only moderate weight as a
material consideration in this matter at this time.” The Inspector acknowledged that there
was a high level of childhood obesity in the ward but also noted that the appeal site was
located directly adjacent to a retail unit which sells a variety of snacks, sweets and other
high calorie produce.
9.3 In the appeal decision ref APP/W4515/W/16/315496037, the Inspector had similar concerns
that Policy DM3.7 could be amended or deleted during examination and therefore gave the
policy little weight. The Inspector also considered the fall-back position of the property
which was as a café, which could sell similar types of food as a hot food takeaway without
challenge and the Inspector concluded that was a material consideration to which he gave
great weight.
9.4 Comments: It should be noted that the availability of snacks and sweets etc in retail shops
could not be controlled by the planning system whereas the location of hot food takeaways
can. In the Blackpool context, retailers are actively encouraged to join the Healthier Choices
scheme and nationally there is a drive for healthier checkouts, where impulse buys for
unhealthy snacks are reduced by replacing crisps, chocolate and fizzy drinks at till points
with fruit, nuts and bottled water. Nationally, the Government introduced a sugar tax in
2018 which has make sugary drinks less affordable and shines a light on the amount of sugar
is contained in these drinks.
9.5 The North Tyneside Local Plan, including policy DM3.7 was adopted in July 2017 following
modifications as a result of the examination process. Following the adoption of the policy
DM3.7, five appeals have been dismissed on public health grounds:
9.6 In the first appeal, reference APP/W4515/W/17/318253438, the Inspector gave only limited
weight to the previous 2 appeal decisions as the policy had been modified and adopted
35 North Tyneside Council Public Health Evidence in relation to the use of the planning system to control Hot Food Takeaways
[PDF 1,424KB]
36 Planning appeal APP/W4515/W/16/3154710 (opens a new window)
37 Planning appeal APP/W4515/W/16/3154960 (opens a new window)
38 Planning appeal APP/W4515/W/17/3182534 (opens a new window)
28following examination. The Inspector confirmed that the language used in Policy DM3.7, and
particularly the criterion in relation to the number of obese children in the ward, is very
clear and leaves little room for interpretation. Despite the Council not raising any other
concerns with the appeal proposal, granting permission for the appeal proposal would add
to the opportunities to purchase unhealthy food in the area. “Controlling the proliferation of
fast food outlets is part of the Council’s overall strategy to reduce the extent of obesity and
widening the existing opportunities with further availability would run counter to this.” … “I
have also noted the appellant’s point regarding the relatively high cost of the prospective
occupier’s product acting as a disincentive to children purchasing it. This may well be true,
but does not take into account takeaway food being purchased as a main meal by parents or
by adults for their own consumption. Although some of the indicators and thresholds used by
Policy DM3.7 relate to the percentage of children that are classified as very overweight, the
policy is not restricted in its operation to the health of children.”
9.7 In other matters, the Inspector concluded:
“I have noted the appellants’ suggestion that the implication of dismissing this appeal would
establish that no A5 development could be permitted in the majority of North Tyneside for
the foreseeable future. I do not agree that this is the case. Each planning application must be
considered on its own merits. Whilst Section 38(6) of the Planning and Compulsory Purchase
Act requires that applications must be determined in accordance with the development plan,
this is subject to the proviso that material considerations may indicate otherwise. In addition
criterion e) of Policy DM3.7 states that the Council will assess, on an individual basis, the
impact hot food takeaways have on the wellbeing of residents. In my view, the decision on
this appeal would not preclude other material considerations specific to the proposal in
question indicating that future applications may be approved, or prevent the impact of such
applications on the well-being of residents being considered on an individual basis.”
9.8 In the appeal ref APP/W4515/W/17/317702839, the Inspector stated “In this case, the hot
food takeaway (HFT) would be located within a ward where the most recent National Child
Measurement Programme Data 2015/16 identifies that 18.4% of Year 6 pupils are very
overweight. Furthermore, the appeal site lies within 400m of Wellfield Middle School. On this
basis the proposal directly conflicts with the express requirements of Policy DM3.7. Whilst I
cannot ascertain from the information before me whether children can leave the school
during their lunch hour, the proposed HFT would be open at the end of the school day. Given
the age range of the children it is highly likely that a large number of pupils would be walking
home unsupervised thus the children’s exposure to unhealthy food choices would be increase
as a result of the proposal.” The Inspector acknowledged that “the control of HFTs is not the
only strategy in promoting healthier lifestyles and that obesity is the result of a wide range of
societal and biological factors. Nonetheless, as the Council points out, the nutritional content
of food from HFTs is characterised by trans-fat, saturated fat and salt and is a significant
contributing factor in obesity and needs to be taken into account as part of the Council’s
approach to managing weight and obesity.”
39 Planning appeal APP/W4515/W/17/3177028 (opens a new window)
29You can also read