Multiple cropping alone does not improve year-round food security among smallholders in rural India
←
→
Page content transcription
If your browser does not render page correctly, please read the page content below
LETTER • OPEN ACCESS

Multiple cropping alone does not improve year-round food security
among smallholders in rural India
To cite this article: Pinki Mondal et al 2021 Environ. Res. Lett. 16 065017

View the article online for updates and enhancements.

                                This content was downloaded from IP address 46.4.80.155 on 10/10/2021 at 20:11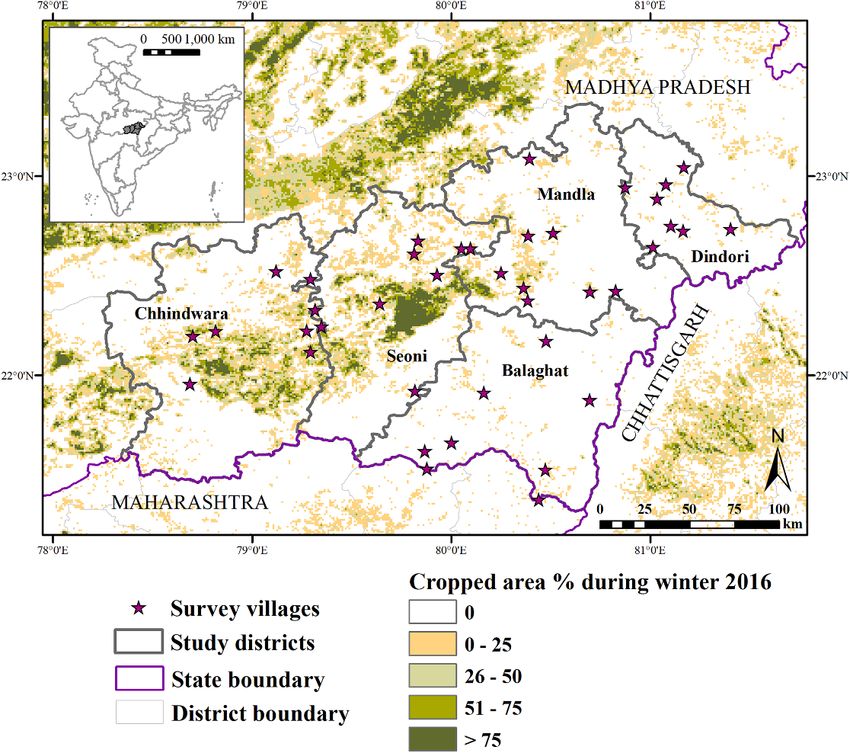
Environ. Res. Lett. 16 (2021) 065017 https://doi.org/10.1088/1748-9326/ac05ee
LETTER
Multiple cropping alone does not improve year-round food
OPEN ACCESS
security among smallholders in rural India
RECEIVED
12 March 2021 Pinki Mondal1,2,∗, Ruth DeFries3, Jessica Clark1, Nicole Flowerhill1, Md. Arif4,10, Aurelie Harou5,
REVISED Shauna Downs6 and Jessica Fanzo7,8,9
9 May 2021
1
Department of Geography and Spatial Sciences, University of Delaware, Newark, DE, United States of America
ACCEPTED FOR PUBLICATION 2
27 May 2021 Department of Plant and Soil Sciences, University of Delaware, Newark, DE, United States of America
3
Department of Ecology, Evolution,and Environmental Biology, Columbia University, New York, NY, United States of America
PUBLISHED 4
17 June 2021
Foundation for Ecological Security, Mandla, Madhya Pradesh, India
5
Department of Natural Resource Sciences, Agricultural Economics, McGill University, Québec, Canada
6
Department of Urban-Global Health, Rutgers School of Public Health, Newark, NJ, United States of America
Original content from 7
The Nitze School of Advanced International Studies, Johns Hopkins University, Washington, DC, United States of America
this work may be used 8
under the terms of the The Bloomberg School of Public Health, Johns Hopkins University, Washington, DC, United States of America
9
Creative Commons The Berman Institute of Bioethics, Johns Hopkins University, Washington, DC, United States of America
10
Attribution 4.0 licence. Current affiliation: Deshpande Foundation India, Hubballi, Karnataka, India
∗
Any further distribution Author to whom any correspondence should be addressed.
of this work must
maintain attribution to E-mail: mondalp@udel.edu
the author(s) and the title
of the work, journal Keywords: food security, dietary diversity, smallholder agriculture, India
citation and DOI.
Supplementary material for this article is available online
Abstract
Achieving and maintaining food and nutrition security is an important Sustainable Development
Goal, especially in countries with largely vulnerable population with high occurrence of hunger
and malnutrition. By studying a small-scale agricultural system in India, we aim to understand the
current state of dietary diversity and food insecurity among the farmer communities. The study
landscape has witnessed a steady rise in multiple cropping (i.e. harvesting more than once a year)
along with irrigation over the last two decades. Whether this multiple cropping can be expected to
improve year-round food security is not well understood. We specifically examine if planting
multiple food crops within a year is associated with dietary diversity and food security. We
collected information on demographic and economic variables, farming activities and livelihood
choices, from 200 unique households for three seasons (monsoon/rainy, winter, summer) during
2016–2018 (n = 600). Based on both a 24 h and a 30 days recall, we calculated several indicators,
including the household dietary diversity score, the minimum dietary diversity for women, and
household food insecurity access scale. At least 43% of the sample population experiences
moderate to severe food insecurity in all seasons. Cereals (mainly rice) remain the most important
food item irrespective of the season, with negligible consumption of other nutrient-rich food such
as tubers, fish, eggs, and meats. Around 81% of women in all seasons do not consume a minimally
diverse diet. Multiple cropping is associated with higher food security only during monsoon, while
selling monsoon crops is associated with winter food security. Households practicing multiple
cropping consume more pulses (a plant-based protein source) compared to single-cropping or
non-farming households (p < 0.05). We find that multiple cropping cannot be used as a cure-all
strategy. Rather a combination of income and nutrition strategies, including more diverse home
garden, diverse income portfolio, and access to clean cooking fuel, is required to achieve
year-round dietary diversity or food security.
1. Introduction WFP and WHO 2020) leading to a setback to achiev-
ing the Sustainable Development Goal (SDG) target
Approximately 690 million people worldwide were 2.1 (ensuring access to safe, nutritious and sufficient
still undernourished in 2019 (FAO, IFAD, UNICEF, food for all people all year round), or SDG target
© 2021 The Author(s). Published by IOP Publishing Ltd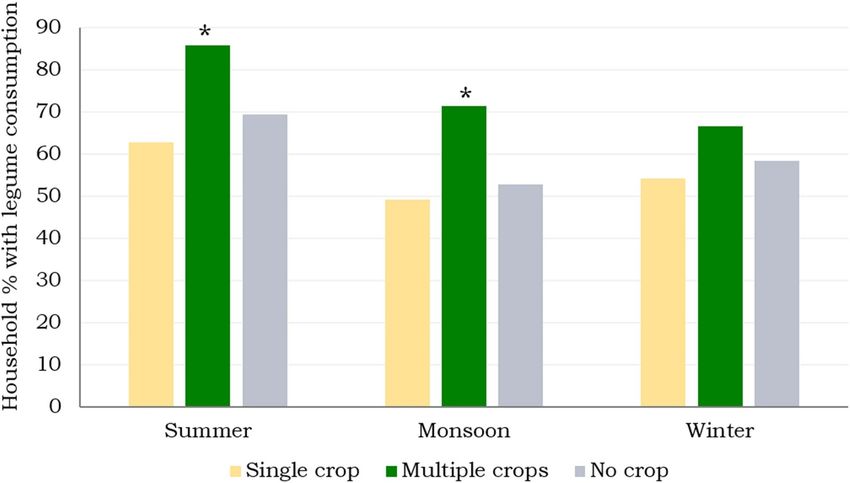
Environ. Res. Lett. 16 (2021) 065017                                                                   P Mondal et al

2.2 (eradicating all forms of malnutrition). In 2019,       between agriculture and nutrition are: (a) agri-
two billion people did not have access to sufficient        culture as a source of food and (b) agriculture as
and nutritious food, likely to be further impacted by       a source of income (Gillespie and Kadiyala 2011,
the COVID-19 pandemic. ‘Hidden hunger’—chronic              Bhagowalia et al 2012, Sibhatu et al 2015, Sibhatu
deficiency of micronutrients (vitamins and miner-           and Qaim 2018). In a semi-subsistence agricultural
als, such as iron, vitamin A, and zinc)—affects about       system (producing both subsistence food crops and
one quarter of the world’s population (HarvestPlus          food/non-food cash crops for market transaction),
and FAO 2019), with alarmingly high prevalence in           a shift towards increasing cash crop production has
sub-Saharan Africa and south Asia (Muthayya et al           been known to increase local market dependence, and
2013). While smallholder farmers produce a substan-         intensify vulnerability to changes in food prices (Von
tial share of global food supply, including about 80%       Braun and Kennedy 1986, Maxwell and Fernando
of food consumed in Asia and sub-Saharan Africa             1989, Fafchamps 1992). Cash crop production is also
(IFAD 2011), they are paradoxically the most vulner-        known to have both positive and negative correlations
able to food insecurity (Sanchez and Swaminathan            with food availability (Immink and Alarcon 1993,
2005).                                                      Komarek 2010), food access (Terry and Ryder 2005,
     Sustainable agricultural intensification (i.e. grow-   2007, Komarek 2010), food utilization (Leonard et al
ing multiple crops sequentially in a year, improved         1994, Von Braun 1995), and overall food/nutrition
high yielding crop varieties, and sustainable use           security (Anderman et al 2014) in countries across the
of irrigation and fertilizers) is one of the ways           globe.
to meet future food demand while ensuring min-                  India faces particular challenges in achieving food
imum environmental degradation (Burney et al 2010,          and nutrition security due to its increasing popula-
Foley et al 2011, Tilman et al 2011, ELD Initiative         tion and rapid economic growth resulting in chan-
2015). Multiple cropping practices may take differ-         ging diet (Pingali 2004, Popkin 2006). Area for winter
ent forms, such as similar crops growing simultan-          (‘Rabi’) cropping in India increased from 46 Mha
eously and sequentially or agroforestry with coexist-       to 56 Mha (+22%) between 2000–2001 and 2016–
ence of diverse vegetation types. In addition to the        2017 (Government of India 2017). Yet, existing lit-
direct benefits of increased diversity in crop pro-         erature suggests increased consumption of refined
duction and potential land sparing, multiple crop-          cereals such as rice and wheat, decline in coarse cer-
ping might reduce the environmental consequences            eals (sorghum/millet) and pulses (edible seeds from
of single-species cropping systems by reducing soil         leguminous crops), and increases in fat and animal-
erosion and associated nutrient loss, preserving the        source food (Gillespie and Kadiyala 2011, Popkin
quality of ground and drinking water, and improv-           et al 2012, DeFries et al 2018). Especially in India,
ing pest regulation (Gaba et al 2015). Multiple crop-       policies have played a critical role in driving relative
ping is widespread in the Global South, particularly        price changes, leading to skewed staple food con-
on small farms, where farmers plant two or more             sumption. An existing policy bias toward wheat and
crops sequentially on the same piece of land (Fran-         rice is reflected in the inclusion of these staple crops
cis and Porter 2017). Winter crops (or the ‘second’         in the targeted public distribution system (TPDS),
crop) thus play a critical role in increasing food pro-     the large allocation of research-and-development
duction, especially in low- and middle-income coun-         funds, and fertilizer and water subsidies, which has
tries where ∼1 billion ha of land could be cleared          probably led to a lower dietary diversity, along with
by 2050 if the current agricultural land expansion          decline of pulse production/consumption in India.
were to continue (Tilman et al 2011). The assumed           The recently implemented National Food Security
positive connection between multiple cropping and           Act, 2013 aims to provide further subsidized staples
food security (Abraham et al 2014, ELD Initiative           to 75% of the rural and 50% of the urban Indian pop-
2015) has motivated global level studies on identi-         ulation (OECD/ICRIER 2018). In such a cereal-heavy
fying potential lands available for multiple cropping       diet, vegetarian or non-vegetarian protein sources
(Waha et al 2020). As such, most of these studies use       become more important in achieving nutrition
dietary diversity or food production as proxies for         security.
food security (Remans et al 2011, Burlingame and                In this study, we specifically examine if plant-
Dernini 2012, Jones et al 2014, Pellegrini and Tasciotti    ing multiple crops within a single year is associated
2014). More comprehensive food security indicators,         with improved food and nutrition security in a semi-
however, are frequently examined in terms of socio-         subsistence farming community in the state of Mad-
economic, political and demographic factors (Dev            hya Pradesh. This central Indian state has witnessed
and Sharma 2010, Chowdhury et al 2016, Cafiero et al        an increase in area under multiple cropping from
2018, Isaura et al 2019), and rarely in the context of      5.2 Mha to 9.9 Mha (+90%) between 2004–2005 and
multiple cropping.                                          2017–2018 (Directorate of Economics and Statistics
     While the overall agriculture-diet-nutrition           2017). The net area under irrigation increased about
dynamics is complex, the most direct linkages               45% since 2008–2009, covering 9.5 Mha in 2013–2014

                                               2
Environ. Res. Lett. 16 (2021) 065017 P Mondal et al
(Ministry of Statistics and Programme Implement- smallholders in this region predominantly plant
ation India 2017). Whether such aggressive invest- wheat and pulses (chickpea, grass pea, pea, lentil),
ment in multiple cropping and irrigation infrastruc- with occasional paddy rice and linseed. They also
ture could result in year-round food security among produce vegetables, e.g. spinach, okra, ridge gourd,
smallholder communities is yet to be examined. Using cauliflower, onion, in home gardens during winter.
primary survey data from 200 households over three Summer is not a common cropping season, with
seasons (n = 600) from five districts in Madhya Pra- occasional home gardening for vegetables (tomato,
desh, we investigate the following questions: bottle gourd, eggplant) and some paddy rice. Agricul-
ture in this region is mostly rain-fed with more winter
(a) how do dietary diversity and food security vary cropping expected with suitable soil and access to
across seasons for smallholder farmers? irrigation. All five districts have witnessed an increase
(b) are multiple cropping practices associated with in multiple cropping, along with area under wheat
dietary diversity and improved food security? and pulses, since 2004–2005 (SI figure 1). Our prior
(c) is agriculture as a source of income, i.e. income work has shown a temporally fluctuating pattern in
from crop sale, associated with dietary diversity winter cropping in this landscape (Mondal et al 2016)
and food security? driven mostly by access to irrigation, with a possibil-
ity for losing 20%–68% of winter crops based on the
We adopted the FAO definition of food security, current groundwater depletion (Jain et al 2021). This
i.e. all individuals, at all times, have reliable physical landscape thus gives us a unique opportunity to test
and economic access to sufficient, safe, and nutritious if, and how, multiple cropping is associated with sea-
food (FAO 1996). Such definition relies upon four sonal changes in dietary diversity and food security, if
dimensions of food security: availability, access, util- any.
ization and stability. We used multiple indicators of
dietary diversity and nutritional adequacy to capture
the different components of food security. 2.2. Sampling strategy for surveys
We used a stratified random sampling strategy to
2. Methods identify study villages a-priori using a satellite-derived
winter cropped area dataset (Jain et al 2017a, 2017b)
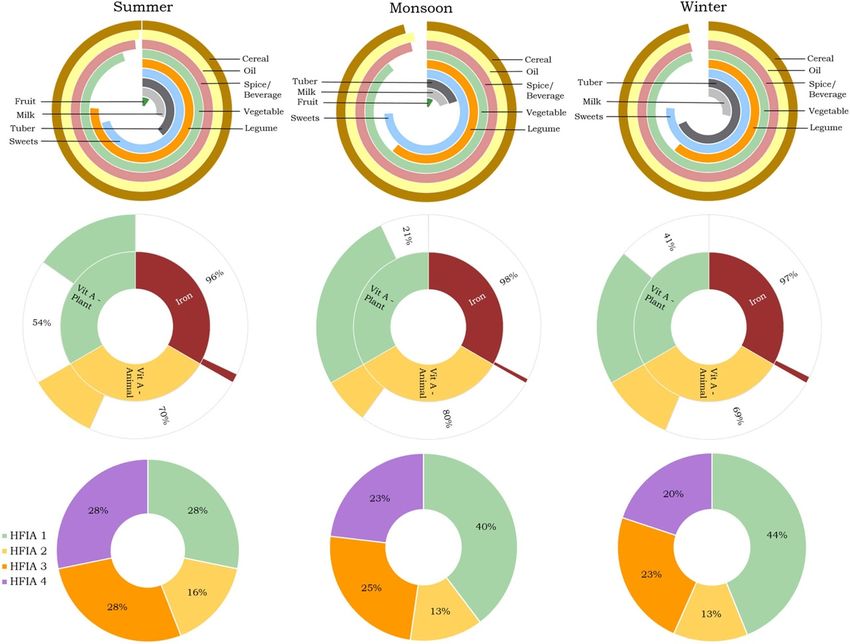
2.1. Study region as the base map (figure 1). First, we created a stratum
We selected central India as the focus area since based on agricultural practices (predominantly single
there is a mix of single-cropping and double-cropping cropping vs. double cropping) in the five study dis-
practices, and the smallholder farmers in this region tricts. Then we randomly selected eight villages from
represent some of the most vulnerable communit- each of the five districts to represent each of the
ies in India, with people predominantly belong- agricultural practice categories. Within each village
ing to socially excluded tribal communities (UKAID five households were randomly selected (household
2014). Agricultural intensification in this region is n = 200) by the interviewer based on location within
achieved via different pathways—by using high-yield the village and availability of the respondents. The
crop variety during monsoon/rainy season resulting same individual in each household (male or female
in higher income, by planting multiple crops sequen- adult, based on availability) was interviewed for each
tially in a year, or by increasing production with better of the three seasons (summer, monsoon/rainy sea-
agricultural inputs (better coverage and year-round son, winter/dry season), resulting in 600 surveys. A
access to irrigation, more fertilizer). This is also a list of the survey questions has been provided in SI
landscape with limited infrastructure, e.g. refrigera- tables 2–4.
tion and transportation, with traditional weekly mar- We utilized the food and nutrition technical
kets (bazaar) serving as the primary food distribution assistance (FANTA) project recommendations for the
system in addition to local shops and TPDS. questionnaire surveys for food security and diversity
We focused on 40 villages in five districts in indicators (SI tables 3, 4), namely the household
the state of Madhya Pradesh—Balaghat, Chhind- food insecurity access scale (HFIAS) (Coates et al
wara, Dindori, Mandla and Seoni—to understand 2007) and household dietary diversity score (HDDS)
the agriculture-diet-nutrition dynamics across agri- (FAO 2011). We collected food availability data
cultural households from various socio-economic through a 30 days recall and food consumption data
settings (SI table 1; figure 1 (available online at (FAO 2011) through a 24 h recall. The interviewer
stacks.iop.org/ERL/16/065017/mmedia)). All of these avoided visiting a village right after the weekly market
districts fall within the ‘hot moist sub-humid’ agro- days, whenever possible, to avoid misrepresentation
ecological subregion that covers Satpura range and of dietary diversity. The interviewer administered
Wainganga valley (Gajbhiye and Mandal 2000). The the questionnaires three times a year for monsoon
primary crops planted during monsoon are paddy (June–October), winter (November–February), and
rice and maize (mostly in Chhindwara), with some summer (March–May) seasons. Although the study
pulses (pigeon pea, black gram). During winter, region has negligible triple cropping, inclusion of
3Environ. Res. Lett. 16 (2021) 065017 P Mondal et al
Figure 1. Map of study area showing location of the 40 study villages within the five study districts at the boundary of the Indian
states of Madhya Pradesh, Maharashtra and Chhattisgarh, along with the spatial distribution of winter cropping (the second crop)
in 2016 (cropped area data source: Jain et al 2017b).
summer season (the season of greatest food short- women 15–49 years of age (n = 413). We cal-
age) enabled us to develop a baseline to identify sea- culated the minimum dietary diversity for women
sonal changes in diet (FAO 2011). Approvals from the (MDD-W) for each eligible respondent (FANTA
Institutional Review Boards were obtained from both 2014, FAO 2016). It is a dichotomous indicator
Columbia University and the University of Delaware. for women consuming at least five out of ten
defined food groups (grains/tubers, pulses, nuts/-
seeds, dairy, meat/fish, egg, dark green leafy vegetable,
2.3. Dietary diversity and food insecurity other vitamin-A enriched vegetables, other veget-
indicators ables, and other fruits) over the last 24 h (SI figure
Using the data collected on 16 individual foods or 2). We report proportion of women respondents
food groups consumed over the last 24 h, we calcu- who had MDD-W, i.e. consumed at least five food
lated HDDS by aggregating food items into 12 groups groups.
(SI table 3): cereals, white tubers/roots, vegetables, We further calculated proportion of women
fruits, meat, eggs, fish/seafood, pulses/nuts/seeds, respondents, as the percent of total women respond-
milk/milk products, oils/fats, sweets, spices/condi- ents, who consumed food groups that are good
ments/beverages e.g. tea and alcoholic beverage such sources for micronutrients such as vitamin A or
as Mahua. The respondents were first asked about the iron (FAO 2011) over the last 24 h. A value of 1
dietary consumption at the household level over the was assigned to the following three categories if the
last 24 h (breakfast/snack, morning meal, lunch, din- respondent consumed any of the food groups listed
ner). Based on the qualitative responses, the inter- for each of these categories.
viewer assigned a value of ‘yes’ (1) or ‘no’ (0) to
each of the food groups (SI table 3). While we made
every effort to interview the women for the dietary (a) Plant-based vitamin A: vitamin a rich vegetables
diversity questionnaire, it was not always possible. and tubers, dark green leafy vegetables, vitamin
HDDS ranges between 0 and 12; the higher the score a rich fruits
the higher is the dietary diversity (SI figure 2). (b) Animal-based vitamin A: organ meat, eggs, milk
To document nutritional adequacy among small- or milk products
holder farmer families, we further focused on the (c) Iron: organ meat, flesh meat, fish and seafood.
4Environ. Res. Lett. 16 (2021) 065017 P Mondal et al
Low percentages of sub-population consuming data from all three seasons) and six season-specific
the micronutrient-rich food groups can be used as an models.
indicator of severely inadequate diets, especially relev- All continuous predictor variables were centered
ant for ongoing monitoring and intervention assess- on the mean values and were tested for collinearity.
ments (FAO 2011). For this study, we only consider Standard errors were clustered by villages. We con-
vitamin A and iron as the dietary diversity data expli- sidered only full records with no missing values for
citly highlights both iron and vitamin A rich food any of the variables, resulting in a sample size of 573
groups, given that many populations (including in for the full models. In these models, we used fixed
India) are at risk of under-consuming these key nutri- effects (season, district and village) to minimize any
ents (Bailey et al 2015, Gonmei and Toteja 2018). Due time-invariant unobservable component that might
to the nature of the data collected, we were not able to otherwise bias our estimates.
consider other important nutrients such as protein or In order to identify significant associations within
calcium. each season, we also developed three sets of regression
We used the food availability surveys (SI table models, each for HFIAS and HDDS. The sample sizes
4) to construct HFIAS that represents varying levels for summer, monsoon and winter models are 196,
of food insecurity over the past 30 days based on 188 and 189, respectively. These regression models
responses to nine occurrence and nine frequency-of- enabled us to identify the season-specific importance
occurrence questions (Coates et al 2007). The range of multiple cropping in a year and source of income
for HFIAS is 0–27; the higher the score, the more (farm vs. non-farm) in achieving food security and
food insecure is the household (SI figure 2). This dietary diversity. District and village variables were
indicator reflects three domains perceived as cent- used as fixed effects in these season-specific models.
ral to the experience of food insecurity: (a) anxiety Table 1 provides details on all the variables used in
about household food supply (b) insufficient quality, the regression models. Based on the survey data, we
including variety, preferences and social acceptabil- developed an asset index using data collected on sev-
ity and (c) insufficient food supply and intake and eral asset indicators, such as household ownership of
their physical consequences. Furthermore, we report consumer durables (livestock, television, radio, refri-
the Household Food Insecurity Access Prevalence gerator, bicycle, phone) and characteristics of the
(HFIAP) status of the study population by categor- household’s dwelling (building materials). Such an
izing the households into four groups: food secure indicator can be used as a proxy for wealth/assets as
(HFIA 1) and mild (HFIA 2), moderately (HFIA 3) they provide advantages over other common meas-
or severely food insecure (HFIA 4). For this indicator, ures of well-being, e.g. consumption, income and
a HFIA category variable was first assigned to each expenditures. Assets are accumulated over a longer
household using the following set of criteria (see SI time period and tend to last longer, making them a
table 4 for questions). strong indicator of a household’s permanent wealth
compared to a household’s income, for example,
(a) HFIA category = 1 if [(Q1a = 0 or Q1a = 1) and which suffers from seasonal variation and/or non-
Q2 = 0 and Q3 = 0 and Q4 = 0 and Q5 = 0 and remunerated self-employment (Sahn and Stifel 2000,
Q6 = 0 and Q7 = 0 and Q8 = 0 and Q9 = 0] Filmer and Pritchett 2001, Moser and Felton 2007).
(b) HFIA category = 2 if [(Q1a = 2 or Q1a = 3 or Here, we use factor analysis to create an asset index
Q2a = 1 or Q2a = 2 or Q2a = 3 or Q3a = 1 or as it offers more flexibility by not forcing all the com-
Q4a = 1) and Q5 = 0 and Q6 = 0 and Q7 = 0 ponents to explain the correlation structure between
and Q8 = 0 and Q9 = 0] the assets (see Sahn and Stifel 2000 for details). Data
(c) HFIA category = 3 if [(Q3a = 2 or Q3a = 3 or cleaning, visualization and regression analysis were
Q4a = 2 or Q4a = 3 or Q5a = 1 or Q5a = 2 or performed using MS Excel, ArcMap 10.5.1 and R 4.0.2
Q6a = 1 or Q6a = 2) and Q7 = 0 and Q8 = 0 packages tidyverse, sandwich, and lmtest.
and Q9 = 0]
(d) HFIA category = 4 if [Q5a = 3 or Q6a = 3 or 3. Results
Q7a = 1 or Q7a = 2 or Q7a = 3 or Q8a = 1 or
Q8a = 2 or Q8a = 3 or Q9a = 1 or Q9a = 2 or 3.1. How do dietary diversity and food security
Q9a = 3] vary across seasons for smallholder farmers?
The food groups most consumed (>96% households)
around the year are cereals, oils and spices (figure 2),
while consumption of other food groups vary across
2.4. Regression models seasons. The other most consumed food group is
Using HDDS and HFIAS as response variables, we ran vegetables, reported by 90%–95% of households, with
eight regression models to identify the most import- the lowest consumption in monsoon. Pulse con-
ant associations of different factors including demo- sumption is at its most during summer (76%) with
graphic, economic, farming activities and livelihood 62% each during monsoon and winter. White tuber
choices (table 1). We ran two full models (pooling consumption fluctuates considerably between 20% in
5Environ. Res. Lett. 16 (2021) 065017 P Mondal et al
Table 1. Description of variables used in this study.
Demographic Economic Farming activities Livelihood choices
HHM: number of OCU_F: primary Crop_no: number of COKS: primary fuel source
household members (who occupation. Over 6 months cropping seasons within for cooking. LPG = 1,
eat together) farming = 1, other = 0 a year fuelwood /both = 0
EDUHH: highest Asset_index: a weighted PLLS: Farming activities FPDC: food pur-
education level in the variable based on a range last season. Yes = 1, no = 0 chase decision
household. High-school of asset indicators, e.g. maker. Female = 1,
and beyond = 1, other = 0 livestock, bicycle, radio, male/both = 0.
television, refrigerator,
bicycle, phone, building
materials
HHSS_R: money spent on LSSL: crops sold last sea- FCDC: cooking decision
food items purchased from son. Yes = 1, no = 0 maker. Female = 1,
subsidized shop/public male/both = 0.
distribution system in last
month.
MON: money spent on IRLS: access to irrigation MFRQ: number of market
food items purchased from last season. Yes = 1, no = 0 visits per month for food
market/shop in last month. purchase.
HGAG: food grown in FPS_FI: % of the total cash
home garden this season. income from farm produce
Yes = 1, no = 0 (crop + livestock) spent on
food items.
NFAS_FI: % of the
total cash income from
non-farm activities (wage,
salary) spent on food
items.
monsoon and 69% in winter. People in this landscape severe food insecurity while about one-fifth of the
rarely consume any other food groups, except for milk population are severely food insecure during winter
and sweets. Over 70% of the households lack milk in (figure 2). Approximately 28% of households are food
their diet (figure 2), with the rest of the households secure during summer, while 40% and 44% house-
consuming negligible amount of milk in tea. While holds are food secure during monsoon and winter,
the ethnic groups (such as Gond, Baiga, Pardhan) respectively. A considerable fraction of the house-
in this region are predominantly non-vegetarian, holds is moderately or mildly food insecure through-
egg/fish/meat is not a common food item in their out the year, ranging from 36% in winter to 44% in
diet due to the lack of affordability (Mondal, personal summer.
communication). About 0.5%–2% of the respond-
ents consume animal-sourced protein.
The diets of the women of 15–49 years of age 3.2. Are multiple cropping practices associated
(n = 413) are highly inadequate from a nutritional with dietary diversity and improved food security?
point of view (figure 2). During summer, only about About 53% of the surveyed households practice mul-
19% of women consumed a minimally diverse diet. tiple cropping, i.e. 2 or 3 cropping seasons within
That number drops to 16% and 13% during monsoon a year. Yet, a higher number of crops throughout
and winter, respectively, leaving a vast majority of the the year (crop_no) shows a positive association with
women consuming poor quality diets. The diets of higher dietary diversity only during monsoon, with a
the majority of women (96%–98%) lack iron-sourced variable estimate of 0.550 (table 2 a). Having a home
food, such as organ/flesh meat, fish, or seafood. garden (HGAG) helps with dietary diversity during
Animal-source vitamin-A rich foods are also lacking winter (estimate = 0.400; table 2(a)), but not dur-
in the diets of 70%–80% of the women respondents. ing monsoon or summer, even though 66% respond-
Between 21% (monsoon) and 54% (summer) women ents had a home garden during monsoon compared
lack plant-based vitamin-A rich foods in their diets. to 49% and 6.5% in winter and summer, respectively.
In the study region, summer is the least food We also find that liquefied petroleum gas (LPG) as
secure season with 28% of the households reporting primary or additional fuel source for cooking (COKS)
6Environ. Res. Lett. 16 (2021) 065017 P Mondal et al
Figure 2. Top panel: seasonal variations in consumption of different food groups plotted by the percentage of respondents. A full
circle denotes 100% respondents consumed that particular food group. Middle panel: the status of nutritional inadequacy among
women population. Numbers denote proportion of women respondents with nutritional inadequacy. Bottom panel: the
household food insecurity access (HFIA) prevalence status where HFIA 1 is the food secure group and HFIA 2–4 are mildly,
moderately and severely food insecure groups.
is positively associated with higher dietary diversity insecurity score. Such association was absent during
during summer with an estimate of 0.412 (table 2(a)). summer and winter. However, planting crops (PLLS)
In the study region, pulses can be an excellent during monsoon is associated with improved food
source of protein that could be available (as a second security during winter with an estimate of −1.288
crop), accessible and affordable to the local com- (table 2(b)). Assets appear to be the only factor that
munities. Agricultural census data suggest an increase can keep households food secure throughout the year,
in cropped area under different types of pulses over with the estimates ranging between −0.731 in sum-
the last two decades (SI figure 1), although exist- mer and −0.778 in monsoon (table 2(b)).
ing literature suggests a decrease in pulse consump-
tion (Headey et al 2012). Bhagowalia et al (2012) 3.3. Is agriculture as a source of income, i.e. income
reported a positive association between number of from crop sale, associated with dietary diversity
crops grown by a household and share of pulses. and food security?
Similarly, we find that pulse consumption in house- About one-fifth of this sample population sell a por-
holds practicing multiple cropping is significantly tion of the crops throughout the year. We find that
higher (p < 0.05) in summer and monsoon compared households depending more on income from farming
to the single-cropping households or non-farming to purchase food items (FPS_FI) have a less diverse
households (figure 3). Among the multiple cropping diet during monsoon (estimate = − 0.276; table 2(a))
households (53% of all households), between 63% and winter (estimate = − 0.397; table 2(a)). More
and 86% consume pulses, whereas only 29%–37% dependence on income from farming for food pur-
single-cropping households have pulses in their diets chase is also associated with higher food insecur-
(not significantly different from non-farming house- ity during monsoon (estimate = 1.015; table 2(b)).
holds). Dependence on non-farm income (NFAS_FI) for
Multiple cropping throughout a year (Crop_no) food purchase is associated with higher food insec-
is associated with higher food security in monsoon urity during monsoon (estimate = 0.544; table 2(b)),
with a variable estimate of −0.907 (table 2(b)), i.e. although the association is less significant compared
the higher the crop number the lower is the food to the one with income from farming. This shows that
7Environ. Res. Lett. 16 (2021) 065017 P Mondal et al
Table 2. Variable estimates and standard errors clustered by villages (within parentheses) from eight regression models constructed for
(a) the household dietary diversity score (HDDS) and (b) the household food insecurity access scale (HFIAS). All continuous
independent variables are centered on mean. Full model with data from all three seasons have district, village and season fixed effects.
Season-specific models have village and district fixed effects. Statistically significant associations are in bold.
(a) Household dietary diversity score (HDDS)
Variables Full model (n = 573) Summer (n = 196) Monsoon (n = 188) Winter (n = 189)
HHM −0.083 (0.069∗ ) −0.118 (0.074) −0.166 (0.092∗∗ ) −0.027 (0.117)
EDUHH 0.030 (0.092) 0.015 (0.138) −0.043 (0.110) 0.094 (0.110)
OCU_F 0.095 (0.169) −0.036 (0.210) −0.388 (0.305) 0.284 (0.345)
Asset_index 0.115 (0.061∗ ) 0.133 (0.098) 0.274 (0.082∗∗∗∗ ) 0.055 (0.100)
HHSS_R −0.055 (0.053) −0.034 (0.087) −0.030 (0.100) 0.027 (0.091)
MON 0.131 (0.042∗∗∗ ) 0.050 (0.097) 0.246 (0.105∗∗ ) 0.119 (0.121)
Crop_no 0.150 (0.128) 0.087 (0.187) 0.550 (0.230∗∗ ) 0.043 (0.144)
PLLS 0.180 (0.125) 0.278 (0.253) −0.908 (0.510∗ ) 0.578 (0.425)
LSSL −0.061 (0.084) 0.011 (0.136) 0.024 (0.167) −0.211 (0.135)
IRLS −0.135 (0.111) −0.384 (0.167∗∗ ) 0.386 (0.398) 0.155 (0.132)
HGAG −0.007 (0.082) −0.168 (0.171) −0.149 (0.187) 0.400 (0.112∗∗∗∗ )
COKS 0.195 (0.082∗∗ ) 0.412 (0.137∗∗∗ ) 0.078 (0.142) −0.002 (0.139)
FPDC −0.158 (0.077∗∗ ) −0.168 (0.140) −0.196 (0.138) −0.216 (0.114∗ )
FCDC 0.121 (0.251) −0.409 (0.336) 0.707 (0.526) 0.457 (0.157∗∗∗ )
MFRQ −0.005 (0.080) −0.079 (0.069) 0.035 (0.100) 0.004 (0.069)
FPS_FI −0.189 (0.065∗∗∗ ) −0.122 (0.119) −0.276 (0.120∗∗ ) −0.397 (0.159∗∗ )
NFAS_FI −0.082 (0.042∗ ) −0.124 (0.077) 0.026 (0.100) −0.103 (0.068)
(b) Household food insecurity access scale (HFIAS)
Variables Full model (n = 573) Summer (n = 196) Monsoon (n = 188) Winter (n = 189)
HHM 0.459 (0.184∗∗ ) 0.109 (0.215) 0.809 (0.293∗∗∗ ) 0.409 (0.176∗∗ )
EDUHH −0.023 (0.260) −0.026 (0.252) 0.070 (0.404) 0.094 (0.327)
OCU_F −0.163 (0.394) −0.824 (0.549) 0.523 (0.633) 0.208 (0.840)
Asset_index −0.694 (0.208∗∗∗∗ ) −0.731 (0.264∗∗∗ ) −0.778 (0.279∗∗∗ ) −0.752 (0.288∗∗∗ )
HHSS_R 0.205 (0.145) 0.380 (0.287) −0.014 (0.286) 0.425 (0.154∗∗∗ )
MON −0.248 (0.107∗∗ ) −0.209 (0.235) −0.202 (0.263) −0.295 (0.179)
Crop_no −0.522 (0.275∗ ) −0.420 (0.555) −0.907 (0.379∗∗ ) −0.161 (0.343)
PLLS −0.430 (0.332) 0.300 (0.612) 0.182 (0.812) −1.288 (0.728∗ )
LSSL −0.402 (0.208∗ ) 0.177 (0.401) −0.648 (0.475) −0.650 (0.351∗ )
IRLS 0.168 (0.317) −0.862 (0.725) 0.205 (0.714) 0.272 (0.401)
HGAG −0.247 (0.248) 0.096 (0.742) −0.776 (0.585) −0.343 (0.403)
COKS 0.029 (0.241) 0.412 (0.429) −0.453 (0.316) 0.156 (0.330)
FPDC 0.224 (0.171) −0.490 (0.321) 0.351 (0.383) 0.780 (0.231∗∗∗∗ )
FCDC −0.547 (.661) −0.581 (0.728) −0.607 (1.177) −1.802 (0.611∗∗∗ )
MFRQ −0.071 (0.084) −0.266 (0.214) 0.018 (0.194) −0.037 (0.260)
FPS_FI 0.240 (0.160) 0.306 (0.299) 1.015 (0.429∗∗ ) 0.140 (0.285)
NFAS_FI 0.308 (0.143∗∗ ) 0.390 (0.276) 0.544 (0.295∗ ) 0.122 (0.222)
Significance codes: ‘∗∗∗∗ ’ 0.001, ‘∗∗∗ ’ 0.01, ‘∗∗ ’ 0.05, ‘∗ ’ 0.1
smallholders are food insecure during monsoon, irre- crops available to purchase (Ickowitz et al 2019). We
spective of the source of income for food purchase. find that even in a semi-subsistence system such as
We also find that households that could sell crops dur- the study region, where smallholders produce food
ing monsoon (LSSL) are more food secure in winter crops multiple times a year, improved food secur-
(estimate = − 0.650; table 2(b)). ity can be elusive. No single approach can secure
year-round dietary diversity and food security. This
4. Discussion finding provides important evidence against the nar-
rative that equates multiple cropping with improved
In a market-oriented agricultural system with cash food security (ELD Initiative 2015). Our results rather
crop production, poorer food and/or nutrition secur- show that there is no panacea for achieving year-
ity is not uncommon (Anderman et al 2014, Dewey round food security and place-based realities must be
1981, 1989). This might be an outcome in a system interweaved into national-level narratives.
where cash crop sale gives the farmers more pur- We find that notable variations in dietary diversity
chasing power, but the local market itself depends on and food security exist across seasons. Moreover,
the local food production with low diversity of food irrespective of the season or cropping strategies,
8Environ. Res. Lett. 16 (2021) 065017 P Mondal et al
Figure 3. Seasonal variations in legume consumption among single-cropping, multiple-cropping and non-farming households.
Statistically significant difference (p < 0.05) according to a two-population z score test is denoted by asterisk (∗ ).
women in the study landscape have minimally diverse the flagship clean cooking policy ‘Pradhan Mantri
diet and are likely at risk of nutritional inadequacy Ujjwala Yojana’ launched in 2016. We find that LPG
(figure 2). This finding is in line with a recent study use has a positive association with dietary diversity
that finds dietary discrimination faced by women in during summer, also found in the full model. This
India (Gupta et al 2020). A low-technology mech- finding aligns with another study from India where
anism, i.e. increasing production diversity at the alternative cook stoves (biogas) were found to be asso-
home gardens, might be an effective tool to address ciated with diverse household diets (Anderman et al
this issue of nutritional inadequacy among women. 2015). However, LPG is expensive and inconvenient
Diverse cropping and home gardens have been pos- for the households (require refilling), in addition to
itively associated with dietary diversity (Rowe 2009, high dependence on imports and sensitivity to market
Dame and Nüsser 2011, Bhagowalia et al 2012, Islam fluctuations (Hameed 2020). While LPG might have
et al 2018, Bellon et al 2020). Increased production direct health benefits, and potential environmental
at the local level can thus lead to improved nutri- benefits through reduced use of forest products (fuel-
tion, especially when leafy vegetables and fruits are wood) for cooking, a direct link to improved food
directly consumed (Benson 2015). However, our res- security, and not only dietary diversity, is yet to be
ults show that home garden is positively associated established in the study landscape.
with dietary diversity only during winter. Two-thirds Our findings indicate that seasonal agricul-
of the respondents grow vegetables in home gardens tural income does not improve year-round dietary
during monsoon as well. Yet, we do not see the same diversity or food security. Since monsoon crop sale
positive association between home garden and diet- is positively associated with higher food security in
ary diversity. This is likely because households grow winter, similar market transaction opportunities for
the same group of vegetables during monsoon. By winter/summer crops might help alleviate farmer
diversifying the home gardens, such as planting green concerns related to overall food security. Pulses,
leafy vegetables, vitamin-A enriched fruits or other one of the major winter crops in this landscape,
fruits and vegetables, it is possible to achieve a more are among the higher-priced food items in India.
diverse diet among women. Regular access to a variety It would not be surprising if farmers who grow pulses
of food groups through home gardens could be par- sell it to cover non-food household expenses, which
ticularly effective for this landscape where refrigera- is an economic strategy as opposed to a nutritional
tion at household-level is not common, thus purchas- one (Birthal et al 2007). However, growing pulses
ing perishable vegetables/fruits at the weekly markets during winter, whenever feasible, can also be pro-
for consumption might not be feasible. moted as a nutritional strategy in this landscape.
About a third of the respondents use LPG for Since single-cropping households will have to depend
cooking in this landscape with wider adoption to on either market or TPDS (where pulses are not gen-
be expected (Khanwilkar et al 2021) because of erally available at a subsidized rate) for food items
9Environ. Res. Lett. 16 (2021) 065017 P Mondal et al
during summer and winter, affordability is likely the Institutional Review Boards at Columbia Uni-
to play a crucial role in pulse consumption status versity (AAAM4551) and the University of Delaware
in these households. Creating a local market struc- (1387713-4).
ture, where pulses are locally grown and sold at local
markets, might help with increased availability and ORCID iDs
reduced price of this nutritionally important food
group (Sibhatu et al 2015, Ickowitz et al 2019). Pinki Mondal https://orcid.org/0000-0002-7323-
There are several pathways to improve food secur- 6335
ity and dietary diversity. One such approach argues Ruth DeFries https://orcid.org/0000-0002-3332-
that off-farm employment increases incomes and the 4621
ability to purchase food, and thus can reduce depend-
ence on income from agriculture (IAASTD 2009,
References
Babatunde and Qaim 2010). While we do not find
a direct evidence supporting this argument, we find Abraham B et al 2014 The system of crop intensification: reports
that lower dietary diversity is associated with more from the field on improving agricultural production, food
dependence on income from farming for food pur- security, and resilience to climate change for multiple crops
Agric. Food Secur. 3 4
chase, especially during monsoon and winter. We also
Alarcon J A 1993 Household income, food availability, and
find that food security declines with more depend- commercial crop production by smallholder farmers in the
ence on non-farm income for food purchase. With western highlands of Guatemala Econ. Dev. Cult. Change
more household members engaged in off-farm activ- 41 319–42
Anderman T, DeFries R, Wood S, Remans R, Ahuja R and Ulla S
ities, lack of labor availability might contribute to
2015 Biogas cook stoves for healthy and sustainable diets? A
some sense of anxiety around food security in these case study in Southern India Front. Nutr. 2 28
smallholder communities. These seasonal variations Anderman T, Remans R, Wood S, DeRosa K and DeFries R 2014
reveal the complex interplay of farm and off-farm Synergies and tradeoffs between cash crop production and
food security: a case study in rural Ghana Food Security
activities, further complicated by existing household
6 541–54
assets. Since the asset index is consistently associated Babatunde R O and Qaim M 2010 Impact of off-farm income on
with improved food security and diverse diet, we can food security and nutrition in Nigeria Food Policy 35 303–11
conclude that a better economic baseline for these Bailey R L, West Jr K P J and Black R E 2015 The epidemiology of
global micronutrient deficiencies Ann. Nutr. Metab.
households can result in an improved food and nutri-
66 22–33
tion security. Our findings highlight that even in a Bellon M R, Kotu B H, Azzarri C and Caracciolo F 2020 To
landscape experiencing rapid agricultural intensifica- diversify or not to diversify, that is the question. Pursuing
tion through multiple cropping and irrigation, a suite agricultural development for smallholder farmers in
marginal areas of Ghana World Dev. 125 104682
of additional strategies must be in place to ensure
Benson T 2015 Associations between Irrigated Farming and
food security in smallholder communities. Improved Nutrition in Malawian Farm Households
(Washington, DC: International Food Policy Research
Institute (IFPRI)) 50–5 (available at: http://ebrary.ifpri.org/
Data Availability Statement cdm/ref/collection/p15738coll2/id/129903)
Bhagowalia P, Headey D D and Kadiyala S 2012 Agriculture,
The data that support the findings of this study are income, and nutrition linkages in India: insights from a
openly available at the following URL/DOI: https:// nationally representative survey IFPRI discussion papers No.
01195 (Washington, DC: International Food Policy Research
doi.org/10.5061/dryad.tdz08kq07. Institute (IFPRI))
Birthal P S, Joshi P K and Gulati A 2007 Vertical coordination in
high-value food commodities Agricultural Diversification
Acknowledgments and Smallholders in South Asia (Washington, DC:
International Food Policy Research Institute) pp 405–40
Burlingame B and Dernini S (eds) 2012 Sustainable Diets and
We are grateful to Mrs. Kusum Jhariya for data
Biodiversity: Directions and Solutions for Policy, Research and
collection and to the entire team at the Founda- Action (Rome: Food and Agriculture Organization and
tion for Ecological Security (FES, Mandla), espe- Bioversity International)
cially Ishan Agrawal for project logistics. We are Burney J A, Davis S J and Lobell D B 2010 Greenhouse gas
mitigation by agricultural intensification Proc. Natl Acad.
thankful to Melissa Gallant for creating and man-
Sci. 107 12052–7
aging the preliminary database. Mondal was suppor- Cafiero C, Viviani S and Nord M 2018 Food security
ted by the Lamont Climate Center and the Univer- measurement in a global context: the food insecurity
sity of Delaware. Clark was supported by the Center experience scale Measurement 116 146–52
Chowdhury M R K, Khan M M H, Rafiqul Islam M, Perera N K P,
for Food Systems and Sustainability (CENFOODS)
Shumack M K and Kader M 2016 Low maternal education
Undergraduate Internship Program at the University and socio-economic status were associated with household
of Delaware. Household survey data collection was food insecurity in children under five with diarrhoea in
funded by the NASA Land-Cover Land-Use Change Bangladesh Acta Paediatr. 105 555–61
Coates J, Swindale A and Bilinsky P 2007 Household food
Program (Grant No. 522363). We are grateful to
insecurity access scale (HFIAS) for measurement of
CENFOODS for providing financial support for open household food access: indicator guide (Version 3)
access data publication. The study was approved by (Washington, D.C.: Food and Nutrition Technical Assistance
10Environ. Res. Lett. 16 (2021) 065017 P Mondal et al
Project, Academy for Educational Development) (available sites/default/files/publications/2020anhconfbr20.pdf)
at: www.fao.org/fileadmin/user_upload/eufao-fsi4dm/doc- (Accessed 9 March 2021)
training/hfias.pdf) Gonmei Z and Toteja G S 2018 Micronutrient status of Indian
Dame J and Nüsser M 2011 Food security in high mountain population Indian J. Med. Res. 148 511–21
regions: agricultural production and the impact of food Government of India 2017 Agricultural Statistics at a Glance 2018
subsidies in Ladakh, Northern India Food Security 3 179–94 Ministry of Agriculture & Farmers Welfare. Department of
DeFries R, Chhatre A, Davis K, Dutta A, Fanzo J, Ghosh-Jerath S, Agriculture, Cooperation & Farmers Welfare. Directorate of
Myers S, Rao N D and Smith M R 2018 Impact of historical Economics and Statistics (available at: http://agricoop.gov.
changes in coarse cereals consumption in India on in/sites/default/files/agristatglance2018.pdf) (Accessed 12
micronutrient intake and anemia prevalence Food Nutr. March 2021)
Bull. 39 377–92 Gupta S, Sunder N and Pingali P L 2020 Are women in rural India
Dev S M and Sharma A N 2010 Food security in India: really consuming a less diverse diet? Food Nutr. Bull.
performance, challenges and policies. Oxfam India 41 318–31
(available at: https://policy-practice.oxfam.org/resources/ Hameed S 2020 India’s oil imports from the US: how beneficial
food-security-in-india-performance-challenges-and- are they? Strateg. Anal. 44 583–96
policies-346637/) (Accessed 12 March 2021) HarvestPlus and FAO 2019 Biofortification: A Food-systems
Dewey K G 1981 Nutritional consequences of the transformation Solution to Help End Hidden Hunger (Washington, DC:
from subsistence to commercial agriculture in Tabasco, HarvestPlus)
Mexico Hum. Ecol. 9 151–87 Headey D, Chiu A and Kadiyala S 2012 Agriculture’s role in the
Dewey K G 1989 Nutrition and the commoditation of food Indian enigma: help or hindrance to the crisis of
systems in Latin America and the Caribbean Soc. Sci. Med. undernutrition? Food Security 4 87–102
28 415–24 IAASTD 2009 Agriculture at a Crossroads: global report
Directorate of Economics and Statistics 2017 Web based land use (International Assessment of Agricultural Knowledge,
statistics information system. Department of agriculture, Science and Technology for Development)
cooperation and farmers welfare, ministry of agriculture Ickowitz A, Powell B, Rowland D, Jones A and Sunderland T 2019
and farmers welfare, government of India (available at: Agricultural intensification, dietary diversity, and markets in
https://aps.dac.gov.in/LUS/Public/Reports.aspx) (Accessed 3 the global food security narrative Glob. Food Secur. 20 9–16
March 2021) IFAD 2011 Viewpoint: smallholders can feed the world (Rome:
ELD Initiative 2015 Report for policy and decision makers: Reaping International Fund for Agricultural Development) (available
economic and environmental benefits from sustainable land at: www.ifad.org/documents/38714170/40706188/
management (available at: www.eld-initiative.org) (Accessed Smallholders+can+feed+the+world_e.pdf/460ca6c2-
1 March 2021) 7621-40d8-9f79-a56f6f8fa75e) (Accessed 9 March 2021)
Fafchamps M 1992 Cash crop production, food price volatility, Isaura E R, Chen Y-C, Adi A C, Fan H-Y, Li C-Y and Yang S-H
and rural market integration in the third world Am. J. Agric. 2019 Association between Depressive Symptoms and Food
Econ. 74 90–99 Insecurity among Indonesian Adults: results from the
FANTA 2014 Development of Evidence-Based Dietary 2007–2014 Indonesia Family Life Survey Nutrients 11 3026
Recommendations for Children, Pregnant Women, and Islam A H M S, Von Braun J, Thorne-Lyman A L and Ahmed A U
Lactating Women Living in the Western Highlands in 2018 Farm diversification and food and nutrition security in
Guatemala (Washington, DC: Food and Nutrition Technical Bangladesh: empirical evidence from nationally
Assistance FHI 360/ FANTA) representative household panel data Food Security 10 701–20
FAO, IFAD, UNICEF, WFP and WHO 2020 The state of food Jain M, Fishman R, Mondal P, Galford G, Bhattarai N, Naeem S,
security and nutrition in the world 2020 Transforming Lall U, Singh B and DeFries R 2021 Groundwater depletion
food systems for affordable healthy diets (Rome: FAO) will reduce cropping intensity in India Sci. Adv. 7 eabd2849
(https://doi.org/10.4060/ca9692en) Jain M, Mondal P, Galford G L, Fiske G and DeFries R S 2017b
FAO 1996 Rome Declaration on World Food Security and World India Annual Winter Cropped Area, 2001–2016 (Palisades,
Food Summit Plan of Action (Rome: World Food Summit) NY: NASA Socioeconomic Data and Applications Center
FAO 2011 Guidelines for measuring household and individual (SEDAC)) (https://doi.org/10.7927/H47D2S3W)
dietary diversity (Rome: Food and Agriculture Organization Jain M, Mondal P, Galford G, Fiske G and DeFries R S 2017a An
of the United Nations (FAO)) (available at: www.fao.org/ automated approach to map winter cropped area of
fileadmin/user_upload/wa_workshop/docs/FAO-guidelines- smallholder farms across large scales using MODIS imagery
dietary-diversity2011.pdf) Remote Sens. 9 566
FAO 2016 Minimum Dietary Diversity for Women: A Guide for Jones A D, Shrinivas A and Bezner-Kerr R 2014 Farm production
Measurement (Rome: Food and Agriculture Organization of diversity is associated with greater household dietary
the United Nations) diversity in Malawi: findings from nationally representative
Filmer D and Pritchett L 2001 Estimating wealth effects data Food Policy 46 1–12
without expenditure data—or tears: an application to Khanwilkar S, Gould C, DeFries R, Habib B and Urpelainen J
educational enrollments in states of India. Demography 2021 Firewood, forests, and fringe populations: Exploring
38 115–32 the inequitable socioeconomic dimensions of Liquified
Foley J A et al 2011 Solutions for a cultivated planet Nature Petroleum Gas (LPG) adoption in India Energy Res. Soc. Sci.
478 337–42 75 102012
Francis C A and Porter P 2017 Multicropping Encyclopedia of Komarek A M 2010 Crop diversification decisions: the case of
Applied Plant Sciences 2nd edn, ed B Thomas, B G Murray vanilla in Uganda Q. J. Int. Agric. 49 227–42
and D J Murphy 3 29–33 Leonard W R, Dewalt K M, Uquillas J E and Dewalt B R 1994 Diet
Gaba S et al 2015 Multiple cropping systems as drivers for and nutritional status among cassava producing
providing multiple ecosystem services: from concepts to agriculturalists of coastal Ecuador Ecol. Food Nutr.
design Agron. Sustainable Dev. 35 607–23 32 113–27
Gajbhiye K S and Mandal C 2000 Agro-Ecological Zones, their Soil Maxwell S and Fernando A 1989 Cash crops in developing
Resource and Cropping Systems (Nagpur: National Bureau of countries: the issues, the facts, the policies World Dev.
Soil Survey and Land Use Planning) 17 1677–708
Gillespie S and Kadiyala S 2011 Exploring the Ministry of Statistics and Programme Implementation India 2017
agriculture-nutrition disconnect in India, 2020 IFPRI 2020 Irrigation—Statistical Year Book India 2017 (available at:
Int. Conf., “Leveraging Agriculture for Improving Nutrition http://mospi.nic.in/statistical-year-book-india/2017/181)
and Health” (New Delhi, India) (available at: www.ifpri.org/ (Accessed 2 March 2021)
11Environ. Res. Lett. 16 (2021) 065017 P Mondal et al
Mondal P, Jain M, Zukowski M, Galford G and DeFries R 2016 Sahn D E and Stifel D C 2000 Poverty comparisons over time and
Quantifying fluctuations in winter productive cropped area across countries in Africa World Dev. 28 2123–55
in the Central Indian Highlands Reg. Environ. Change Sanchez P A and Swaminathan M S 2005 Cutting world hunger in
16 69–82 half Science 307 357–9
Moser C and Felton A 2007 The construction of an asset index Sibhatu K T, Krishna V V and Qaim M 2015 Production diversity
measuring asset accumulation in Ecuador Chronic Poverty and dietary diversity in smallholder farm households Proc.
Research Centre Working Paper No. 87 (https://doi.org/ Natl Acad. Sci. 112 10657
10.2139/ssrn.1646417) Sibhatu K T and Qaim M 2018 Farm production diversity and
Muthayya S, Rah J H, Sugimoto J D, Roos F F, Kraemer K and dietary quality: linkages and measurement issues Food
Black R E 2013 The global hidden hunger indices and maps: Security 10 47–59
an advocacy tool for action PLoS One 8 e67860 Terry A and Ryder M 2005 Coping with change: the transition
OECD/ICRIER 2018 Agricultural Policies in India, OECD Food from subsistence orientated rain-fed agriculture to
and Agricultural Reviews (Paris: OECD Publishing) (https:// commercial irrigated agriculture Geography 90 138–50
doi.org/10.1787/9789264302334-en) Terry A and Ryder M 2007 Improving food security in Swaziland:
Pellegrini L and Tasciotti L 2014 Crop diversification, dietary the transition from subsistence to communally managed
diversity and agricultural income: empirical evidence from cash cropping Nat. Resour. Forum. 31 263–72
eight developing countries Can. J. Dev. Stud. 35 211–27 Tilman D, Balzer C, Hill J and Befort B L 2011 Global food
Pingali P 2004 Westernization of Asian Diets and the demand and the sustainable intensification of agriculture
transformation of food systems: implications for research Proc. Natl Acad. Sci. 108 20260–4
and policy ESA Working Paper No. 04–17 (Agricultural and UKAID Department for International Development 2014 PACS in
Development Economics Division, The Food and Madhya Pradesh (available at: www.pacsindia.org/PACS-in-
Agriculture Organization of the United Nations) Madhya-Pradesh) (Accessed 24 April 2014)
Popkin B M 2006 Global nutrition dynamics: the world is shifting Von Braun J 1995 Agricultural commercialization: impacts on
rapidly toward a diet linked with noncommunicable diseases income and nutrition and implications for policy Food
Am. J. Clin. Nutr. 84 289–98 Policy 20 187–202
Popkin B M, Adair L S and Ng S W 2012 Global nutrition Von Braun J and Kennedy E 1986 Commercialization of subsistence
transition and the pandemic of obesity in developing agriculture: income and nutritional effects in developing
countries Nutr. Rev. 70 3–21 countries (Washington, DC: International Food Policy
Remans R et al 2011 Assessing nutritional diversity of cropping Research Institute)
systems in African villages PloS One 6 e21235 Waha K, Dietrich J P, Portmann F T, Siebert S, Thornton P K,
Rowe W C 2009 “Kitchen gardens” in Tajikistan: the economic Bondeau A and Herrero M 2020 Multiple cropping systems
and cultural importance of small-scale private property in a of the world and the potential for increasing cropping
post-soviet society Hum. Ecol. 37 691–703 intensity Glob. Environ. Change 64 102131
12You can also read