JOINT STRATEGIC NEEDS ASSESSMENT FOR TORBAY 2020-2021
←
→
Page content transcription
If your browser does not render page correctly, please read the page content below
JOINT STRATEGIC NEEDS ASSESSMENT
       FOR TORBAY 2020-2021

                                   0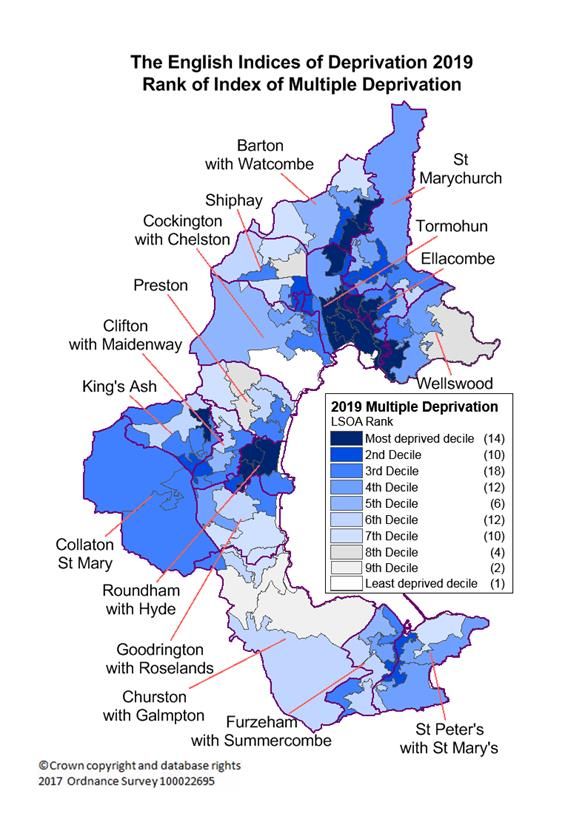
JSNA 2020
     CONTENTS

Contents

Statement from Chair of Health and Wellbeing Board……………………………………………………………………………………………………… 2

Executive Summary……………………………………………………………………………………………………………………………………………. 3

Key Facts………………………………………………………………………………………………………………………………………………………… 4

JSNA Key Challenges………………………………………………………………………………………………………………………………………….. 5

Introduction……………………………………………………………………………………………………………………………………………………… 6

Population Overview…………………………………………………………………………………………………………………………………………... 13

Starting and Developing Well………………………………………………………………………………………………………………………………… 23

Living and Working Well……………………………………………………………………………………………………………………………………… 33

Ageing Well……………………………………………………………………………………………………………………………………………………. 44

Spotlight on Torbay

            Citizens Advice………………………………………………………………………………………………………………………………… 55

            Carer Profile……………………………………………………………………………………………………………………………………. 56

            Relative Deprivation across the Bay………………………………………………………………………………………………………… 57

            Cancer – Facts across the life course………………………………………………………………………………………………………. 58

Appendix……………………………………………………………………………………………………………………………………………………….. 59

                                                                                           1
JSNA 2020
HEALTH AND WELLBEING BOARD STATEMENT

      Chair of the Health and Wellbeing board

      I am pleased to bring to you the latest Torbay Joint Strategic Needs Assessment (JSNA). The JSNA helps us to build a picture of the needs of
      our communities, covering all aspects of people’s lives. It highlights those areas of our population where we need to focus our efforts to tackle
      poorer health outcomes.

      It is ten years since the Marmot Report, Fair society, Healthy Lives was published. The Marmot Report showed how inequalities in society led
      to inequalities in how long we live, and how many years we live with illness or disability. It set out a strategy to address the social determinants
      of health – the conditions in which we are all born, grow, live, work and age – to reduce inequalities and improve health outcomes for all.

      In the intervening years the inequalities gap has not narrowed but widened. And those most adversely affected are the most vulnerable in our
      communities, who often live in the areas of highest deprivation. It is essential that we work together, across all sectors, to reverse this trend.

      The JSNA shows us where our major challenges lie: there is a six year gap in life expectancy between different areas of the Bay. Torbay has
      the highest levels of deprivation in the South West. We have an ageing population facing the challenges of ill-health, loneliness and frailty. We
      also have high levels of children living in poverty, child and adult obesity, and suicide. Poorer environmental conditions are inevitably
      associated with poorer physical and mental wellbeing.

      Here in Torbay we want all of our residents to thrive. We want this to be a place where inequalities are reducing, and where our children,
      families and older people have high aspirations, rewarding jobs, and good quality affordable housing. This is particularly challenging in a year
      when we have seen a global pandemic, which has had an impact on all aspects of our lives and affects our most vulnerable communities the
      most.

      The original Marmot Report was also all about empowering and sustaining communities. Torbay has a proud history of partnership between
      statutory and voluntary sectors, with a strong community voice. As a Council we are determined to work alongside our communities to drive
      improvements in health and wellbeing by improving the conditions in which we all live, work and grow. No one organisation can bridge the
      inequality gap but together we can make a difference.

      Councillor Jackie Stockman
      Chair
      Torbay Health and Wellbeing Board

                                                                                                                                                           2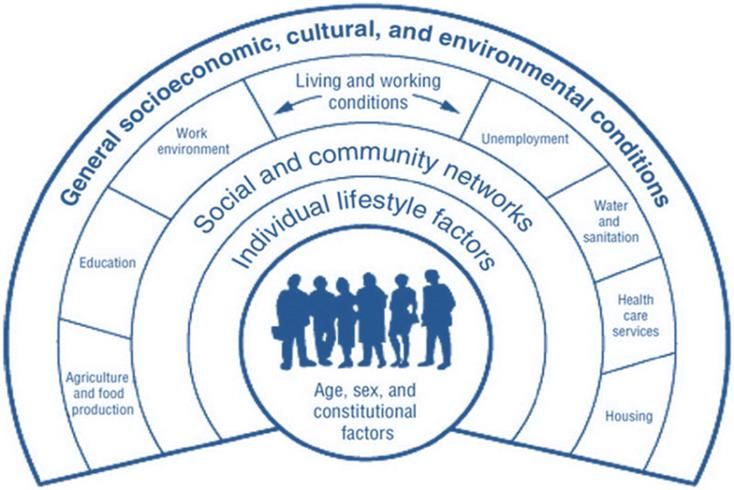
JSNA 2020
EXECUTIVE SUMMARY

Executive Summary

The Joint Strategic Needs Assessment (JSNA) provides an analysis of the current and future health and social care needs of the communities
within Torbay.

This document takes a lifecourse view of population characteristics and needs, presenting detailed analysis of needs and risks relating to
health and wellbeing at different points of life: children and families, working age adults, and those aged 65 and over. Understanding the
different risks and needs at the different life stages helps us to target efforts to tackle poor health and inequalities for different population
groups, through the services we commission and the plans we put in place.

Figure 1: Geography & demography of Torbay

Spanning the three South Devon towns of Torquay, Paignton and Brixham,
Torbay has a collective population of 135,780 (2018 mid-year population
estimates). With its rich history, breathtaking natural environment and
longstanding reputation as a popular tourist and retirement destination,
Torbay has enormous potential to provide individuals and families with the
opportunity to live a healthy and fulfilled life.

Like many other coastal towns however, Torbay has its challenges. A
predominantly low-wage, low-skill economy that is over reliant on the
seasonal tourism industry, it is now amongst the weakest in the country.
Torbay also has pockets of significant poverty and deprivation, and is ranked
as the most deprived upper-tier local authority in the South West.

Inequalities continue to widen as relative deprivation worsens, and 27% of
Torbay residents live in the 20% most deprived areas in England. With high
levels of vulnerability across all three towns, Torbay has the second highest
rate of looked after children in England, and the highest domestic violence
rate in the South West.

                                                                                                                                                    3
JSNA 2020
           KEY FACTS

                                                           Key Facts
   Torbay is home to                 The average age of a              Torbay is home to 42                The average price of a
  135,780 people                     Torbay resident is   48               state schools                  house is   £195,000

  26 out of 100                      19 out of 100                     There are 85 residential
residents are 65 and over            residents are children            care and nursing homes
                                                                                                          The average full-time
                                                                                                          salary is £25,871

Torbay has approximately    4.5     26 beaches to enjoy along 22         There were                         Torbay has 10 GP Practice
 million   visitors each year              miles of coastline           1,220 births                        groups and 35 Pharmacies
                                                                         during 2018

                                                                                    The proportion of
                                                                                  people who live in an
                                   Over 100 miles of footpaths,                    area classified as
  Torbay contains over   70       permissive routes and horse-riding
                                                                                                              Torbay residents make
           parks                                                                   amongst the 20%
                                     routes criss-crossing Torbay                 most deprived areas      52,000 A&E attendances
                                                                                      of England is         and 20,000 emergency
                                                                                  27 out of 100            admissions to hospital each
                                                                                                                     year

                                                                                                                                         4
JSNA 2020
JSNA KEY CHALLENGES
JSNA Key Challenges
The key challenges facing the population and the organisations that serve the population are highlighted below.
There is significant variation in health and wellbeing across the bay. In our most affluent areas residents can expect to live on average
over six years longer than those living in our more deprived communities.
Inequalities have been widening as relative deprivation worsens; Torbay is ranked as the most deprived local authority in the South
West region.
Torbay’s economy is ranked amongst the weakest in England, and has declined in recent years. With the disruption to the economy
caused by COVID-19 the economy is expected to weaken further. Torbay’s economy is highly dependent on tourism and unemployment
is beginning to rise.
The number of children looked after by the local authority remains amongst the highest in England and around 1 in 4 children continue
to live in households where income is less than 60% of the median income (living in poverty).
We have an ageing population with the number of people aged over 85 expected to increase by over 50% within the next decade or so.
As the population ages it is also expected that we will see more people become frail and require support from health and social care
services.
There are many opportunities for the people of Torbay to be supported to improve their lifestyles. At present:
o Around 6 out of 10 adults in Torbay are overweight or obese
o Around 1 in 6 adults in Torbay smoke
o There are high levels of suicide and self-harm in the population
o There are high levels of vulnerability in the population, including groups with specialist needs and high levels of mental ill health
This document is part of the JSNA in Torbay, a large part of the JSNA is the district, town and electoral ward profiles which cover the life
course. These can be found at: www.southdevonandtorbay.info/jsna
There is also a range of topic based analyses relating to different aspects of health and wellbeing. All information can be found on our
webpages: http://www.southdevonandtorbay.info/
5
JSNA 2020
INTRODUCTION

               Introduction

                              6
JSNA 2020
     INTRODUCTION

Background

A Joint Strategic Needs Assessment (JSNA) is an assessment of the current and future health and social care needs of the local community.

The JSNA helps local leaders to work together to understand and agree the needs of the local population. JSNAs, along with health and
wellbeing strategies enable commissioners to plan and commission more effective and integrated services to meet the needs of the population.
Local Authorities and Clinical Commissioning Groups have equal and explicit obligations to prepare a JSNA, under the governance of the
health and wellbeing board1

The approach to the JSNA in Torbay is to provide a collection of narrative and data interpretation to support the community, voluntary sector
and statutory organisations across Torbay. This provides a central, consistent range of data that can be accessed to support commissioning
strategies and funding bids across all sectors within Torbay.

Helping people to live longer and healthier lives is not simply about NHS healthcare received through GPs or at hospital. It is also about the
wider social determinants of where we live and work, things such as Crime, Income, Housing and Education. The collective action of agencies
is needed today to promote the health of tomorrow’s older population. Preventing ill health starts before birth, and continues to accumulate
throughout individuals’ lives.

Structure

This document is part of a wider suite of documents and presentations that make up the JSNA for Torbay, these include breakdowns of
information to the three towns of Torbay and its constituent wards. As well as the JSNA, there are specific topic based summaries relating to
fields such as smoking and dental caries. This information is collated at the following website http://www.southdevonandtorbay.info/

Information sources

Information that makes up this document comes from a multitude of sources, these will be credited throughout the profile. A very significant
amount of information is gathered at the Public Health England website called ‘Fingertips’. This site contains a large amount of information on
its ‘Public Health Outcomes Framework’, there are also multiple useful profiles relating to subjects such as Mental Health, Alcohol and
Tobacco. The site shows Torbay’s position relative to other local authorities.

The following organisations have also contributed data directly to this JSNA:
Citizens Advice, Torbay & South Devon NHS Foundation Trust, Torbay Community Safety Partnership, Torbay Council Education Department.

1
    Statutory Guidance on Joint Strategic Needs Assessments and Joint Health and Wellbeing Strategies, Department for Health, March 2013

                                                                                                                                                  7
JSNA 2020
INTRODUCTION
Document Overview
The written narrative is themed into the following chapters:
Population overview shows the demography, wider determinants and Index of Multiple Deprivation (IMD) across all ages
Starting and developing well is about understanding the needs of the population between 0 and 24
Living and working well is about understanding the needs of the working age population
Ageing well is about understanding the needs of those aged 65 and over.
Life course
A life course approach affords an understanding of needs and risks to health and wellbeing at different points of life. This is a useful
differentiation as our needs as young people are often significantly different to our needs when we reach retirement. Understanding the
different risks and needs at the various stages of life enables the opportunity to promote positive health and wellbeing and to prevent future ill
health. Also it provides an overview of the potential issues within Torbay that need to be considered when commissioning and delivering
services.
An understanding of the life course also shows how a young person’s experiences from birth can influence their socioeconomic and health
future. An ability to understand these influences may help to mitigate the future levels of ill-health and inequalities.
Wider determinants of health
It is not possible to change some of our individual determinants of health, such as our age, our sex at birth and genetic makeup. However,
there are other factors that we can try to influence in regard to the wider determinants of health. Wider determinants of health are a diverse
range of social, economic and environmental factors which influence people’s mental and physical health.
These include the following influences which are presented in Figure 2:
Individual lifestyle factors – Smoking, alcohol, physical activity and diet
Social and community network – Relationships with family, friends and the wider community
8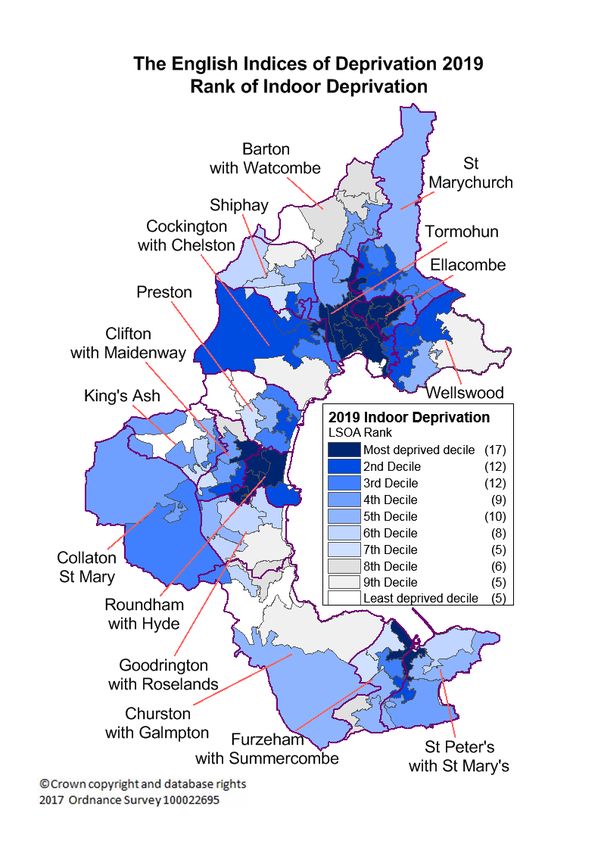
JSNA 2020
INTRODUCTION
Living and working conditions – Includes access and opportunities in relation to jobs, housing, education and welfare services
General socioeconomic, cultural and environmental conditions – Includes disposable income, taxation and the availability of work
Influencing these areas, across the life course, is required to reduce inequalities such as the gaps in healthy life expectancy.
Figure 2: Wider determinants of health
Source:G.Dahlgren, M Whitehead – Policies and strategies to promote social equity in health
9JSNA 2020
INTRODUCTION
Inequalities
Inequalities are variances between different groups within society that are both avoidable and unfair. They develop out of the conditions that we
are born, grow, live, work and age in. These conditions impact in different ways as well as in different combinations, which manifest in such a
way as to be either beneficial or detrimental to people’s lives, such as health behaviours, health status and wellbeing.
Inequalities can exist between population groups in a geographic community in different ways, with many individuals and groups intersecting
across two or more of these (Figure 3).
Figure 3: Inequalities and intersection
Socio-economic groups and deprivation: Examples include those who are unemployed, on low incomes or people living in
deprived areas.
Protected characteristics: The Equality Act protects people against discrimination because of the nine protected characteristics
that we all have. Examples of protected characteristics are sex, race, sexual orientation, and disability.
10JSNA 2020
INTRODUCTION
Vulnerable groups in society: These are groups of people who because of certain factors mean they are more at risk than others
in society and/or marginalised in society. Examples include people with a disability, people with substance misuse problems,
prisoners, and homeless people. Inclusive health groups can be an alternative term that is often used for this population group.
Comparisons
The Chartered Institute of Public Finance and Accountancy (CIPFA) has developed an approach to aid benchmarking and comparing similar
local authorities. These are known as nearest neighbours. Torbay’s nearest neighbours are presented below. Within this report Torbay will be
compared to a ‘comparator group’ in data tables and graphs, the statistic shown is the average of the nearest neighbours including Torbay.
% of 2018 population
Total Aged 65 % of
living in 20% most
Local Authority Population & over population
deprived areas
(2018) (2018) aged 65+
(IMD 2019)
Blackpool 56.7% 139,305 28,402 20.4%
Bournemouth, Christchurch and Poole 11.6% 395,784 85,245 21.5%
Darlington 30.2% 106,566 21,588 20.3%
Dudley 28.1% 320,626 65,175 20.3%
East Riding of Yorkshire 7.8% 339,614 87,485 25.8%
Isle of Wight 13.8% 141,538 39,294 27.8%
North East Lincolnshire 36.6% 159,821 32,299 20.2%
North Tyneside 21.1% 205,985 41,165 20.0%
Northumberland 20.5% 320,274 77,725 24.3%
Redcar and Cleveland 36.0% 136,718 30,435 22.3%
Sefton 30.7% 275,396 64,032 23.3%
Southend-on-Sea 22.9% 182,463 35,097 19.2%
St. Helens 42.9% 180,049 36,788 20.4%
Stockport 17.4% 291,775 58,064 19.9%
Torbay 27.5% 135,780 35,907 26.4%
Wirral 35.8% 323,235 69,811 21.6%
Source: IMD 2019, ONS Mid-year population estimates
11JSNA 2020
INTRODUCTION
Protected Characteristics
Figure 4: Protected Characteristics
• Under 18 population - • Female population - • 12% of those living in
19% 69,654 Torbay say that their
• 18 to 64 population - • Male population - day to day activities
55% 66,126 are limited a lot
• 65+ population - 26%
Age Sex Disability
Protected characteristics are the nine
• The Gender Identity • 47% of people aged • There were 1,220 live characteristic groups protected under the Equality
Research and 16 and over are births to Torbay Act 2010, these are listed in Figure 4. Under the
Education Society married or in a civil mothers during 2018 Act, people are not allowed to discriminate, harass
estimates that 1% of partnership
the population is • 29% of people aged
or victimise another person because they have
gender variant to 16 and over are any of the protected characteristics. There is also
some degree single protection against discrimination where someone
Marriage and is perceived to have one of the protected
Gender Pregnancy
Civil characteristics or where they are associated with
Reassignment and Maternity
Partnership someone who has a protected characteristic.
• 95% White British • 65% have a religion • In the South West,
• This compares to • 35% have no religion 2.8% of those over 16
80% for England or did not state that identified their
they had one sexuality as either
Lesbian, Gay,
Bisexual or Other.
Religion or Sexual
Race
Belief Orientation
12JSNA 2020
POPULATION OVERVIEW
Population Overview
13JSNA 2020
POPULATION OVERVIEW
Population Overview
Torbay is home to The average age of Torbay's population is There were 1,220
135,780 a Torbay resident projected to increase to births during 2018
people is
149,500 by 2040
48 years
The average life Healthy life
expectancy for expectancy for Currently 26 out of 100
females is 83 females and males Torbay residents are aged 65 and
years, for males it is over. By 2040 this is projected to rise
is 79 years 62 years to 34 out of 100
The proportion of people There were 12,241 The average price of a house in
13 out of 100 who live in an area recorded crimes within Torbay is 8 times average full-
Torbay households classified as amongst the Torbay during 2018/19 time earnings
are experiencing 20% most deprived areas
fuel poverty of England is
27 out of 100
The highest rates of pre- Torbay has significantly lower
paid electricity meters levels of air pollution than the
are concentrated in 30 out of 100 There were 3,712
England average.
central Torquay and children live in the 20% recorded occurrences of
Paignton most deprived areas of domestic abuse within
England Torbay during 2018/19
14JSNA 2020
POPULATION OVERVIEW
POPULATION
The population profile of an area can help to tell you many things about the potential needs of an area and in the case of population projections
it provides a glimpse to future needs. For instance, a projected increase in the number of older people in a population will mean that a rise in
demand for health & social care is likely to occur. A rise in the under 18 population would lead to increased demand for educational places,
youth activities or possibly increased demand for children’s social care services.
Torbay has a resident population of 135,780 (ONS Mid-Year
Figure 5 Estimate 2018), 51.3% of the population is female and has a
Population pyramid significantly older demographic than England, the median
Torbay (2018) age of residents in Torbay is 48 years (England – 39 years).
Source: NOMIS Torbay has higher rates of residents in all age quinaries
above the age of 50 than England and lower rates for all age
quintiles below 50 (Figure 5).
Torbay’s population is currently projected to rise from
135,780 in 2018 to 149,500 by 2040. The proportion of the
population aged 0 to 19 is projected to remain relatively
Figure 6 steady, the significant changes in the demographic
Population proportions is projected to take place in the 20 to 64 and 65+
projections for age groups. Those aged between 20 and 64 are projected
Torbay to fall from 53% to 46% by 2040, the proportion of those
Source: NOMIS
aged 65 and over is expected to rise from 26% in 2018 to
34% by 2040 (Figure 6). The projected rate of fall amongst
the 20 to 64 age group population is steeper than the
projections for England as a whole.
For more information, visit the Life expectancy, births and mortality pages at http://www.southdevonandtorbay.info
15JSNA 2020
POPULATION OVERVIEW
LIFE EXPECTANCY
Life expectancy and healthy life expectancy are important measures of mortality and ill health showing the trends in different sections of the
community. Whilst life expectancy is an important measure, there is also the amount of someone’s life that they spend in a healthy condition
and the importance of that to their wellbeing. Significant advances in medicine may well keep someone alive for longer but the quality of life
enjoyed may be relatively poor.
Figure 7 There has long been a relationship between income
Female and male life and poorer health outcomes. One of these health
expectancy at birth outcomes is life expectancy. The gap in life
by deprivation expectancy between the most and least deprived
quintile Torbay (2013 quintiles in Torbay is 6 years. The difference
to 2017) between females in most and least deprived quintiles
Source: PCMD, is 4.3 years, for males this gap is 7.7 years (Figure
ONS Mid-year population 7). There is very little overall difference in life
estimates
expectancy when compared to national and
comparator groups (CIPFA).
Figure 8 Figure 9
Female healthy life Male healthy life
expectancy at birth expectancy at birth
Source:Public Health Source:Public Health
Outcomes Framework (PHOF) Outcomes Framework (PHOF)
Females in Torbay would expect to live 4 years longer than their male counterparts but the numbers of years spent in good health is the same
as males (Figures 8 and 9). This is not significantly different to national and CIPFA comparator rates.
For more information, visit the Life expectancy, births and mortality pages at http://www.southdevonandtorbay.info
16JSNA 2020
POPULATION OVERVIEW
DEPRIVATION
The latest Index of Multiple Deprivation (IMD) was released in September 2019.
The IMD measures relative levels of deprivation in small geographical areas
Figure 10
called Lower-layer Super Output Areas (LSOA). There are 32,844 LSOAs within
Rank of Index of Multiple Deprivation (IMD)
England of which 89 make up the area of Torbay. It should be noted that the
IMD is measuring relative levels of deprivation, for example a better rank in
crime deprivation does not mean that Crime levels are falling, simply that levels
of crime used to calculate the IMD are not rising as quickly as other local
authorities. It is also important to note that not everyone living in a deprived area
is deprived and vice versa when applied to a non-deprived area. In general,
those people who live in more deprived areas are more likely to die earlier and
suffer more ill health.
The IMD is made up of the following deprivation sub-categories (% of weighting
indicated in brackets):-
Income (22.5%)
Employment (22.5%)
Education, Skills and Training (13.5%)
Health and Disability (13.5%)
Crime (9.3%)
Barriers to Housing and Services (9.3%)
Living Environment (9.3%)
The 2019 IMD showed that 24 out of 89 LSOAs within Torbay had levels of
deprivation that placed them in the 20% most deprived areas of England
(Figure 10), this equates to 27% of the population. This is a small improvement
on the previous incarnation of the IMD in 2015 when Torbay had 28 LSOAs in
the 20% most deprived areas of England, equating to 32% of the population.
Source: Index of Multiple Deprivation (2019)
For more information, visit the Deprivation pages at http://www.southdevonandtorbay.info
17JSNA 2020
POPULATION OVERVIEW
INCOME DEPRIVATION
One of the domains of deprivation is Income deprivation which accounts for 22.5% of the 2019 IMD score. Income deprivation relates to the
proportion of the population experiencing deprivation related to low income.
The measures used in calculating income deprivation
are listed below:-
Figure 11 Income Support
Percentage of Income-based Jobseeker Allowance
Torbay population Income-based Employment and Support Allowance
amongst the 20% Pension Credit (Guarantee)
most income Working Tax & Child Tax Credit families whose
deprived in England income is below 60% of the median (before housing
Source: IMD 2019 costs)
Asylum seekers in receipt of subsistence support,
accommodation support, or both
Out of the 151 upper-tier local authorities, Torbay ranked as the 24th most deprived in relation to Income (2015 – 30th). This equates to 32% of
Torbay residents living in an area amongst the 20% most deprived areas in England (2015 – 32%) (Figure 11).
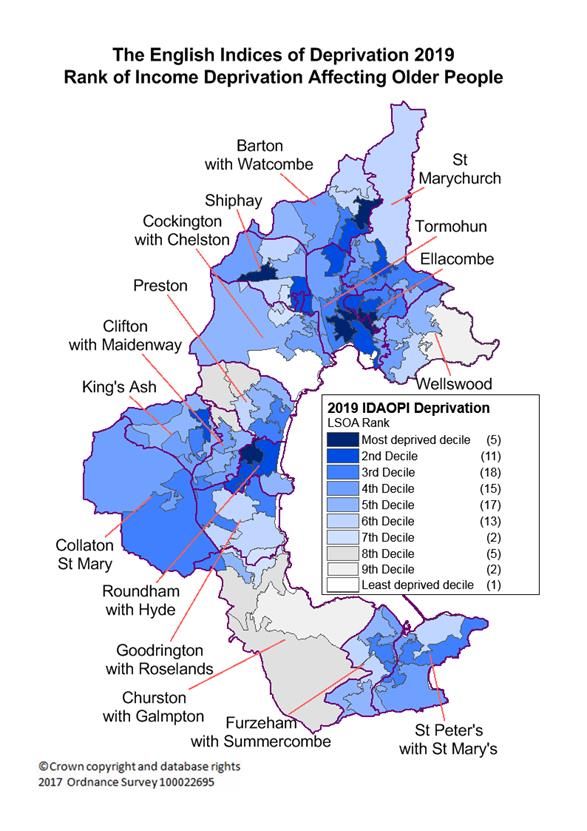
Figure 12 Figure 13
Proportion of Proportion of older
children aged 0 to 15 people aged 60+
living in 20% most living in 20% most
income deprived income deprived
areas affecting areas affecting older
children in England people in England
Source: IMD 2019 Source: IMD 2019
There are age specific indicators within the Income indicator that show the proportion of children living in income deprived families (Figure 12)
and the proportion of those aged 60 and over who experience income deprivation (Figure 13).
For more information, visit the Deprivation pages at http://www.southdevonandtorbay.info
18JSNA 2020
POPULATION OVERVIEW
ENVIRONMENT
Poor air quality is a significant public health issue. There is clear evidence that high levels of fine particulate matter has a significant
contributory role towards poor health in a community. Accidents involving road vehicles are significant causes of preventable deaths,
particularly in younger age groups. The vast majority of road traffic collisions are preventable and can be avoided through improved education,
awareness and vehicle safety.
Figure 14 Concentration of human-made fine particulate matter
Air Pollution – within Torbay has been consistently below national
Concentration of and regional levels (Figure 14). Over the seven
human-made fine years shown there has been a degree of variance
particulate matter from year to year, there has been little overall change
Source: Public Health
Outcomes Framework between 2011 and 2017.
Figure 15 The number of Torbay residents killed and seriously
Killed & seriously injured on England’s roads has consistently been
injured casualties on below the national rate (Figure 15). It should be
England’s roads per noted that figures are the adjusted figures provided
100,000 population by the Department for Transport to take account of
Source: Department for
Transport changes in severity reporting systems since 2016.
For more information, visit the Wider Determinants Of Health pages at fingertips.phe.org.uk
19JSNA 2020
POPULATION OVERVIEW
HOMELESSNESS
People can become homeless for various reasons including: eviction, relationship breakdown, domestic abuse, being asked to leave by
family/friends, neighbour harassment and a disaster such as fire or flooding.
Some people who are homeless end up on the street. The rough sleepers count is a count/estimate by English Local Authorities of the number
of people sleeping rough on one night each Autumn. There were 16 rough sleepers counted in Torbay in October 2019 compared to 19 the
previous year. Rough sleeping, although a very visible sign of homelessness, is only one type. There are homeless households living in
emergency temporary accommodation, placed by Torbay Council under statutory homeless legislation. There are also the hidden homeless
such as sofa surfers who stay for short periods with different friends and family because they have nowhere settled to stay. Being homeless or
living in poor housing has a detrimental effect on both physical and mental health. Homelessness can be caused by, or lead to, poor mental
health and addiction and it is often difficult for homeless people to access health services.
For the year 2018/19, 760 Torbay residents were in treatment at specialist drug misuse services, this is part of a gradual upward trend over the
last five years. 385 Torbay residents were in treatment at specialist alcohol misuse services, numbers have been steady for the last four years.
These figures comes from the National Drug Treatment Monitoring System.
Figure 16 Figure 17
Statutory Rate of rough
homelessness: sleepers per
rate per 1,000 100,000 (2017 to
households 2019)
Source: Public Health Source: Rough Sleeping
Outcomes Framework snapshot in England
Torbay’s rate of statutory homelessness has risen significantly since Rates of rough sleepers over the period 2017 to 2019 have been over
2015/16 (Figure 16). 50% higher than national and regional rates (Figure 17).
For more information, visit https://www.torbay.gov.uk/housing/homeless/
20JSNA 2020
POPULATION OVERVIEW
INDOOR DEPRIVATION & PRE-PAID ELECTRICITY METERS
A sub-domain of the Index of Multiple Deprivation (IMD) relates to Indoor
Figure 18 Deprivation, this is a measurement of the quality of housing stock within Torbay
Rank of Indoor Deprivation in reference to 1) Housing in poor condition and 2) Housing without central
heating. Poor housing and heating can exacerbate poor physical and mental
health and leave people more vulnerable to illness.
The 2019 IMD shows that 29 out of 89 Torbay LSOAs are classified as being in
the 20% most deprived areas for Indoor deprivation in England (Figure 18), this
equates to 32.9% of the population. This is a reduction when compared to 2015
(40 LSOAs equating to 45.7% of the population).
Prepayment Electricity meters are where a customer has to pay for their
electricity before they use it, this is usually done by adding money to a smart
card, which is then inserted into the meter. These meters are often used in rental
properties where there has been a history of payment arrears and defaults.
Often prepayment customers are charged more for each unit of electricity than
customers on standard credit meters.
The highest rates of pre-paid electricity meters are concentrated in the most
deprived areas of Torbay such as Tormohun (Central Torquay) and
Roundham with Hyde (Central Paignton). These areas have rates over triple
the national average. Conversely, the lowest proportions of these meters
occurs in the more affluent areas of Torbay such as Churston with Galmpton
with rates less than half the national average. This leads to some of the
poorest members of our community having to pay higher rates per unit of
energy for their electricity compared to the tariffs available to more affluent
members of the community. As these people will often rent poor quality
housing stock that is colder and more prone to damp, this is likely to lead
them not being able to heat their property sufficiently well, which could have
Source: Index of Multiple Deprivation (2019) significant effects on their health and wellbeing. This data relates to 2017.
21JSNA 2020
POPULATION OVERVIEW
Population overview summary profile (Sources in Appendix)
CIPFA RAG Rating
comparator compared
Indicator Measure Torbay group South West England to England
DEMOGRAPHY
Average Age (2018) Years 48 44 43 39
Dependency Ratio (2018) Ratio 73.1 64.0 62.7 57.0
Life expectancy at birth - Female (2015 - 17) Years 82.8 82.5 83.7 83.1
Life expectancy at birth - Male (2015 - 17) Years 78.7 78.8 80.2 79.6
Healthy life expectancy - Female (2015 - 17) Years 62.4 62.4 65.1 63.8
Healthy life expectancy - Male (2015 - 17) Years 62.0 61.4 64.7 63.4
Rate per
Birth rate (2018)
1,000
60.9 59.2 56.3 59.2
DSR per
Mortality rate (All ages) (2016 - 18)
100,000
1,012 1,008 916 959
DSR per
Premature mortality (Under 75s) (2016 - 18)
100,000
372 359 302 331
Population living in most deprived areas
(2019)
% 27.5% 25.0% 10.4% 20.0%
BAME population (2011) % 2.5% 4.2% 4.6% 14.6%
WIDER DETERMINANTS
Rate per
Crime rates (2018/19)
1,000
90.6 89.3 67.3 88.1
Rate per
ASB rates (2018/19)
1,000
31.0 25.4 24.1 24.2
Rate per
Domestic abuse rates (2017/18)
1,000
31.6 Unavailable 19.9 25.1
Fuel Poverty (2017) % 12.6% 11.6% 10.8% 10.9%
Adult carers who have as much social contact
as they would like (2016/17)
% 34.4% 37.0% 32.3% 35.5%
Adult social care users who have as much
social contact as they would like (2017/18)
% 43.1% 47.1% 46.0% 46.0%
Smoking Prevalence (2018) % 16.0% 14.1% 13.9% 14.4%
Children in low income families (2016) % 21.2% 18.7% 14.0% 17.0%
Percentage of population living in most
indoor deprived areas (2019)
% 32.9% 24.0% 30.8% 20.6%
Housing Affordability (2018) Ratio 8.0 6.5 8.9 7.3
NHS
DSR per
Alcohol Admissions (2018/19)
100,000
812 801 688 665
DSR per
Planned admission rate (16/17 - 18/19)
100,000
16,514 17,632 15,426 16,109
DSR per
Unplanned admission rate (16/17 - 18/19)
100,000
13,709 12,401 10,392 11,049
DSR per
A&E attendances rate (16/17 - 18/19)
100,000
38,571 40,925 33,186 37,590
Direction of arrow relates to direction of travel since the previous period
Colour of arrow relates to RAG rating relative to England (Red – Significantly worse, Amber – Not
significantly diferent, Green – Significantly better than England, Black – Not compared to England)
22JSNA 2020
STARTING AND DEVELOPING WELL
Starting and Developing Well
23JSNA 2020
STARTING AND DEVELOPING WELL
Starting and Developing Well Overview
Torbay is home to 13 out of 100 babies There were 51 pregnancies to 18 out of 100 children
are born to mothers who were have Special Educational
25,423 children women aged under 18, less
smokers at the time of delivery Needs
than half the rate for 2011
71 out of 100 children
are 'school ready' by the end 94 out of 100 16 &
There were 1,220 42 out of 100 infants of reception. 17 year olds are in
births during 2018 For those children eligible for free
are breastfed at 6-8 weeks education, employment or
school meals this falls to 53 out
training
of 100
In Reception 25 out of 100
As of 31 March 2019 821 recorded occurrences
children are overweight or obese.
64 out of 100 school Looked After Children - 362 of domestic abuse where
children are physically Children subject to Child Protection children were present during
By Year 6 this rises to 35 out active or fairly active 2018/19
Plans - 179
of 100
Children in Need - 1,067
93 out of 100 5 year
olds have had their MMR
35 out of 100 children 21 out of 100 vaccination (2 doses)
44 out of 100
aged 5 have one or more children are part of a admissions for self-harm
decayed or filled teeth low income family relate to 10 to 24 year olds
24JSNA 2020
STARTING AND DEVELOPING WELL
This section brings together information around Torbay’s 0 to 24 year old population relating to fields such as Health, Education and Social
Care. This aims to be an overview of key indicators that indicate the position and experiences of children and younger people in Torbay.
SCREENING AND IMMUNISATIONS
Figure 19 Figure 20 Figure 21
MMR Vaccination coverage for 5 year Chlamydia detection rate for 15 to 24 HPV vaccination coverage for 13 to 14
olds (2 doses) year olds per 100,000 year old females (2 doses)
Source: Public Health Outcomes Framework (PHOF) Source: Public Health Outcomes Framework (PHOF) Source: Public Health Outcomes Framework (PHOF)
The MMR vaccine provides a safe and Chlamydia is the most commonly The HPV immunisation programme was
effective vaccine that protects against diagnosed bacterial STI in England, with introduced to protect against the main
measles, mumps and rubella. The target sexually active young people at highest causes of cervical cancer. The first dose
for this vaccination rate is 95%. Torbay risk. The chlamydia detection rate is usually offered in Year 8 (aged 12-13)
is rated as amber with a 2018/19 rate of amongst under 25 year olds is a and the second dose in Year 9 (aged 13-
93.3%, this is significantly above the measure of chlamydia control activity. 14). The target for this vaccination rate
regional rate and the English rate for An increased detection rate is not a is 90%. Torbay is rated as red with a
2018/19 of 86.4% (Figure 19). measure of chlamydia rates increasing in 2017/18 rate of 77.4%, this is
the community. The target for chlamydia significantly below the regional rate and
detection is 2,300 per 100,000 15 to 24 the English rate for 2017/18 of 83.8%
year olds, Torbay’s rate has fallen under (Figure 21).
this since 2016, for 2018 it is significantly
lower than England (Figure 20).
For more information, visit the Health Needs Assessment pages at http://www.southdevonandtorbay.info
25JSNA 2020
STARTING AND DEVELOPING WELL
PHYSICAL ACTIVITY AND WEIGHT
Attitudes towards sport and physical activity are often shaped by experiences in childhood. In adults, those with a physically active lifestyle
have a 20-35% lower risk of cardiovascular disease, coronary heart disease and stroke compared to those who have a sedentary lifestyle.
Studies tracking child obesity into adulthood have found that the probability of overweight or obese children becoming overweight or obese
adults increases with age. This will lead to additional numbers of adults in the future suffering health complications due to excess weight.
The Chief Medical Officer guidelines state that children
Figure 22 should take part in sport and physical activity for at
Sport and Physical least 60 minutes a day. During 2017/18, Sport
Activity levels in England undertook their first ‘Active Lives Children and
Torbay 2017/18 (5 to Young People’ survey. One measurement related to
16 year olds) Sport and Physical Activity levels of children and
Source: Active Lives Children
and Young People Survey Active – Active for average of 60 minutes or more a day young people between the ages of 5 and 16. Torbay
2017/18 Fairly active – Active for an average of 30 to 59 minutes a day figures were in line with national figures (Figure 22).
Less active – Active for an average of less than 30 minutes a day
Beat the Street is a game that for 6 weeks in Autumn 2018 turned Torbay into a game where children and adults could walk, cycle and run from
point to point tapping their ‘Beat the Street’ card on sensors (Beat Boxes) placed on lamp posts. By the end of the 6 week period, 51% of
school children in the 30 state primary schools within Torbay had participated in the event.
2012/13 was the peak prevalence of overweight
Figure 23 (including obese) children in Reception (27.8%) and
Prevalence of Year 6 (38.4%). For both age groups there was a fall,
overweight children followed by a plateauing of the rates with Reception
Source: Public Health
Outcomes Framework (PHOF) rates remaining consistently above national rates
(Figure 23).
For more information, visit the NCMP and Child Obesity Profile at fingertips.phe.org.uk
26JSNA 2020
STARTING AND DEVELOPING WELL
TOBACCO AND ALCOHOL
The Tobacco Control Plan https://www.gov.uk/government/publications/towards-a-smoke-free-generation-tobacco-control-plan-for-
england stresses the importance of reducing the number of young people who take up smoking. One of the national ambitions was to reduce
rates of 15 year old regular smokers to 3% by 2022. Alcohol consumption contributes to hospital admissions and deaths in relation to a large
range of conditions. Alcohol misuse is estimated to cost the NHS about £3.5 billion per year and society as a whole £21 billion annually.
Figure 24 Figure 25: Percentage of 11 to 15 year Figure 26: Rate of admission episodes
Tobacco & E-cigarette status of 15 year olds who have been drunk in the last 4 for alcohol specific conditions per
olds – England (2018) weeks - England 100,000 – Under 18s
Source: Smoking, Drinking & Drug Use among Young People Source: SDD Source: Public Health Outcomes Framework
in England survey (SDD)
The SDD survey for 2018 shows the The SDD report results from a biennial The rate of admissions of under 18s for
proportion of 15 year olds who are survey of secondary school pupils in alcohol specific conditions within Torbay
regular smokers stands at 5%, this is England in years 7 to 11. This report has consistently been above national
down from 14% in 2008. In the 2018 indicates a fall in the number of rates (Figure 26) although they have
survey, 84% of 11 to 15 year olds have secondary school pupils consuming been generally on a downward trend. It
never smoked (2008 – 68%). The survey alcohol, and in particular a fall in those is noticeable that rates have begun to
also looks at E-cigarettes, the number of getting drunk since 2006 (Figure 25). steadily increase over the last couple of
15 year olds who have never tried periods.
tobacco is higher than those who have
never tried e-cigarettes (Figure 24).
Graph does not include ex-smokers or
those who tried once.
For more information, visit the Topic Based Overviews pages at http://www.southdevonandtorbay.info
27JSNA 2020
STARTING AND DEVELOPING WELL
MENTAL HEALTH AND WELLBEING
Mental wellbeing is of particular importance to children and young people as it is thought to influence the way in which an individual copes with
key life events such as stress, trauma and physical ill-health. 1 in 10 children will have a clinically diagnosed mental disorder at any one point
during childhood (Measuring mental wellbeing in children and young people – PHE (2015)).
Figure 27 Figure 28: Percentage of school pupils Figure 29: Hospital admissions as a
Domestic Abuse where children present - with social, emotional and mental health result of self-harm (10 – 24 years)
Torbay needs as a primary need (2015 – 2018) Source: Hospital Episode Statistics (HES)
Source: Torbay Community Safety Partnership Source: Public Health Outcomes Framework
Domestic abuse has a devastating impact on Torbay schools have a significantly Hospital admissions as a result of self-
children and young people that can last into higher rate of pupils recognised as harm amongst 10 to 24 year olds in
adulthood. Over the last four years (2015/16 to having a primary need of social, Torbay have been significantly higher
2018/19), there have been 13,928 recorded emotional and mental health (Figure than England. It should be noted that
crimes and incidents which have been flagged as 28). It should be noted that this is a because of the numbers involved (less
domestic abuse. In 29% of these cases, the measure of recognised primary need than 200 admissions on average per
police have recorded a child as being present and is likely to be an understatement of year in Torbay), it is possible for a
(Figure 27). the number of school pupils who handful of individuals with significant
actually have these needs. levels of admissions to skew the figures.
However, the pattern for Torbay having
significantly higher rates than England is
significant (Figure 29).
For more information, visit the Children and Young People’s Mental Health and Wellbeing Profile at fingertips.phe.org.uk
28JSNA 2020
STARTING AND DEVELOPING WELL
CHILD AND MATERNAL HEALTH
This section has 3 different measures. Firstly, Smoking at time of delivery: smoking during pregnancy has significant well known detrimental
effects for the growth of the baby and health of the mother. Secondly, Breastfeeding prevalence: breast milk provides the ideal nutrition for
infants in the first stages of life. Thirdly, Hospital admissions for dental caries (tooth decay) which shows not only an indicative rate of tooth
decay but also may indicate issues with accessing high street dental services.
Figure 30 Figure 31 Figure 32: Hospital admissions for dental caries
Percentage of women smoking at time of Breastfeeding prevalence at 6-8 weeks per 100,000 population – 0 to 17 years (2016/17 to
delivery after birth (2018/19) 2018/19)
Source: Public Health Outcomes Framework Source: Public Health Outcomes Framework Source: Public Health Outcomes Framework
Hospital admissions for dental caries (tooth decay)
in Torbay have been consistently more than
double the English average (Figure 32).
Extractions with High Street dentists in Torbay are
Torbay has consistently had significantly Within Torbay, the percentage of similar to English levels although not all these
higher smoking at time of delivery rates women breastfeeding 48 hours after extractions will be due to caries. The consistently
than England throughout the decade delivery is approximately 72%, this is high rates of hospital admissions for dental caries
although the gap has closed (Figure 30). below the national rate of 74.5%. The could indicate an issue with children not accessing
prevalence of breastfeeding 6 to 8 high street dental services or being unable to
weeks after birth during 2018/19 was access them quickly when emergencies arise.
41.7%, this is below national and
regional rates (Figure 31). In the latest 2016/17 oral health survey of 5 year
old children by the Dental Public Health
Epidemiology Programme for England, one in
three 5 year olds in Torbay had experience of
visually obvious dental decay.
For more information, visit the Child and Maternal Health Profile at fingertips.phe.org.uk
29JSNA 2020
STARTING AND DEVELOPING WELL
EDUCATION
Education is a key determinant of a child’s future life, a good education increases the likelihood of higher earnings, better housing and material
resources. These are related to better health outcomes.
Figure 33 Figure 34 Figure 35
EYFS (16/17 to 18/19), Key Stage 2 (16/17 Pupil Absence 16 and 17 year olds not in education,
to 17/18) and GCSEs (17/18) Source: Public Health Outcomes Framework employment or training – 2018/19
Source: Public Health Outcomes Framework Source: Public Health Outcomes Framework
The percentage of children achieving a Significant levels of pupil absence can Young people who are not in education,
good level of development at the end of have a substantial effect on the level of employment or training (NEET) are at
reception is similar in Torbay to regional education received and their subsequent greater risk of poor health, depression or
and national levels. This is also the case educational attainment levels. early parenthood. It is required that all
with Key Stage 2 pupils meeting the Absenteeism from schools (Year 1 to young people remain in education or
expected standard in reading, writing and Year 11) has generally been higher within training until the end of the academic
maths. In relation to Average Attainment Torbay than national and regional rates year in which they turn 17. 160 (6.1%) of
8 scores based on the local authority of (Figure 34). 16 to 17 year olds were classified as
pupil residence, Torbay was significantly NEET in Torbay for 2018/19, this is in line
lower than regional and national with regional and national figures (Figure
averages (Figure 33). 35).
For more information, visit www.gov.uk/government/organisations/department-for-education/about/statistics
30JSNA 2020
STARTING AND DEVELOPING WELL
SOCIAL CARE
Social Services come into contact with the most vulnerable children in our society. The most serious cases are ‘Looked After Children’
(Children in care) who are in the care of the local authority, these children may be living with foster parents, in residential children’s homes or in
residential schools/secure units. The level below this is when a child protection plan is drawn up by the local authority. It sets out how the child
can be kept safe, how things can be made better for the family and what support they will need. Finally, below a child protection plan is a ‘Child
in Need’ who has been referred to children’s social care services, and who been assessed to be in need of social care services.
The Children’s Comparator group relates to 10 local
Figure 36 authorities with similar characteristics to Torbay.
Rate of children in
care per 10,000 Rates of Children in Care within Torbay have
children at 31 March increased by approximately 65% when comparing
(0 to 17 years) 2011 to 2019. This compares to 34% for the
Source: Department for
Education – Statistics: looked
Children’s social care comparator group of 10 local
after children authorities with similar characteristics to Torbay, 14%
for the South West and 10% for England (Figure 36).
Figure 37: Rate of Figure 38: Rate of
children on child children in need per
protection plans per 10,000 children at 31
10,000 children at 31 March (2017 to 2019)
March (2017 to 2019) Source: Department for
Source: Department for Education – Statistics: children
Education – Statistics: children in need and child protection
in need and child protection
Over the last three years, on 31 March, Torbay has had a Over the last three years, on 31 March, Torbay has had a
statistically higher rate than its children’s social care comparator statistically higher rate of Children in Need than its children’s social
group, South West region and England (Figure 37). care comparator group, South West region and England (Figure 38).
For more information, visit www.gov.uk/government/collections/statistics-looked-after-children
31JSNA 2020
STARTING AND DEVELOPING WELL
Starting and developing well summary profile (Sources in Appendix)
Children's RAG Rating
comparator compared
Indicator Measure Torbay group South West England to England
DEMOGRAPHY
Birth rate (2018) Rate 60.9 59.0 56.3 59.2
Infant mortality (2015 - 17) Rate 3.2 3.7 3.3 3.9
BABIES
Smoking at time of delivery (2018/19) % 13.3% 15.7% 10.9% 10.6%
Breastfeeding initiation (2016/17) % 72.0% 66.1% 79.5% 74.5%
Breastfeeding prevalence (2018/19) % 41.7% 37.3% 51.4% 46.2%
YOUNGER CHILDREN
MMR vaccination rates (2018/19) % 93.3% 90.6% 90.7% 86.4%
5 year olds with one or more decayed,
missing or filled teeth (2016/17)
% 34.7% 23.2% 20.2% 23.3%
EYFS - Good level of development (2018/19) % 70.8% 70.8% 72.0% 71.8%
EYFS - Good level of development of those
with Free School Meal status (2018/19)
% 53.3% 55.5% 53.0% 56.5%
Classified as overweight or obese
(Reception) (2018/19)
% 25.1% 24.7% 22.0% 22.6%
Classified as overweight or obese (Year 6)
(2018/19)
% 35.2% 34.6% 29.9% 34.3%
Key Stage 2 pupils meeting the expected
standard in reading, writing & maths (2018)
% 62.7% 63.4% 62.9% 64.9%
OLDER CHILDREN
Alcohol admissions to hospital (2016/17 -
18/19)
Rate 78.7 38.8 44.0 31.5
Teenage Conceptions (2015 - 2017) Rate 24.8 24.1 15.9 19.1
Chlamydia detection rates (2018) Rate 1692.7 1985.1 1917.7 1974.9
Average Attainment 8 score (GCSEs)
(2017/18)
Score 44.3 44.1 46.7 46.7
Not in employment, education or training
(2018/19)
% 6.1% 5.7% 6.4% 5.5%
ALL CHILDREN
Hospital admissions for unintentional &
deliberate injuries (2016/17 - 2018/19)
Rate 128.6 117.1 114.7 104.9
Children with Special Educational Needs
(2019)
% 17.6% 16.1% 15.5% 14.8%
Children in low income families (2016) % 21.2% 19.1% 14.0% 17.0%
Looked After Children (2019) Rate 142.4 93.0 55.7 65.4
Children in Need (2019) Rate 420 393 323 334
Children with Child Protection Plans (2019) Rate 70 57 42 44
Pupil Absence (2017/18) % 5.1% 5.0% 5.0% 4.8%
Direction of arrow relates to direction of travel since the previous period
Colour of arrow relates to RAG rating relative to England (Red – Significantly worse, Amber – Not
significantly diferent, Green – Significantly better than England, Black – Not compared to England)
32You can also read