CRITICAL TRENDS AFFECTING THE FUTURE OF DENTISTRY: Assessing the Shifting Landscape - American Dental ...
←
→
Page content transcription
If your browser does not render page correctly, please read the page content below
CRITICAL TRENDS AFFECTING
THE FUTURE OF DENTISTRY:
 Assessing the Shifting Landscape

            Prepared for
     American Dental Association

             May 2013

        Joel Diringer, JD, MPH
      Kathy Phipps, MPH, DrPH
          Becca Carsel, MA
Table of Contents Executive Summary..............................................................................................................ii Introduction ........................................................................................................................ 1 Methods .............................................................................................................................. 2 Key Findings ........................................................................................................................ 3 I. People............................................................................................................................. 3 II. Providers ....................................................................................................................... 7 III. Payments .................................................................................................................... 10 IV. Policies ....................................................................................................................... 14 V. Practice Implications ................................................................................................... 16 Conclusion ......................................................................................................................... 18 References ........................................................................................................................ 19 List of Interviewees .......................................................................................................... A‐1 Additional Sources Consulted .......................................................................................... A‐2 May 2013 Page i
EXECUTIVE SUMMARY

Dentistry in the United States is in a period of transformation. The population is aging and
becoming more diverse. The health care delivery system is changing rapidly with the
implementation of the Affordable Care Act. Consumer habits are shifting with Americans
increasingly relying on technology and seeking greater value from their spending. The nature of
oral disease and the financing of dental care are in a state of flux.

To assist the American Dental Association in its strategic planning, Diringer and Associates was
retained in March 2013 to conduct an environmental scan of emerging trends that affect the
future of dentistry. Consisting of a comprehensive literature review and key informant
interviews, the scan found that:

                PEOPLE                                   PROVIDERS

                                  PRACTICE
                                IMPLICATIONS

             PAYMENTS                                       POLICIES

PEOPLE

1. The population is getting older and more diverse, leading to different disease patterns,
   care‐seeking behavior and ability to pay.
2. Consumers are becoming more astute purchasers of health care and seeking value for their
   spending.

PROVIDERS

3. An increasing number of dentists are being trained, but mounting debt load and changing
   demographics are altering the practice choices for new dentists.

May 2013                                                                                      Page ii
4. Pressures are growing for an expanded dental team to provide preventive and restorative
services.
5. Care is being integrated within “patient centered medical homes” in medicine but there has
been slow take up of dental care services.
PAYMENTS
6. Payment for dental services is shifting from commercial dental insurance to public coverage
and personal out of pocket payments.
7. Commercial dental plans are increasingly using more selective networks, demanding
increased accountability through data and performance measures, and pressuring providers
to reduce costs.
POLICIES
8. The Affordable Care Act pediatric dental benefit will provide millions of additional children
with dental coverage through the small group and individual markets and optional Medicaid
expansions.
9. Public programs, with a growing number of participants, will demand increased
accountability from dental providers.
PRACTICE IMPLICATIONS
10. With the increased demand for value in dental care spending, practices will need to become
more efficient.
11. The trend towards larger, multi‐site practices will continue driven by dental plan pressures
for smaller provider networks, practice patterns of new dentists and increased competition
for patients.
12. Health care reform and Medicaid expansions with an increasing emphasis on outcomes and
cost‐effectiveness will encourage alternative models of dental care.
This is a critical moment in dentistry and not a time for complacency. Understanding the key
forces at work will assist the profession in defining its own destiny. Ignoring what is happening
in the health and consumer environments will mean ceding the future of the profession to
others.
By commissioning this report and convening key thought leaders, the ADA has taken on the
challenge of facing the new reality and charting a course for the dental profession and the oral
health of America.
Diringer and Associates is a California based health policy consulting firm founded in 2001. It
has significant experience in oral health, public policy, evaluation and organizational
development.
May 2013 Page iiiCRITICAL TRENDS AFFECTING THE FUTURE OF DENTISTRY:
Assessing the Shifting Landscape
INTRODUCTION
Dentistry in the United States is in a period of transformation. The population is aging and
becoming more diverse. The health care delivery system is changing rapidly with the
implementation of the Affordable Care Act. Consumer habits are shifting with Americans
increasingly relying on technology and seeking greater value from their spending. The nature of
oral disease and the financing of dental care are in a state of flux.
To assist the American Dental Association in its strategic decision making process, Diringer and
Associates was retained in March 2013 to conduct an environmental scan of emerging trends
that affect the future of dentistry.
This report is based on a comprehensive literature review and key informant interviews with
organizations throughout the United States. It synthesizes what we have learned into 12 salient
trends that affect the future of dentistry. Some of the trends are apparent, others are still
emerging. Some of the implications are unknown.
The findings are organized in five key themes to capture the trends in a digestible format. The
five themes, however, are interrelated and should be viewed collectively. The themes are:
People
Providers
Payments
Policies
Practice implications
This is a critical moment in dentistry and not a time for complacency. Understanding the key
forces at work will assist the profession in defining its own destiny. Ignoring what is happening
in the health and consumer environments will mean ceding the future of the profession to
others.
By commissioning this report and convening key thought leaders, the ADA has taken on the
challenge of facing the new reality and charting a course for the dental profession and the oral
health of America.
Diringer and Associates is a California based health policy consulting firm founded in 2001. It
has significant experience in oral health, public policy, evaluation and organizational
development.
May 2013 Page 1METHODS This environmental scan consisted of two components – a literature review and key information interviews. The literature review involved researching existing published and unpublished data, articles and reports that related to our topics of interest: demographics, health reform, consumers, dental expenditures, health innovations, public policies and dental practice. In addition, web searches were conducted to get a general understanding of trends in these areas and to seek out further documents and potential key informants. ADA staff were particularly helpful in identifying existing reports that were useful in the analysis. (A list of sources consulted is contained in the Appendix.) Seventeen key informants were interviewed as part of the environmental scan. These individuals were from throughout the United States and represented health plans, dental plans, dental schools, private practitioners, a health information technology expert, and large dental and health practices. Interviews were primarily conducted by telephone and generally lasted from one‐half to one hour. Interviewees were asked to identify key trends in their fields of expertise, as well as to assist in identifying additional documents and potential interviewees. (A list of key informants is contained in the Appendix.) The key findings that follow are an aggregation of the data derived from the documents and the information gleaned from the interviews. The findings are the opinion of the consultants and not necessarily those of interviewees or the ADA. May 2013 Page 2
KEY FINDINGS
PEOPLE PROVIDERS
PRACTICE
IMPLICATIONS
PAYMENTS POLICIES
I. PEOPLE
1. THE POPULATION IS GETTING OLDER AND MORE DIVERSE, LEADING
TO DIFFERENT DISEASE PATTERNS, CARE‐SEEKING BEHAVIOR AND
ABILITY TO PAY.
AN AGING POPULATION
The U.S. is continuing to have an older and more diverse population. Between 2000 and 2010,
the elderly grew at a rate that far exceeded the overall U.S. population (15% vs. 10%)1 and is
expected to double by 2060 to 92 million persons.2 By 2030, all of the Baby Boomers (born
1946‐1964) will have moved into the ranks of the older population. This will result in a shift in
the age structure of the elderly ages 65 and over, from 13 percent of the population aged 65
and older in 2010 to 19 percent in 2030.3
Unlike prior elderly populations, the Baby Boomers will be more likely to retain their teeth and
remain active consumers of dental care. Payments will increasingly be made out‐of‐pocket,
since they will be less likely to have dental coverage, as Medicare does not cover most dental
services.
Succeeding generations ‐‐ the Gen X’ers (born 1965‐1980) and the Millennials (born 1981‐2000)
will have reduced dental disease and less need for restorative dental care. They are also more
May 2013 Page 3technologically savvy and are more likely to seek lower costs for care. They will have higher
rates of dental coverage than the older population, primarily due to employer supplied
insurance.
Children born 2000 and later will have even less dental disease and less demand for restorative
dental services as they age. Children are the most likely to have dental coverage, primarily due
to public coverage – Medicaid and CHIP ‐‐ and the pediatric dental benefit in the Affordable
Care Act. While they will have less coverage as they reach adulthood, they will probably not
need as much restorative care as previous generations.
United States Population, 2015 United States Population, 2030
100+ 100+
90‐94 90‐94 WWII
WWII
80‐84 80‐84
Baby
70‐74 70‐74 Boomers
Baby
Age Range
Age Range
60‐64 Boomers 60‐64
Gen X
50‐54 50‐54 and
40‐44 40‐44 Millenials
Gen X
and
30‐34 Millenials 30‐34
20‐24 20‐24
10‐14 10‐14
Under 5 Under 5
20 10 0 10 20 20 10 0 10 20
Male Female Male Female
Millions Millions
Source: U.S. Census Bureau, Population Division, Projections of the Population by Age and Sex for the United
States: 2015 to 2060, December 2012
A MORE DIVERSE POPULATION
The ethnic make‐up of the U.S. population will shift dramatically over the coming years
changing the nature of dental consumers. The younger age groups are increasingly more
diverse while the elderly will continue to be primarily non‐Hispanic white.
The Hispanic population is expected to grow faster than any other ethnic group and more than
double, from 53.3 million in 2012 to 128.8 million in 2060. By the end of this period, nearly one
in three U.S. residents would be Hispanic, up from about one in six today.3 The estimated
purchasing power of Hispanics is expected to rise to $1.5 trillion in 2015.4
A recent study by the Hispanic Dental Association in partnership with Proctor and Gamble5
found that Hispanics are less likely to have private dental coverage (45% lack dental coverage)
May 2013 Page 4and are more likely to have public coverage. They are less likely to visit a dentist (18% had not visited a dentist in past two years compared to 12% of the general population). Hispanics also have less health literacy about oral hygiene and prevention. Hispanics also prefer Spanish‐speaking dentists and are more reliant on community dental clinics. About six in 10 Hispanics feel that having Spanish‐speaking and Hispanic dentists/hygienists in their community would help them “a lot” in achieving and maintaining better oral health. While 60 percent of Hispanics say they primarily use, or would use, a private dental office, they lag far behind the general population (83%). The other major ethnic shift taking place is with Asian‐Americans, who have been the largest group of newly arriving immigrants since at least 2009. They now make up nearly six percent of the U.S. population. Asian‐American consumers are generally more affluent, well‐educated, geographically concentrated and technologically savvy when compared with all U.S. adults. Their median annual household income is $66,000 versus $49,800 for the general population; and the percentage with a college degree is 49 percent versus 28 percent.6 Although growth is occurring throughout the nation, almost 40 percent of all Asian‐Americans can be found in three areas – Los Angeles, New York and San Francisco.7 The overall number of Asian‐ Americans is not very large overall and their increase in population will not have a dramatic effect on dentistry. A MORE URBAN POPULATION The overall population is continuing to shift from the northern states to the Sun Belt areas of Florida, Southwest, and West; and from rural areas to more urban and suburban areas. From 2000 to 2010, regional growth was much faster for the South and West (14%) than for the Midwest (4%) and Northeast (3%). Population growth of at least twice the national rate occurred in many metro and micro areas, such as some areas in parts of California, Nevada, Arizona, Texas, Florida, and the Carolinas.8 This shift will have implications for the regional distribution of dentists. CHANGING UTILIZATION OF DENTAL CARE The utilization of dental care is changing. The percentage of adults who visit a dentist has been dropping for the past decade among all income groups, but particularly among poor adults. On the other hand, the 2000s actually saw remarkable gains in the percent of children in the United States who see a dentist, driven in a large part by expansion of public programs.9 The prevalence and severity of dental decay in permanent teeth has declined over the last several decades. In the early 1970s children aged 6‐18 years averaged 4 teeth with decay but by the early 2000s that had decreased to fewer than 2 teeth with decay.10,11 The coming generations of children, especially higher income children, will have fewer decayed teeth and will need less complex restorative dental care as they age. With the changing patterns of dental decay, comes a shift in services from traditional restorative care to cosmetic and preventive services. Because a higher proportion of the population are keeping their teeth as they age, May 2013 Page 5
there may be an increased need for periodontal care; services generally provided by dental hygienists rather than dentists. The changing utilization patterns are predicted to drive down overall dental spending due to the divergent mix of procedures between adults and children.12 2. CONSUMERS ARE BECOMING MORE ASTUTE PURCHASERS OF HEALTH CARE AND SEEKING VALUE FOR THEIR SPENDING. AN EMERGING CONSUMERISM There is a shift among the American population from wanting to be regarded as “patients,” to one in which they view themselves as health care “consumers” with differing behaviors, expectations and needs. A 2012 Deloitte Survey of Health Care Consumers finds indications that “consumers are ready to become more active, informed decision‐makers.”13 According to the Deloitte survey, consumers are ready to customize and shop for insurance to find the best quality and price. This emerging “consumerism” is more salient in the younger populations, who are more apt to prefer “high tech” interactions where they can comparison shop through social media. However, although social media is increasing as a source of referrals, it is not used by a significant portion of the population for that purpose. Furthermore, use of consumer health information technology (HIT) is low, and consumers’ interests in using emergent HIT is also relatively low.14 Older consumers generally prefer “high touch” interactions, which include personal experiences with providers. However, Baby Boomers may become more price‐conscious as they join the ranks of the elderly, with less coverage and more out of pocket costs for their care. Since 57 percent of those who have not visited a dentist in the past year cite lack of insurance and cost of care as the primary reason for not visiting a dentist,15 the Baby Boomers may become more astute shoppers of care and demand more value for the money. MEDICAL TOURISM As the cost of care rises, “medical tourism” is also increasing. Medical tourism is used more often for high cost, non‐reimbursed, and often elective care. Thus it is more sensitive to cost, and to a consumer’s willingness to pay for elective procedures. Consumers are choosing to go abroad to receive higher cost services at less expense in accredited facilities in Mexico, Costa Rica, Eastern Europe and Asia. Over one‐third of Americans (37%) would consider traveling to another country to receive medical or dental care if the cost were significantly lower. The younger populations are more likely (45% of those May 2013 Page 6
under age 35) than older populations (38% ages 35‐49 and 30% ages 50‐64) to travel abroad for care.16 The easiest access to foreign care is in Mexico, where border towns offer much less expensive dental care than in the U.S., but travel abroad for vacation and dental care is attractive to some. II. PROVIDERS 3. AN INCREASING NUMBER OF DENTISTS ARE BEING TRAINED, BUT MOUNTING DEBT LOAD AND CHANGING DEMOGRAPHICS ARE ALTERING THE PRACTICE CHOICES FOR NEW DENTISTS. A SUFFICIENT SUPPLY OF DENTISTS? The current workforce of dentists is aging, with 37 percent of dentists over 55 years of age, and an additional 27 percent between 45 and 55 years.17 As the economy improves, it is anticipated that more dentists will retire and need to be replaced by new practitioners. The dentist workforce is increasing as dental schools graduate more students, and more foreign trained dentists are becoming licensed in the United States. In 2010, a net of 3067 new dentists entered private practice.18 The increase in dentists may meet the continued demand, and perhaps create a surplus, in the private sector. However, there are not likely to be sufficient providers to meet the demand in the growing publicly insured sectors of the population. A recent Association of State and Territorial Dental Directors survey found that in 25 of the 39 states that responded to the survey, fewer than one half of dentists treated any Medicaid recipients in the previous year.19 CHANGING DEMOGRAPHICS AND DEBT OF NEW DENTISTS The changing demographics, growing debt and lifestyle choices of new dentists are all influencing practice choices. New dentists are far more likely to be women, who have different practice patterns than male dentists.17 Thirty eight percent of new professionally active dentists (graduated dental school within past 10 years) are female, compared to 22 percent of all professionally active dentists. Sixty percent of dentists ages 44 or below are women. Women are more likely to practice part‐ time – less than 30 hours a week (20% versus 12% for men). New female active private practitioners are also less likely to be owner dentists (36% of women; 53% of men) and more likely to be associates or employees (41% or women; 28% of men).19 Current dental students are only slightly more likely to be from underrepresented minorities (URM) than in the prior 10 years. The percentage of URM students increased from 11 percent in May 2013 Page 7
2000 to 13 percent in 2011. For Hispanic students, there was an increase from 5 percent in
2000 to 8 percent in 2011.20

The debt load of new dental graduates has grown to an average of approximately $200,000.
More than four of ten (41%) of dental school seniors say that educational debt had a great
influence on their professional choices after graduation. 21 They are more likely to forgo solo
practices for joint, group, or corporate practices. Dentists who have completed their dental
education within the past ten years are three times more likely to be part of a larger company
than those who completed their education more than ten years ago.22

Interviewees also indicated additional factors influencing career choices. A growing number of
couples are entering dentistry with even larger debt burdens making the purchase of a practice
more difficult. On the other hand, the couples can both work part‐time and still have sufficient
family income. Similarly, if dental incomes remain high, new dentists may choose to work
fewer hours and pursue other personal activities.

4.  PRESSURES ARE GROWING FOR AN EXPANDED DENTAL TEAM TO
PROVIDE PREVENTIVE AND RESTORATIVE SERVICES.

As costs rise, as access becomes more difficult for lower income patients, and as payors –
individuals, governments, firms – increasingly demand value for their care dollars, pressures for
less expensive delivery options are becoming more prevalent. These changes include expanding
the role of mid‐level practitioners and the use of tele‐health technologies.

In the medical arena, consumers are becoming more receptive to expanded roles for other
health practitioners as they seek greater value from care ‐‐ 47 percent are willing to see a nurse
practitioner or physician assistant if a physician is not available,13 perhaps indicating a similar
willingness to see other members of a dental team for care. As the need for dental services
shifts more towards preventive services, increasing utilization of mid‐level practitioners for
many procedures may be cost‐effective.

Innovative models such as “telehealth” and “virtual dental homes” can provide for expanded
access to care for lower income and institutionalized populations by connecting mid‐level
dental practitioners with dentists through electronic sharing of information. In the virtual
dental home model, a mid‐level practitioner in a community setting (e.g. school) performs a
visual exam and takes radiographs which the remote dentist reviews and uses to develop a
treatment plan.23 The dentist may then recommend that the mid‐level practitioner administer
the care under his/her remote supervision. This model has the potential for being adopted by
dental plans and practices that have large numbers of underserved patients, particularly as the
trend in dental care is away from more complex restorations to simpler, preventive services.

Pressure is building across the U.S. to expand the roles of mid‐level members of the dental
team such as dental hygienists or dental therapists. Their scope of practice, supervision and
compensation are being hotly debated in several state legislatures and accrediting bodies. The

May 2013                                                                              Page 8
evidence suggests safety is not an issue, but the economic viability is uncertain. With increasing
number of children having dental coverage through Medicaid, CHIP and the Affordable Care
Act, more providers will be necessary to ensure adequate access to preventive and restorative
care. Policymakers are becoming more open to expanded roles for mid‐level practitioners and
legislation is pending in several state legislatures. It is uncertain how this will evolve.

5.   CARE IS BEING INTEGRATED WITHIN “PATIENT CENTERED MEDICAL
HOMES” IN MEDICINE BUT INCLUSION OF DENTAL CARE SERVICES HAS
BEEN SLOW.

A persistent theme in health reform is for the “Triple Aim” of improving the experience of care,
improving the health of populations, and reducing per capita costs of health care. A number of
initiatives call for more integrated care through Accountable Care Organizations (ACO) and
patient centered medical homes (PCMH).

ACOs are pilot projects, initially for Medicare populations, where groups of providers will be
compensated on the basis of patient outcomes, rather than on the quantity of delivered
services. Provider organizations are integrating care on all levels and across disciplines, using
sophisticated metrics to identify effective practices and improved health outcomes. The PCMH
model draws on professionals from all disciplines ‐‐ from surgeons to social workers ‐‐ to
coordinate a full range of care to improve the overall patient’s health.

Given the link between oral health and overall health, the ACOs and PCMH models provide
much promise for integrating dental services into overall health services. However, there is
little evidence to suggest that the integration of dental services is little more than a possibility
at this time. The medical system is focused on issues such as reducing hospital re‐admissions,
high risk case management and avoiding prescription errors. While there is potential to bring
dental practitioners into the health team, it will take time for the medical system to recognize
the need to expand the concept of health and incorporate non‐medical personnel. It will also
require dental professionals to evolve from being dental practitioners to being responsible for
the overall oral health of patients.

One trend in integrating oral health into medical offices is taking place in pediatric offices.
Medicaid and CHIP programs are increasingly reimbursing medical providers for fluoride varnish
and other preventive services. At least 35 state Medicaid programs are paying medical
providers for dental services such as fluoride varnish application, oral risk assessment and
exam, and caretaker education.19

In addition, some health plans are providing additional dental coverage for high risk patients,
particularly when the plan covers both medical and dental services. For example, when
California eliminated the adult dental Medicaid benefit, Health Net added some dental benefits
to their Medicaid health plan in the attempt to reduce their medical costs. Similarly, Aetna has
a Dental‐Medical Integration Program that focuses on members who have not had a recent
dental visit and are pregnant or have diabetes, heart disease and/or cerebrovascular disease. It

May 2013                                                                                Page 9
provides outreach and enhanced dental insurance benefits to these members who are also covered by their health plan.24 Community health centers have been growing their dental practices, but it is unknown how much the dental and medical practices are being integrated. In the four years prior to 2011, the number of dental patients seen in federally qualified health centers grew 44 percent to just over four million patients a year. During the same period, the number of dental visits increased by 49 percent to nearly 10 million a year, and the number of full time equivalent dentists increased by 40 percent to nearly 4000.25 While there has been much discussion in recent years about medical and dental collaboration,26 there is little indication that large private medical practices are adding dental practices. For example, Kaiser Permanente only has dental services in the Pacific Northwest, without plans to expand dentistry to other regions. Their dental services remain largely separate and apart from the medical services, although there is some referral from the dentists to physicians for scheduled screenings and care for medical issues. III. PAYMENTS 6. PAYMENT FOR DENTAL SERVICES IS SHIFTING FROM COMMERCIAL DENTAL INSURANCE TO PUBLIC COVERAGE AND PERSONAL OUT OF POCKET PAYMENTS. EMPLOYER SUPPLIED DENTAL INSURANCE IS HOLDING STEADY BUT RETIREES FACE LESS COVERAGE AND HIGHER OUT OF POCKET PAYMENTS. Health coverage is changing as employers are becoming less likely to provide health insurance, and the public programs provide coverage to more Americans. The percentage of the U.S. nonelderly population with employer supplied insurance (ESI) declined from 70 percent in 1999/2000 to 60 percent in 2010/2011; dependent ESI coverage is also declining, dropping from 35 percent to 31 percent during the same period.27 Although National Association of Dental Plans (NADP) survey data show that fully employer‐ funded dental benefits have increased in the past five years, other indicators show that dental ESI is declining. The 2012 NADP consumer survey shows that 28 percent of dental benefits were funded by employers in 2012, up from 22 percent in 2007. Shared funding for dental plans decreased to 40 percent in 2012, from 45 percent in 2007, but individual purchase of dental benefits increased from eight percent to 12 percent from 2007 to 2012. However, national data from the Medical Expenditures Panel Survey show that the percentage of adults with private dental insurance dropped from 62 percent in 2001 to 56 percent in 2010. May 2013 Page 10
There are significant variations among population groups. As the Baby Boomers retire, they will
lose ESI and need to pay out of pocket for care or obtain alternative coverage such as through a
Medicare Advantage plan. While only one‐third of non‐elderly adults had no dental coverage in
2010, two‐thirds (66%) of adults 65 and over had no dental coverage. Eighteen percent of
children less than 21 years of age percent had no dental coverage.28

Out of pocket payments are a very important component of spending on dental care
constituting 42 percent of dental expenditures, compared to 11 percent of health
expenditures.12

For the population as a whole, these out of pocket costs have remained constant in national
dental expenditures or are dropping slightly. However, out of pocket payments are increasing
for the elderly population. From 2000 to 2010, adjusted per‐patient dental expenditure
increased among adults, especially among the elderly and higher income adults. The highest
increase in expenditures was among the uninsured elderly. Among younger populations, ages
21‐64, spending on dental care has increased much more slowly, and among children per capita
spending has been flat.29

May 2013                                                                          Page 11
GOVERNMENT SPENDING ON DENTAL CARE HAS INCREASED WITH OVER FOUR IN TEN U.S. CHILDREN HAVING PUBLIC DENTAL COVERAGE. Government spending on dental care has doubled from four percent to eight percent of total dental expenditures from 2000 to 2011.30 This funding is primarily for lower income populations, particularly children. More than four in ten U.S. children (44%) are now enrolled in public coverage (Medicaid and CHIP), with 33.8 million children on Medicaid and CHIP29 out of 76.7 million children.30 The number of children with publicly subsidized dental coverage is expected to increase even further with the implementation of the Affordable Care Act pediatric oral health essential benefit and government subsidies for that coverage. May 2013 Page 12
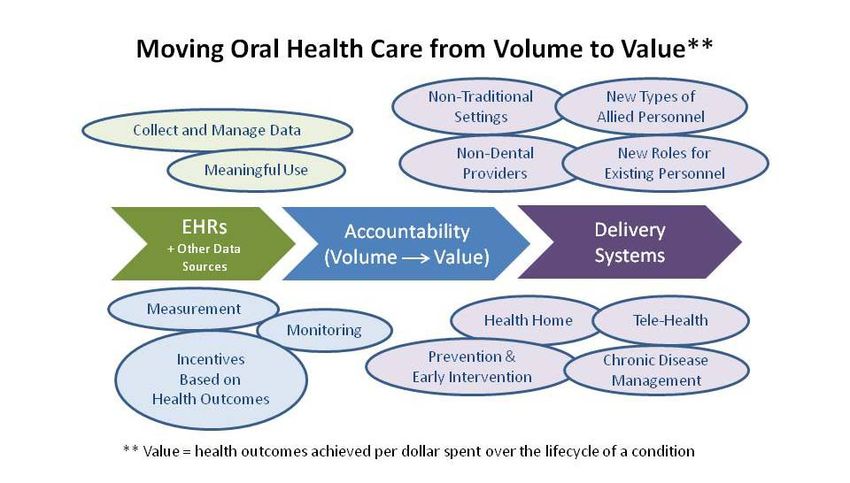
While public coverage for children is increasing, coverage for adults is decreasing due to the
elimination of adult dental Medicaid benefits in many states. Medicare has never provided
comprehensive dental benefits, and it is an optional benefit for state Medicaid plans. In 2010,
22 states provided no adult Medicaid dental benefits, and since that time additional states have
severely curtailed their dental benefits. 19

As noted above, dental services provided at federally qualified health centers has increased by
over 40 percent over the past four years, but private practitioners remain the dominant
providers of dental care for public programs.

7.   COMMERCIAL DENTAL PLANS ARE INCREASINGLY USING MORE
SELECTIVE NETWORKS, DEMANDING INCREASED ACCOUNTABILITY
THROUGH DATA AND PERFORMANCE MEASURES, AND PRESSURING
PROVIDERS TO REDUCE COSTS.

Nearly half (49%) of the 2011 U.S. national dental expenditure of $108 billion was from private
insurance.12 This percentage has remained relatively constant over the past decade, but the
type of plans has changed.

Dental preferred provider plans (DPPP) are increasing in popularity. In the five years from 2007
to 2012, the percentage of covered individuals in preferred provider plans increased from 47
percent to 55 percent, while those in dental health maintenance plans fell by eight percent to
12 percent of covered consumers; the percentage with dental indemnity plans dropped four
percent to include 11 percent of covered individuals. Consumers aged 25‐64 are much more
likely to have a preferred provider plan, while seniors are more likely to have indemnity,
discount dental and direct reimbursement plans.15

Interviews with dental plans showed a trend toward cost containment through smaller provider
networks and diminished reimbursement with increased accountability through metrics on
utilization, provider profiling and cost controls.

Dental plans lag behind medical plans in the push to focus on outcomes rather than services –
moving from “volume to value.” More experimentation can be expected in the public programs,
which have larger populations that are stable over a longer period of time and for which there
is great pressure on cost constraint.

May 2013                                                                           Page 13
IV. POLICIES

8.  THE AFFORDABLE CARE ACT PEDIATRIC DENTAL BENEFIT WILL
PROVIDE AN MILLIONS OF ADDITIONAL CHILDREN WITH DENTAL
COVERAGE THROUGH THE SMALL GROUP AND INDIVIDUAL MARKETS
AND OPTIONAL MEDICAID EXPANSIONS.

The Affordable Care Act established pediatric dental care as an essential health benefit in the
individual and small group market, with approximately three million children possibly obtaining
dental coverage through the new Marketplaces (a 5% increase) plus an unknown number in the
private market. The Marketplaces in over half the states (26) will be operated by the federal
government, while seven states are projected to have joint federal‐state Marketplaces and 17
will have state‐run Marketplaces. The scope of the pediatric dental benefits as well as the cost
sharing may differ from state to state.

Adult dental benefits are not part of required packages, and pediatric dental benefits are not
mandated in the large employer market. As the regulations are evolving, it appears that
although plans must include pediatric dental benefits in the plan design, consumers will not be
required to purchase them in order to obtain health coverage, although some of the state
Marketplaces may make it mandatory. The “individual mandate” penalty will not be triggered
by a failure to obtain pediatric dental coverage.

There are many unknowns in the effects of the ACA. It is difficult to predict how many will
enroll in coverage and what their risk profile will be, what the pent‐up demand will be, and
what the effect on the purchase of adult dental coverage will be. The elimination of annual and
lifetime coverage caps will dramatically change the nature of dental coverage in these markets.
Additional requirements for consumer out of pocket caps (deductibles and co‐pays) may differ
from state to state.

Health plans in the small group/individual markets are slowly realizing that they will need to
offer pediatric dental coverage, or ensure that it is available through a stand‐alone dental plan.
Although the ACA requires that health plans provide for pediatric dental care as an essential
health benefit, there does not appear to be a trend to health insurers combining dental and
medical services. For those health plans that do provide dental benefits, the services may be
through very limited provider panels.

May 2013                                                                            Page 14
9.  PUBLIC PROGRAMS, WITH INCREASED PARTICIPANTS, WILL
DEMAND INCREASED ACCOUNTABILITY FROM DENTAL PROVIDERS.

Source: Glassman, P. Oral Health Quality Improvement in the Era of Accountability, 2011

Public programs (Medicaid and CHIP), with their increased spending on dental coverage and
emphasis on cost‐savings, are likely to drive the increased demand for accountability and health
outcomes.

Despite low Medicaid participation rates of private practice dentists, a recent report found that
over half of children with Medicaid coverage are treated by private practitioners (34% of
Medicaid recipients are seen by private general dentists and 19% by private pediatric dentists).
Twenty‐one percent are served by dental management companies, 10 percent by safety net
clinics, and four percent by dental trainees. The type of provider for the remaining 19 percent
of Medicaid recipients is unknown.31

The use of managed care by Medicaid dental plans is predicted to grow, with at least 21 states
using managed care to deliver dental services.19

With large and more stable populations of covered patients, the state Medicaid plans are in a
position to experiment with cost‐control measures that focus on oral health outcomes, rather
than payment for individual procedures. Some of the approaches being tried by Medicaid
programs are: adjusting the scope and frequency of covered services based on individual risk,
e.g. CAMBRA; reimbursement based on oral health outcomes; and additional compensation for

May 2013                                                                                  Page 15
early preventive services. Provider profiling, which provides incentives for providers who
emphasize preventive services is another method of promoting cost‐effective care.

Oregon has developed Coordinated Care Organizations (CCO) for its Medicaid population, as
part of its Integrated and Coordinated Care Health Delivery System. CCOs are required to
integrate medical, mental health and dental plans by July 2017. As an interim step, CCOs are
required to develop a contractual relationship with all Medicaid dental managed care plans in
the region by 2014. Oregon plans to expand the CCO concept to state employees and the state
Marketplace under a new federal innovation grant.

Metrics are key to implementing alternate payment structures. There will be a continued drive
for dental diagnostic codes to monitor efficacy and quality of treatments and track population
health and disparities. The adoption of electronic dental records will also enhance the ability to
track the necessary metrics. Implementation of these processes will be more practical in larger
practices that cover more consumers over a longer period of time.

While the federal government has been promoting the “meaningful use” of electronic health
records, including electronic dental records, integration of dental with medical records has
been limited. There are few products on the market that integrate medical and dental records,
and the Federal “meaningful use” subsidies are limited to Medicare providers and larger
Medicaid providers. Joining medical and dental records has the most opportunity for adoption
in large systems where both dental and medical care are provided (Veteran’s Administration,
Indian Health Service, Kaiser), or where dental and medical plans are bundled.

V. PRACTICE IMPLICATIONS

The current state of dental practice is one in which most dentists are in private practice in their
own offices. Of the approximate 190,000 practicing dentists in the United States, 92 percent are
in private practice; more than 80 percent of active private practitioner dentists in the United
States are practice owners.17 In the coming years, the solo practice will become less dominant
as more cost‐efficient, larger practices predominate.

10. WITH THE INCREASED DEMAND FOR VALUE IN DENTAL CARE
SPENDING PRACTICES WILL NEED TO BECOME MORE EFFICIENT.

The demand by purchasers to demonstrate value will increase costs of practice (e.g. upgraded
technology) with decreasing reimbursements. The need for practice efficiencies and economies
of scale will demand efficiencies in practices. With increased pressure from dental plans,
practices will need to incorporate new data systems that can track outcome metrics as well as
integrate with health records. Individual consumers with increasing out‐of‐pocket dental
expenses will seek value and become more cost‐conscious.

May 2013                                                                            Page 16
11. THE TREND TOWARDS LARGER, MULTI‐SITE PRACTICES WILL
CONTINUE, DRIVEN BY PLAN PRESSURES FOR SMALLER PROVIDER
NETWORKS, PRACTICE PATTERNS OF NEW DENTISTS AND INCREASED
COMPETITION FOR PATIENTS.

Third party payors are seeking to contract with a limited group of practices to reduce
administrative costs and drive down reimbursements. The increased presence of government
payors will further drive down reimbursements and demand efficiencies. Dental plans are
trending toward increased accountability through intensive measuring of outcomes and
effectiveness.

While alternate practice models such as corporate practices or dental management services
organizations are growing at a slow rate, they are predicted to experience continued growth.
Multi‐location practices are receiving an increasing percentage of dental receipts and new
dentists are more receptive to working in these practices.

The number of multi‐unit dental firms with 10 or more locations grew fivefold between 1992
and 2007, as the number of dental establishments that they operate rose from 157 to 3009.
They are now taking a greater percentage of total receipts ‐‐ from eight percent in 1992 to 11
percent in 2007.22 The percentage of dentists who are associated with multi‐site practices
increased from five percent in 2008 to six percent in 2010. These practices are primarily
concentrated in the South Atlantic area, on the Pacific Coast, and in the East North Central area,
with the smallest concentrations in the East South Central area and New England.

For a number of reasons new dentists are three times more likely than older dentists to be
employed in a multi‐site practice.22 Mounting dental school debt makes it more difficult for new
graduates to purchase practices. Lifestyle choices are also a factor in choosing to work in a large
practice. As the increasing number of women entering dentistry attempt to balance family and
professional lives, they will be more open to practices other than solo practice.

Competition for patients will grow as practices seek to attract and retain a higher volume of
patients due to decreased demand for restorative dental care among younger populations. The
increased competition (domestic and foreign) for non‐reimbursable services (e.g. implants,
cosmetic dentistry) will necessitate efficiencies of a larger practice.

Should the efforts to expand the scope of practice of mid‐level practitioners succeed, they are
more likely to be employed in a large group practice where an administrative infrastructure
exists and costs and supervision can be shared among several practitioners.

May 2013                                                                            Page 17
12. HEALTH CARE REFORM AND MEDICAID EXPANSIONS WITH AN
INCREASING EMPHASIS ON OUTCOMES AND COST‐EFFECTIVENESS WILL
ENCOURAGE ALTERNATIVE MODELS OF DENTAL CARE.

Public program investment in children’s dental care is increasing. Not only have there been
expansions through Medicaid and the Children’s Health Insurance Program, but the Affordable
Care Act will be providing substantial subsidies for pediatric dental coverage. Practices that
concentrate on children with Medicaid coverage – both for profit and nonprofit – are growing.
A number of models exist such as dental service organizations, corporate owned practices and
hybrids. These models provide care for much lower costs for Medicaid patients, although there
is much controversy about quality and appropriateness of care.

Dental service organizations, such as Kool Smiles, handle marketing, human resource support,
accounting and billing while spreading costs across several practices. They have grown
considerably and number 3,500 today.32

Another model which operates similar to a hospital, employs non‐dentists to manage the
practice while employee dentists control the clinical side. The nonprofit Sarrell Dental in
Alabama has 14 centers and caters to consumers through expanded office hours, acceptance of
Medicaid, and child friendly centers. State laws vary on allowing these types of practices.

The larger practices handle large volumes of patients and can demonstrate efficiency and
improved outcomes – metrics that are increasingly important to public payors. As Accountable
Care Organizations mature under health reform they will begin to seek the inclusion of oral
health and seek the same measures of outcomes, quality and efficiency. Controversy will
continue about the scale of these practices, the influence of equity ownership, and the quality
of care. However, the large practices are likely to grow as the demands for the Triple Aim –
improved experience of care, improved population health, and reduced per capita costs – take
hold on the medical side and are translated to dental care.

                                        CONCLUSION

Many challenges are confronting dentistry and the status quo is unsustainable. The changing
nature of dental consumers and their providers, along with altering patterns of demographics
and government policies, will have significant effects on dental practice in the United States.

This is a critical moment for the profession. Changes in medical practice and the health
coverage system are harbingers of forthcoming changes in dentistry. Since many of the changes
have been slow in coming to dentistry, the profession has an opportunity to proactively chart a
course to influence their directions. To ignore the shifting landscape is to lose control and allow
others determine the future of dentistry.

May 2013                                                                            Page 18
REFERENCES 1 Werner C. The Older Population: 2010, 2010 Census briefs. 2011 Nov. Available at http://www.census.gov/prod/cen2010/briefs/c2010br‐09.pdf 2 U.S. Census Bureau. U.S. Census Bureau projections show a slower growing, older, more diverse nation a half century from now. 2012 Dec 12 [cited 2013 Apr 1]. Available at https://www.census.gov/newsroom/releases/archives/population/cb12‐243.html 3 Vincent G, Velkoff V. THE NEXT FOUR DECADES: The older population in the United States: 2010 to 2050, population estimates and projections. 2010 May. 4 AHAA Hispanic Fast Facts [Internet]. American Hispanic Advertising Association [cited 2013 Mar 8]. Available at http://ahaa.org/default.asp?contentID=161 5 Procter & Gamble. Mini‐Report: Hispanics Open Up About Oral Health Care: A Collaboration Between the Hispanic Dental Association (HDA), Crest® and Oral‐B®. Nov 2011. Procter & Gamble. Available at http://www.crestcomplete.com/study 6 Pew Research Center. The rise of Asian Americans. Updated 2013 Apr 4. Available at http://www.pewsocialtrends.org/files/2013/04/Asian‐Americans‐new‐full‐report‐04‐2013.pdf 7 The Nielsen Company. State of the Asian American consumer: growing market, growing impact, Quarter 3, 2012. Available at: http://www.nielsen.com/content/dam/corporate/us/en/microsites/publicaffairs/StateoftheAsianAmericanConsu merReport.pdf 8 Mackun P, Wilson S. Population distribution and change: 2000 to 2010, 2010 Census briefs. 2011 Mar. 9 Vujicic M, Nasseh K, Wall T. Dental care utilization declined for adults, increased for children during the past decade in the United States. Health Policy Resources Center Research Brief. American Dental Association. 2013 Feb. 10 Brown LJ, Wall TP, Lazar V. Trends in total caries experience: permanent and primary teeth. J Am Dent Assoc 2000; 131(2): 223‐231. 11 U.S. Department of Health and Human Services. Dental, Oral and Craniofacial Data Resource Center [Internet]. Atlanta, GA and Bethesda, MD: Mean number of decayed, missing and filled permanent teeth among youth aged 6‐18 years – National Health and Nutrition Examination Survey, 1999‐2004. Available at http//drc.hhs.gov/report/ 12 Vujicic M. National dental expenditure flat since 2008, began to slow in 2002. Health Policy Resources Center Research Brief. American Dental Association. 2013 Mar. Available at http://www.ada.org/sections/professionalResources/pdfs/HPRCBrief_0313_1.pdf 13 Keckley P, Coughlin S. Issue Brief: 2012 Survey of U.S. health care consumers: The performance of the health care system and health care reform. Deloitte Center for Health Solutions, Deloitte Development LLC. 2012. 14 Pew Internet: Health [Internet]. Pew Research Center’s Internet and American Life Project [updated 2013 Feb 20, cited 2013 Apr 4]. Available at http://www.pewinternet.org/Commentary/2011/November/Pew‐Internet‐ Health.aspx 15 National Association of Dental Plans. NADP 2012 consumer survey: dental health and health care reform. 2012. National Association of Dental Plans. 16 Ipsos. Global attitudes toward medical tourism, Ipsos Global @dvisor syndicate study. May 2012. Ipsos. Available at http://www.ipsos‐na.com/download/pr.aspx?id=12184 17 American Dental Association. Distribution of dentists in the United States, by region and state, 2009. American Dental Association. 2011 Apr. 18 American Dental Association. Dentist supply in the U.S.: 1991‐2010. Draft data from American Dental Association Health Policy Resources Center. May 2013 Page 19
19
   Wall TP. Dental Medicaid – 2012. Dental Health Policy Analysis Services. Chicago: American Dental Association
Health Policy Resources Center. 2012.
20
    American Dental Education Association. ADEA survey of U.S. dental school applicants and enrollees, 2010
entering class. Available at
http://www.adea.org/publications/library/ADEAsurveysreports/Pages/ADEASurveyofUSDentalSchoolApplicantsan
dEnrollees20102011.aspx
21
    American Dental Education Association. ADEA survey of dental school seniors, 2011 graduating class. Available
at http://www.adea.org/publications/library/ADEAsurveysreports/Pages/ADEASurveyofDentalSchoolSeniors
2011GraduatingClass.aspx
22
    Guay A, Wall T, Petersen B, Lazar V. Evolving trends in size and structure of group dental practices in the United
States. J Dental Ed. 2012 Aug; 76(8): 1036‐1044.
23
   Glassman P, Harrington M, Namakian M, Subar P. The virtual dental home: bringing oral health to vulnerable
and underserved populations. CDA J 2012; 40(7): 569‐577.
24
   Aetna Dental‐Medical Integration Program [Internet]. Aetna Inc [cited 2013 Mar 12]. Available at
http://www.aetna.com/plans‐services‐health‐insurance/detail/dental‐insurance/dental‐medical‐integration.html
25
   U.S. Health Resources Services Administration, Bureau of Primary Health Care. Health Resources and Services
Administration national data [Internet, cited 2013 Mar 12]. Available at:
http://bphc.hrsa.gov/healthcenterdatastatistics/nationaldata/index.html
26
   See, e.g., U.S. National Oral Health Alliance, Summary of first leadership colloquium on medical and dental
collaboration. 2011 Nov. Available at
http://www.usalliancefororalhealth.org/sites/default/files/static/First%20Leadership%20Colloquium%20Summary
%20‐%20US%20National%20Oral%20Health%20Alliance.pdf
27
   State Health Access Data Assistance Center. State‐level trends in employer‐sponsored health insurance. SHADAC
Report. Minneapolis, MN: University of Minnesota. 2013.
28
   Wall T, Nasseh K, Vujicic M. Per‐patient dental expenditures rising, driven by Baby Boomers. Health Policy
Resources Center Research Brief. American Dental Association. Mar 2013. Available at:
http://www.ada.org/sections/professionalResources/pdfs/HPRCBrief_0313_2.pdf
29
   CMS Fast Facts Overview [Internet]. Centers for Medicare & Medicaid Services [cited 2013 Mar 8]. Available at
http://www.cms.gov/Research‐Statistics‐Data‐and‐Systems/Statistics‐Trends‐and‐Reports/CMS‐Fast‐
Facts/index.html
30
   ChildStats.gov. POP1 child population: number of children (in millions) ages 0‐17 by age, 1950‐2011 and
projected 2012‐2050 [Internet]. Federal Interagency Forum on Child and Family Statistics [cited 2013 Mar 14].
Available at http://www.childstats.gov/americaschildren/tables/pop1.asp
31
   Edelstein B. Issue Brief: Dental visits for Medicaid children: analysis and policy recommendations. Children’s
Dental Health Project. 2012 Jun.
32
   Sally Pipes. Op/Ed: A private sector healthcare solution that we can smile about. Forbes [Internet]. 2012 Oct 15
[cited 2013 Mar 10]. Available at http://www.forbes.com/sites/sallypipes/2012/10/15/a‐private‐sector‐
healthcare‐solution‐that‐we‐can‐smile‐about/

May 2013                                                                                             Page 20
APPENDICES
LIST OF INTERVIEWEES
Name Title
Organization
1. American Health Information William Rudman, PhD Executive Director
Management Association
(AHIMA) Foundation
2. Arizona School of Dentistry Jack Dillenberg, DDS, MPH Dean
and Oral Health
3. Bedford HealthCare Solutions Allen Finkelstein, DDS Chief Executive Officer
4. Delta Dental of California, New Jeff Album Vice president of Public and
York, Pennsylvania, and Puerto Government Affairs
Rico
5. Delta Dental of Michigan, Ohio, Jed Jacobson, DDS, MS, MPH Senior Vice President and Chief
Indiana, North Carolina Science Officer
6. Den‐Mat Holding (clinical lab) Robert Cartagena Chief Operating Officer
7. Kaiser Permanente Northwest Tracy N. Dannen NW Manager Community
Initiatives, KP Community Benefit
8. Liberty Dental Plan Dave Meadows Senior Vice President,
Government Health Programs
Amir Neshat, DDS President and CEO
9. McKenzie Management Sally McKenzie Chief Executive Officer
10. ODS Companies William Ten Pas, DMD Sr. VP & President ODS
Teri Barichello, DMD Vice President and Chief Dental
Officer
11. Office for Oregon Health Lisa Angus Policy Development Manager
Policy & Research
12. Partners Community Thomas Lee, MD* Chief Executive Officer
HealthCare, Inc.,
Professor of Medicine Harvard University Public Health
Geisinger Health System Board member
Foundation
13. Private practice Lindsey Robinson, DDS Private practice pediatric dentists
14. Sarrell Dental Jeff Parker President and CEO
15. Temple University Kornberg Amid I. Ismail, BDS, MPH, MBA, Dean
School of Dentistry DrPH
16. University of the Pacific Paul Glassman, DDS, MA, MBA Professor of Dental Practice
Arthur A. Dugoni School of Director of Community Oral
Dentistry Health
17. WellPoint Mike Radke Senior Marketing Research
Analyst for Product Development
*email interview
Page A ‐ 1ADDITIONAL SOURCES CONSULTED
1. Abelson, R. The face of future health care. New York Times [Internet]. 2013 Mar 20 [cited 2013 Mar 25].
Available at http://www.nytimes.com/2013/03/21/business/kaiser‐permanente‐is‐seen‐as‐face‐of‐future‐
health‐care.html
2. Achermann G. How will dentistry look in 2020? The Straumann Group. 2012 May 16 [cited 2013 Mar13].
Available at http://www.straumann.com
3. Affordable Dental Tourism [Internet]. Patients Beyond Borders [cited 2013 Mar 11]. Available at
http://www.patientsbeyondborders.com/
4. Anderson D. Below the topline, U.S. Hispanics and acculturation. The Nielsen Company [Internet]. 2009 Nov 2
[cited 2013 Mar 8]. Available at: http://www.nielsen.com/us/en/newswire/2009/u‐s‐hispanics‐and‐
acculturation.html
5. Bueno B. The growing Hispanic population means big business for these 7 sectors [Internet]. IBISWorld. 2011
Sept [cited 2013 Mar 8]. Available at http://www.ibisworld.com/
6. Burns J. Reform forces health insurers to reinvent themselves. Managed Care Mag [Internet] 2012 Apr.
Available at http://www.managedcaremag.com/print/archives/1204/1204.healthplan2020.html
7. Centers for Medicare & Medicaid Services Office of the Actuary. National Health Expenditure Accounts
Projections, 2011‐2021 [cited 2013 Apr 10]. Available at http://www.cms.gov/Research‐Statistics‐Data‐and‐
Systems/Statistics‐Trends‐and‐Reports/NationalHealthExpendData/Downloads/Proj2011PDF.pdf
8. Cheap Dental in Algodones, Mexico [Internet]. Cheap Green RV Living [cited 2013 Mar 11]. Available at
http://cheapgreenrvliving.com/Algodones.html
9. Climo T. If pigs could fly and dental professionals could be turned bad by private equity investment: a
nonsense argument more in tune with lobbying than common sense. www.dentaleconomics.com. 2012;
102(9): 62‐63.
10. Cohn D. Census Bureau lowers U.S. growth forecast, mainly due to reduced immigration and births. Pew
Research Social & Demographic Trends. 2012 Dec 14. Available at
http://www.pewsocialtrends.org/2012/12/14/census‐bureau‐lowers‐u‐s‐growth‐forecast‐mainly‐due‐to‐
reduced‐immigration‐and‐births/
11. Cohn J. The robot will see you now. The Atlantic [Internet] 2013 Mar [cited 2013 Mar 23]. Available at
http://www.theatlantic.com/magazine/archive/2013/03/the‐robot‐will‐see‐you‐now/309216/
12. Dunning M. Worksite health, medical clinics gaining ground with employers: Mercer. Modern Healthcare
[Internet] 2013 Mar 12 [cited 2013 Mar 23]. Available at http://modernhealthcare.com
13. Emanuel E, Liebman J. The end of health insurance companies. New York Times [Internet]. 2012 Jan 30 [cited
2013 Mar 25]. Available at http://opinionator.blogs.nytimes.com/2012/01/30/the‐end‐of‐health‐insurance‐
companies/
14. Friedman J. Is the ADA’s midlevel provider economic analysis fair? DrBicuspid.com [Internet]. 2012 July [cited
2013 Mar 24]. Available at
http://www.drbicuspid.com/index.aspx?sec=sup&sub=hyg&pag=dis&ItemID=311092
15. Fletcher M. Fiscal trouble ahead for most future retirees. Washington Post [Internet]. 2013 Feb 16 [cited 2013
Mar 6]. Available at http://www.washingtonpost.com/business/economy/fiscal‐trouble‐ahead‐for‐most‐
future‐retirees/2013/02/16/ae8c7350‐5905‐11e2‐88d0‐c4cf65c3ad15_story.html
16. Herper M. Forbes healthcare summit: using big data to make patients better. Forbes [Internet]. 2013 Feb 5
[cited 2013 Mar 25]. Available at http://www.forbes.com/sites/matthewherper/2013/02/05/forbes‐
healthcare‐summit‐using‐big‐data‐to‐make‐patients‐better/
17. Institute of Medicine and National Research Council. Improving access to oral health care for vulnerable and
underserved populations. Washington, DC: The National Academies Press. 2011.
18. Keckley P, Copeland B, Rudish R, Hisey T, Snyder G, Blume J, Howard P. 2013: What's around the corner for the
health care industry? Deloitte Center for Health Solutions, Deloitte Development LLC. 2013.
19. Keckley P, Coughlin S. The U.S. health care market: a strategic view of consumer segmentation. Deloitte Center
for Health Solutions, Deloitte Development LLC. 2012.
Page A ‐ 2You can also read